Good morning and welcome to this week’s Flight Path. Let’s take a look at the GoNoGo Asset map below. What a difference a week makes! We see U.S. domestic equities enter a new “Go” trend which only strengthened as the week progressed. Commodities see the “Go” trend persist as well on strong blue bars. The almighty dollar (almighty all year to this point) entered a “NoGo” on strong purple bars. 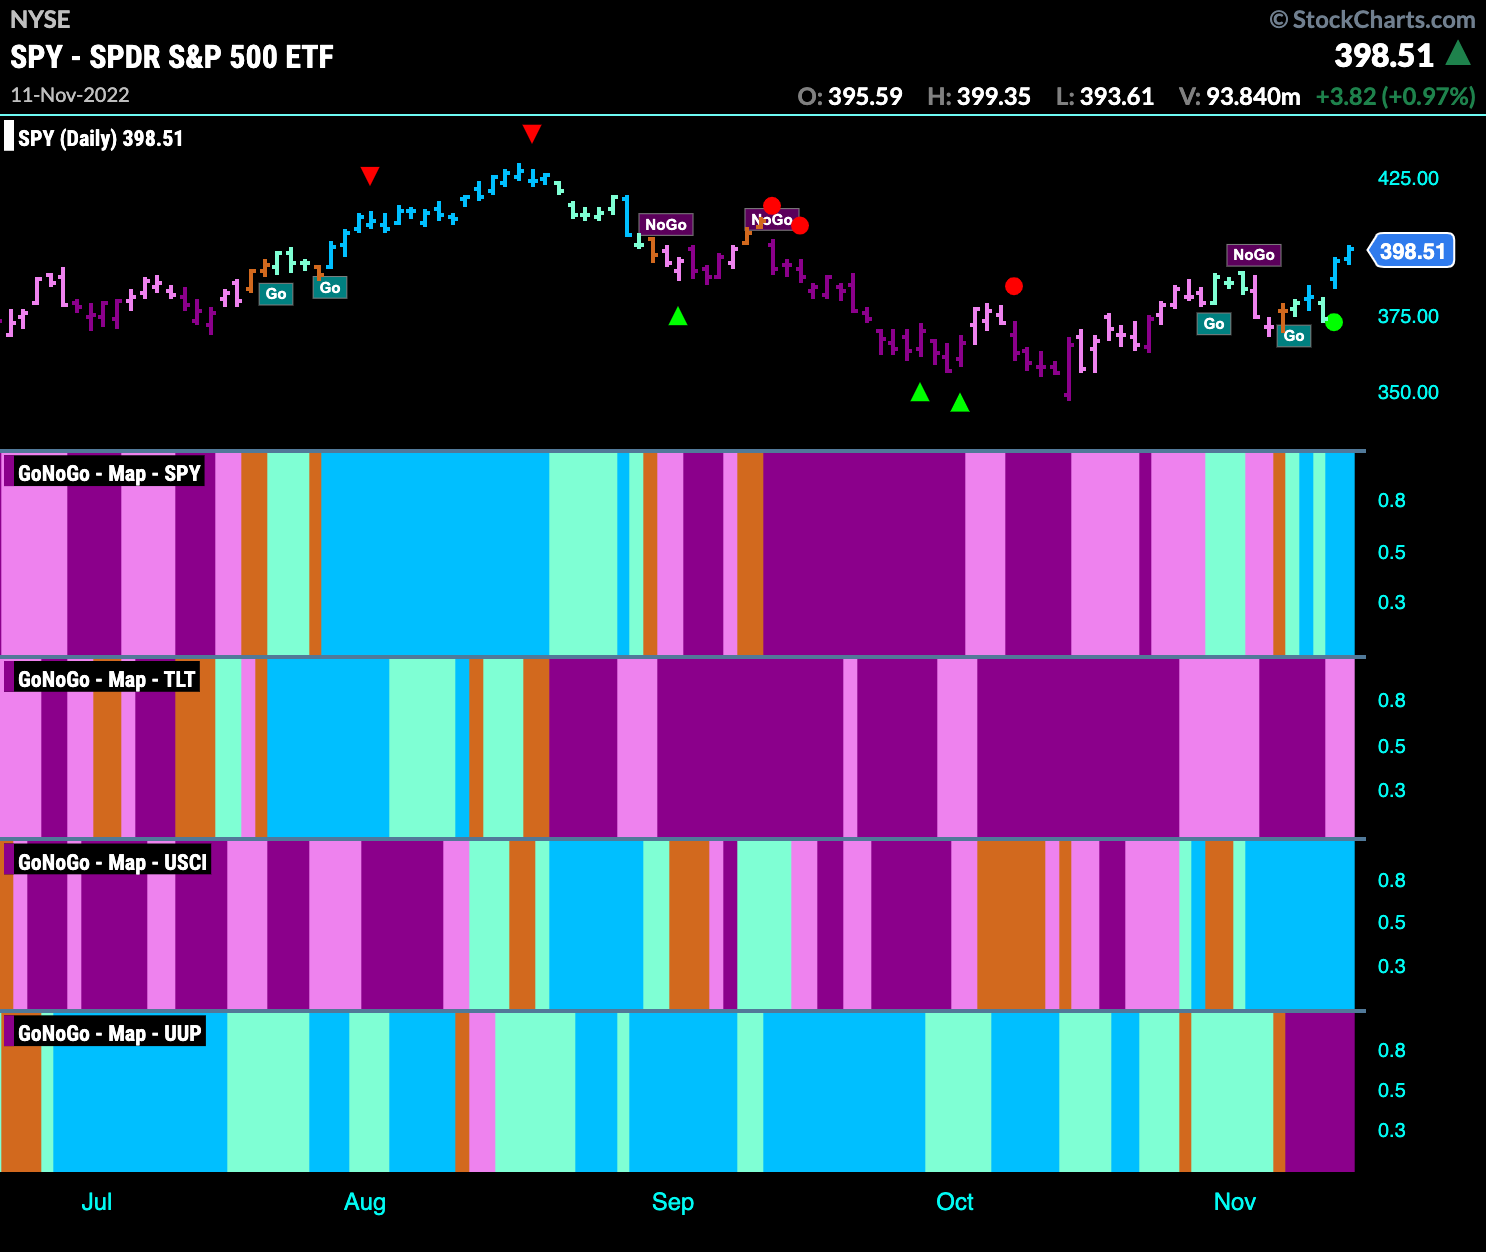
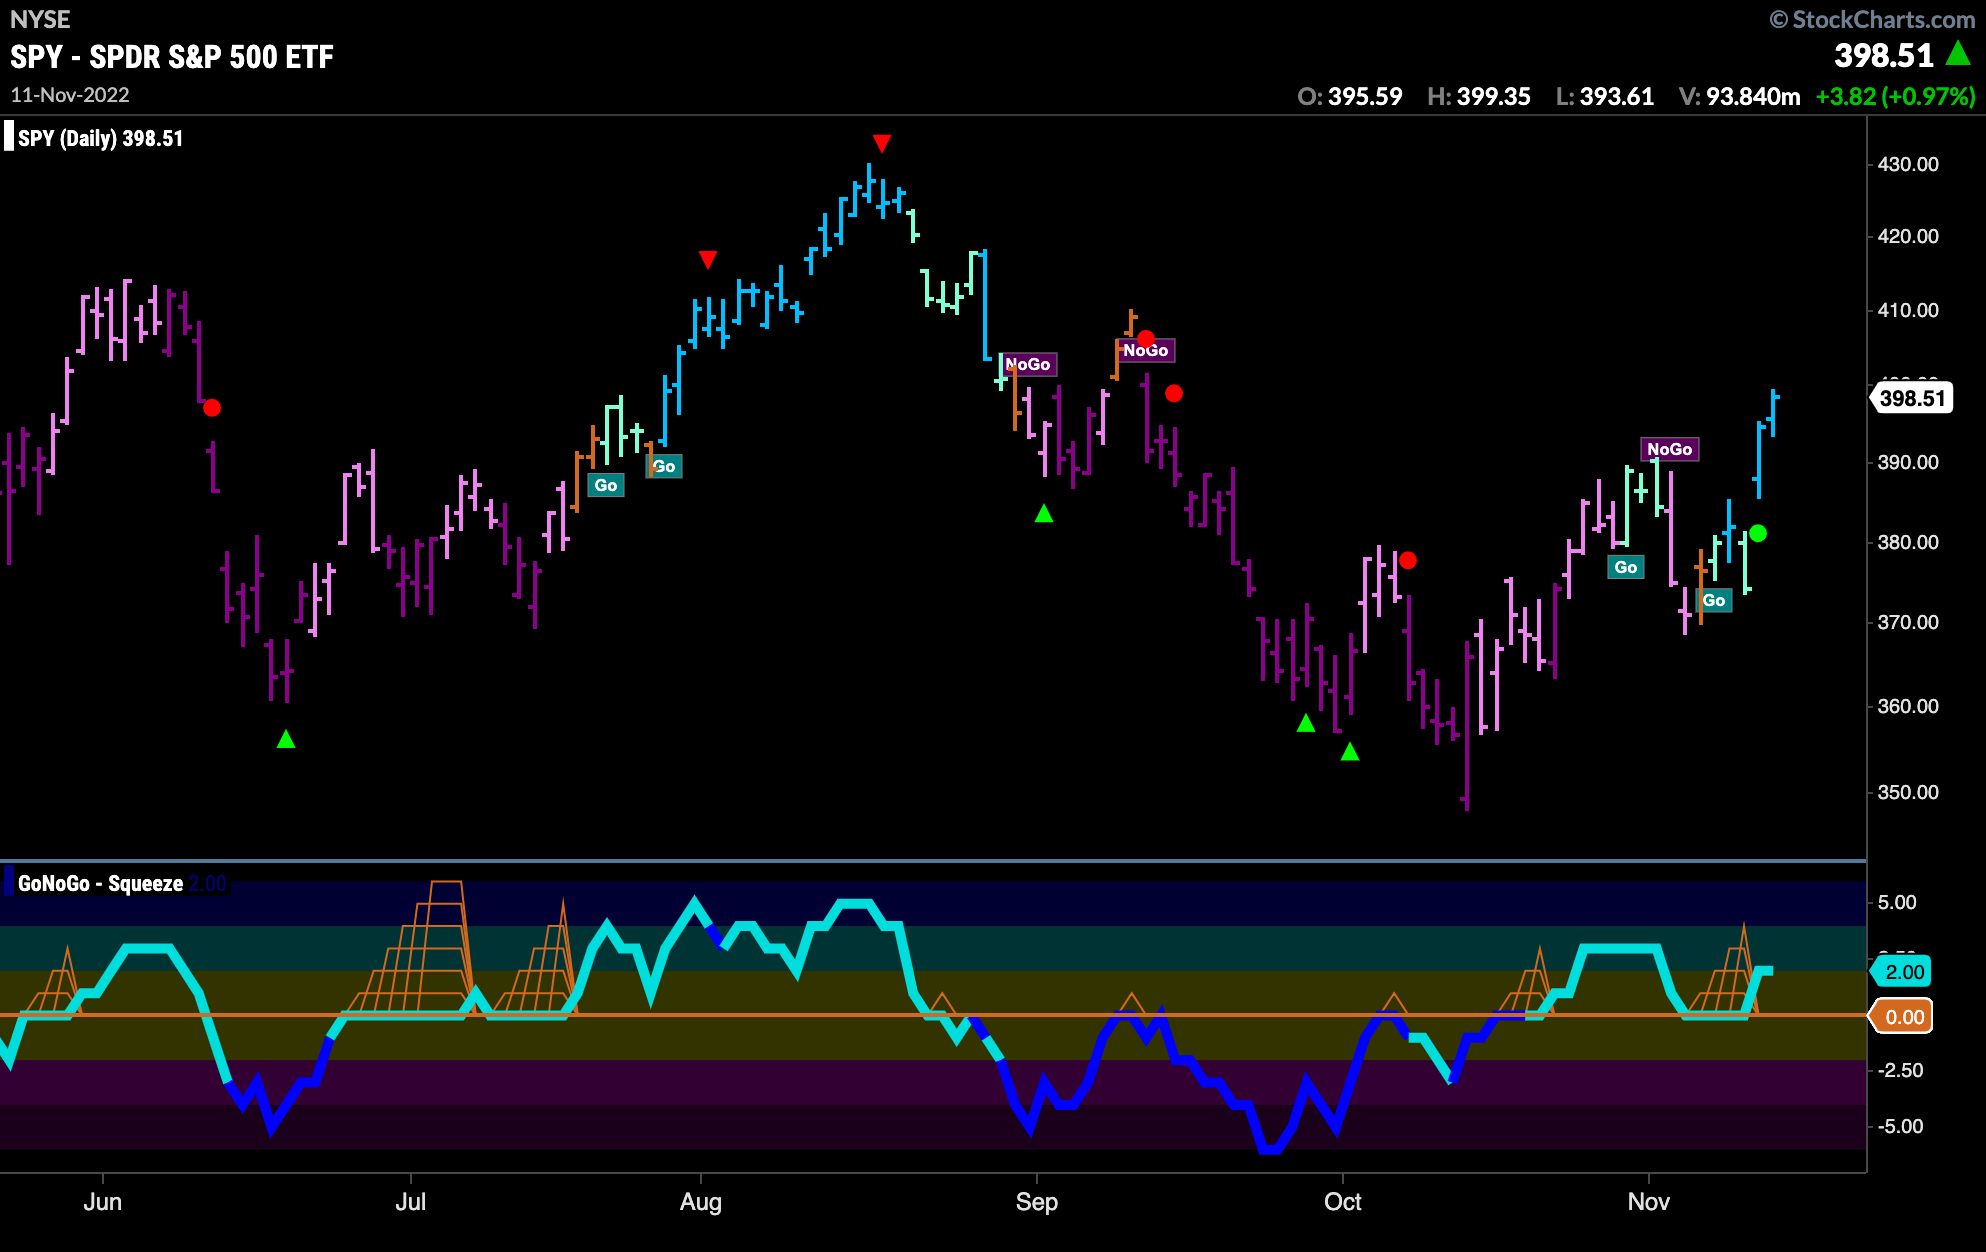
S&P 500 Makes New Intermediate High on Strong “Go” bars
The “Go” trend that tried and failed a couple of weeks ago is back and this week quickly saw price rise high enough to paint strong blue bars. Confirming the move, GoNoGo Oscillator found support at the zero line as a Go Trend Continuation Icon (green circle) appeared under price.
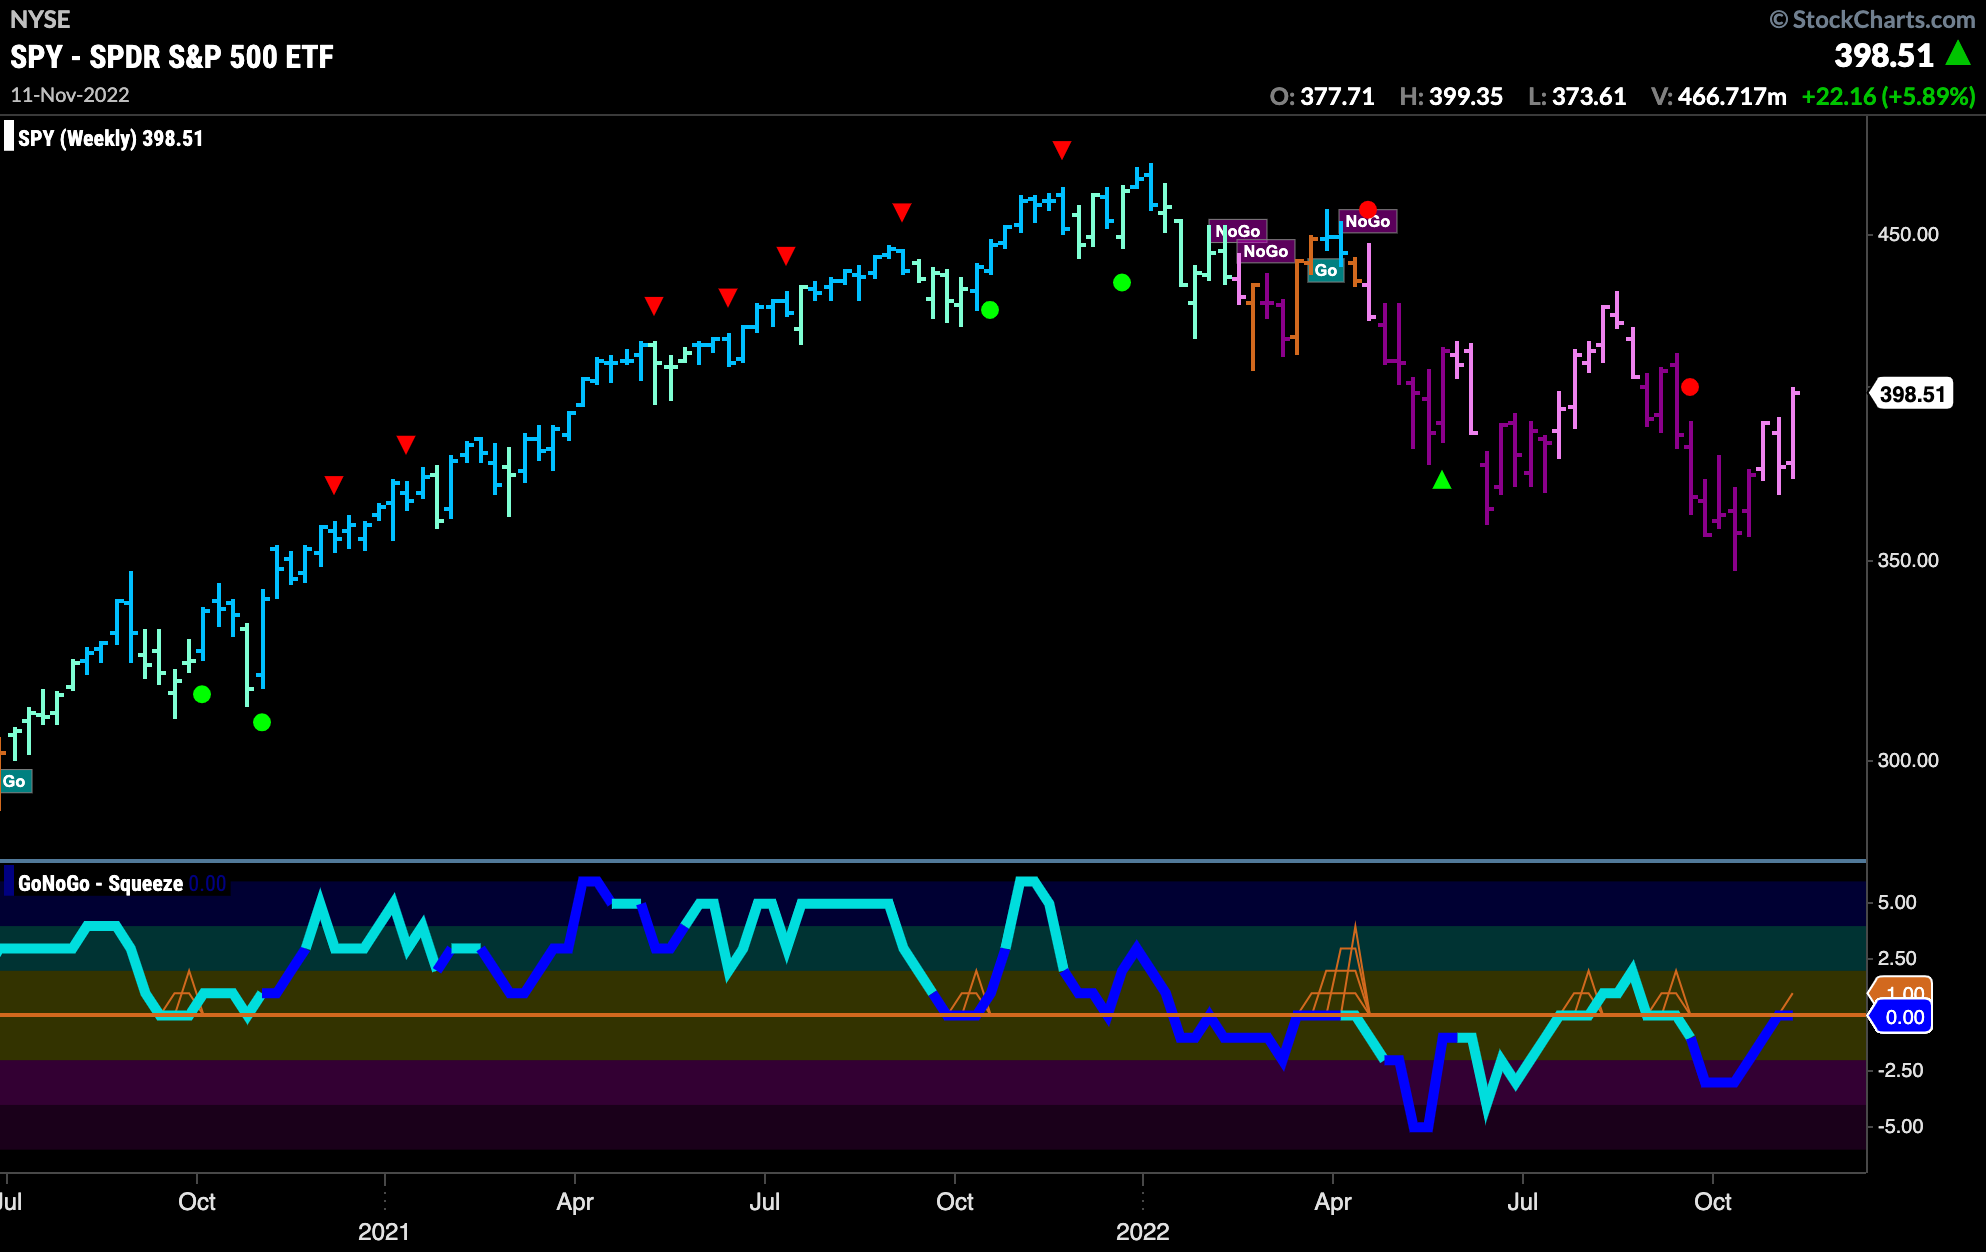
We now turn our eye to the weekly chart. This larger time frame is of course still in a “NoGo” trend. We need to watch to see if there is confirmation on this chart to tell whether what we see on the daily chart will be short lived. There are a few encouraging signs. GoNoGo Trend is painting weaker pink “NoGo” bars for the last few weeks. Also, There has been bullish divergence between price making lower lows and the oscillator making higher lows. Finally, GoNoGo Oscillator is testing the zero line from below on heavy volume.
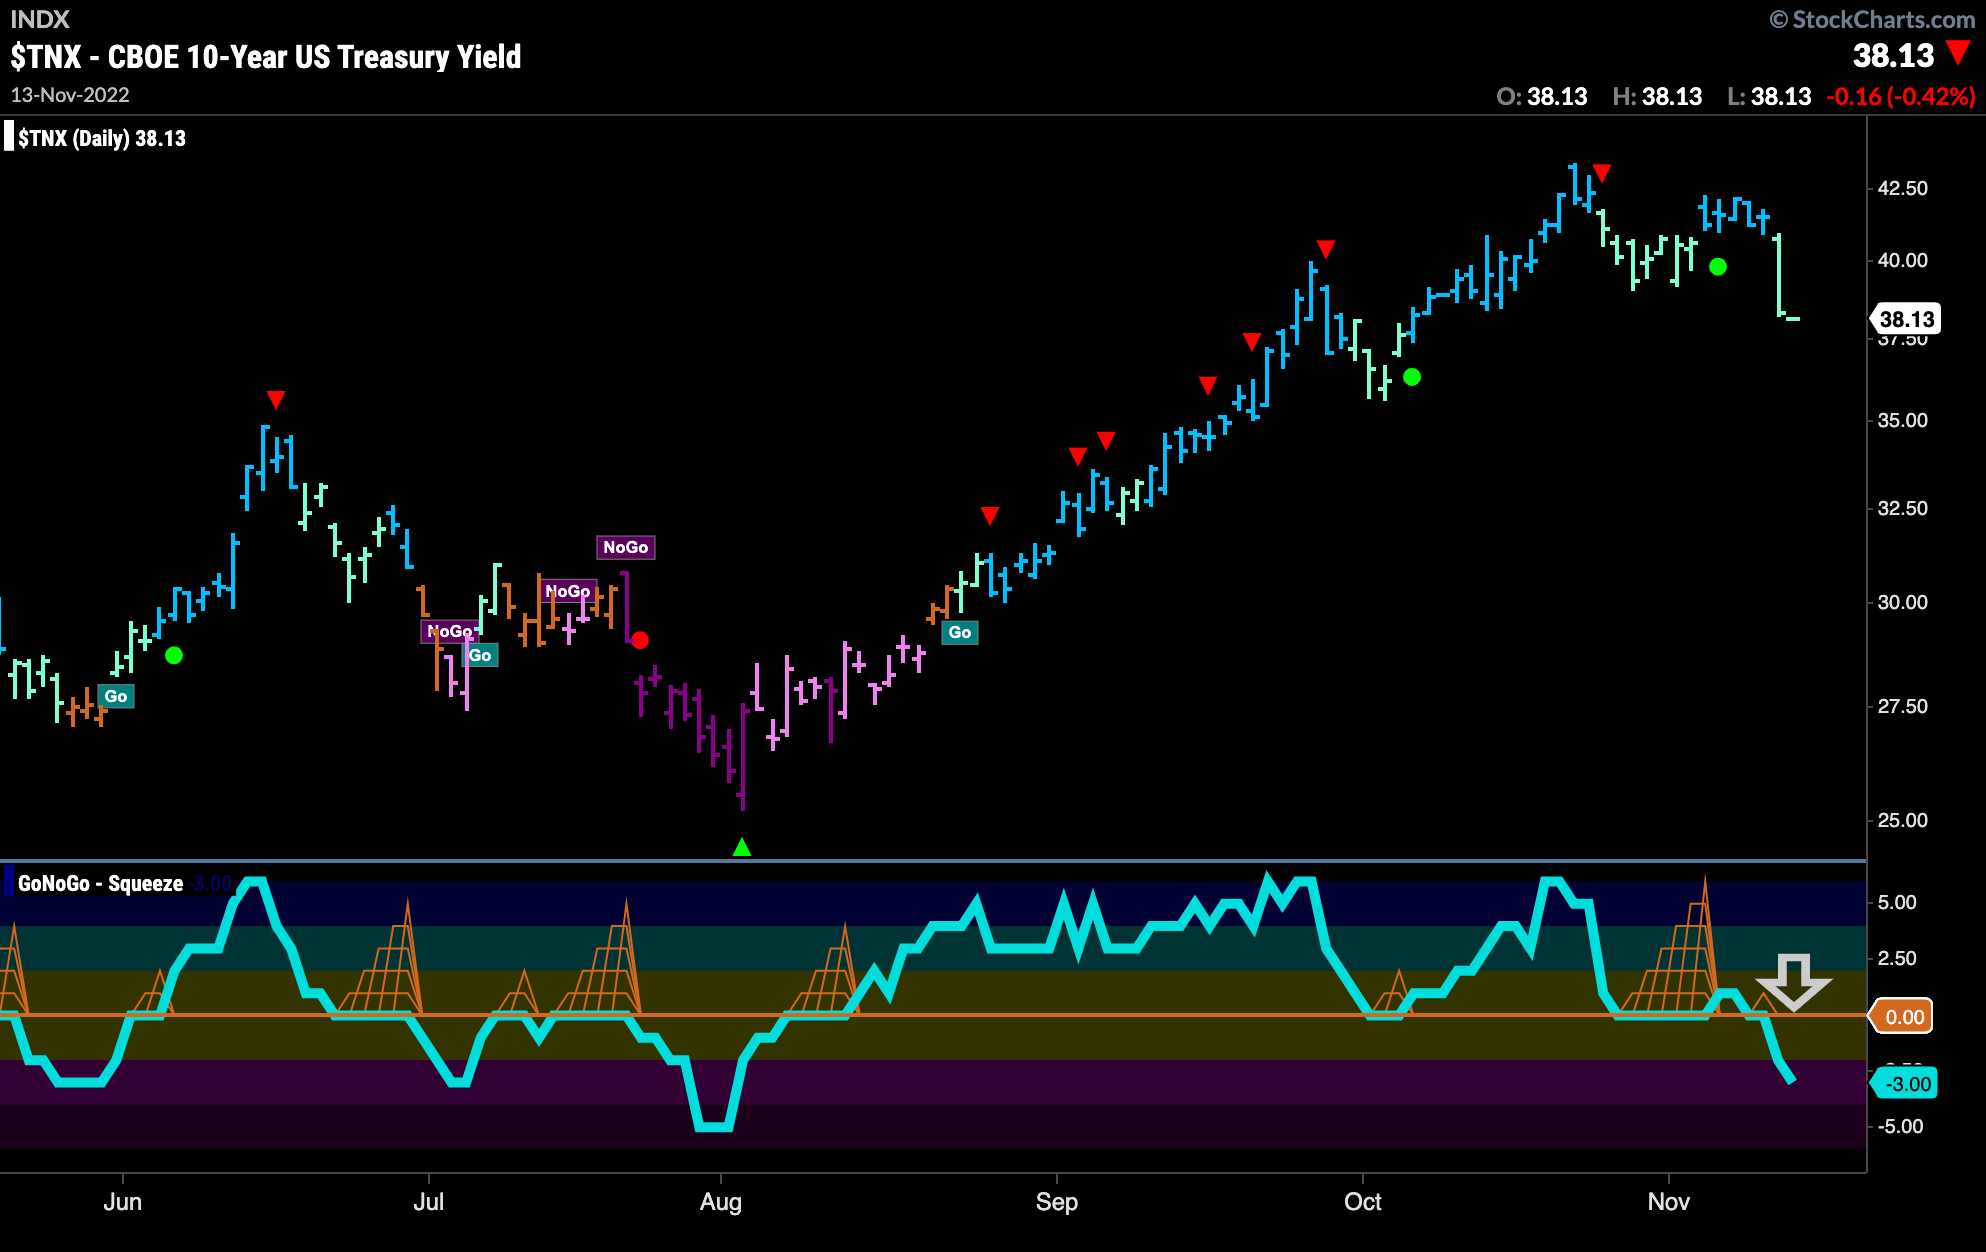
Treasury Rates Fail to find Support at Zero
After failing to make a new higher high, rates crashed on Thursday as the GoNoGo Oscillator crashed through the zero line. Price had been moving sideways Since October high and GoNoGo Oscillator was trying to find support. We will watch to see if this leads to a deeper correction.
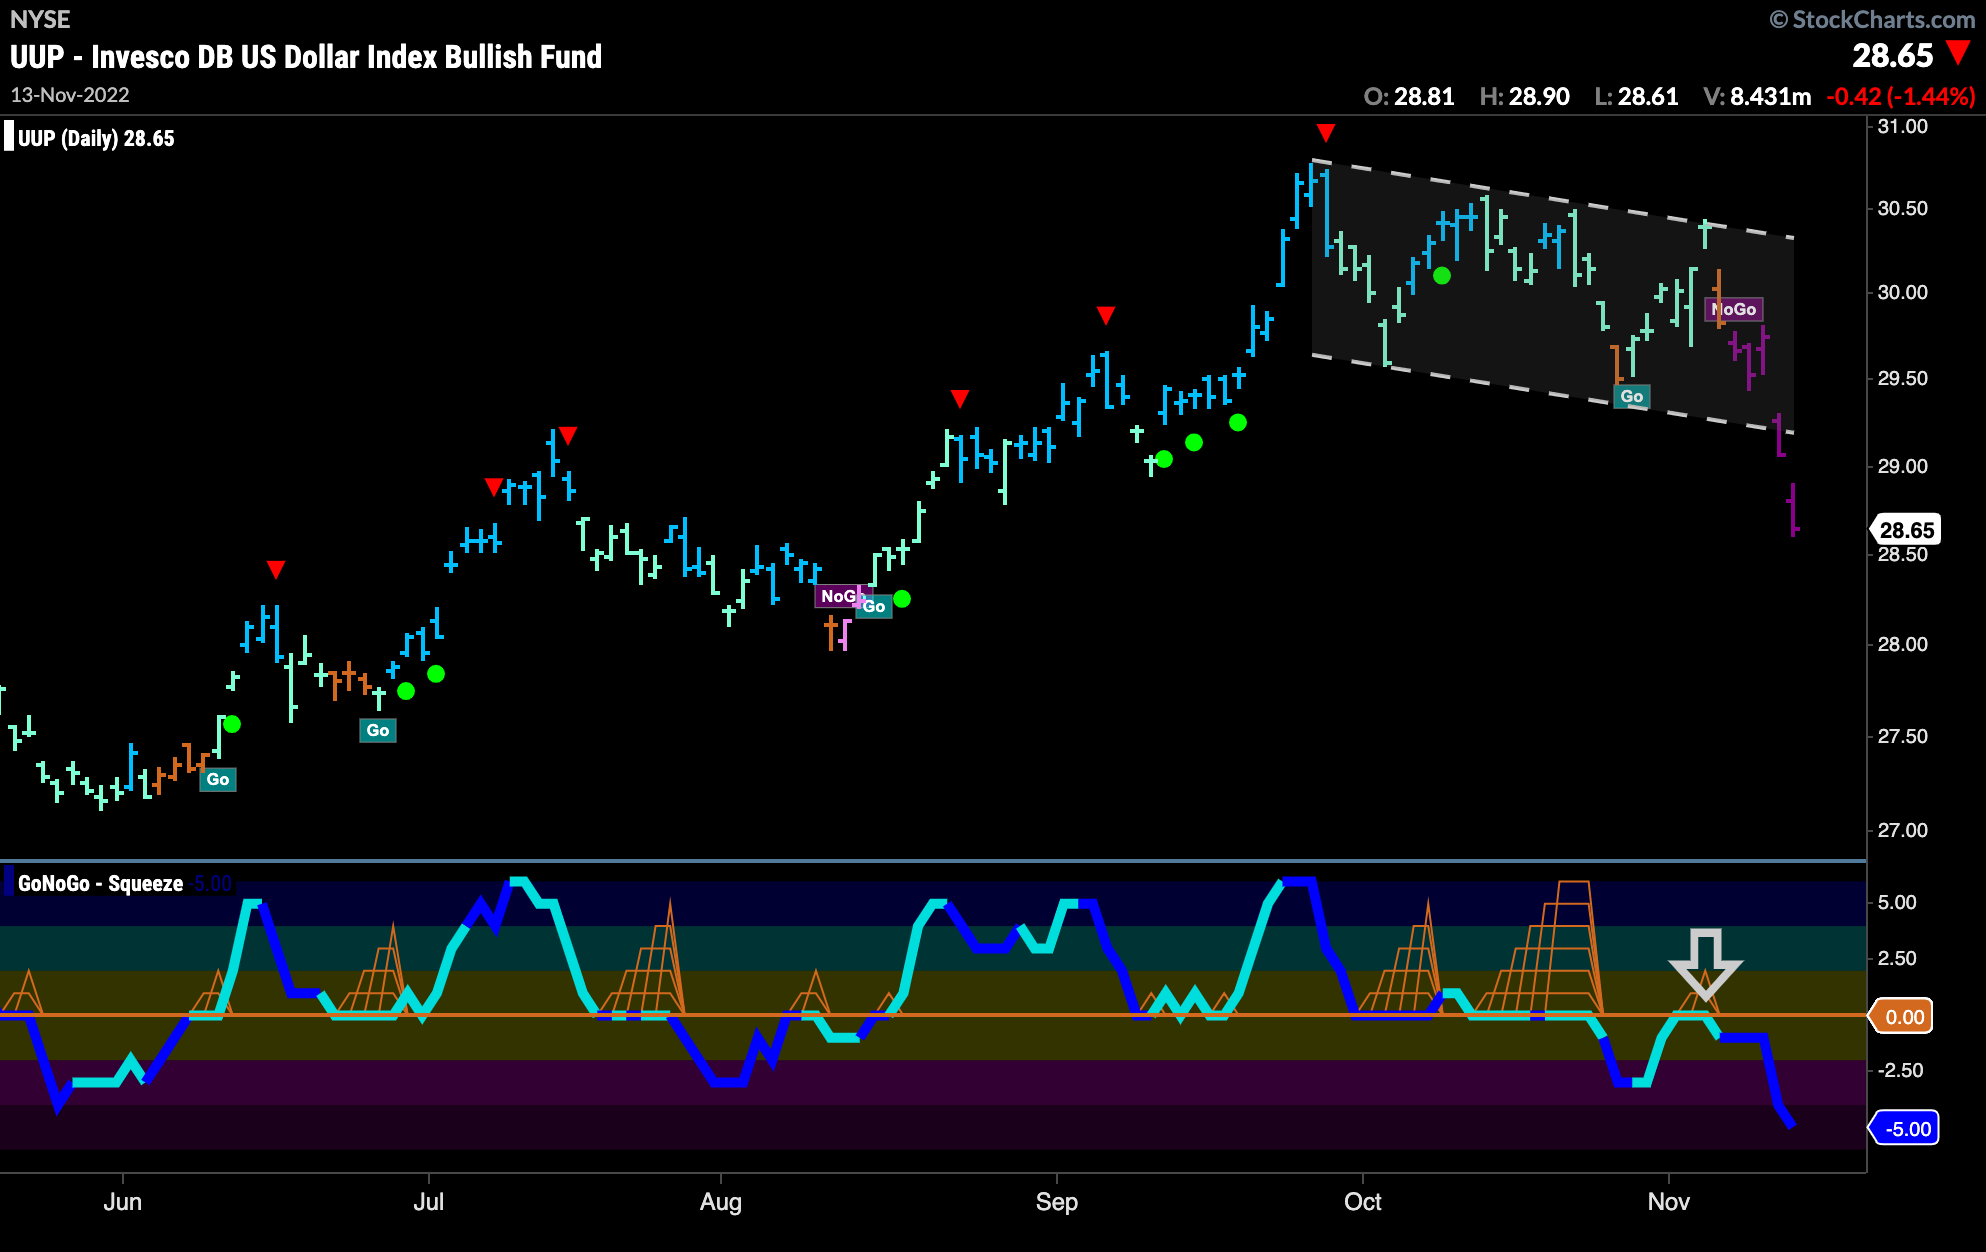
The Dollar Resolves to the Downside
Over the past several weeks, the dollar has shown step by step the signs of reversal from a GoNoGo perspective. Correcting from the late September high, GoNoGo Trend painted mostly weaker aqua “Go” bars. GoNoGo Oscillator fell to the zero line and stayed there as a max GoNoGo Squeeze formed. An amber Go Fish bar crept in to threaten the “Go” trend further at this point. GoNoGo Oscillator broke out of the Squeeze into negative territory and quickly retested that level. Failing again, GoNoGo Trend quickly painted strong purple “NoGo” bars. We now see price crashing through channel support as the “NoGo” trend is strong.
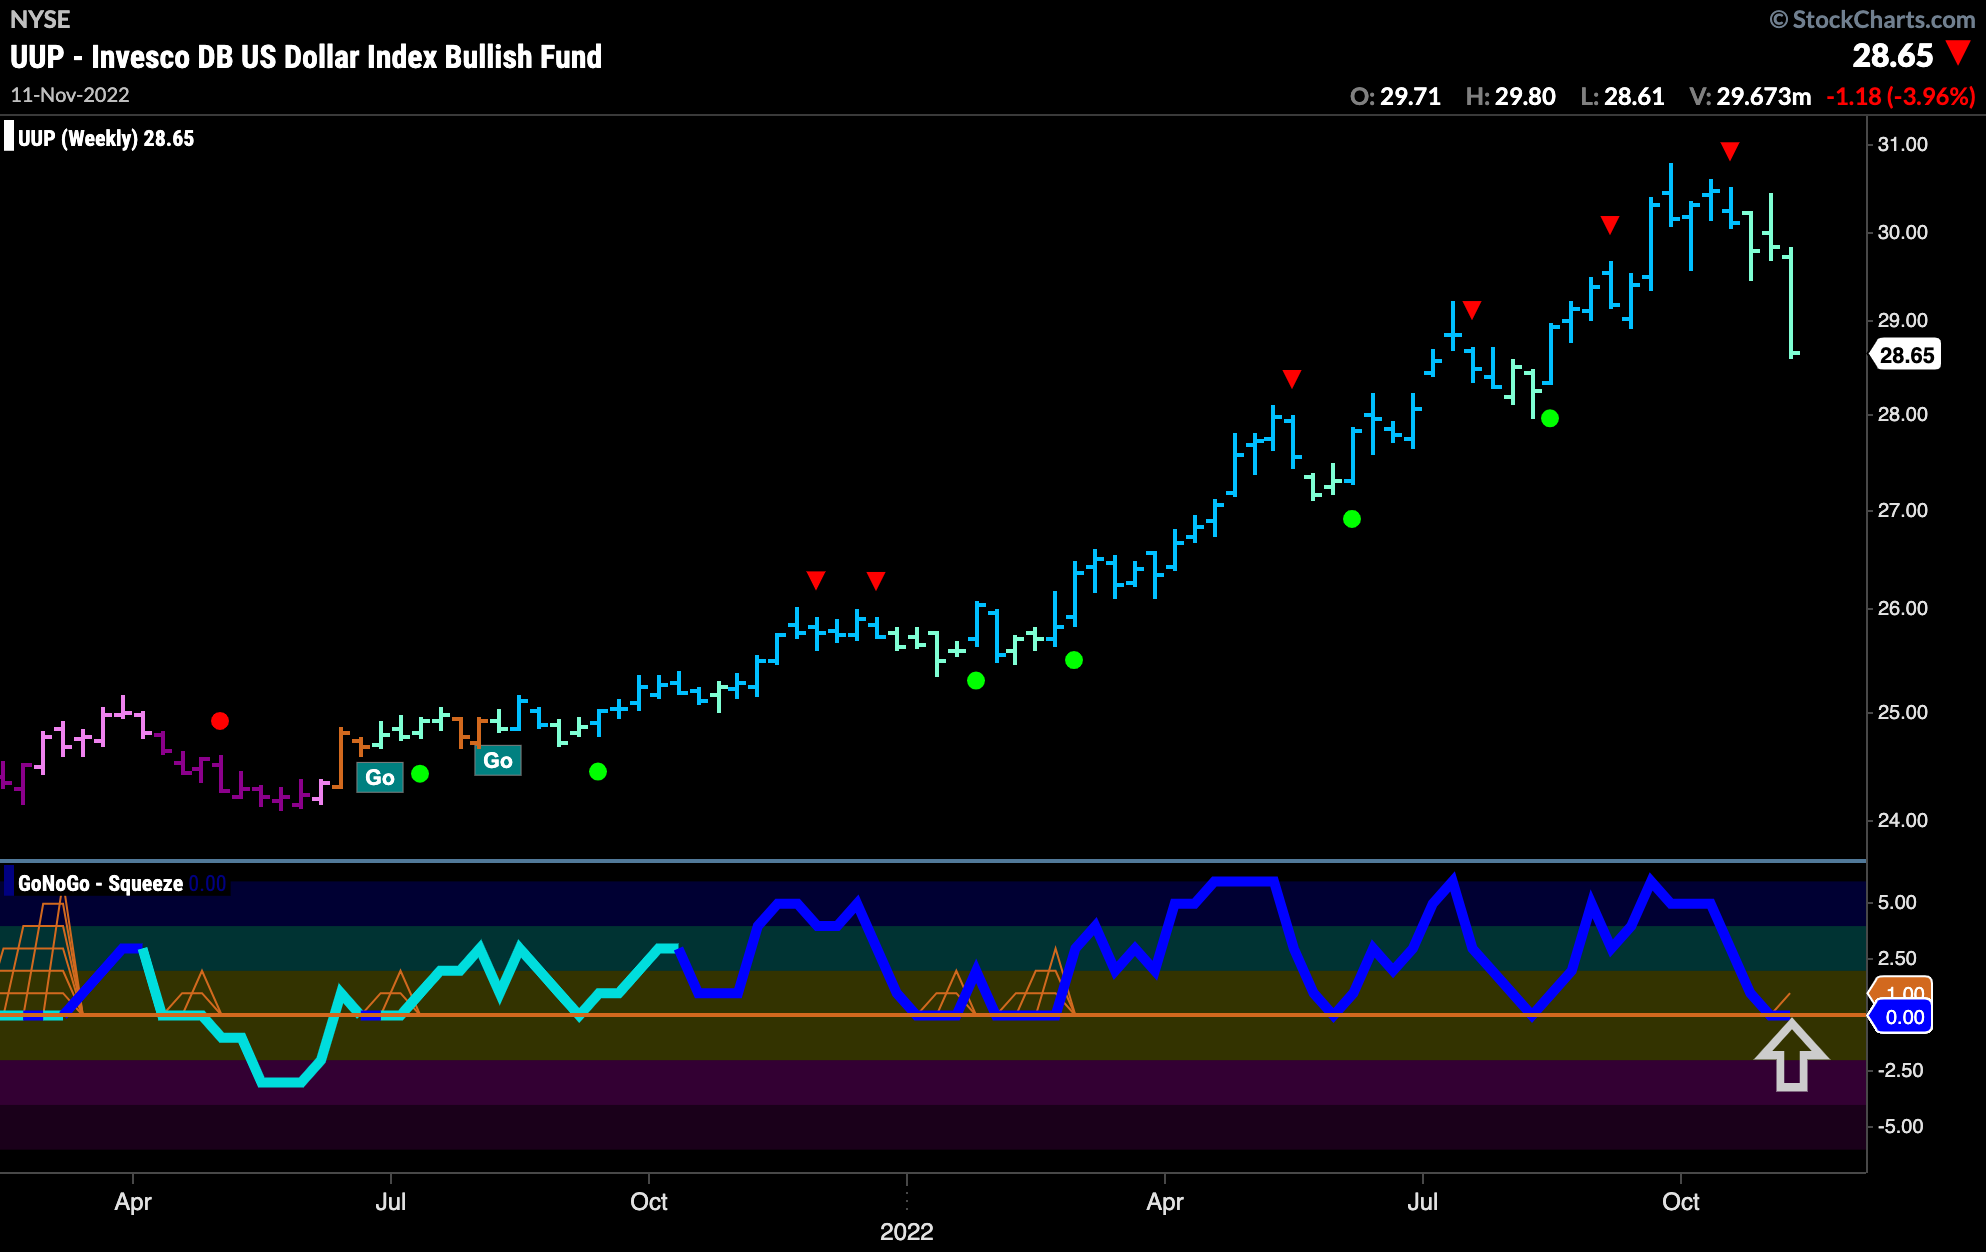
Taking a look at the weekly chart we can see that we are at an important inflection point on the larger time frame chart as well. Last week’s bearish price action sees GoNoGo Oscillator frozen at the zero line. It needs to find support here if this long term “Go” trend is to remain healthy. A break below zero would indicate further downside possibility for the greenback.
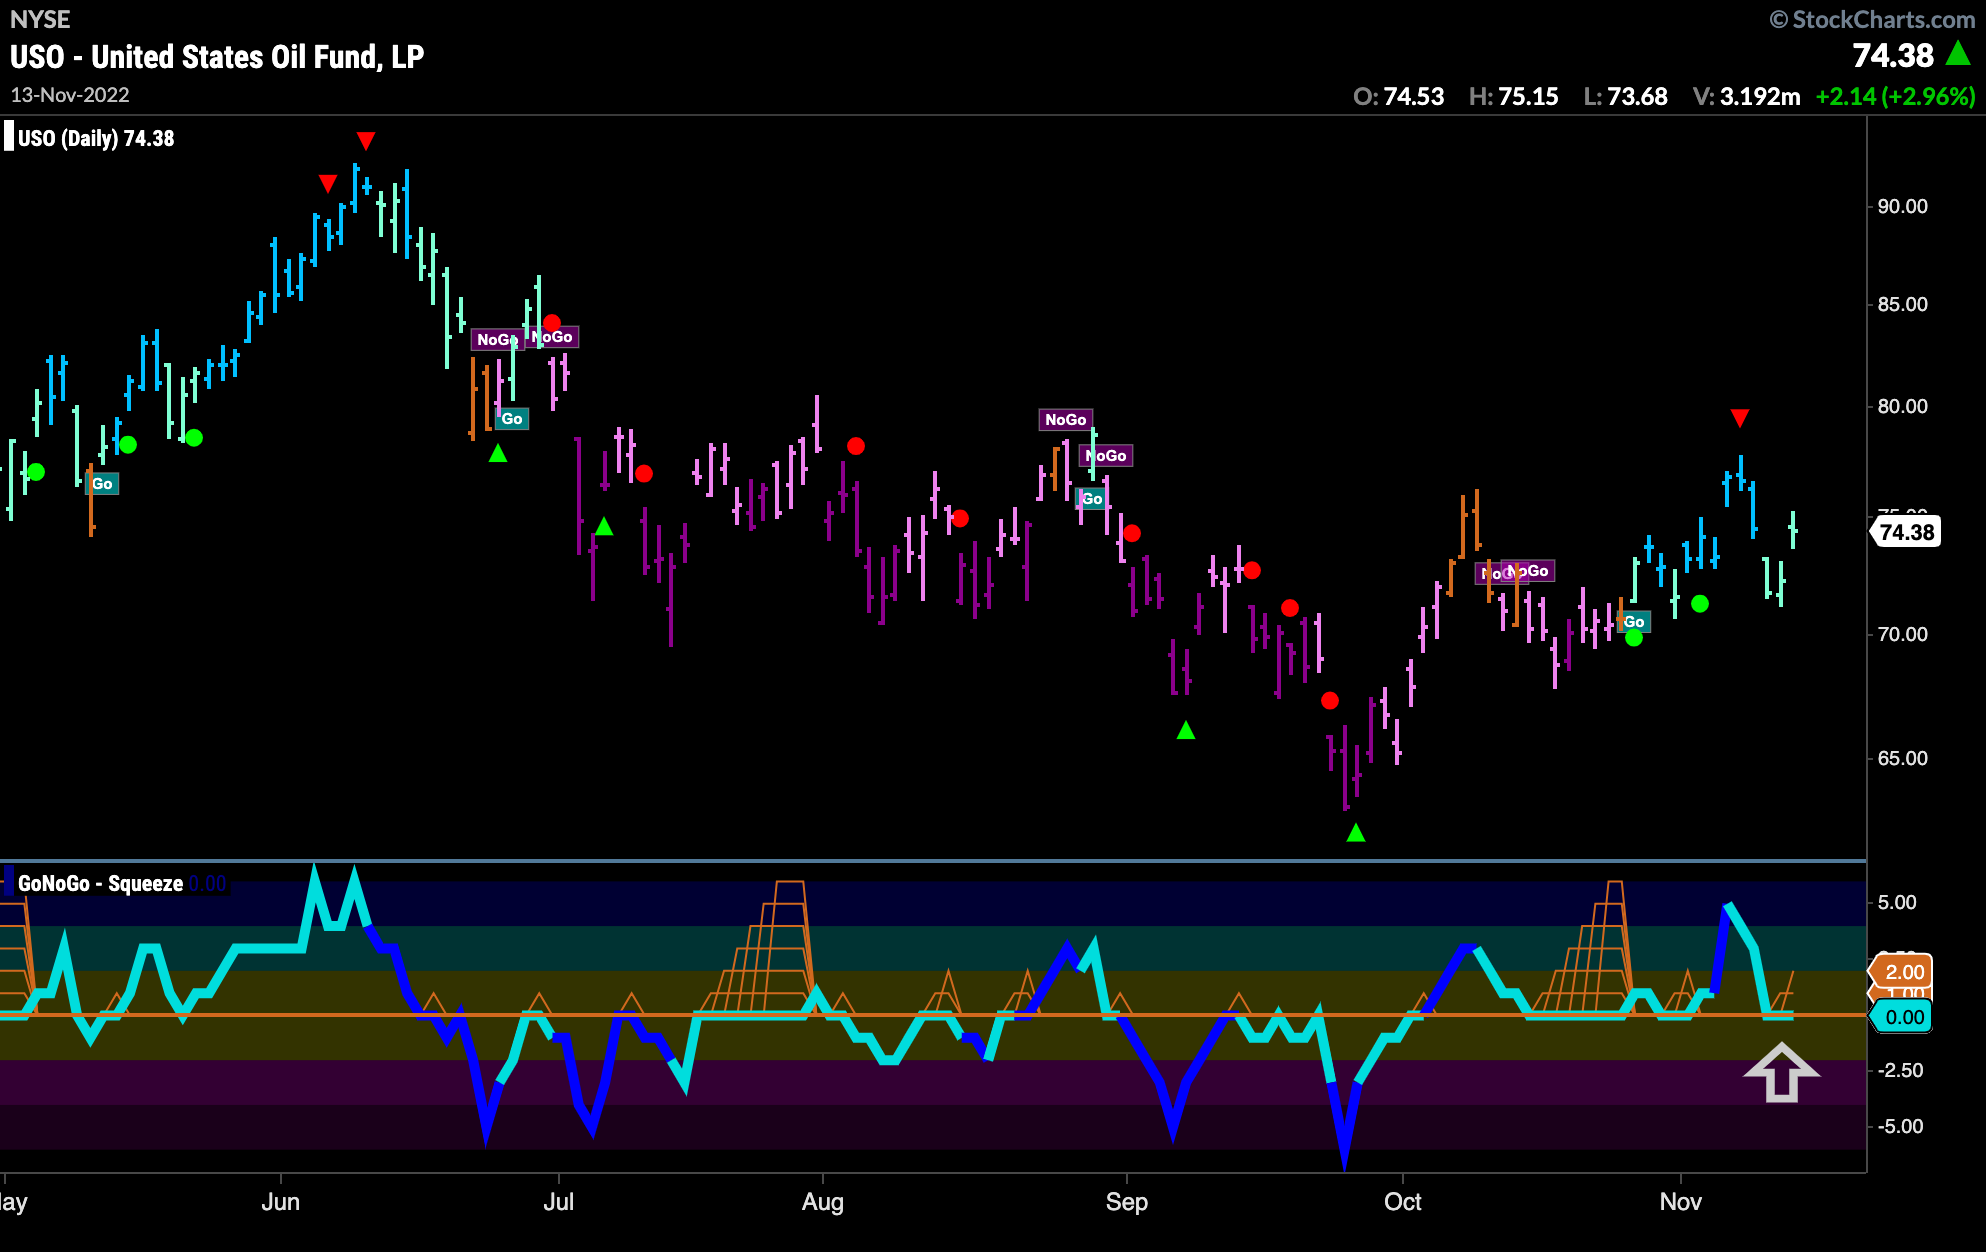
Oil Looks for Support in New “Go” Trend
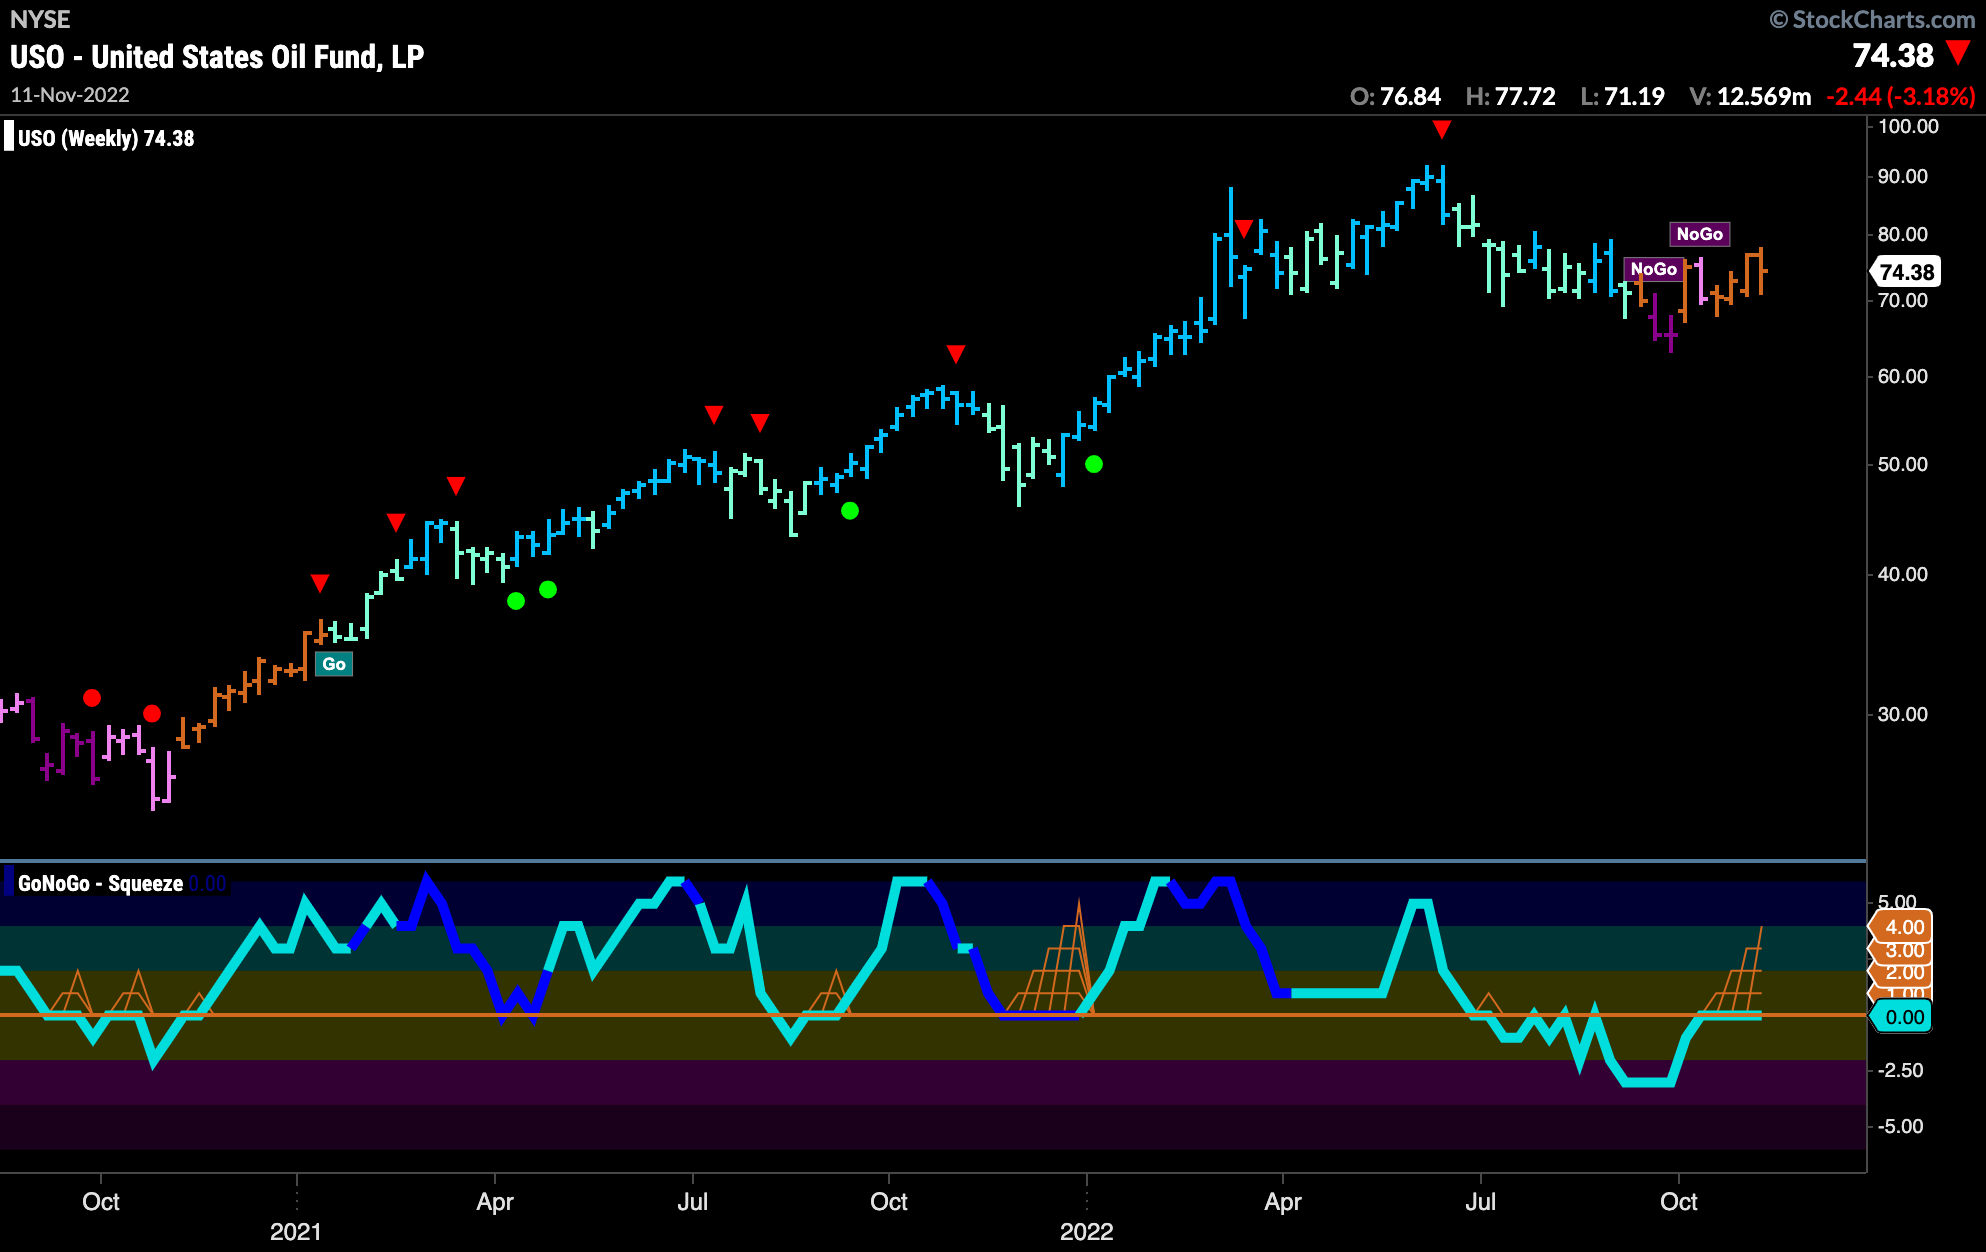
GoNoGo Oscillator is back to test the zero line again. The “Go” trend that formed a few weeks ago has been able to set a higher high but has quickly corrected and we see the oscillator re-testing zero. If it finds support here we will expect another leg higher in price.
The larger timeframe chart shows a great deal of uncertainty. As price moves sideways we see a string of amber “Go Fish” bars and GoNoGo Oscillator has been riding the zero line for 3 weeks now as we see the GoNoGo Squeeze form. We will look to the break out of the squeeze to determine the next long term directional move.
Sector RelMap
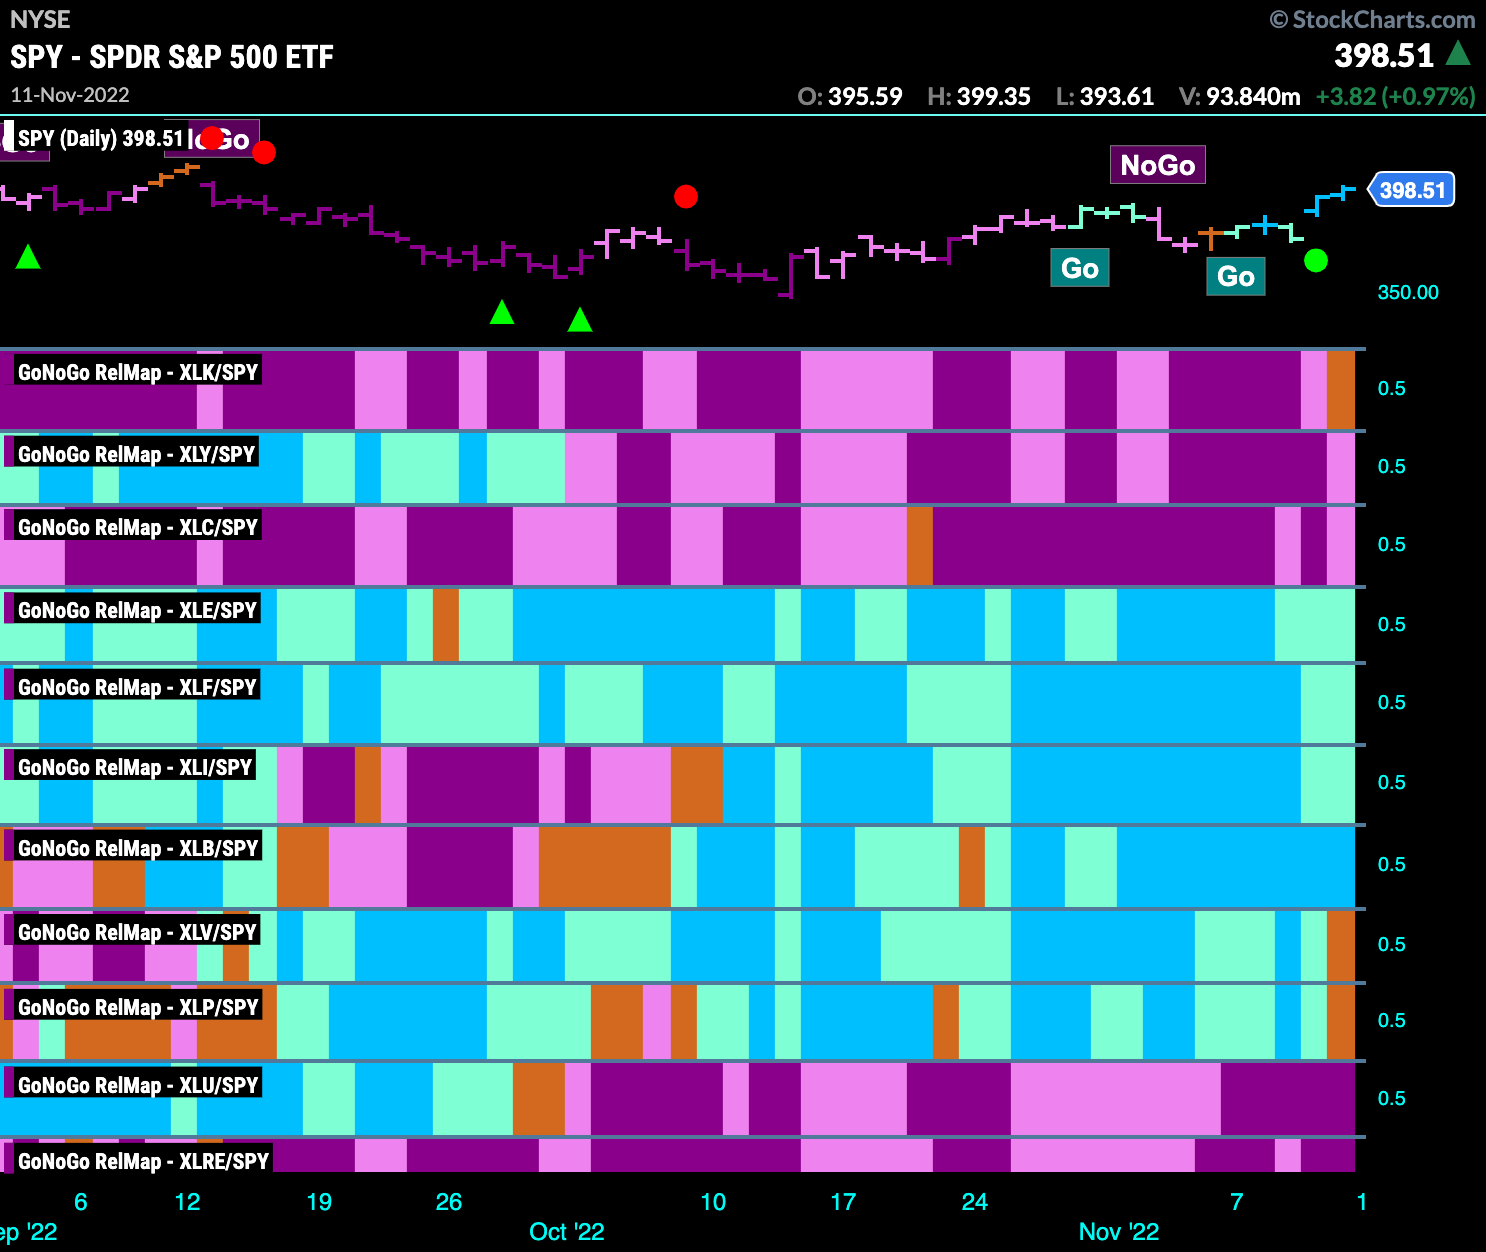
Below is the GoNoGo Sector RelMap. This GoNoGo RelMap applies the GoNoGo Trend to the relative strength ratios of the sectors to the base index. Looking at this map, we can quickly see where the relative outperformance is coming from as well as which sectors are lagging on a relative basis. Interestingly, technology has moved from a “NoGo” to an amber “Go Fish” bar on a relative basis. If this new “Go” trend in equity markets is to continue, renewed strength in growth sectors such as technology could only help.
Fresh “Go” Identified in Technology
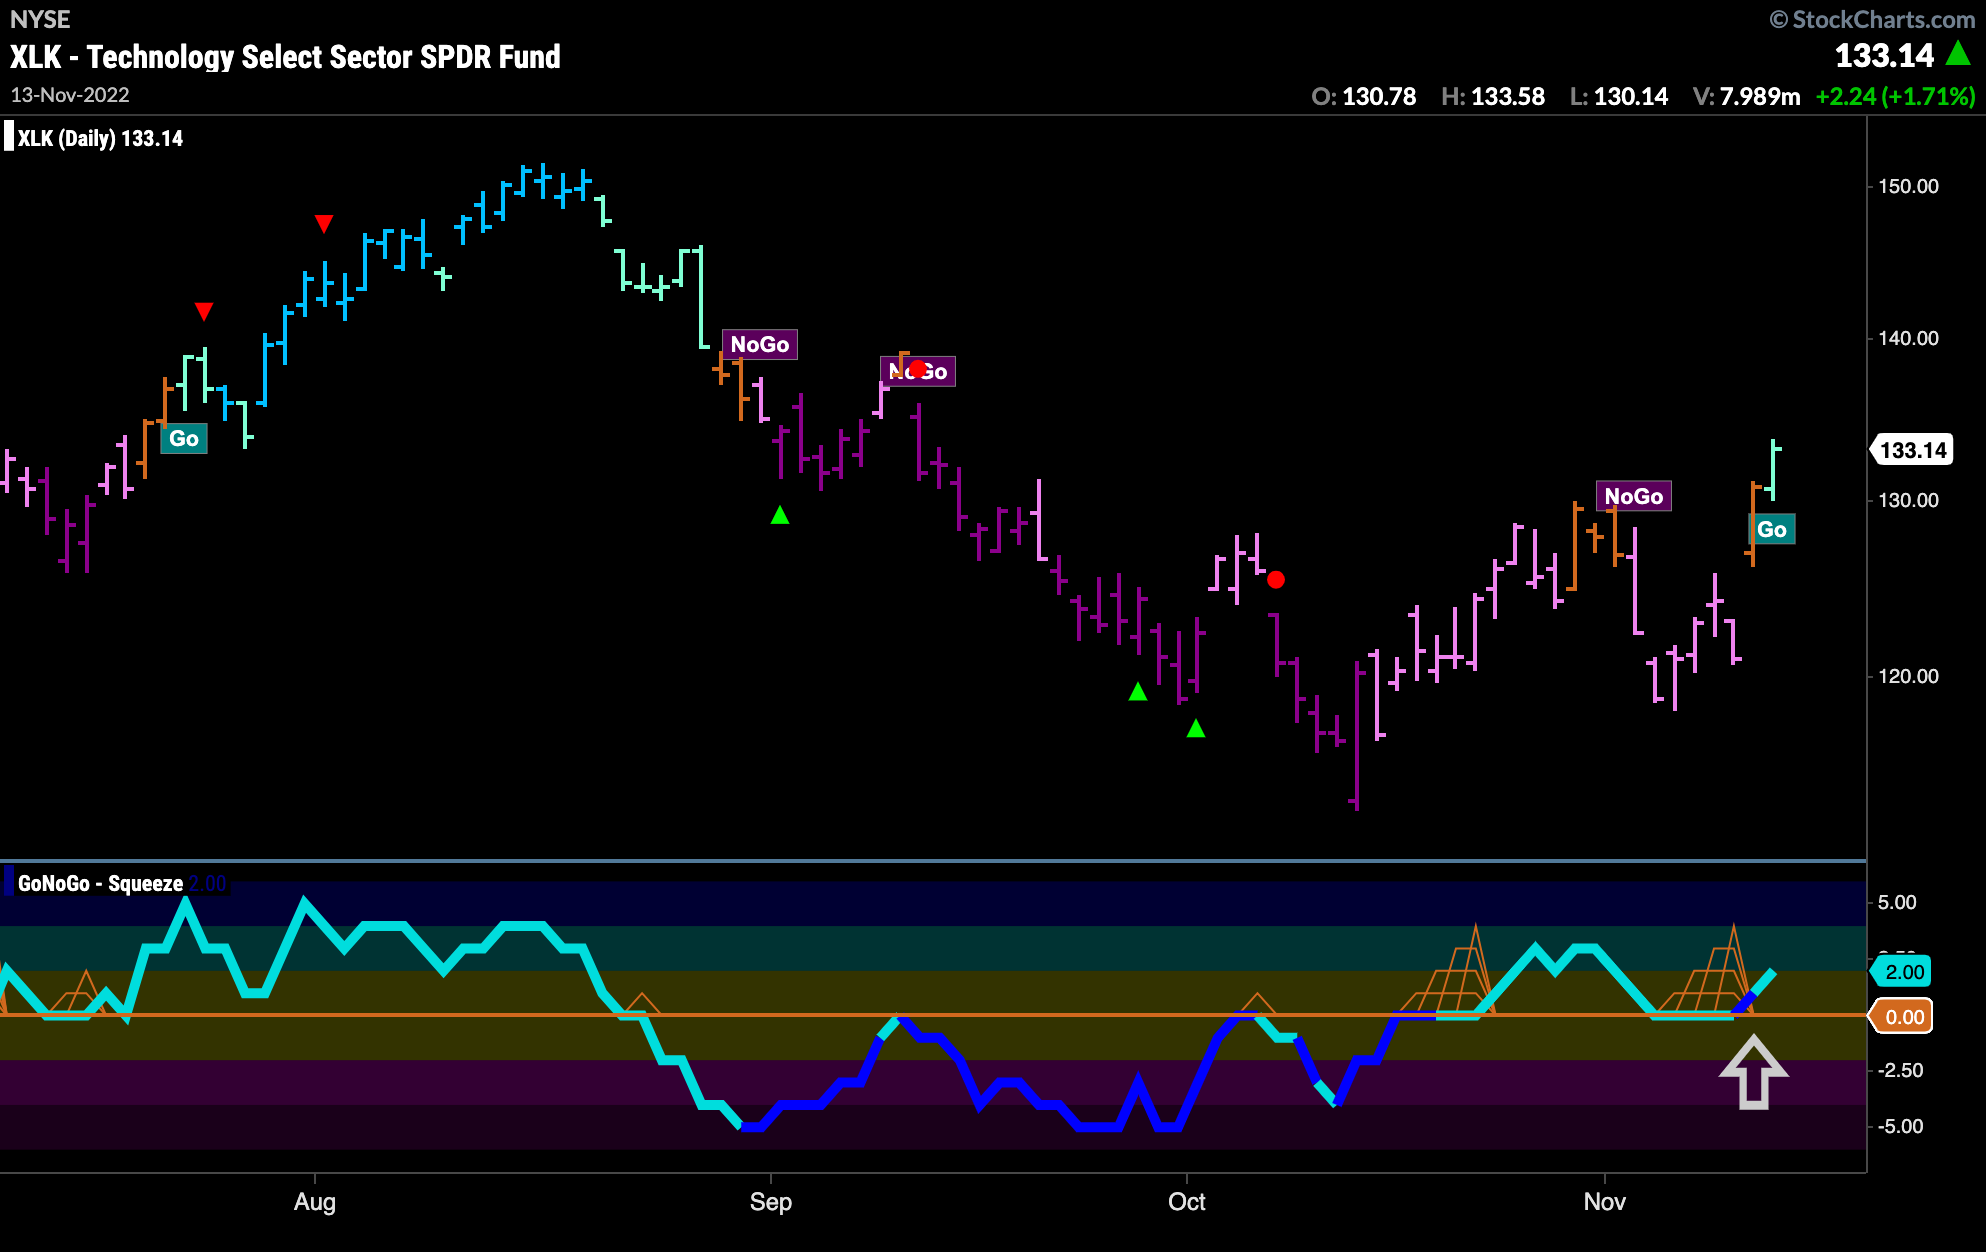
We saw above that on a relative basis $XLK painted an amber “Go Fish” bar to end the week. On a pure trend chart (below) we can see that the growth sector has actually moved into a new “Go” trend. This comes at a new intermediate high and as GoNoGo Oscillator finds support at the zero line.
Adobe Systems Breaks Above Resistance in New “Go’ Trend
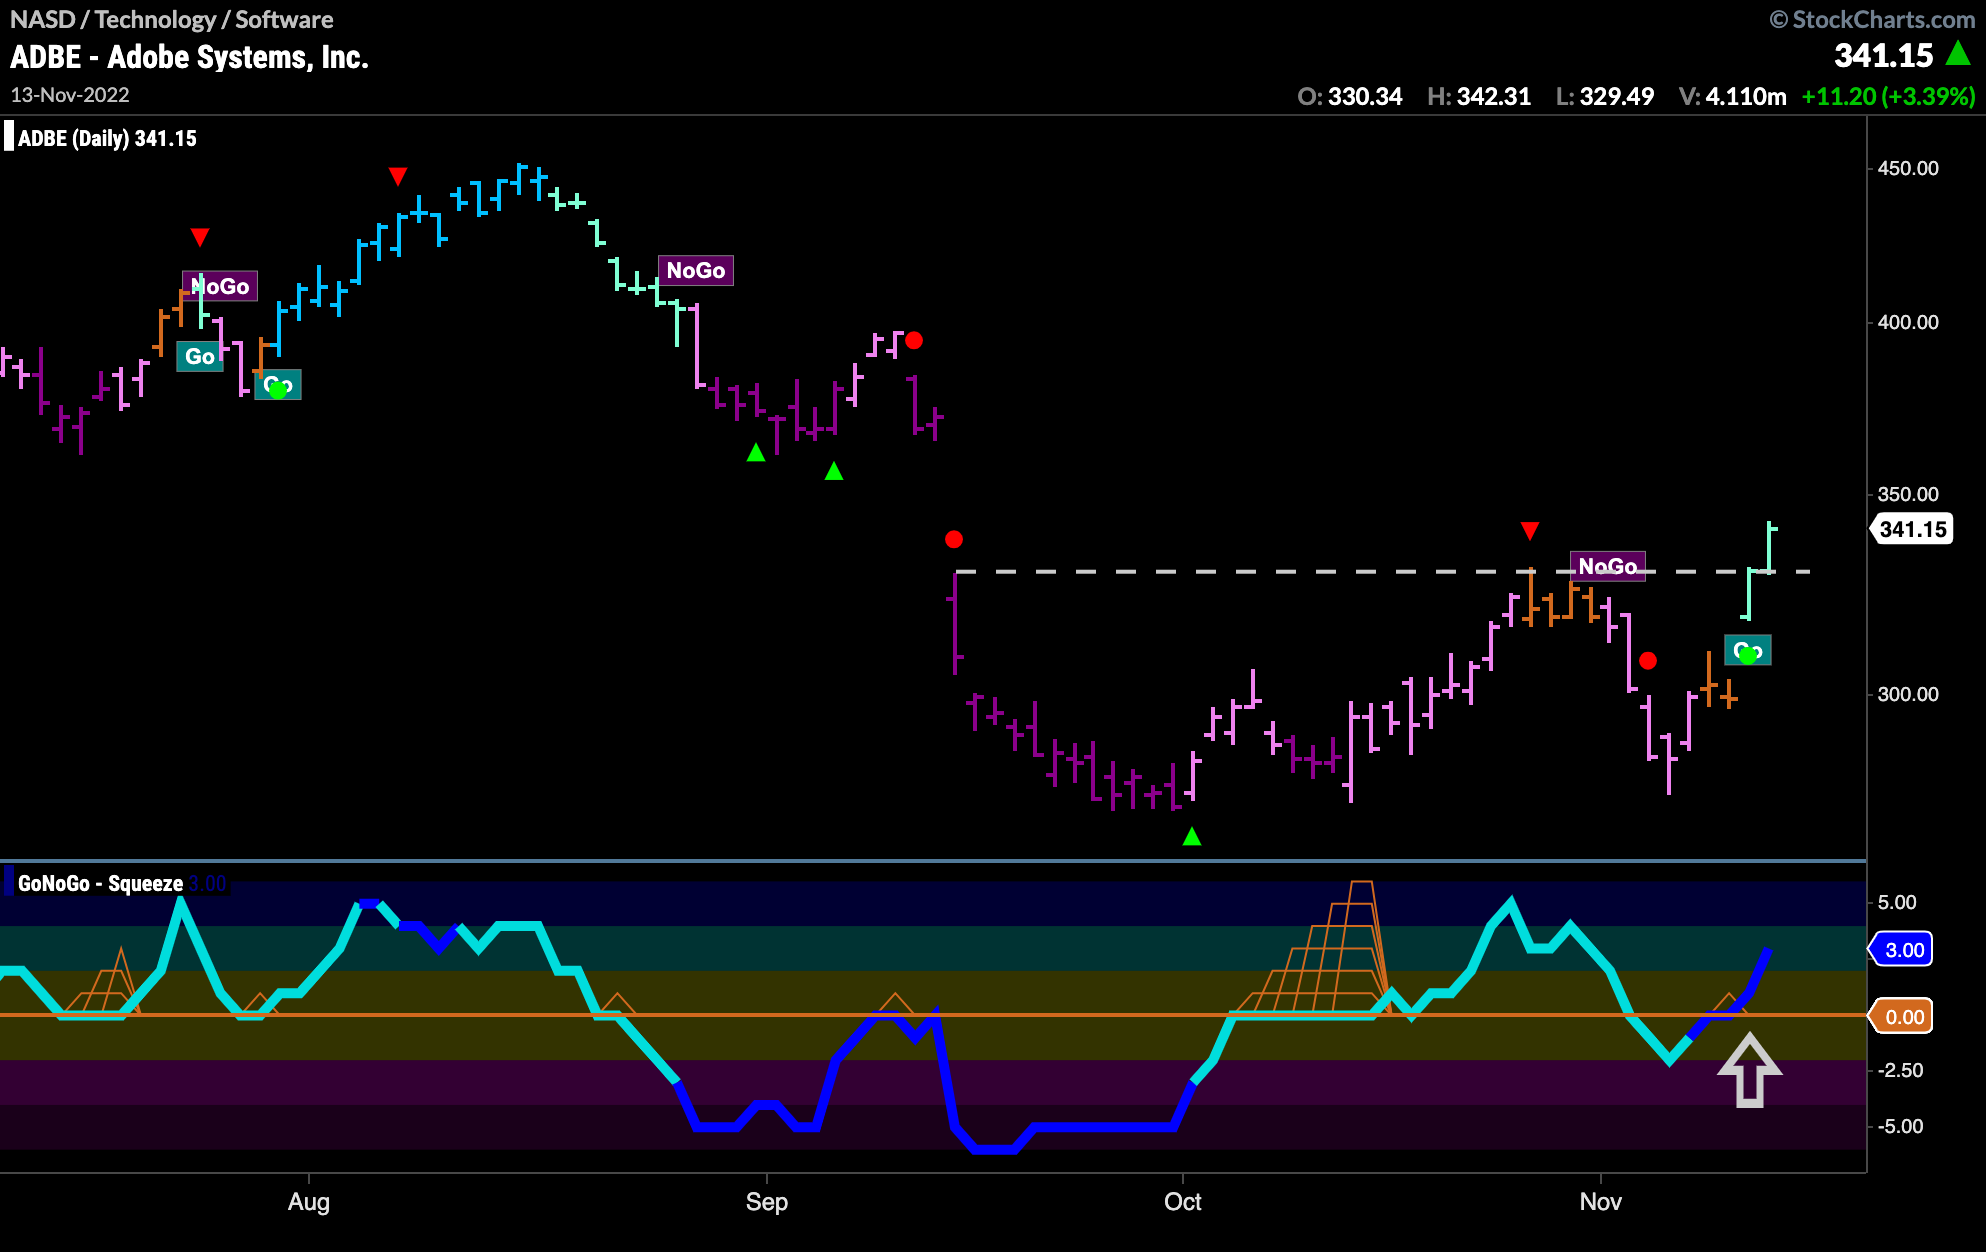
Within the technology sector, $ADBE looks strong. A new “Go” trend has been identified and price now has broken above horizontal resistance from the lower bound of the large gap down in September. GoNoGo Oscillator confirms by moving strongly into positive territory on heavy volume. We know from our technical analysis study that gaps are likely to get filled, so we can look for an initial target at the top of the gap.
