Good morning and welcome to this week’s Flight Path. Let’s take a look at the GoNoGo Asset map below. The “Go” trend continues in U.S. domestic equities this week as we see a string of uninterrupted blue bars. Treasury bond prices paint a couple of amber “Go Fish” as we see some uncertainty and commodities hold on to the “Go” trend. The dollar continues in a strong “NoGo” trend painting purple bars. 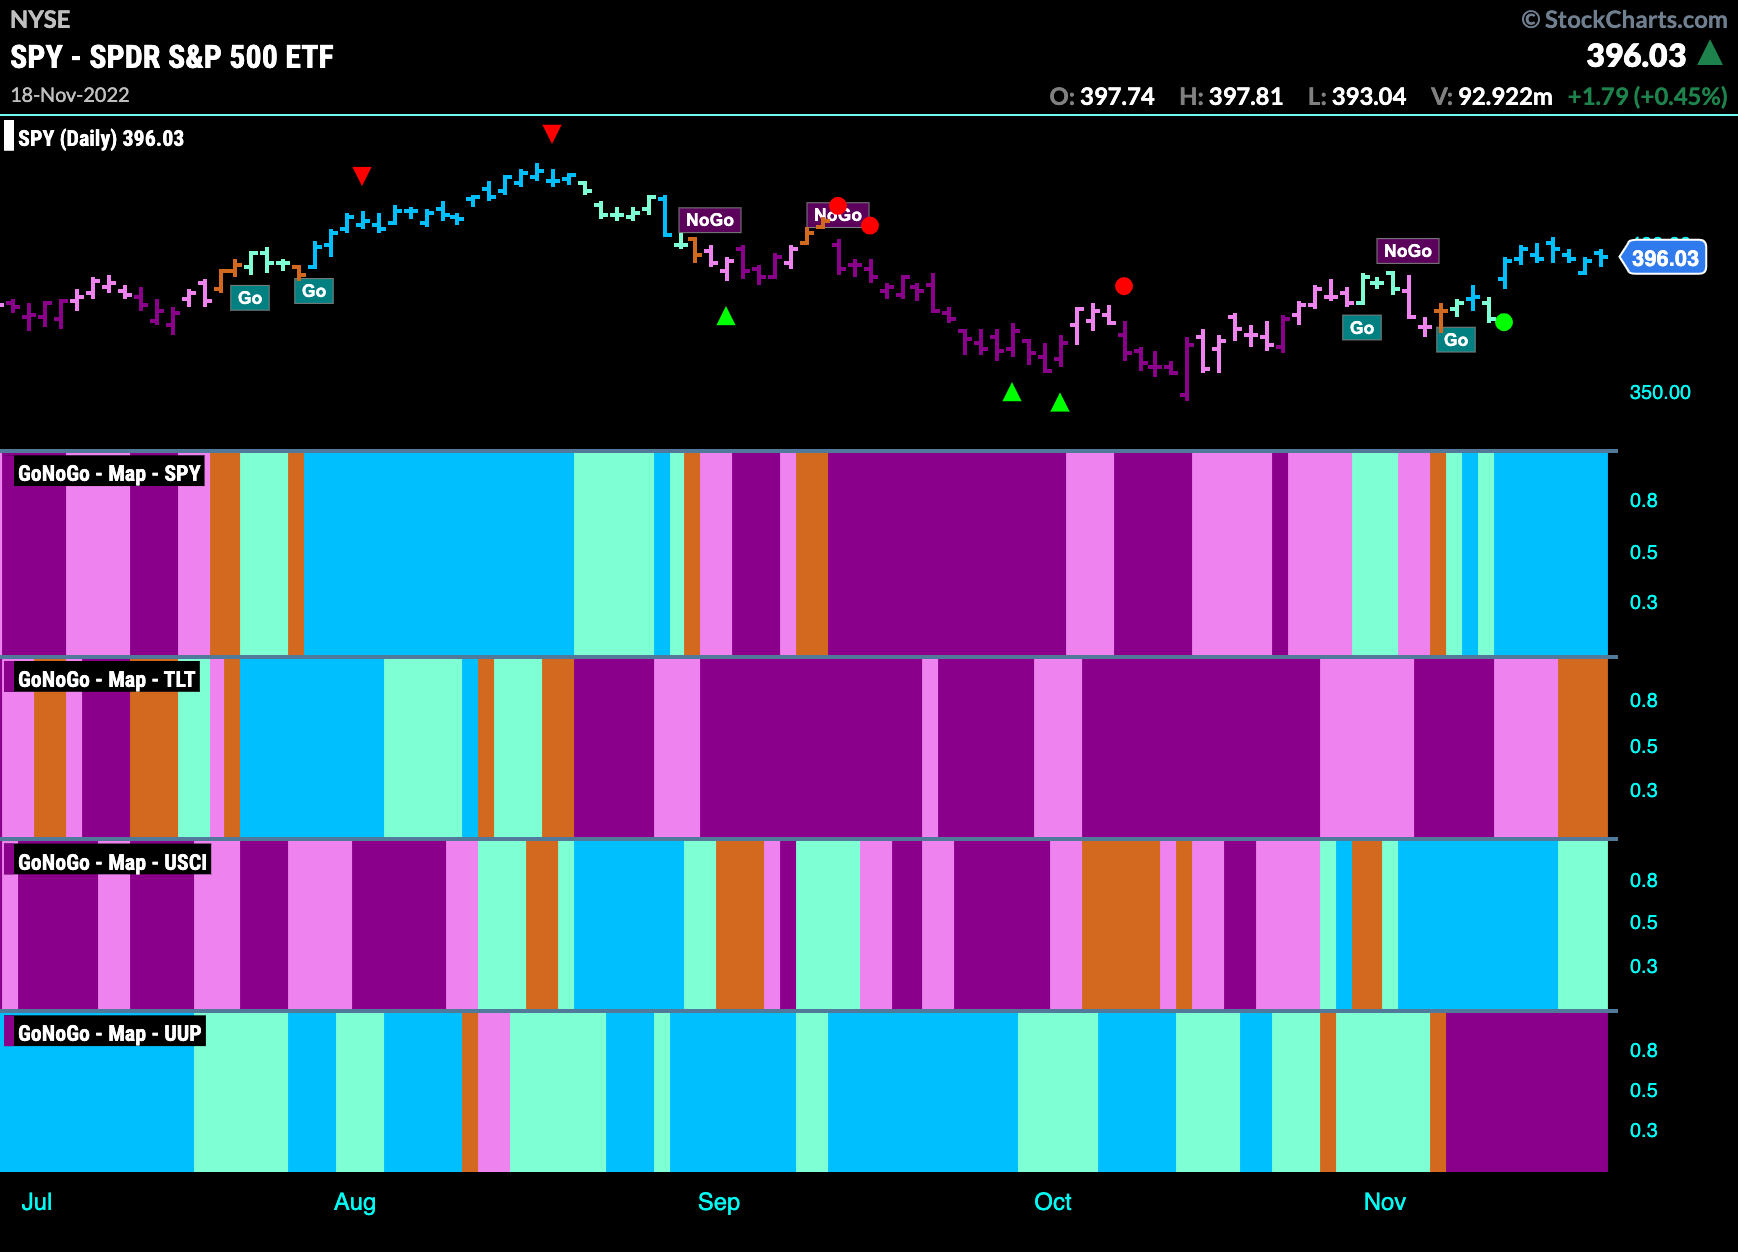
S&P 500 consolidates in “Go” trend
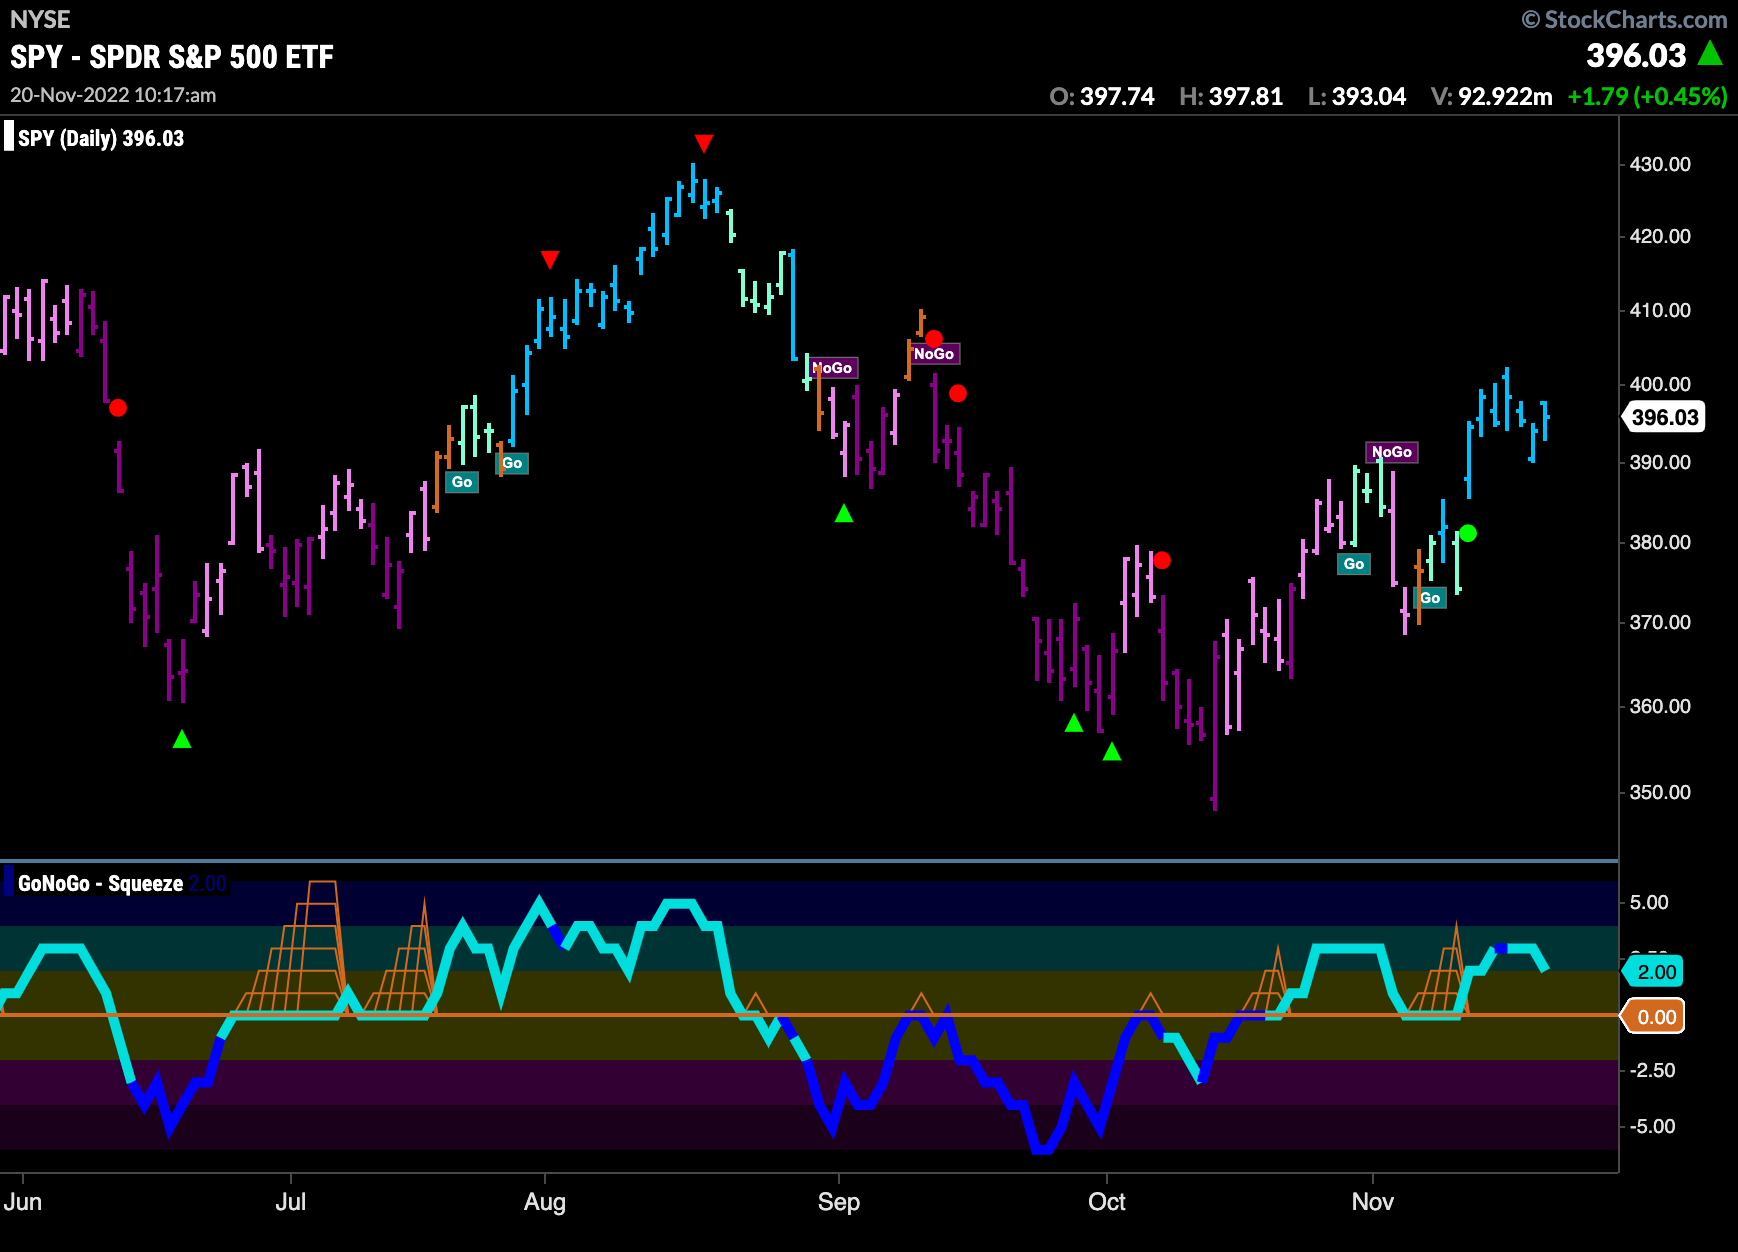
The “Go” trend persists in the U.S. domestic market this week as $SPY paints a string of blue “Go” bars. After the strong rally to end last week this week’s price action appears mostly sideways but with GoNoGo Oscillator in positive territory and not overbought.
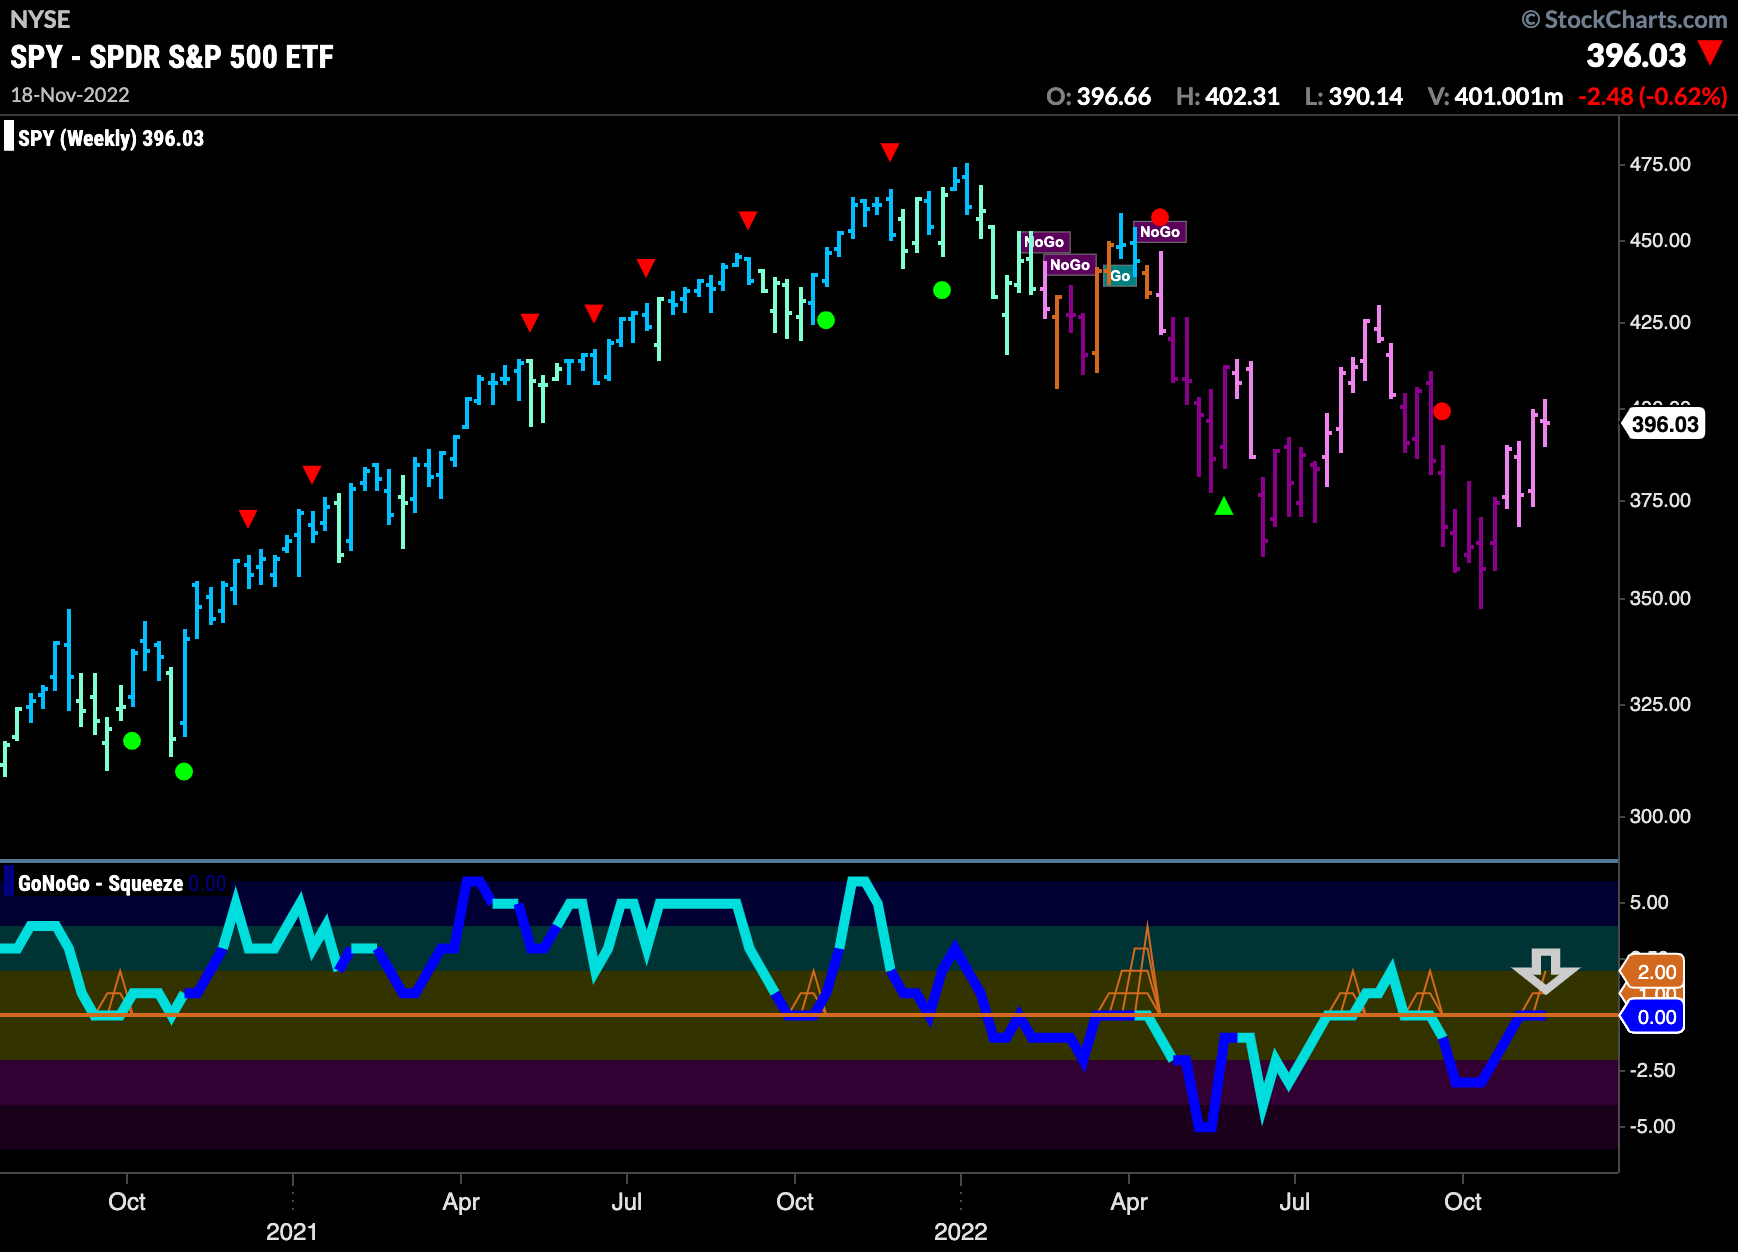
If we look at the weekly chart we can not yet be convinced that the long term trend is changing. It is encouraging to see the price action hold the “Go” trend on the daily chart but we are still going to be careful as the weight of the evidence on the weekly chart remains pointing to a weak “NoGo’. GoNoGo Oscillator is stuck at zero on heavy volume as a GoNoGo Squeeze begins to form. We will watch to see in which direction the squeeze is broken to determine price’s next direction.
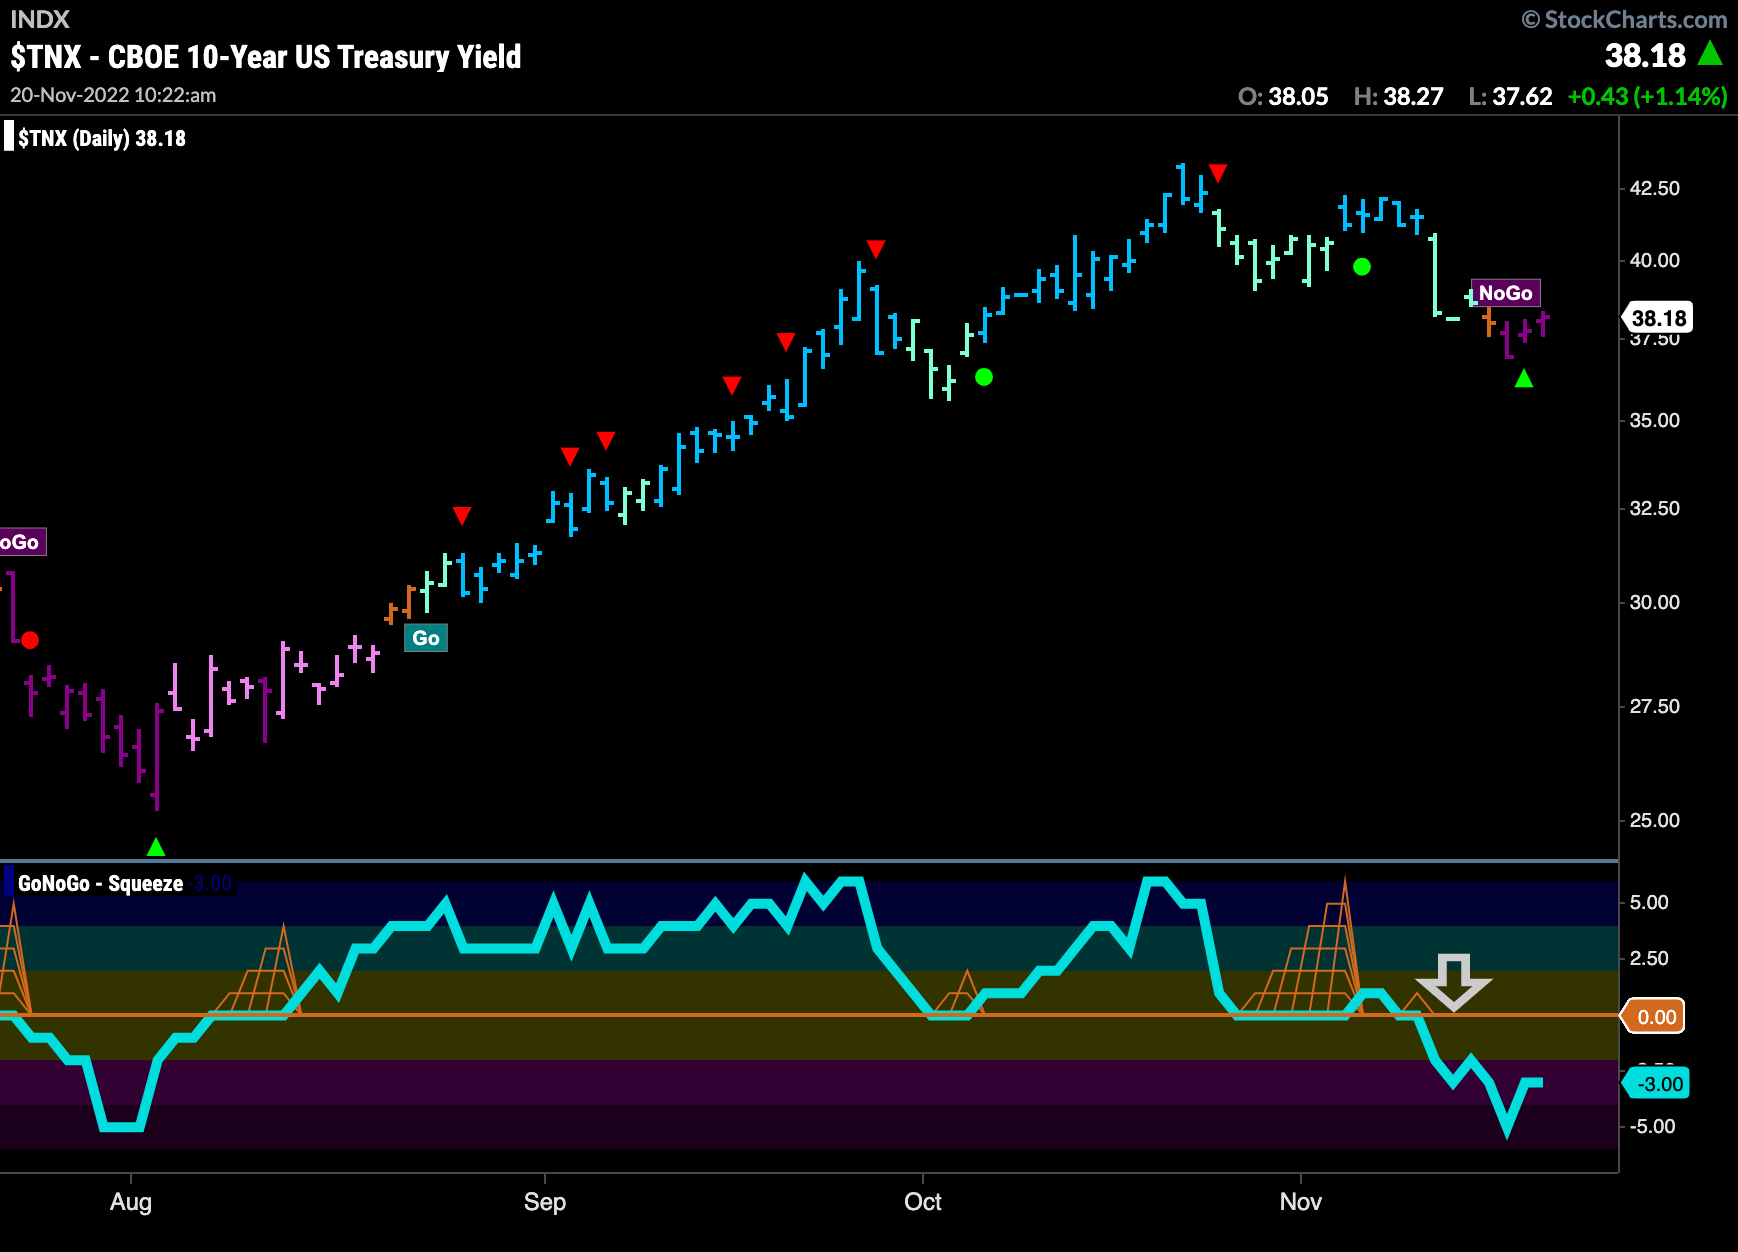
Treasury Rates Paint “NoGo” bars this week
After failing find support at the zero line, GoNoGo Oscillator fell sharply into negative territory and GoNoGo Trend quickly followed suit, painting strong purple “NoGo” bars. Rising rates have been a head wind for equities all year. This could provide some relief in short term and allow the “Go” trend in equities to continue.
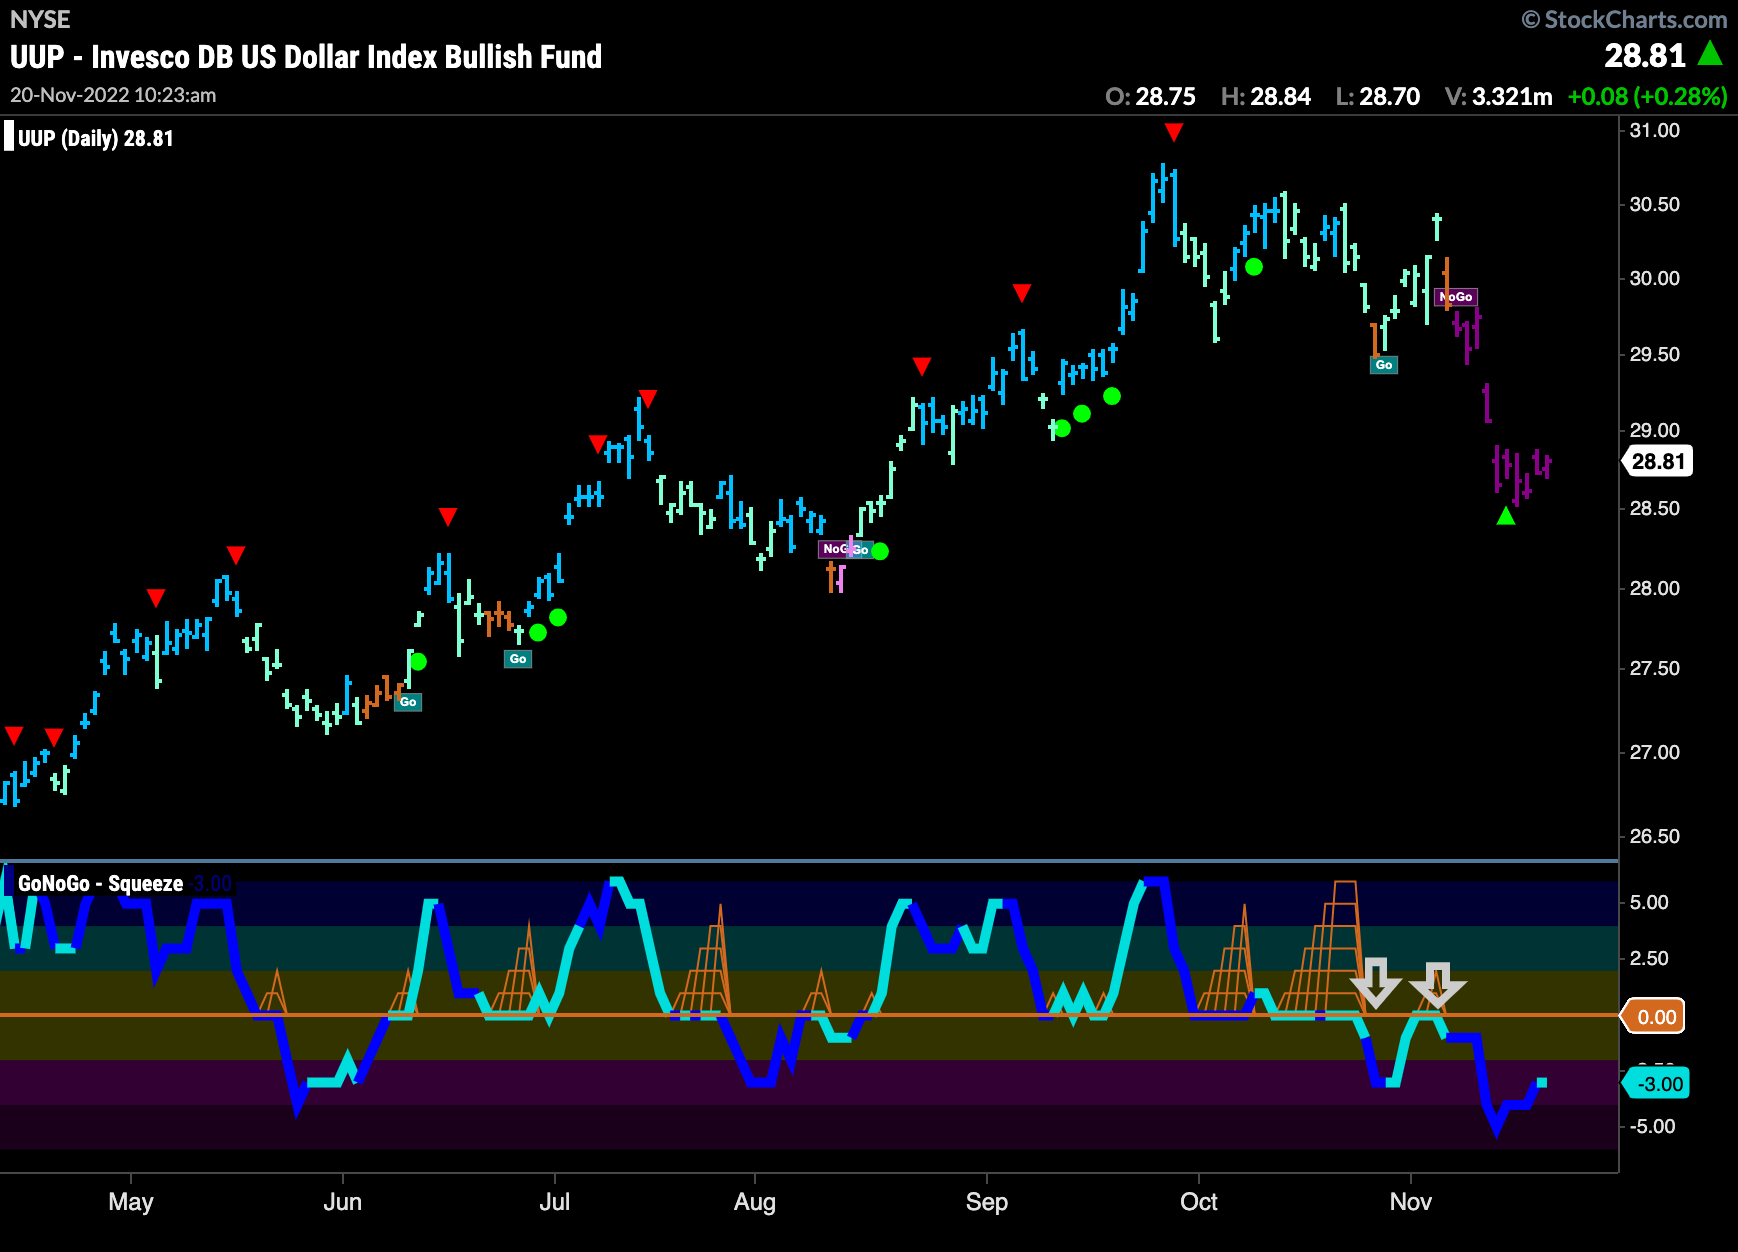
The Dollar Consolidates in “NoGo”
This week we have seen price consolidate sideways as price stabilizes a little after falling so quickly into a “NoGo” a few weeks ago. The trend is a strong “NoGo” still and GoNoGo Oscillator is in negative territory after a period of heavy volume but not yet oversold.
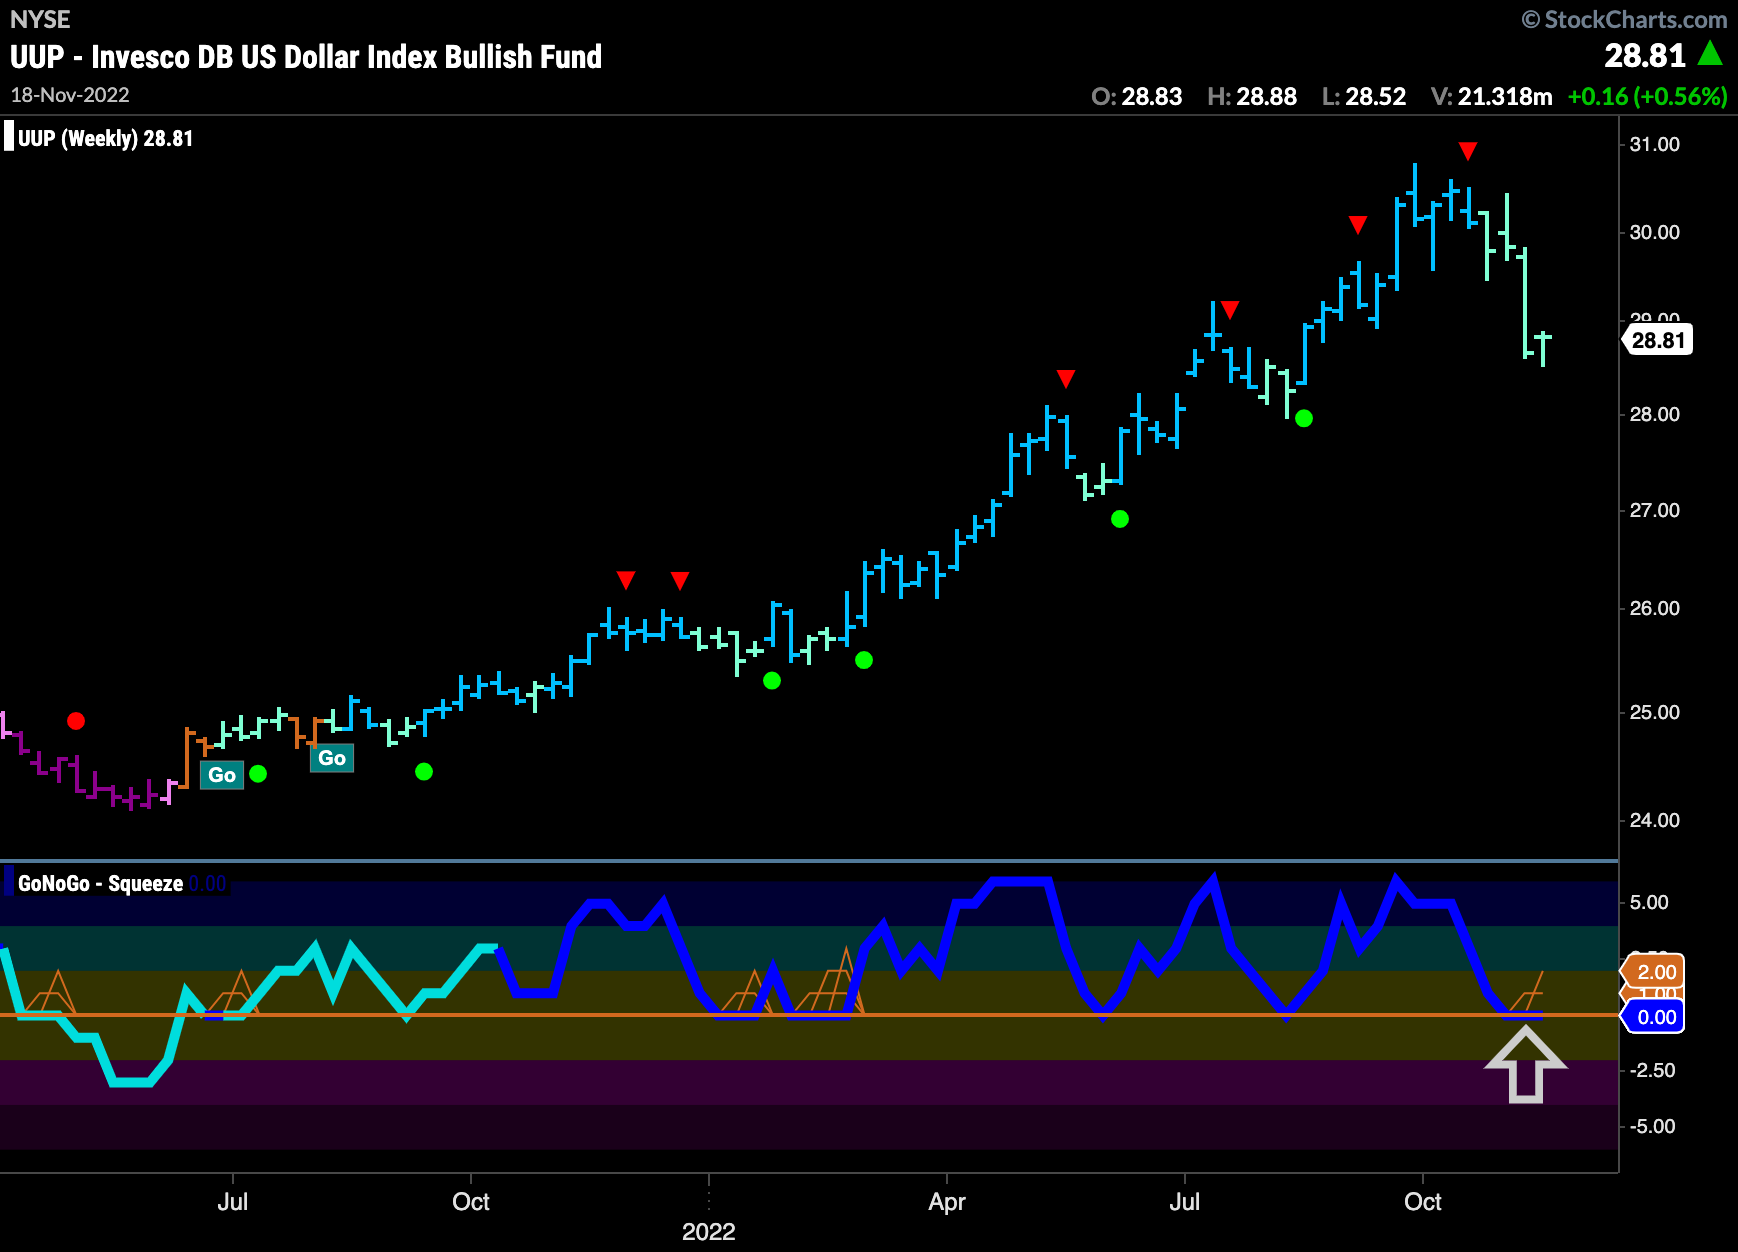
We can see an important inflection point on the weekly chart of $UUP. Weakening with aqua bars for the 4th week in a row, we see price correct heavily from the highs. GoNoGo Oscillator has fallen sharply to test the zero line and it has remained there for a second week. We will watch now to see if support is found at this level on the long term chart.
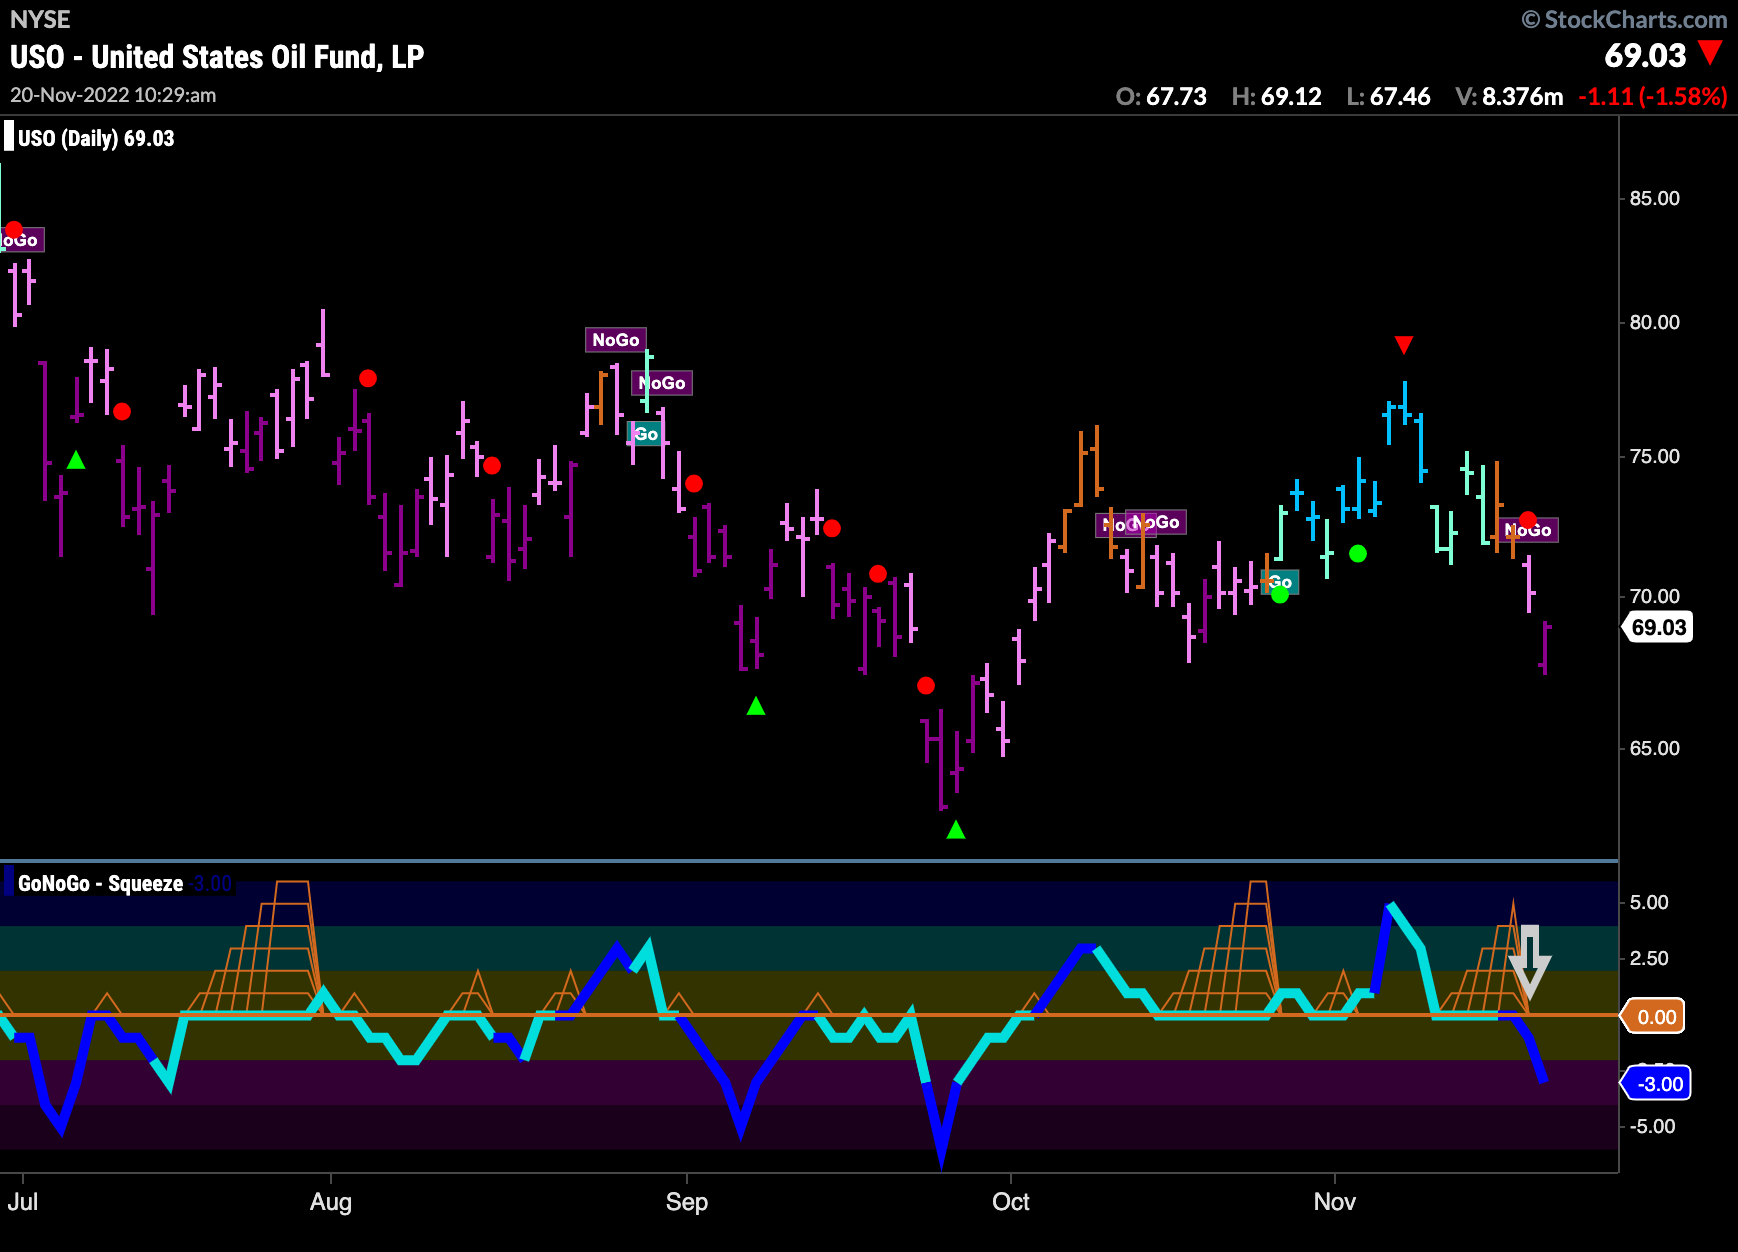
No Support for Oil at the Zero Line
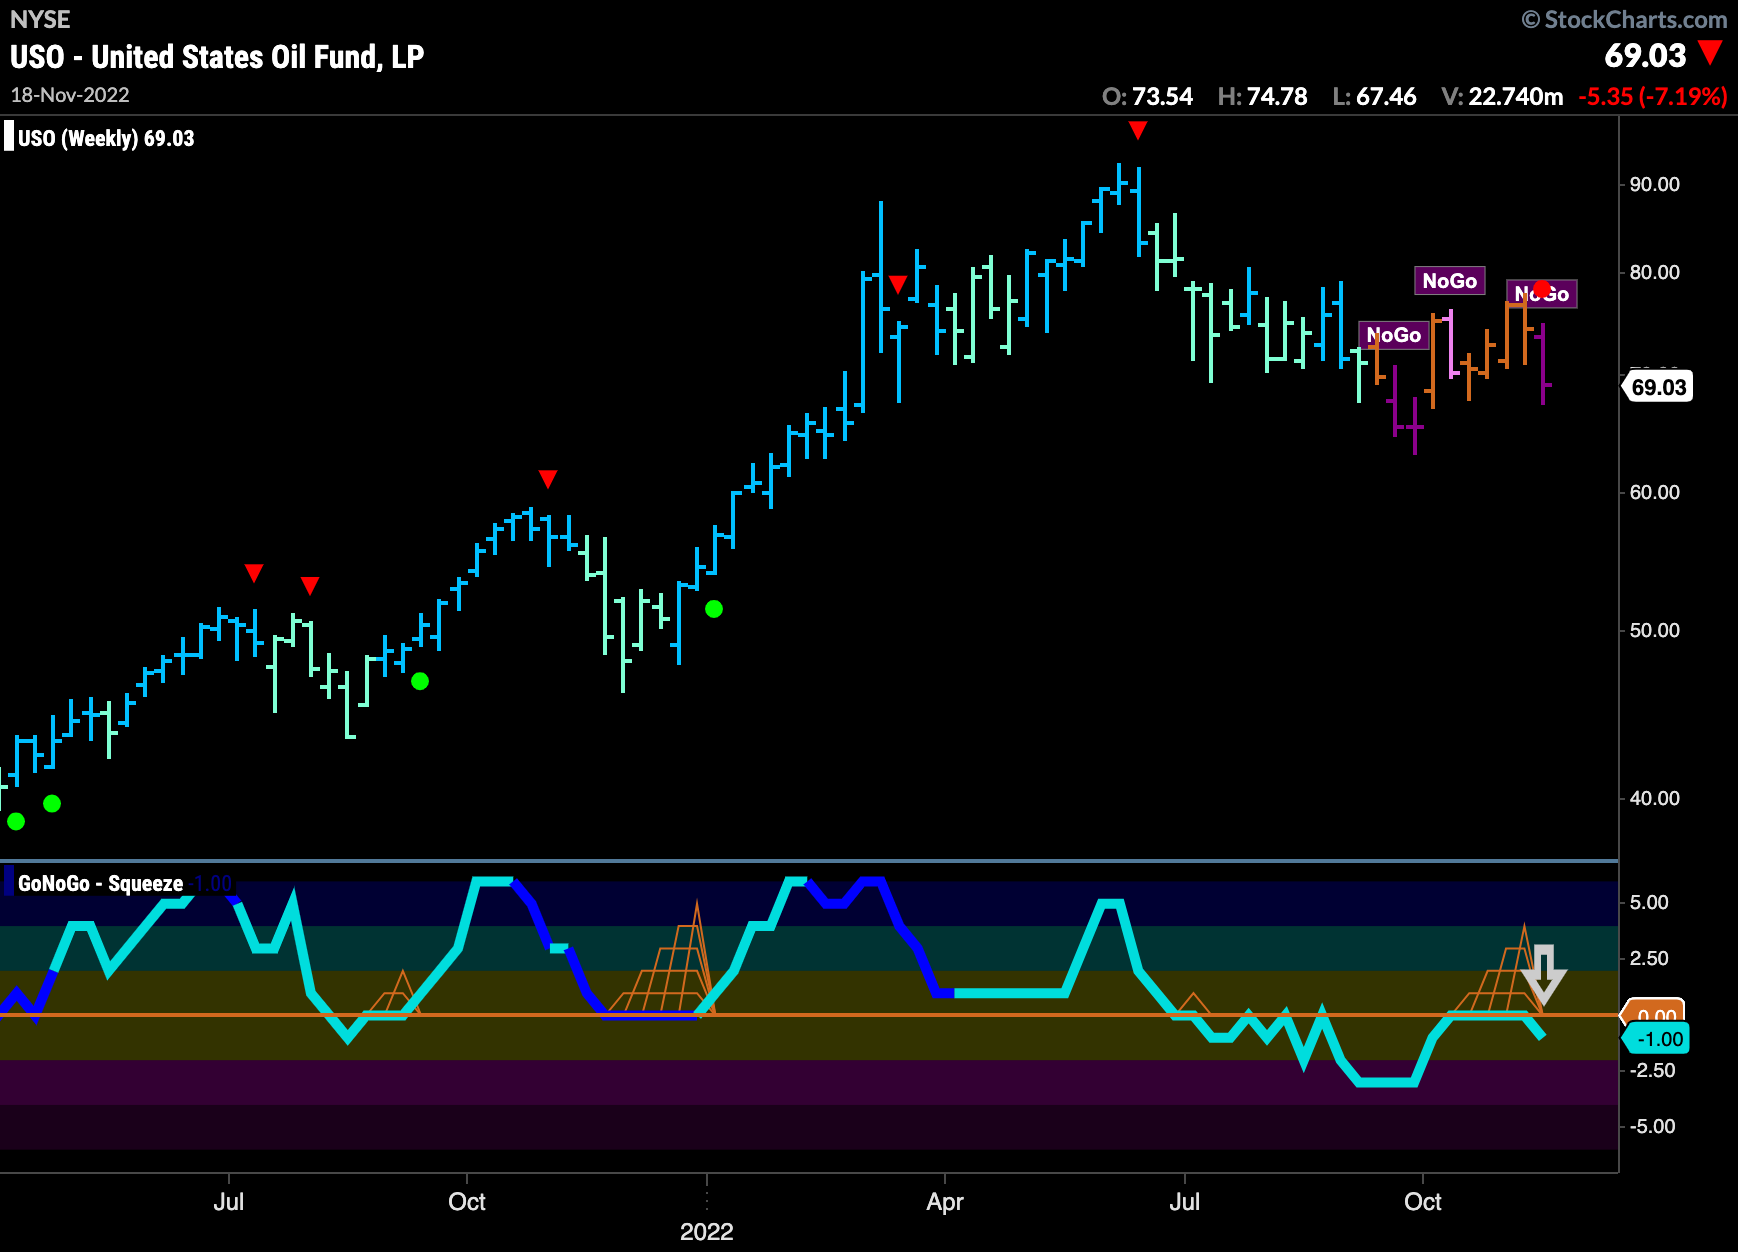
After a brief “Go” trend we see GoNoGo Trend cycle through amber “Go Fish” bars, then pink and now purple “NoGo” bars. Last week we noted that GoNoGo Oscillator had fallen to test the zero line where we would look for support. A GoNoGo Squeeze was formed but ultimately support was not found as the oscillator broke out of the GoNoGo Squeeze into negative territory on heavy volume, confirming the price action above.
More worrying is that the larger time frame chart has re-entered a “NoGo” trend as GoNoGo Oscillator has been rejected by the zero line, breaking out of a GoNoGo Squeeze into negative territory. This suggests momentum and trend are now in line. We can expect some downward pressure.
Sector RelMap
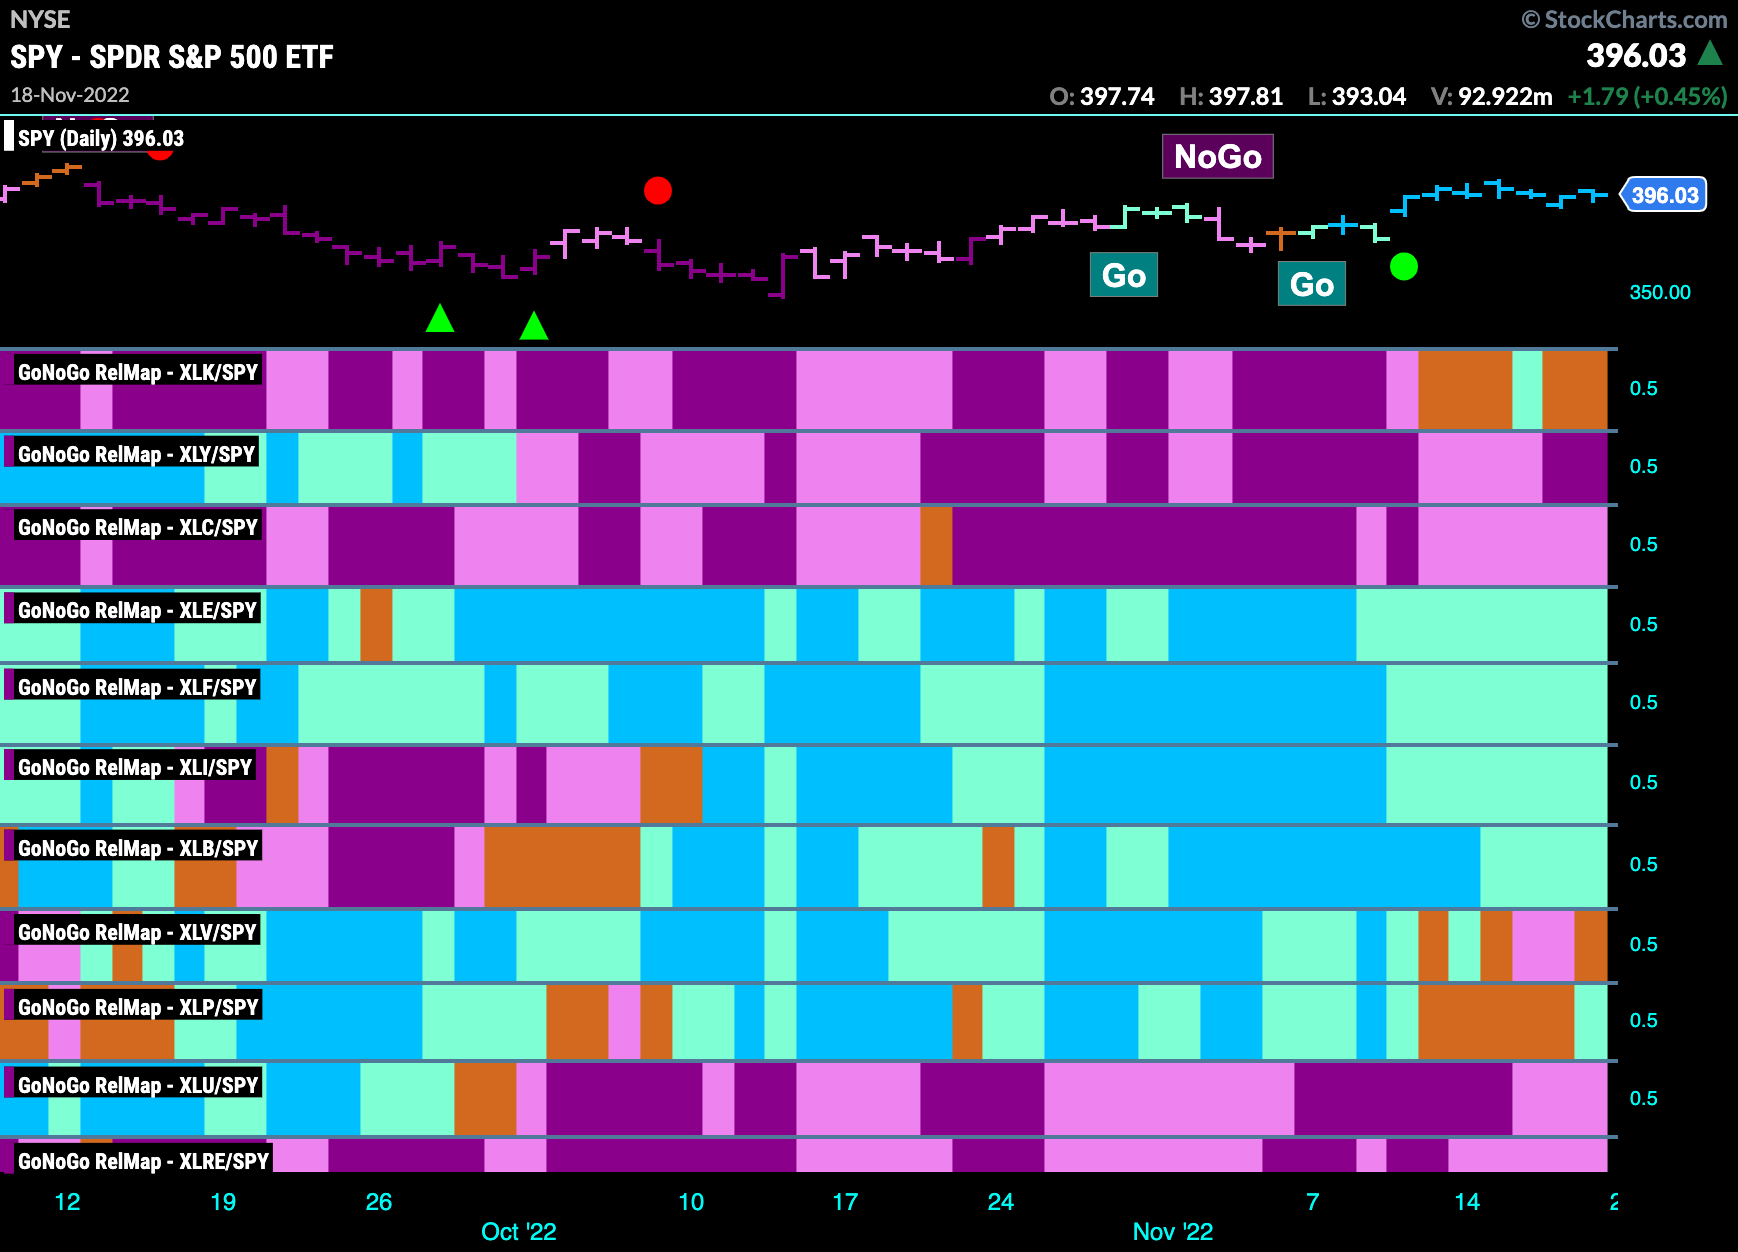
Below is the GoNoGo Sector RelMap. This GoNoGo RelMap applies the GoNoGo Trend to the relative strength ratios of the sectors to the base index. Looking at this map, we can quickly see where the relative outperformance is coming from as well as which sectors are lagging on a relative basis. The out-performers remain the same. Energy, financials, industrials and materials are all in “Go” trends relative to the index as a whole. Technology struggled to shake the amber “Go Fish” bars this week ending the week with uncertainty.
Gold finally a “Go”
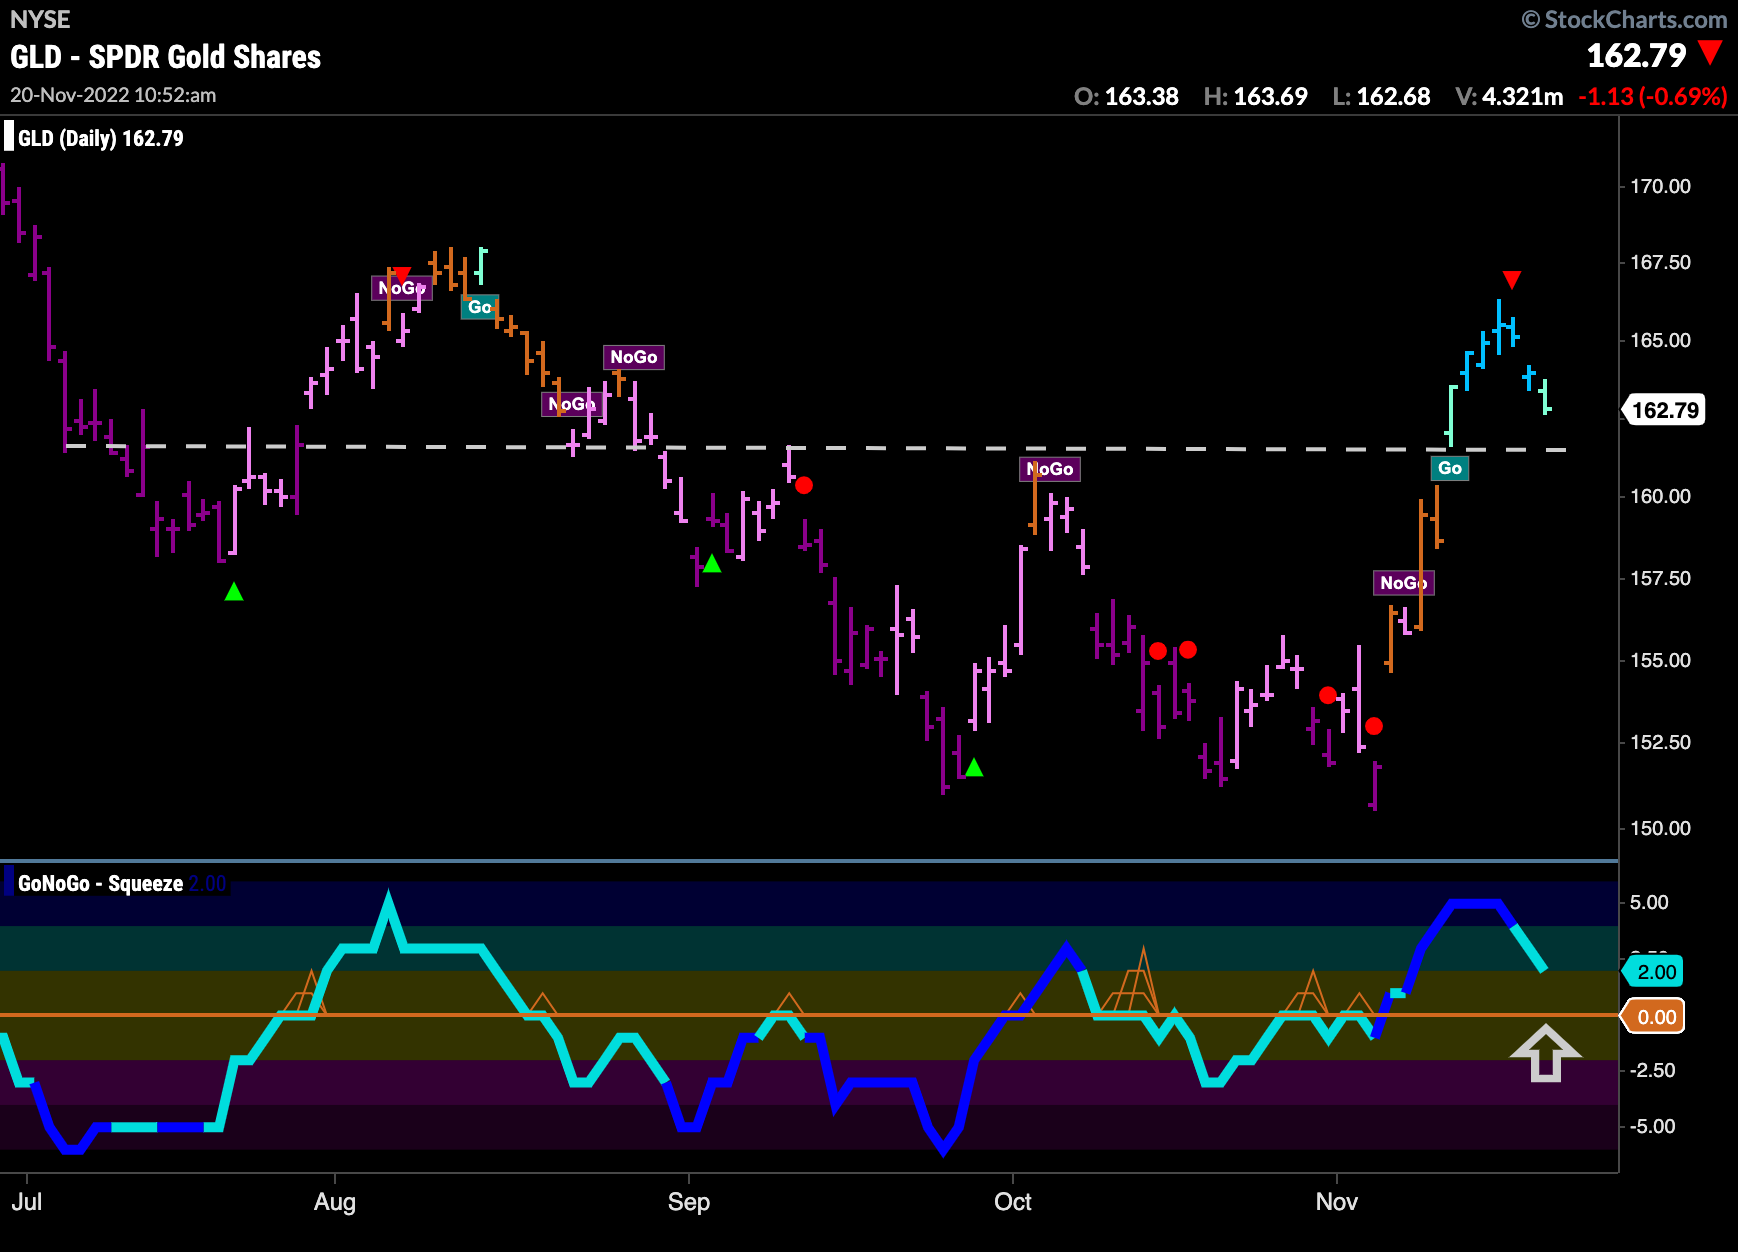
With the industrial sectors performing well, we finally see some strength in $GLD. After a poor run for most of this year, Gold has rallied strongly over the last few weeks with a “Go” trend emerging as price broke above horizontal resistance. Having corrected from the high (identified by the Go Countertrend Correction red arrow), price is approaching a level of support. Polarity suggests that what was once resistance should become support so we will watch to see if that happens as well as pay attention to the zero line as GoNoGo Oscillator falls closer to it.
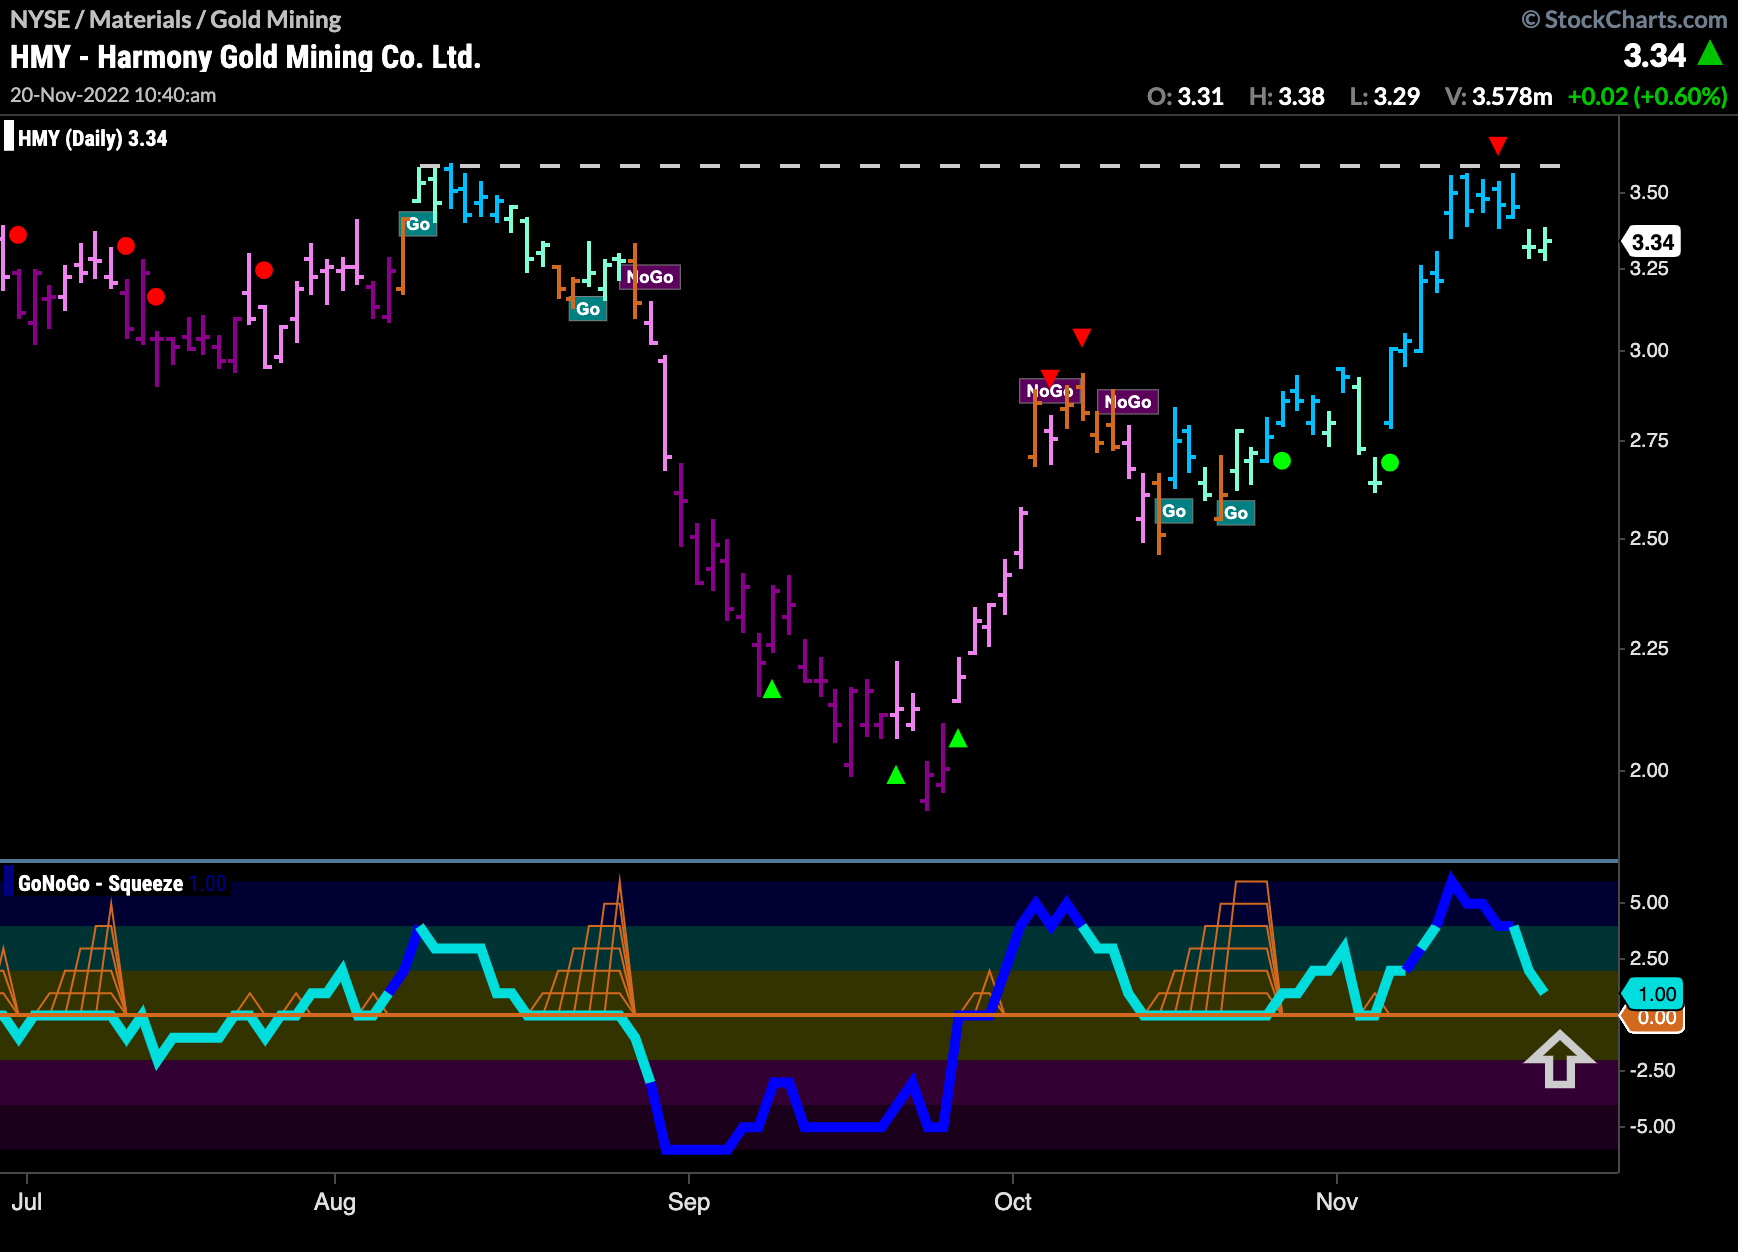
Harmony to Make Another Attempt on Prior High?
$HMY, a gold mining company, has outperformed gold in its own “Go” trend for the past several weeks. First breaking out of a max GoNoGo Squeeze in late October, price has soared to test prior highs. We will watch now, as it corrects to see if GoNoGo Oscillator finds support at the zero line. If it does, we will know momentum is resurgent in the direction of the “Go” trend and we can expect price to make another attack on the prior high.
