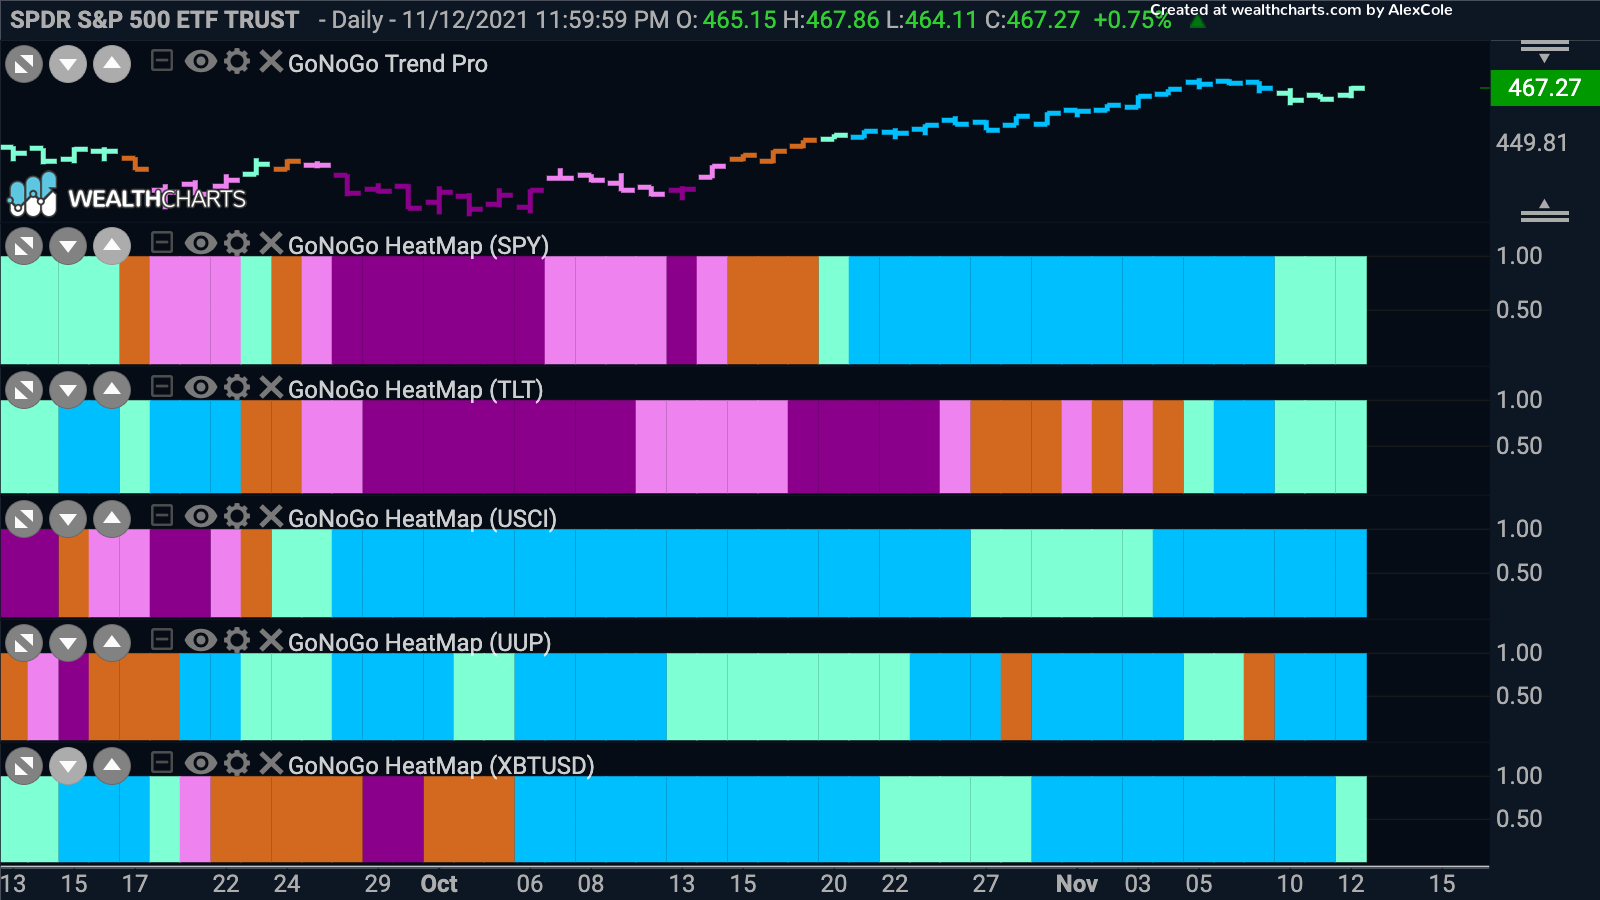

Good morning and welcome to this week’s Flight Path. This is the last full week before the Thanksgiving holiday in the U.S. Let’s take a look at the GoNoGo Asset Map below. The trend is still a “Go” in equities although we saw weaker aqua bars to end the week. Treasuries are trying to hang on to a new “Go” trend while the trend in commodities remains very strong. The dollar continues to trend higher as this week saw the “Go” trend hit new highs. Bitcoin is consolidating sideways but maintains its “Go” trend as well.

Sector Strength
Below is a GoNoGo Sector RelMap. The chart applies the GoNoGo Trend to the relative ratio of each sector ETF to the base ETF, the $SPY. There are four sectors that are showing relative “Go” trends to end the week. Materials ($XLB), discretionary ($XLY), energy ($XLE) and technology ($XLK). This are the same 4 sectors that were outperforming a week ago and so the relatively new trends in materials and technology have persisted. The apparent balance between the technology sector which led throughout the pandemic and the materials being poised to outperform during a growing economy feels bullish.

$NET returns?
As we’ve noted for a few weeks now the trend is back in technology. Cloudflare Inc is a global cloud services provider and below is the GoNoGo Trend and GoNoGo Oscillator applied to a 4hr chart. The overall trend is incredibly strong for $NET and so we can move to a lower timeframe if we are looking to participate. We see several low risk entry points by way of Go Trend Continuation green circles with the most recent being on the current bar. This tells us that momentum has returned in the direction of the “Go” trend as the oscillator has found support at the zero line. Look for price to try to surpass recent highs above $217.

More Moves for Materials
The materials sector is outperforming. Let’s take a look in a little more detail at the performance of the sector to get an overall picture of the technical environment of the sector. The chart below shows the relative trend of the sector to the overall index. The GoNoGo Trend and Oscillator are applied to the ratio of $XLB to $SPY. As the GoNoGo Trend strengthens (strong blue bars) following a Go Trend Continuation icon we see that price has made a higher high. The oscillator is currently at overbought levels.

If we look at the pure GoNoGo Chart of $XLB we can see the “Go” trend is more established. After GoNoGo Oscillator crossed above the zero line in early October, GoNoGo Trend painted a string of “Go Fish” bars and then followed through by identifying a “Go” trend that has gone from strength to strength as we’ve seen a succession of strong blue bars as price has raced to new highs.

How does this look from a longer term perspective? Very good actually. The chart below is the weekly chart showing the GoNoGo Trend and GoNoGo Oscillator applied. We can see that as GoNoGo Oscillator mostly found support at the zero line after riding that level during the consolidation in price, it then burst back into positive territory which gave us a Go Trend continuation green circle that has led to price rallying strongly and breaking above resistance from prior highs.

Steel Positioned for a Move
If we are seeing strength in materials, let’s take a look at the steel giant, U.S. Steel, $X. The daily chart below shows the GoNoGo Trend and GoNoGo Oscillator and we see that after identifying the new “Go” trend price has moved sideways. The GoNoGo Oscillator has been above the zero line and is now looking to that level for support. If it can bounce back into positive territory we would expect price to set a new high and challenge prior highs just above $30.

Zooming out to a weekly GoNoGo Chart, we can see that is is a pivotal moment. After the “Go” trend was threatened and the indicator fell out of trend painting a pink and a few amber “Go Fish” bars, the trend has resumed on weak aqua “Go” bars. At the same time, the GoNoGo Oscillator is testing the zero line from below on heavy volume. We will want to see the oscillator break back into positive territory which will indicate that momentum has returned in the direction of the “Go” trend. If this can happen, we can then look for price to stage an attack on prior highs.


