Good morning and welcome to this week’s Flight Path. Let’s take a look at the GoNoGo Asset map below. Risk on appears to be taking hold across most markets this week. Equities are in a strong “Go” trend again to end the week. Treasury bond prices are on the rise and in a strong “Go” trend as well. Commodities have returned to paint strong blue “Go” bars also as the dollar continues to struggle providing a tailwind for risky assets. 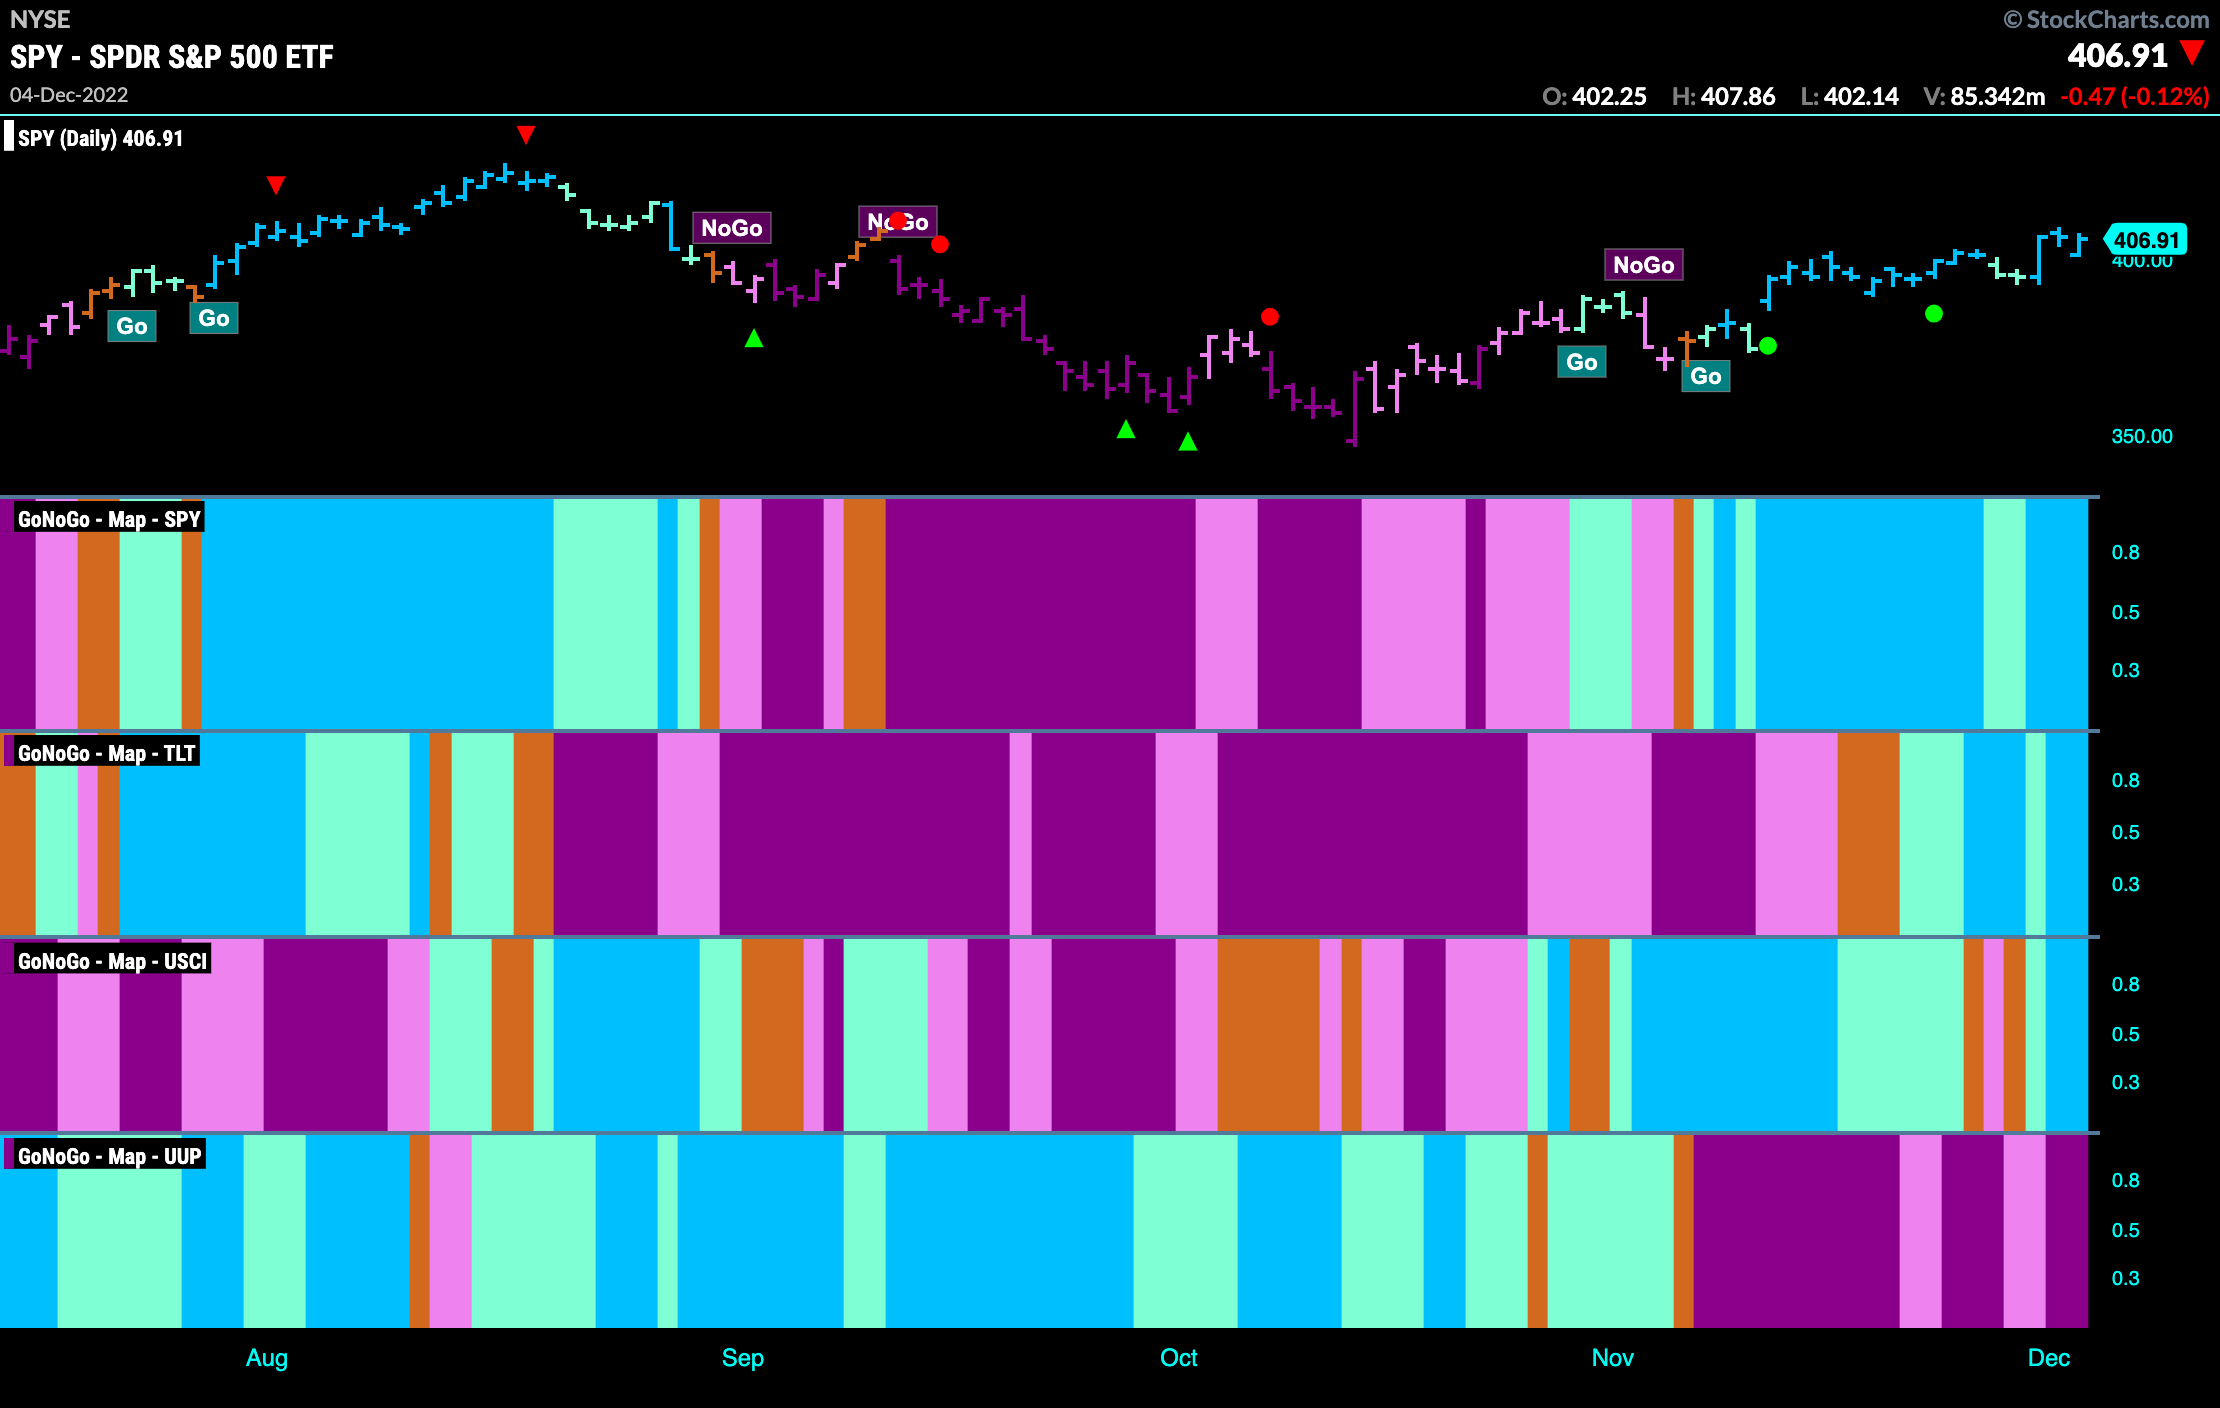
S&P 500 Sets Another Higher High
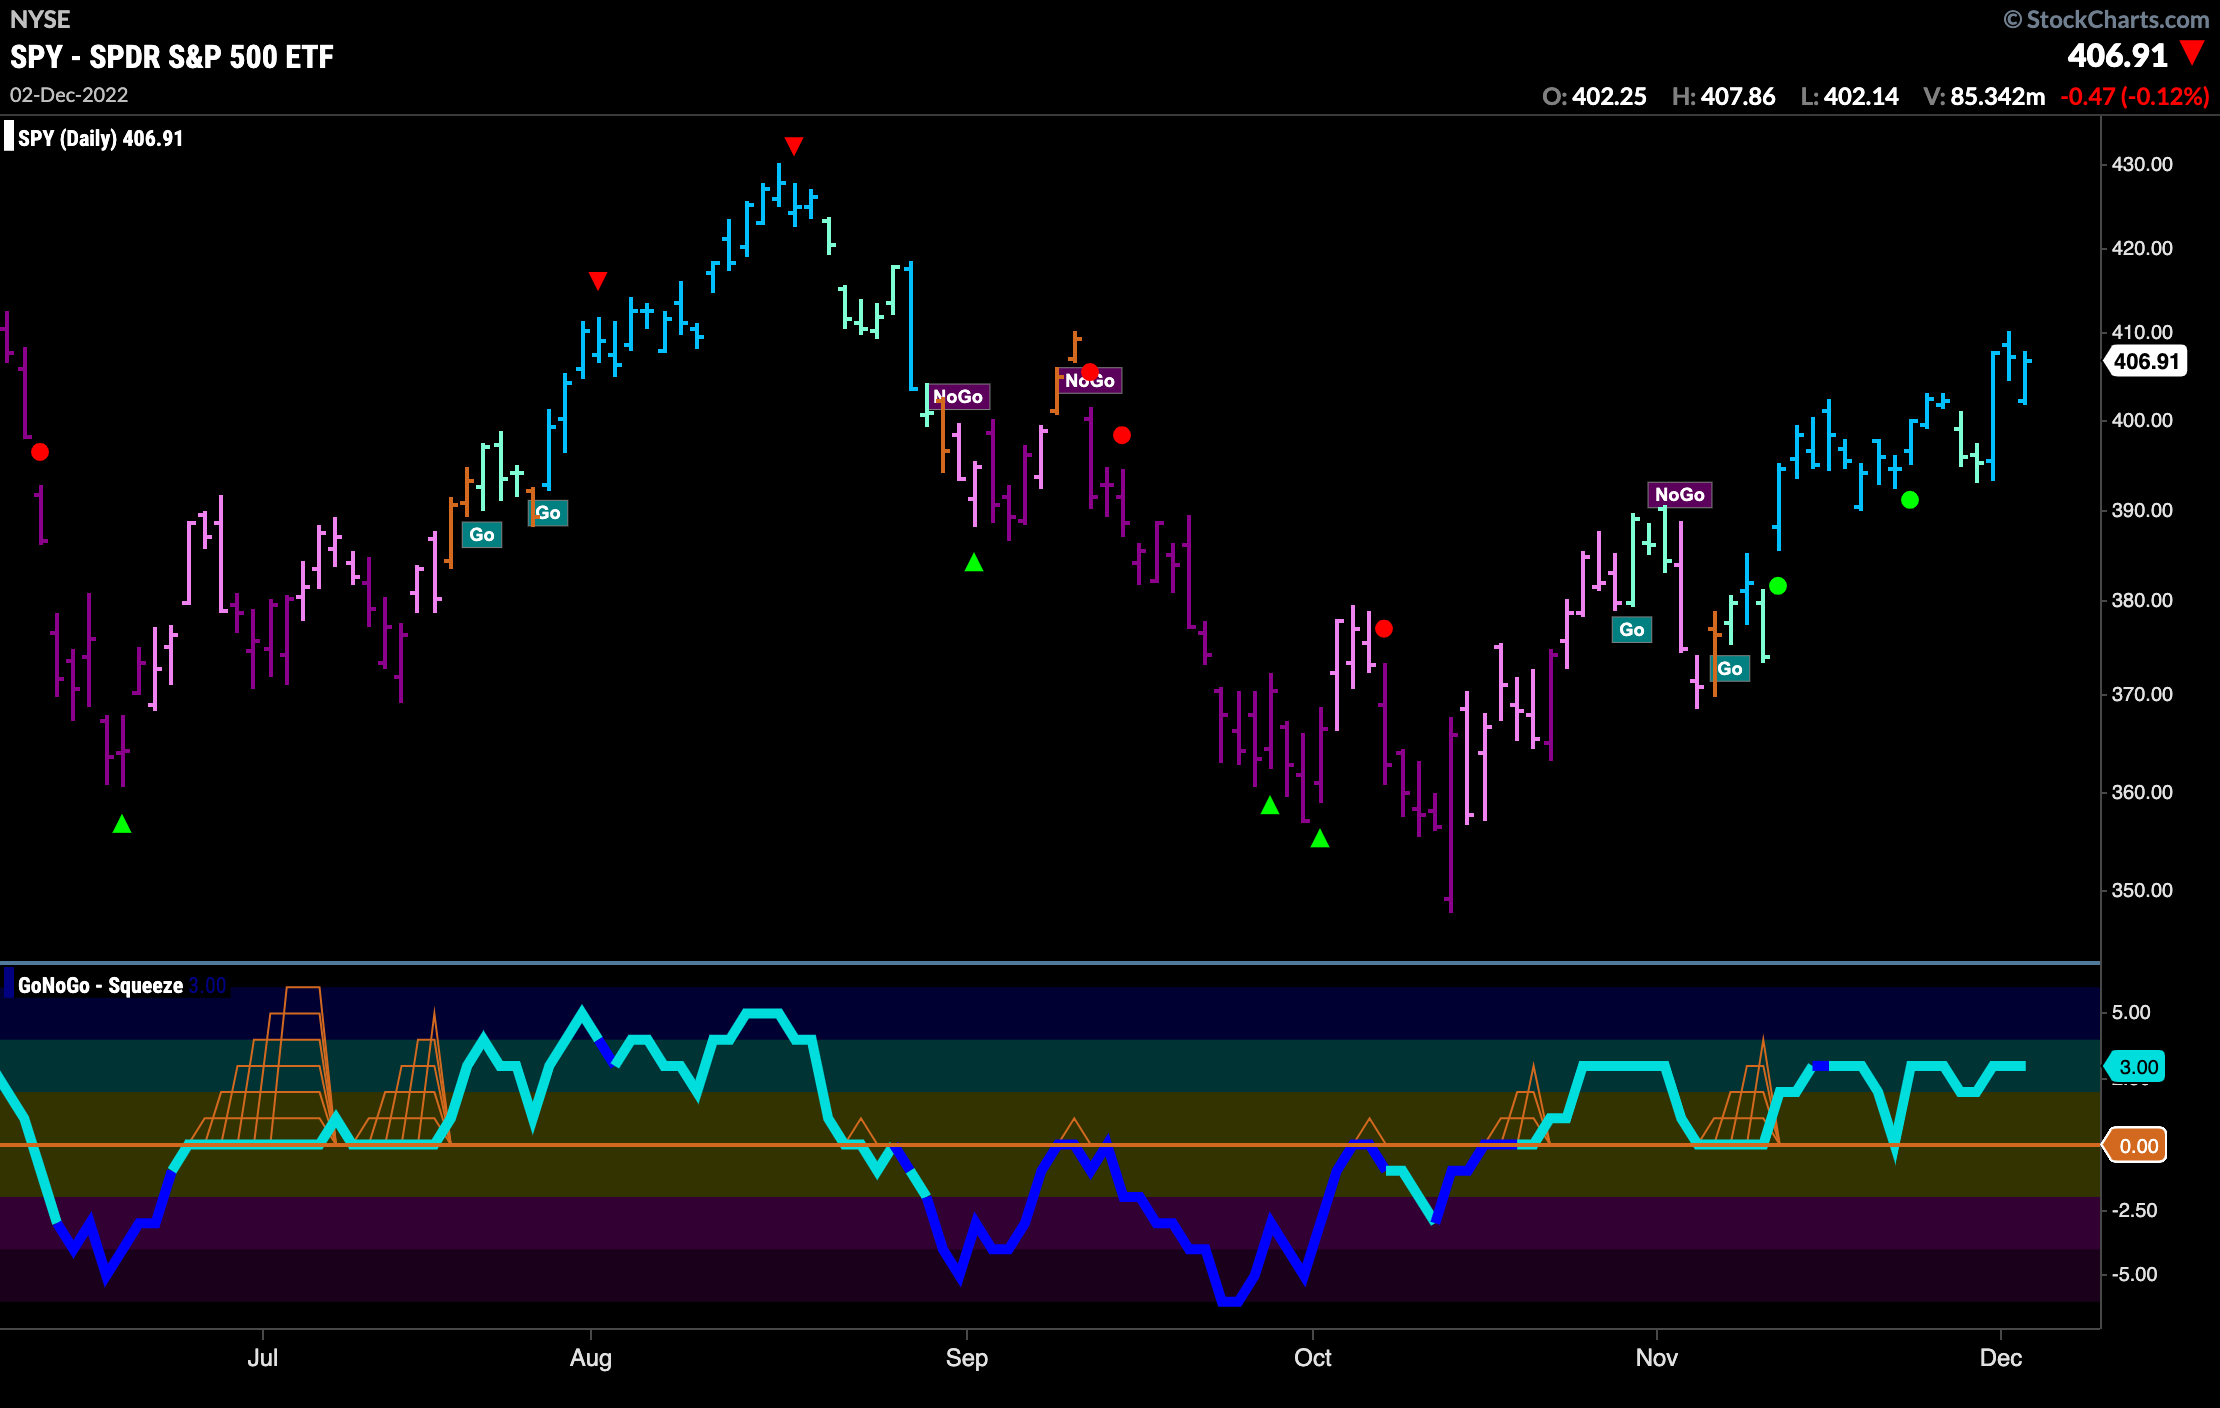
The “Go” trend continues as we see a new high on strong blue “Go” bars this week. Wednesday’s strong bar was encouraging after a few weaker aqua bars to start the week. GoNoGo Oscillator remains in positive territory but not yet overbought indicating that there might be some room to run as momentum remains on the side of the “Go” trend in positive territory.
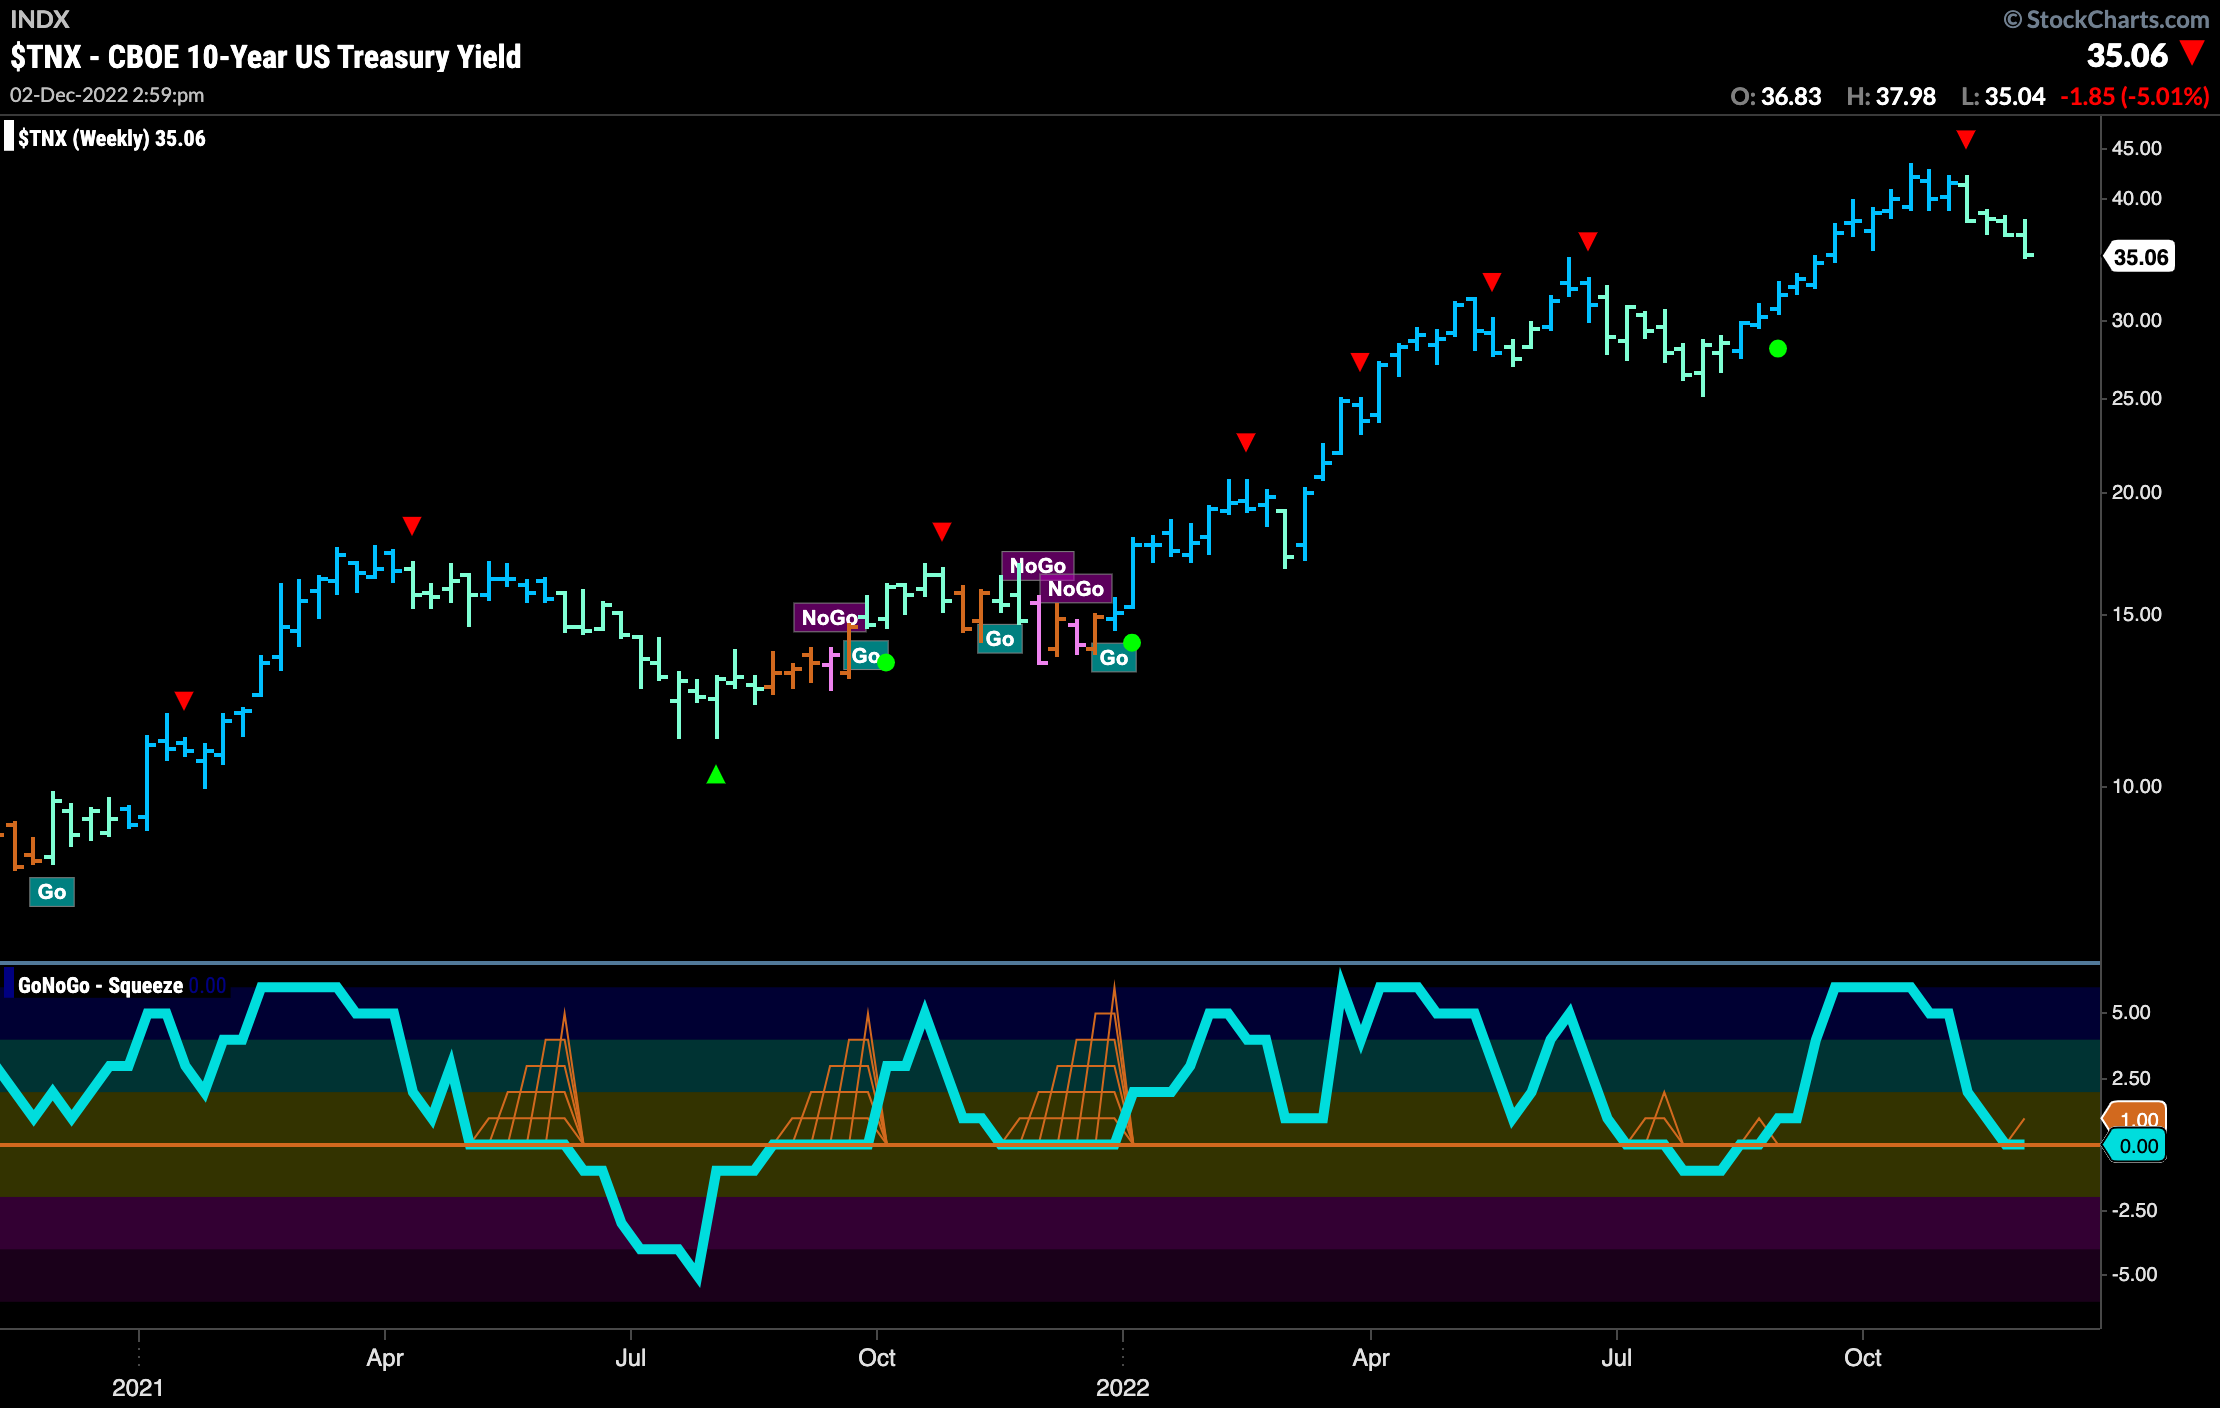
Treasury Rates Fall to New Lows in “NoGo”
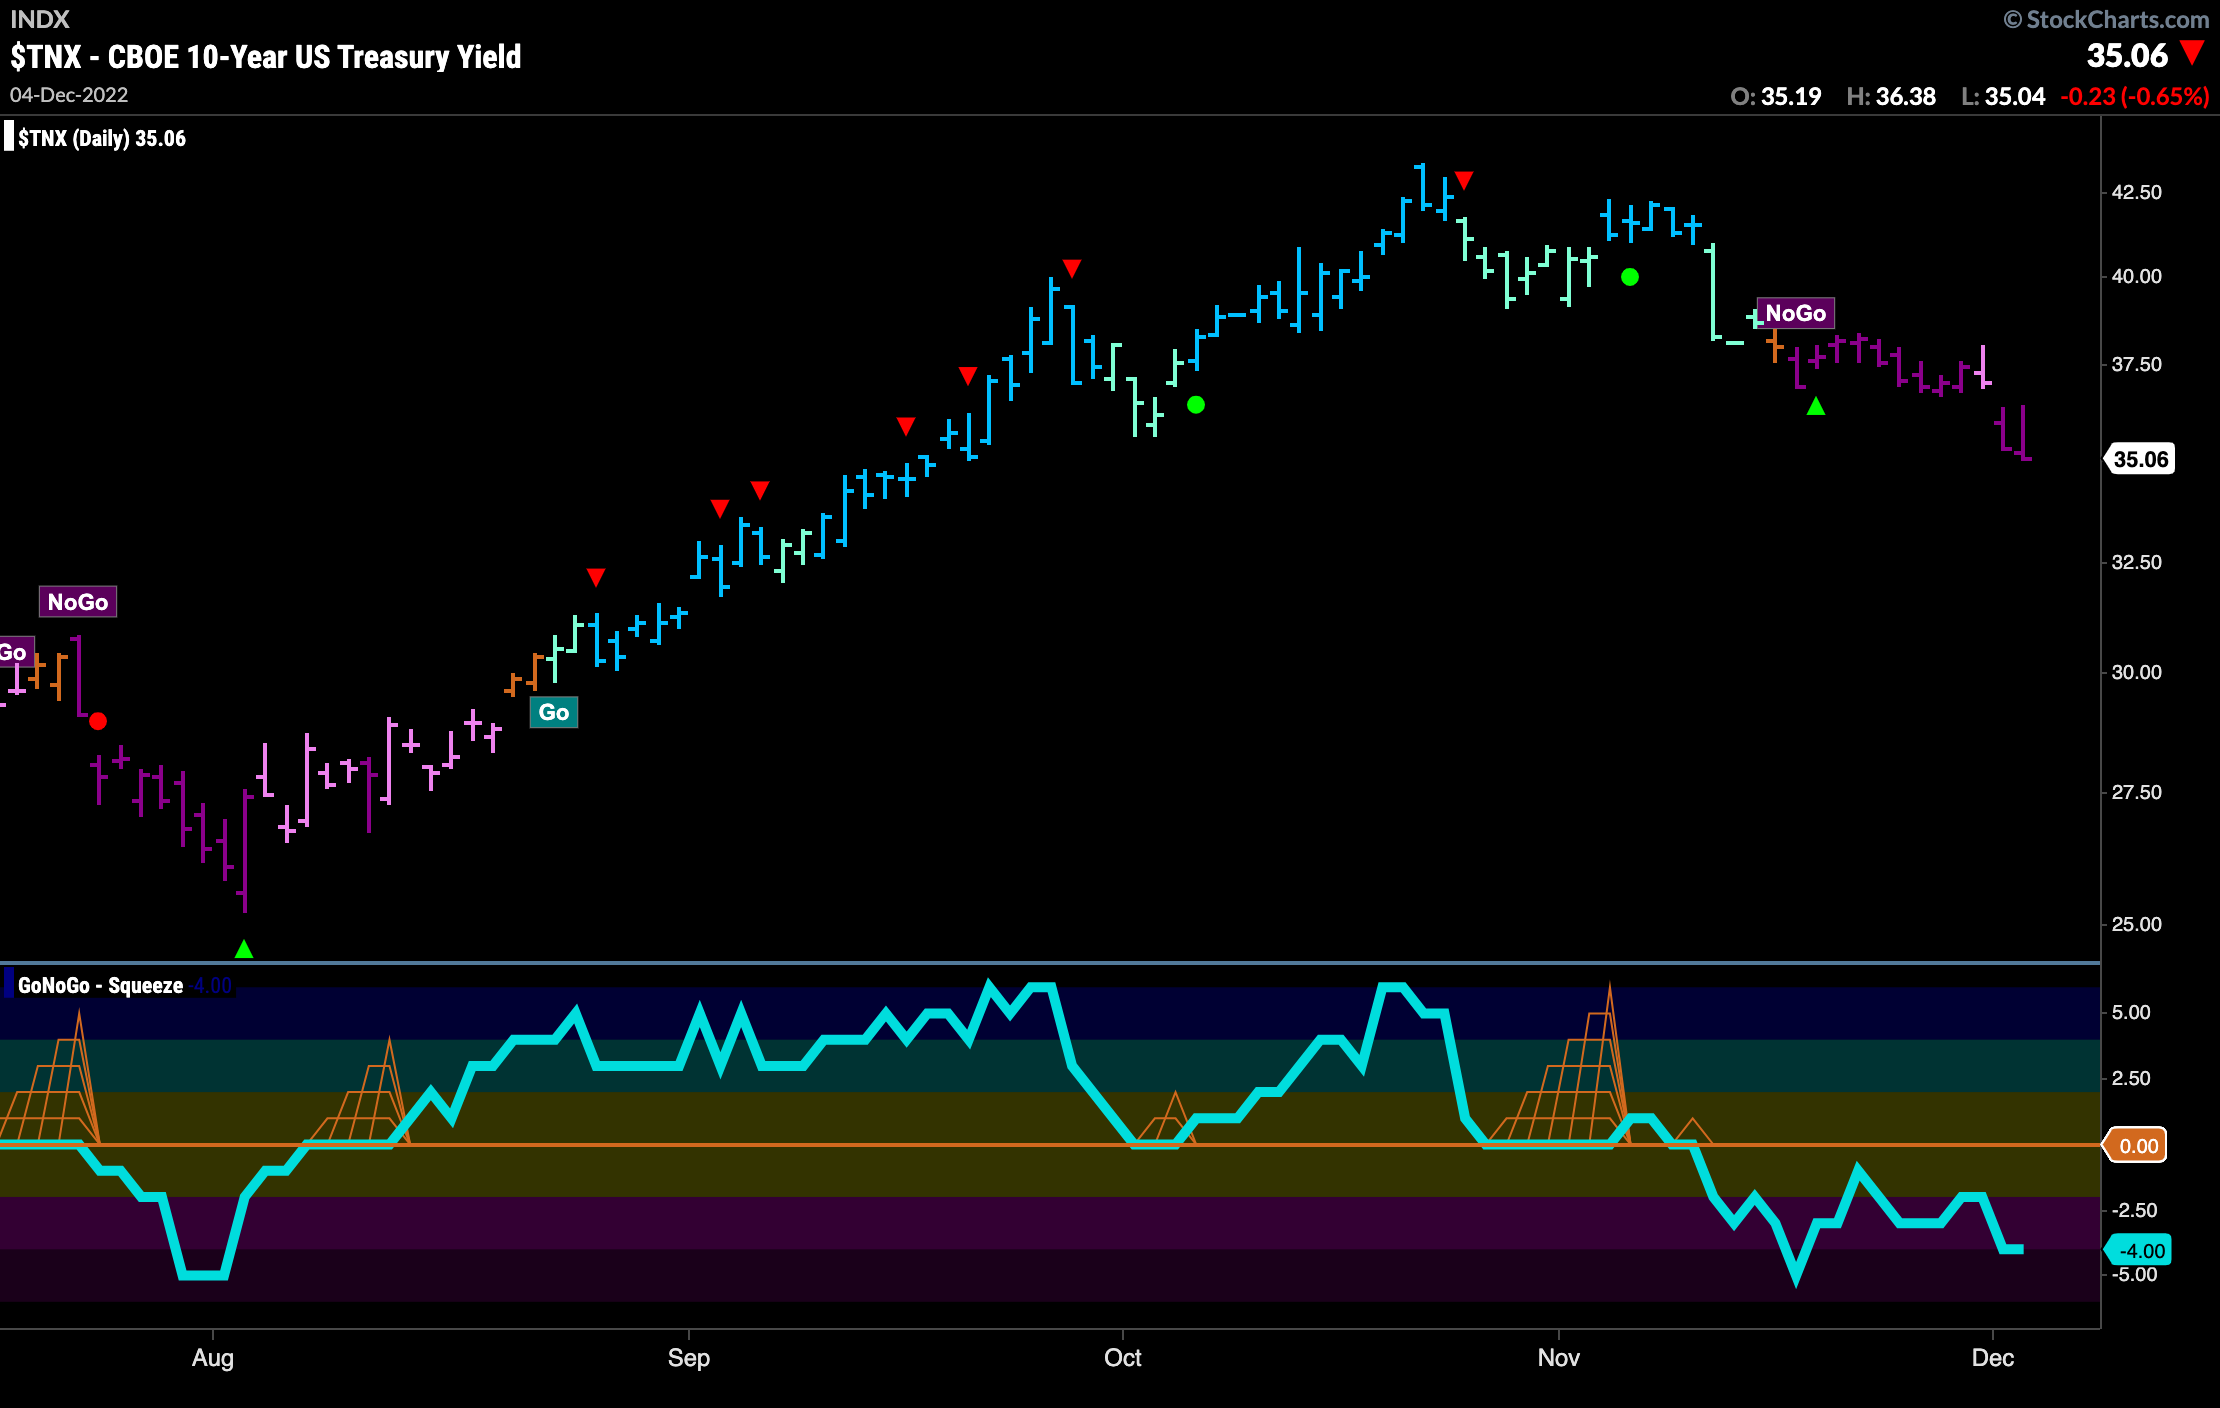
We had seen price gradually move lower after entering the “NoGo” trend. To end this last week, price fell to new lows on strong purple ‘NoGo” bars. GoNoGo Oscillator has been in negative territory since breaking below the zero line earlier in November. This continued weakness is also likely to be a tailwind for risk assets such as U.S. equities.
Having said that we must remember that the larger trend for rates is a “Go”. We have seen some relief from the rising rate environment of late but if we look at the longer term weekly chart below we can see that the trend is a “Go”. Yes, we are seeing weakness with aqua “Go” bars but the trend is still in place. GoNoGo Oscillator is at an important inflection point as it tests the zero line from above where we will look to see if it finds support. Support would suggest that the “Go” trend will continue in the long term. A break below zero would threaten that position.
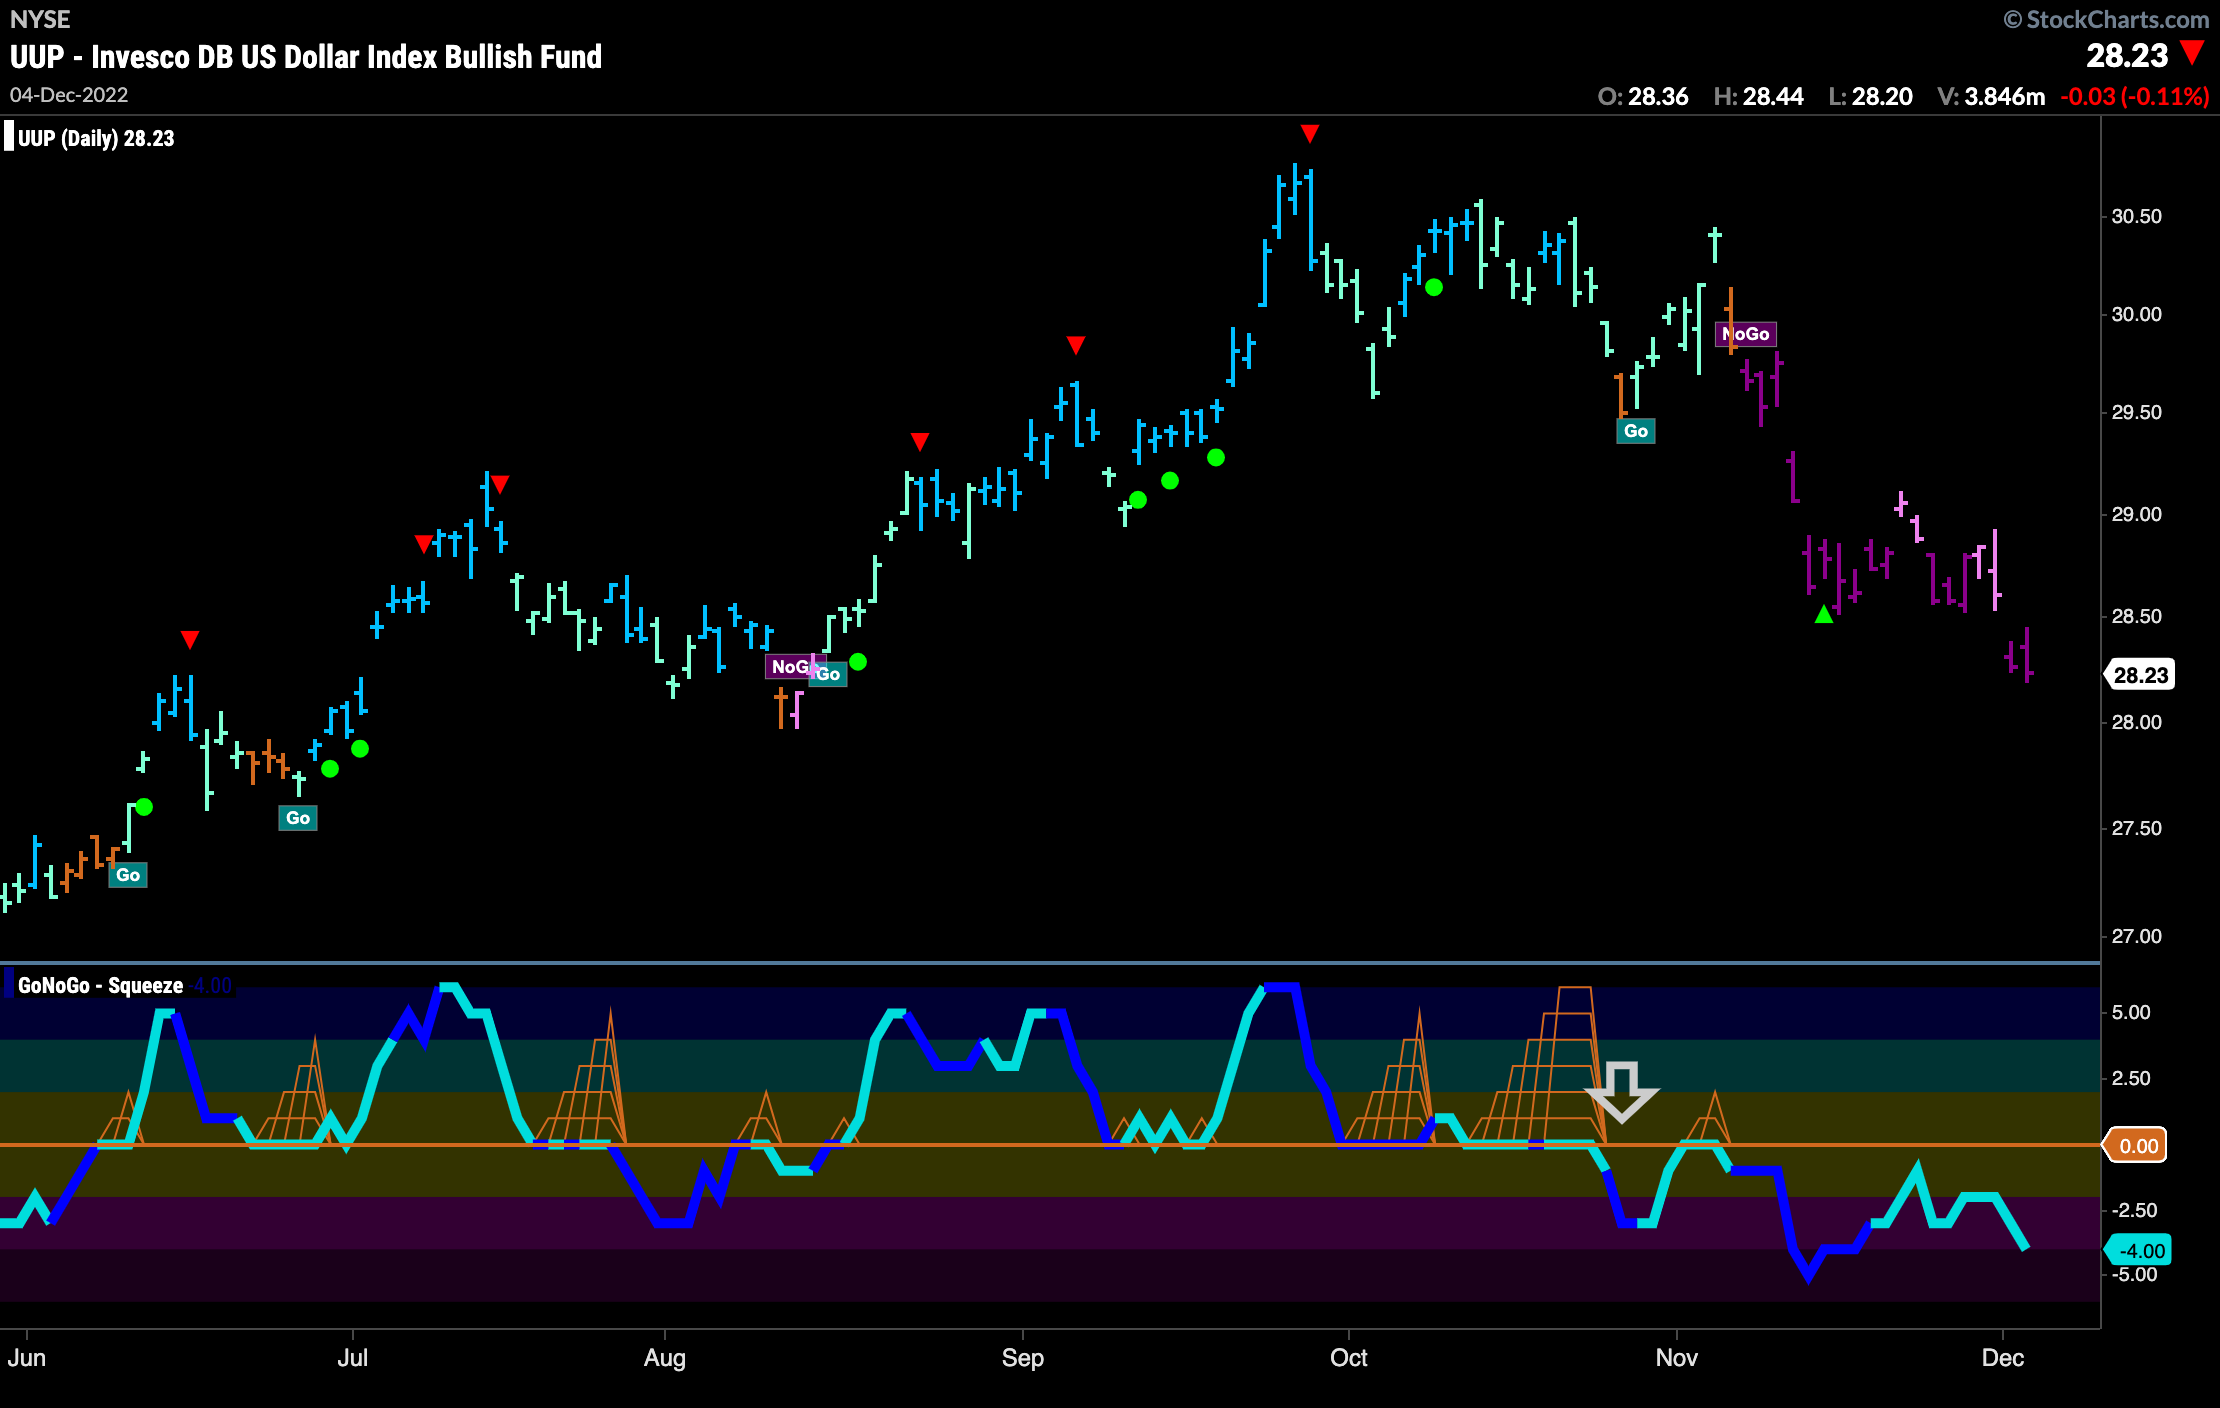
The Dollar Moves Lower
Although its initial fall was sharper than that of treasury rates, price had been stable for a few weeks. The end of last week saw price fall once more to make new lows on strong purple “NoGo” bars. We highlighted the break out of the Max GoNoGo Squeeze in the end of October and since then the oscillator has been below the zero line confirming the bearish price action.
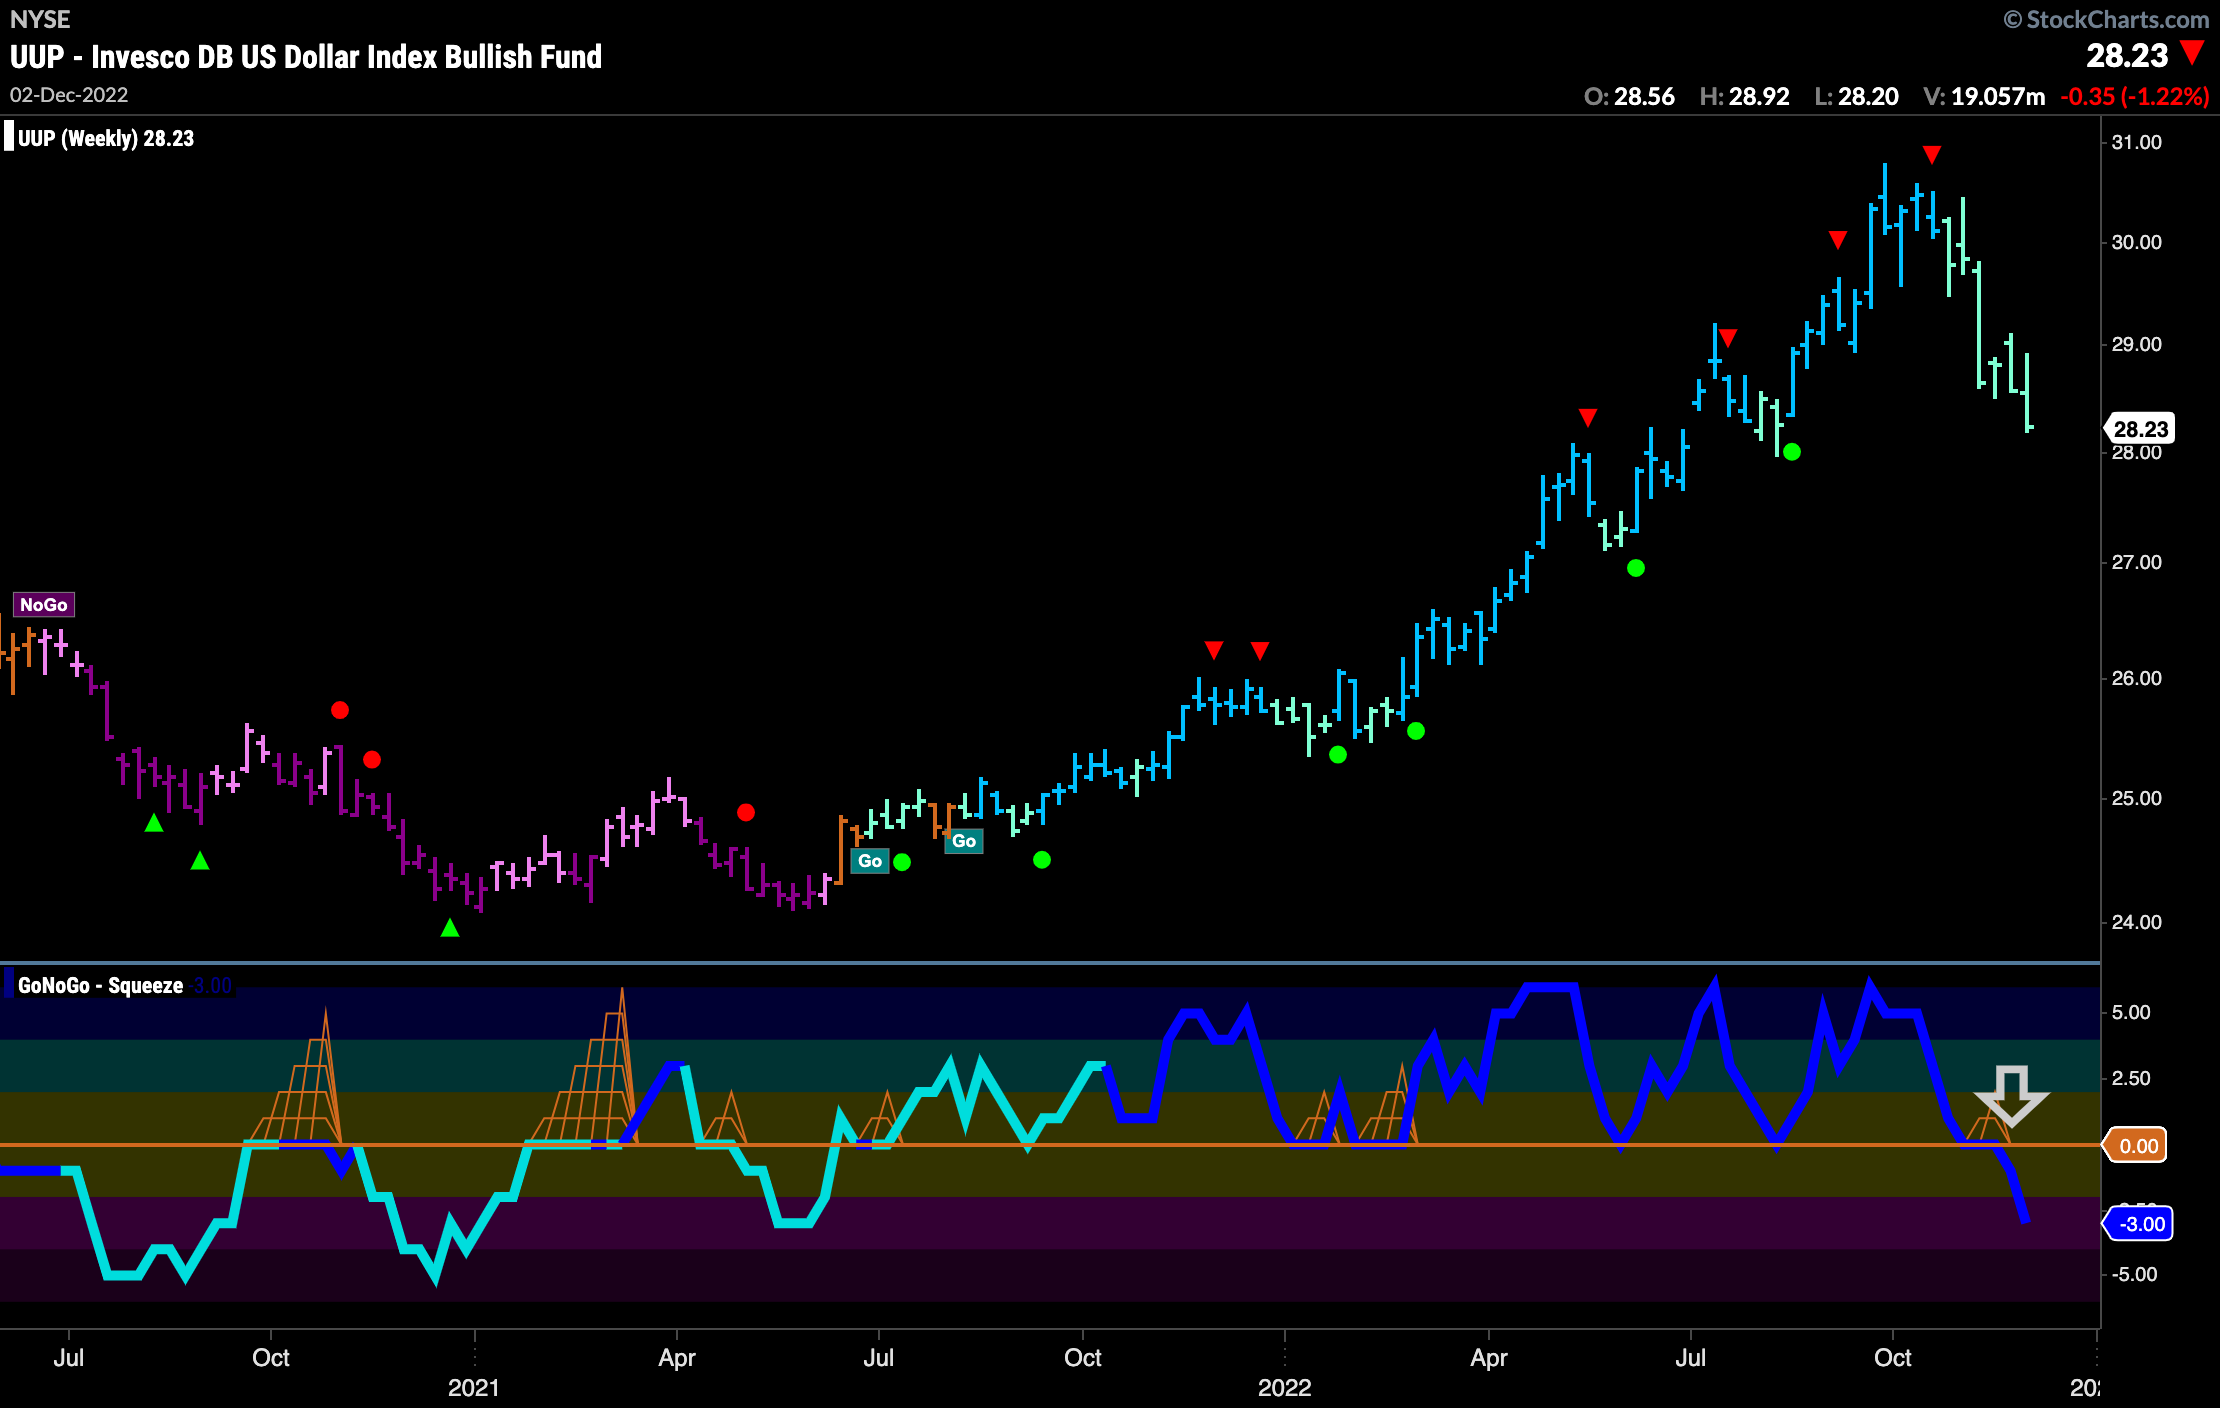
Looking at the weekly chart of $UUP we see a break down that is more destructive than we saw with rates. Moving lower since the Go Countertrend Correction Icon (red arrow) and painting a string of paler aqua bars, we now see something concerning in the oscillator panel. GoNoGo Oscillator has failed to find support at the zero line and has instead crashed through it into negative territory. We know that this shouldn’t happen if the trend is healthy and so this is certainly a worry for the “Go” trend.
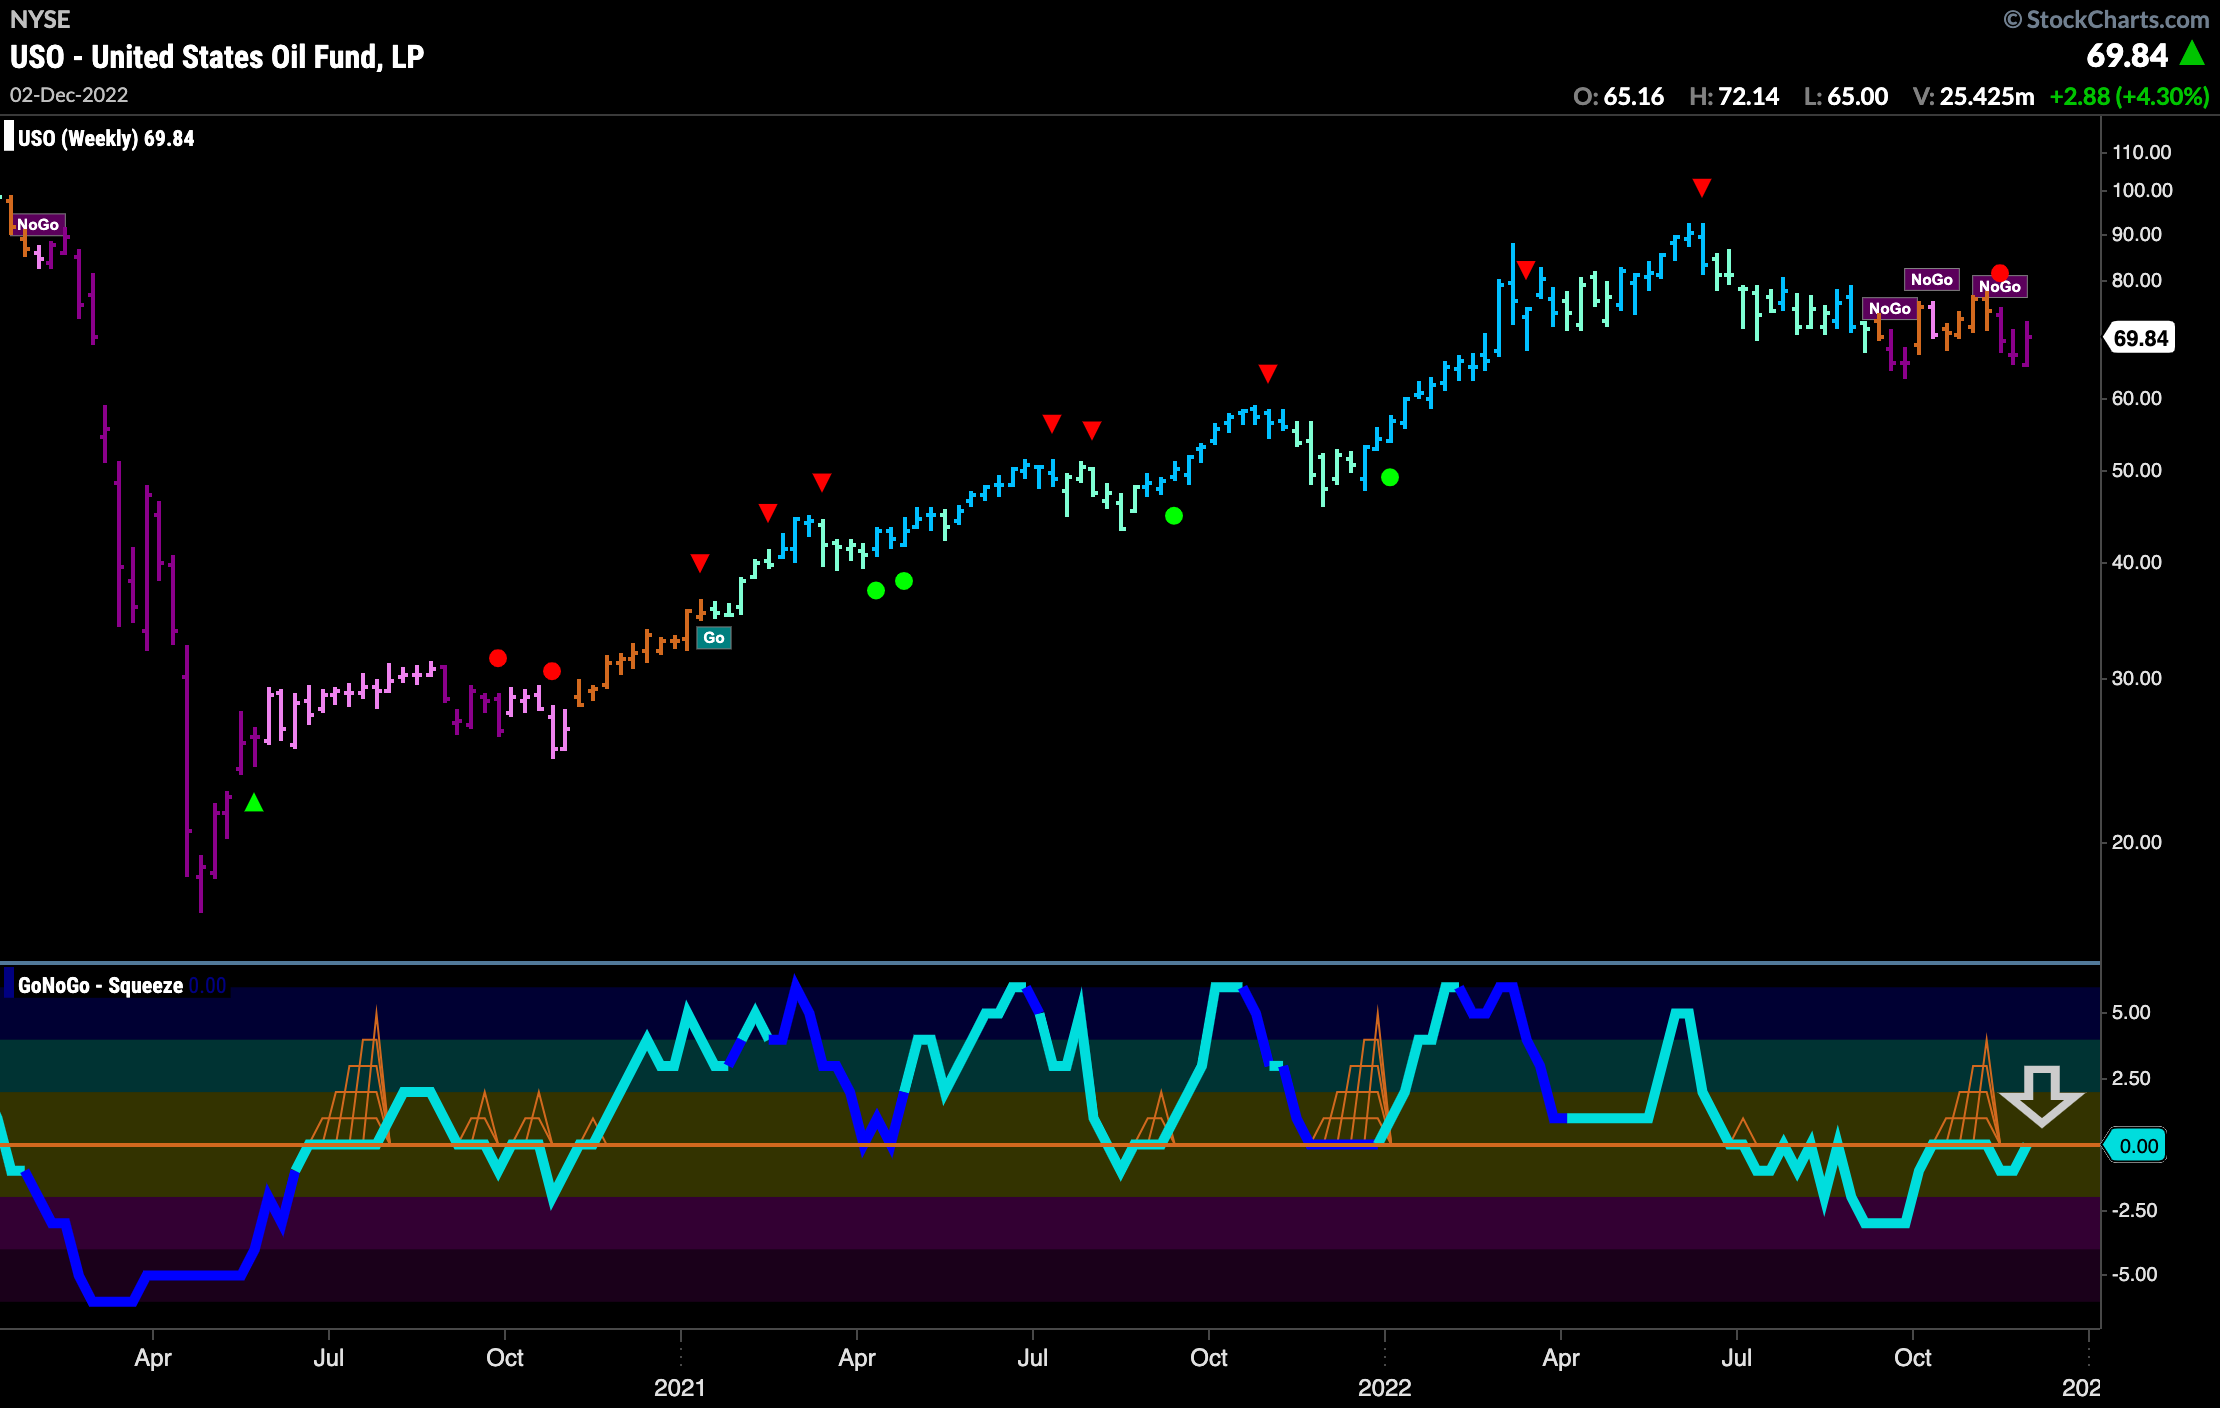
“NoGo” Persists in Long Term Chart of Oil
After several amber “Go Fish” bars that stretched into this last week we saw the return of purple “NoGo” bars as price continues to move mostly sideways since the high was identified by the red arrow. GoNoGo Oscillator has been below the zero line finding resistance at that level and it is back testing zero once again. We will watch to see if this level remains resistance. If it does, we can expect continued downward pressure in the “NoGo”.
Sector RelMap
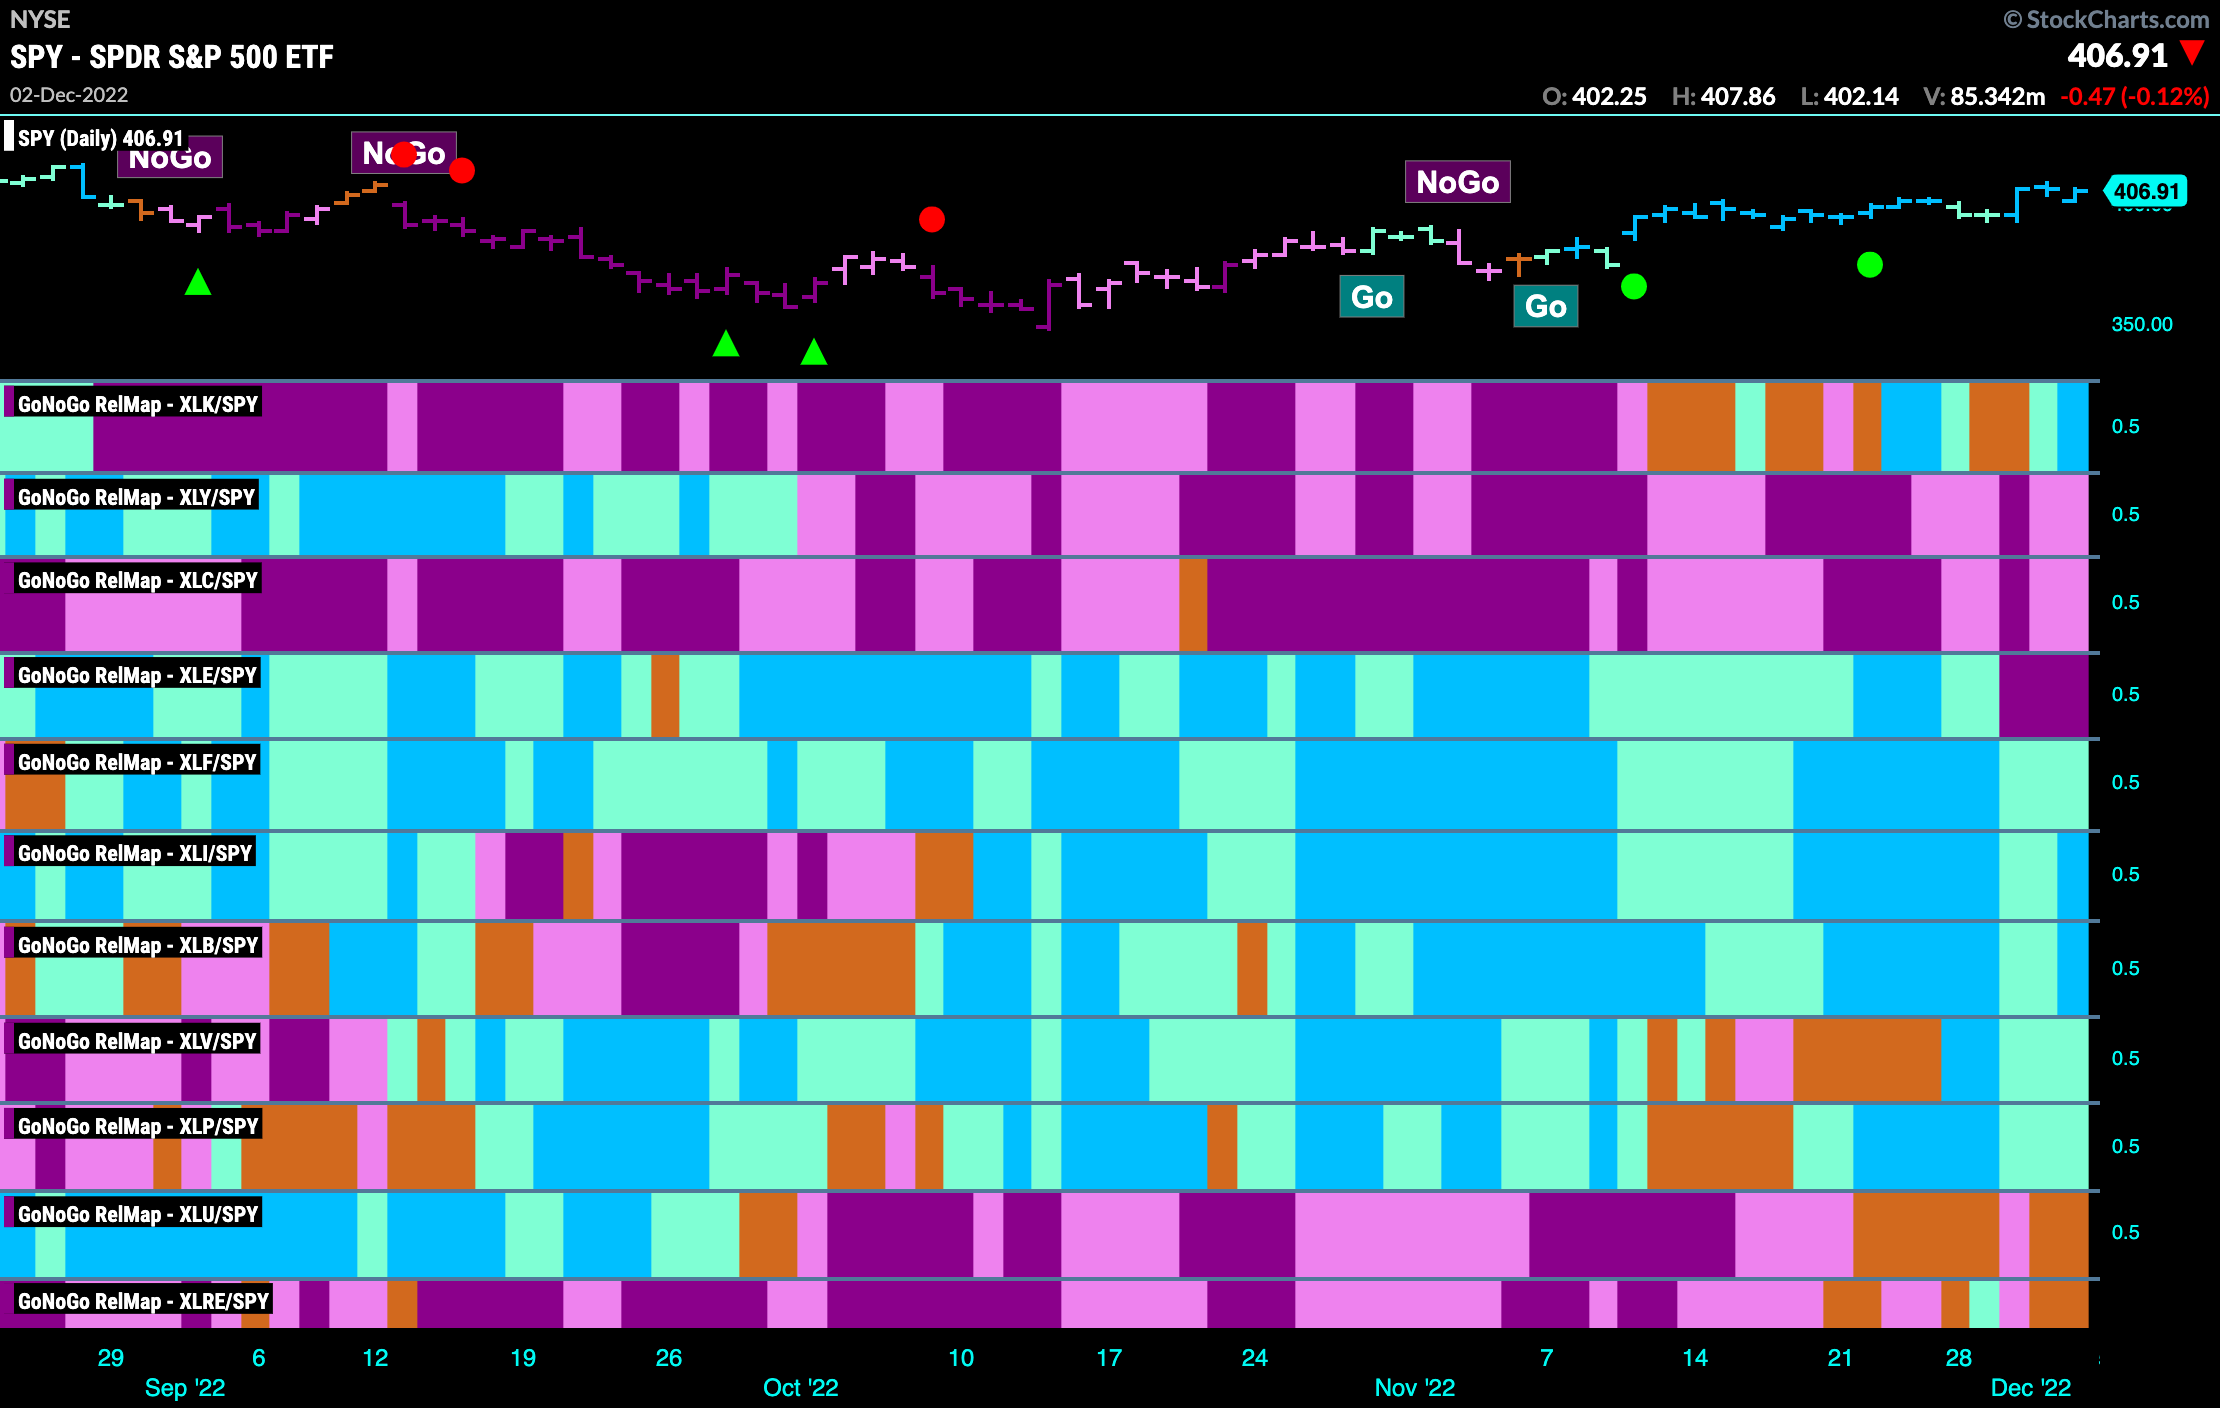
Below is the GoNoGo Sector RelMap. This GoNoGo RelMap applies the GoNoGo Trend to the relative strength ratios of the sectors to the base index. Looking at this map, we can quickly see where the relative outperformance is coming from as well as which sectors are lagging on a relative basis. 6 sectors are outperforming the base this week. $XLF, $XLI, $XLB, $XLV, $XLP and $XLK are painting “Go” bars. After some uncertainty, $XLK, the newcomer to the “Go” trends was able to return to “Go” bars on a relative basis after a couple of amber “Go Fish” bars earlier in the week.
$XLK Able to Edge Higher
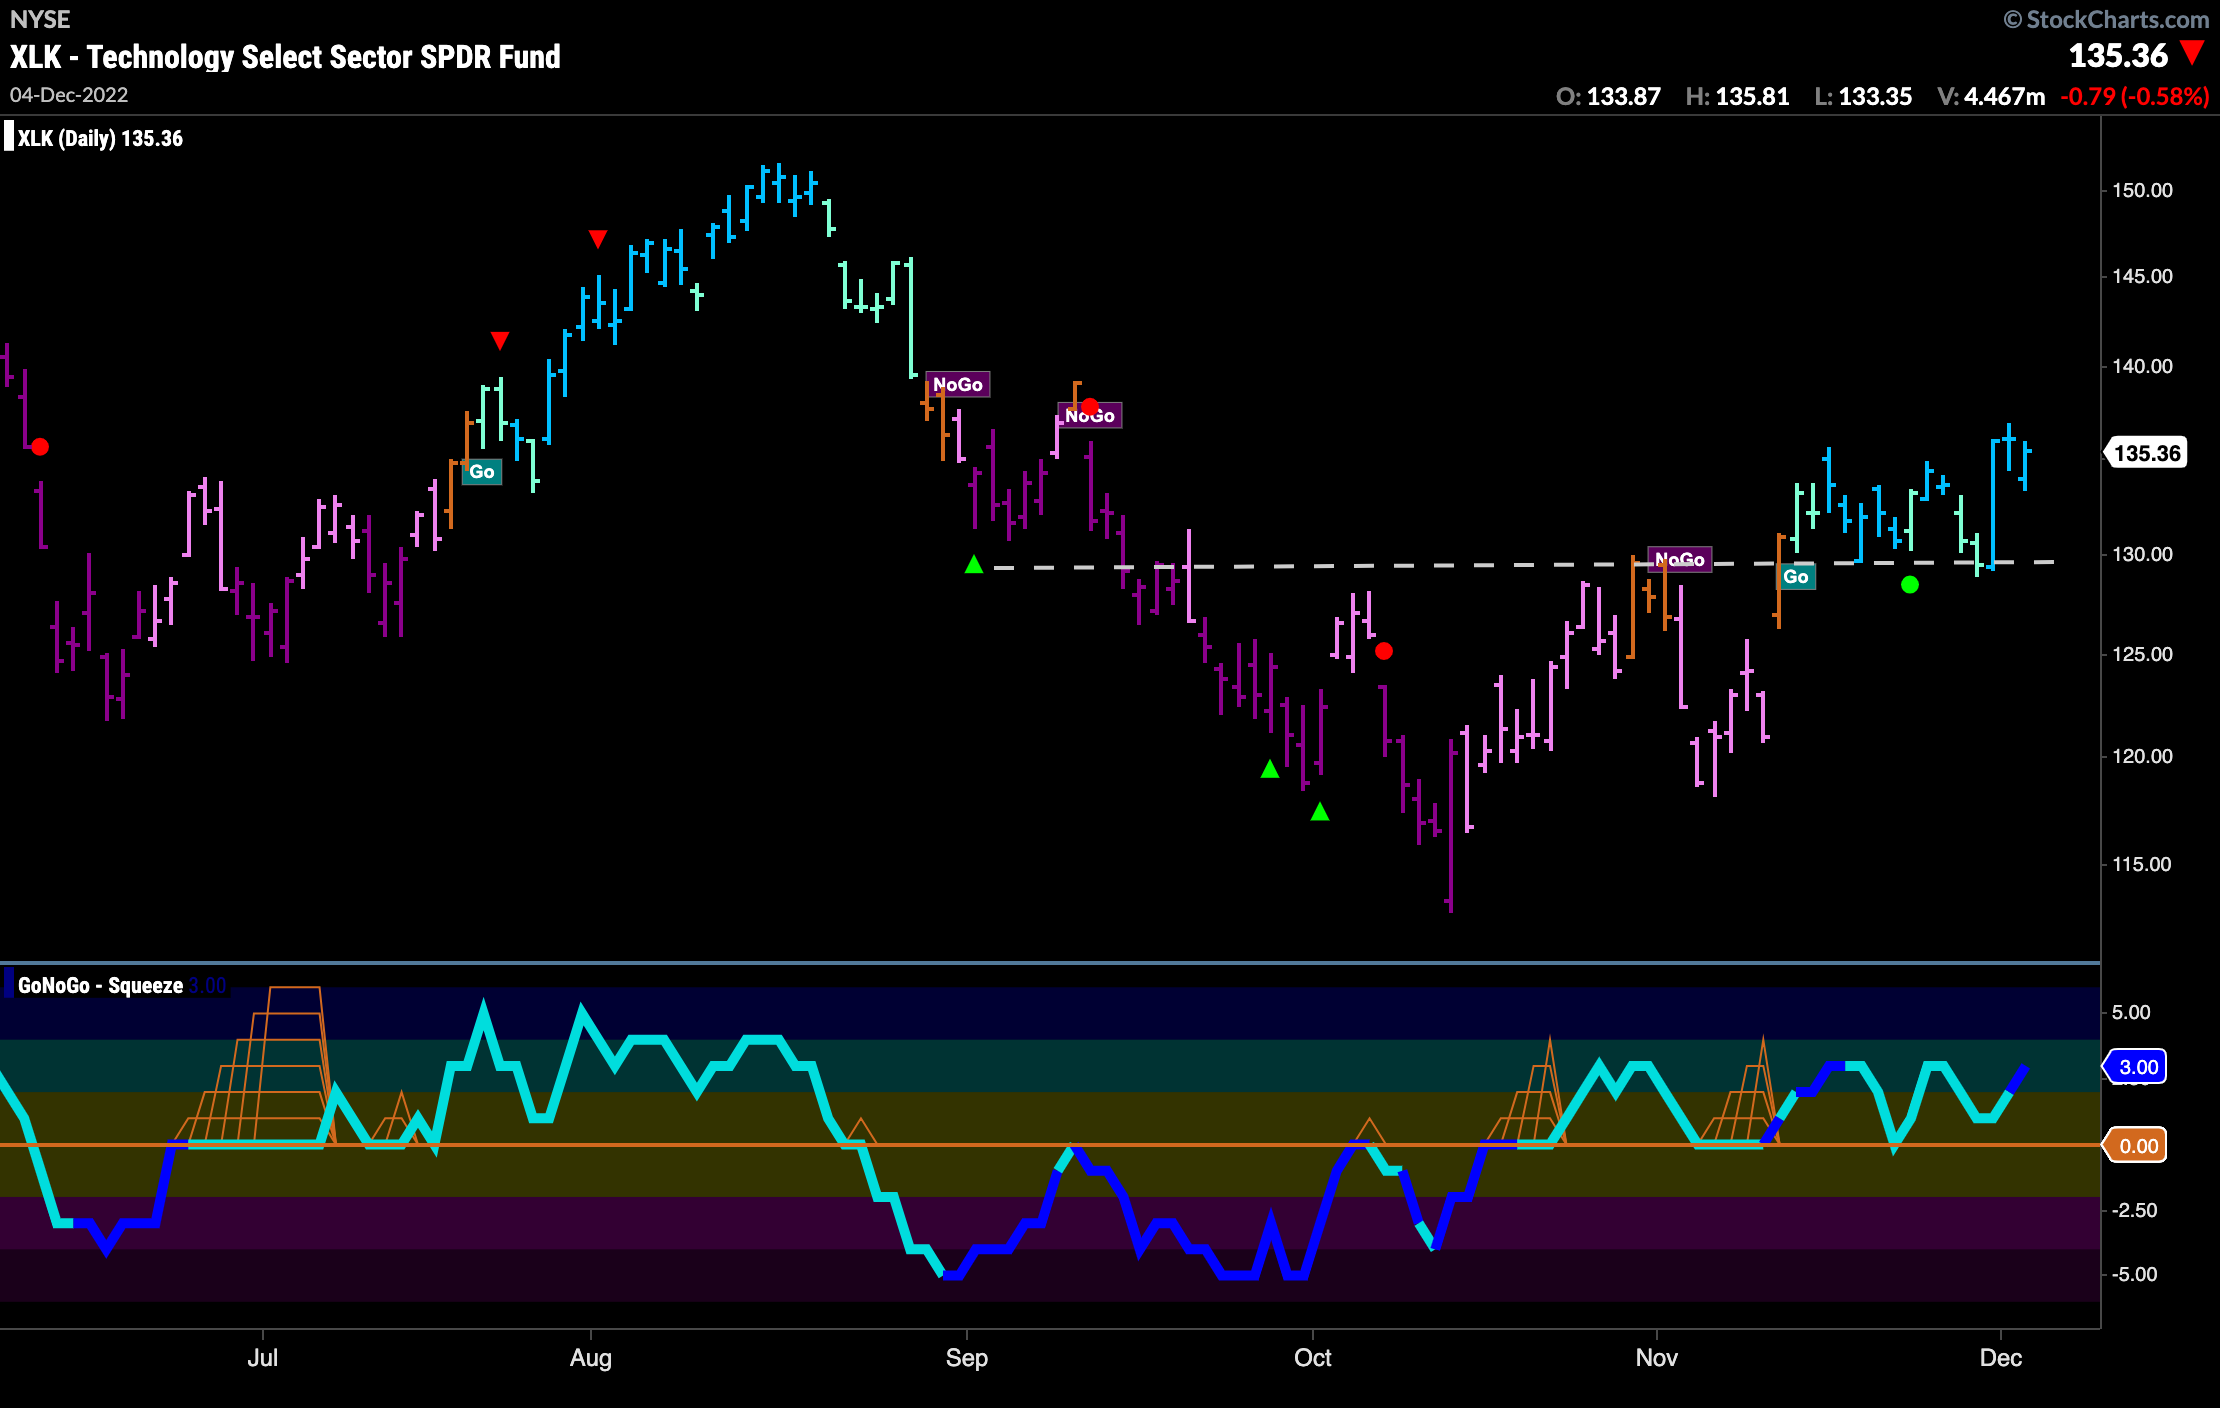
We are talking about $XLK again this week as GoNoGo Trend shows that the trend strengthened from Wednesday on and we see strong blue “Go” bars. We also see that price has respected the horizontal support level once again and bounced higher. Price has been able to make a slightly higher high here and we will look to see if it can take out the high from September. GoNoGo Oscillator is in positive territory but not yet overbought and we are seeing heavier volume creep in.
$AMZN Done With This “NoGo”?
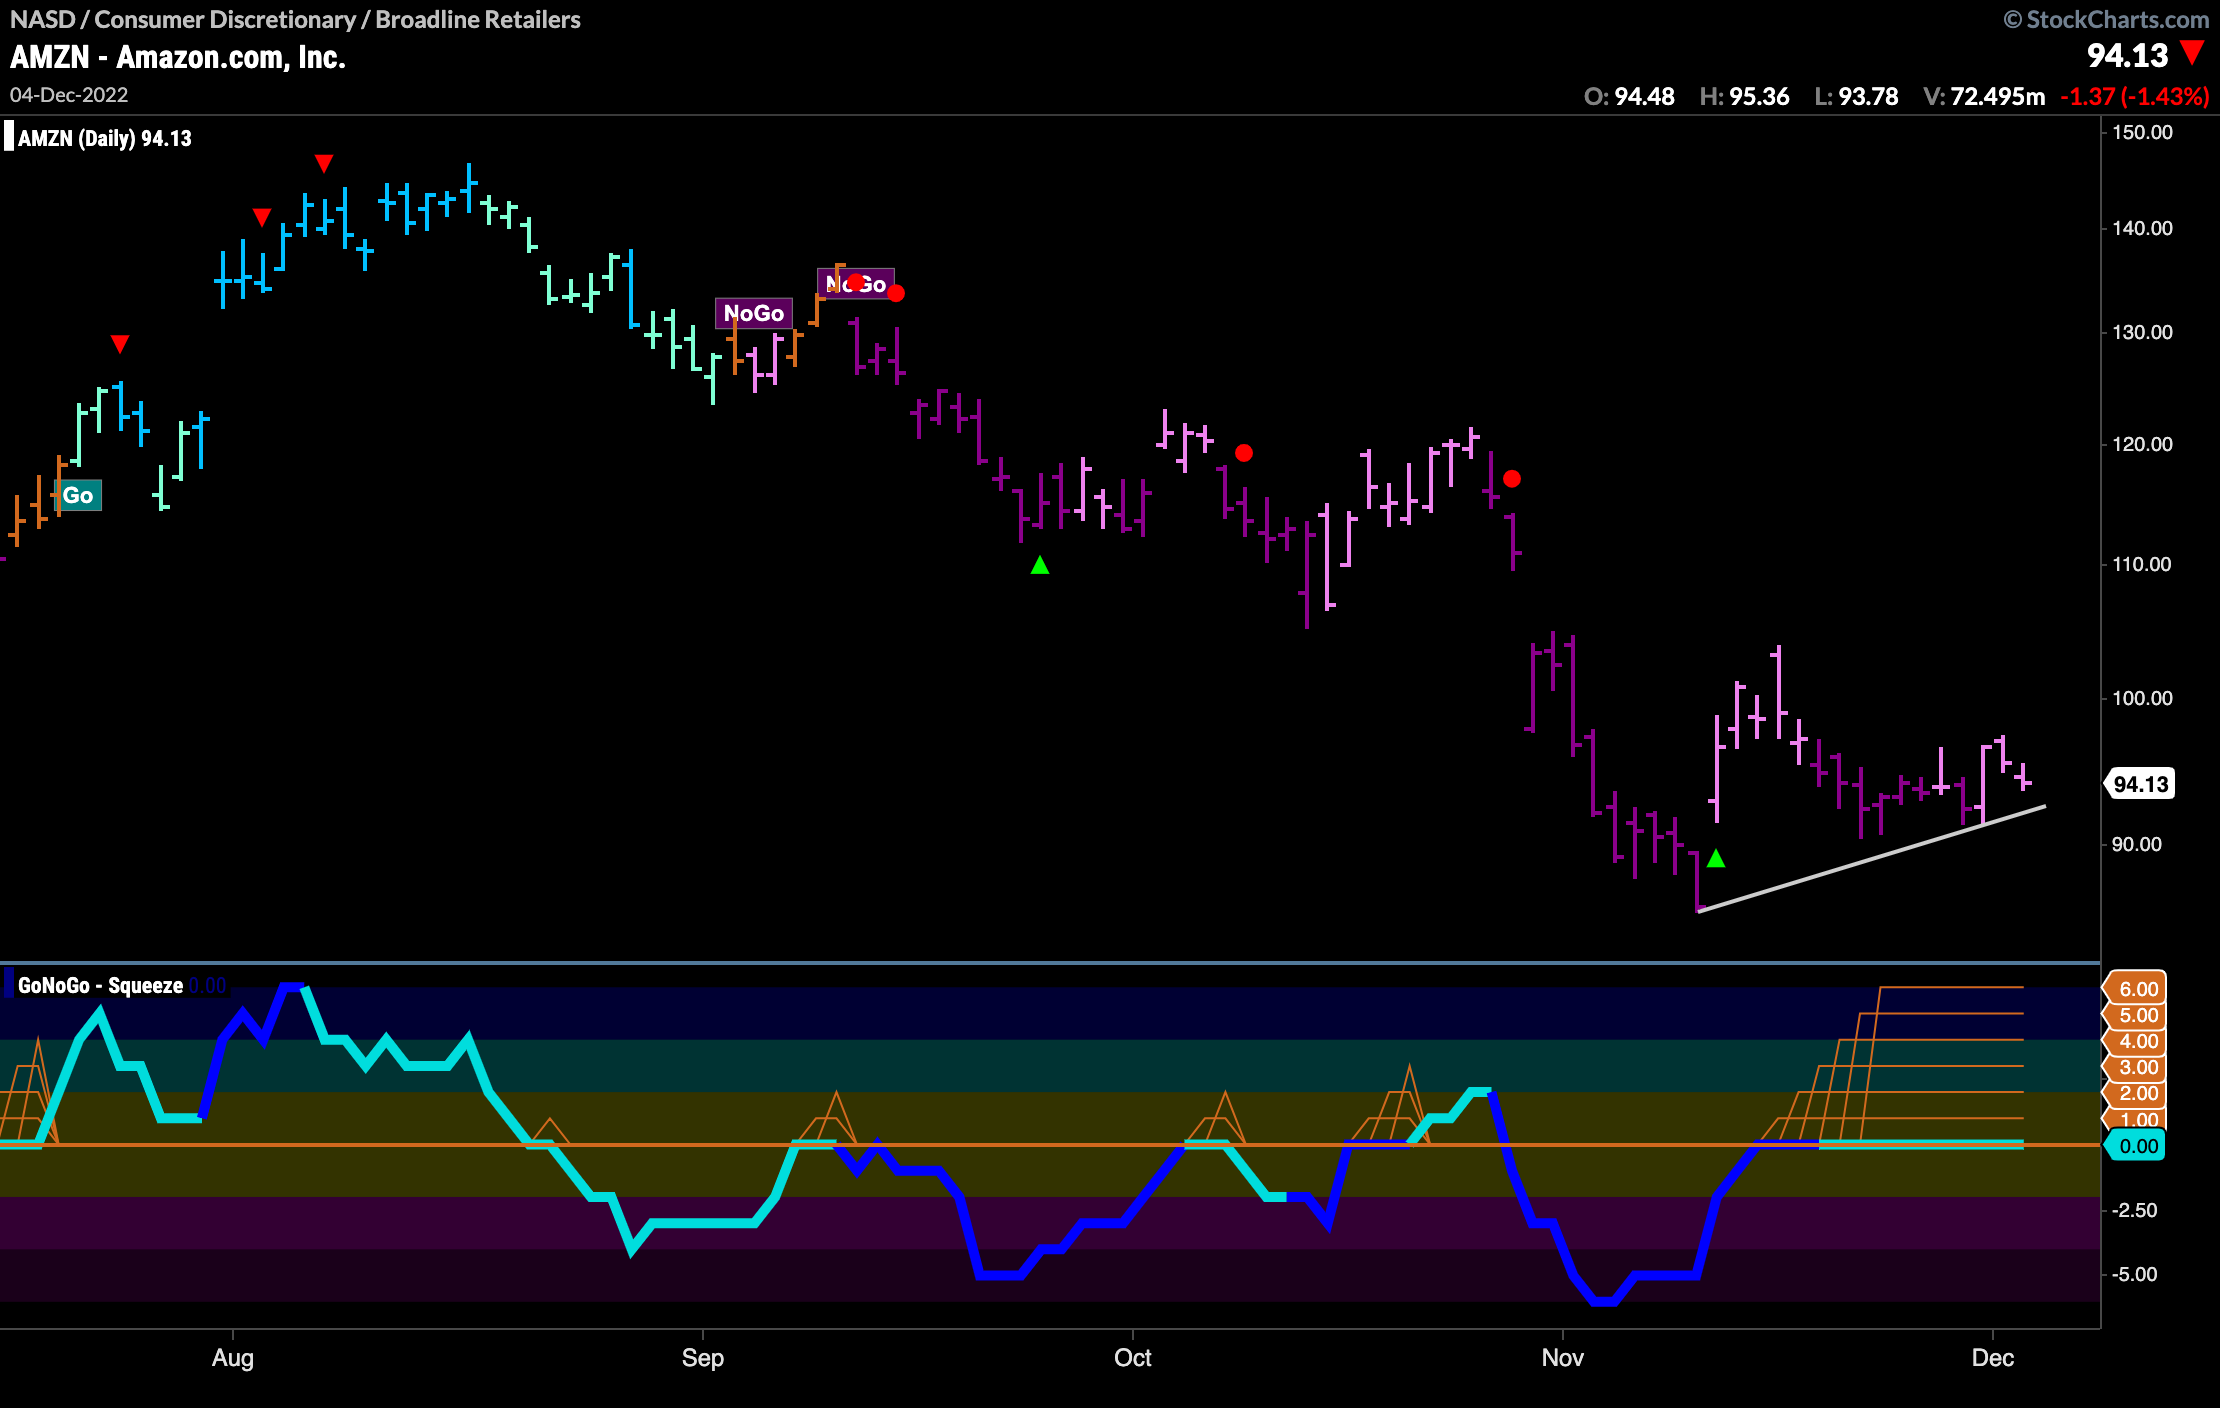
Amazon has been in a drawn out “NoGo” trend that has moved price significantly lower over the past several months. Let’s have a look at what is going on right now. After setting a low in November price looks to have stabilized and we are seeing a higher low on weaker pink “NoGo” bars. As this has happened GoNoGo Oscillator has rallied to the zero line and has been stuck there, allowing the climbing grid of GoNoGo Squeeze to climb to its max. This reduced volatility period suggests that there maybe a period of higher volatility to come. We will watch for the direction of the break of the GoNoGo Squeeze to understand price’s next direction.
