Welcome to Flight Path from GoNoGo Research. As treasury yields continue their NoGo trends below 1.46% and the spread between the 2yr and 10yr flattens, investors can see the rotation back to the growth equity names that fueled the post-covid rally of 2020. Remember, the decrease in longer-term bond yields favors growth stocks by reducing the implied discount on future earnings while weighing on financials by threatening bank lending margins.
“The trend is your friend until it ends,” and right now we are seeing major trend reversals in lumber, copper, financials, and the industrials sector of the US stock market. Despite the countertrend bounce of cyclical stocks as we opened this week’s session, the NoGo trends are decisive and continue. This week, we’ll take a look at lots of opportunities for Go trends to resume across the tech communications and consumer discretionary sectors.
At the index level, we saw the NASDAQ outperform the Dow, the S&P, and the Russell the last few weeks. Let’s see how the Nasdaq composite is positioned for a strong trend continuation.
Invesco QQQ Trust
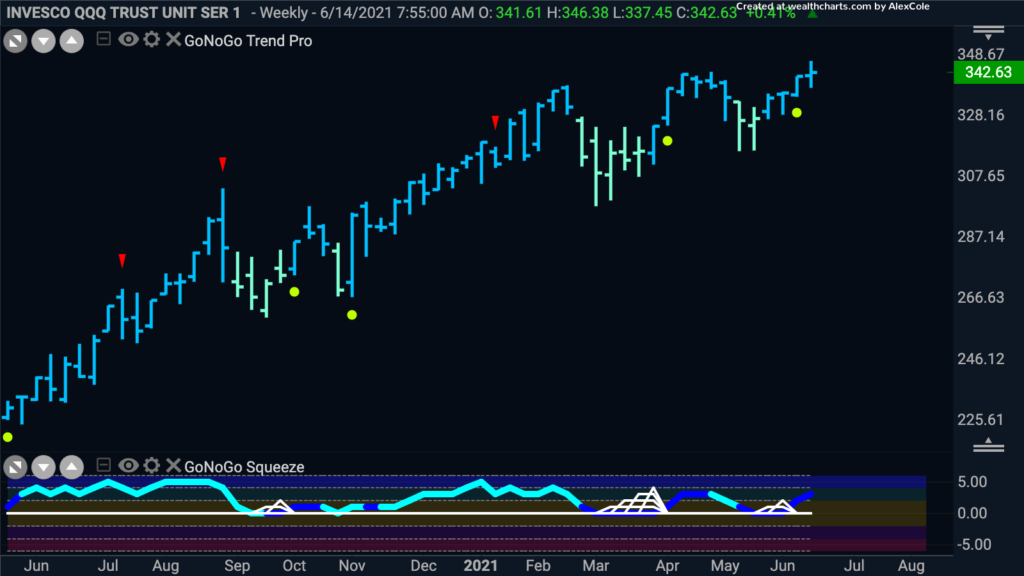
The tech-heavy Nasdaq – represented below by Invesco’s $QQQ – is in a strong weekly “Go” trend, with price currently making a higher high. During this time the GoNoGo Oscillator has found support at the zero line and currently is in positive territory but not yet overbought.
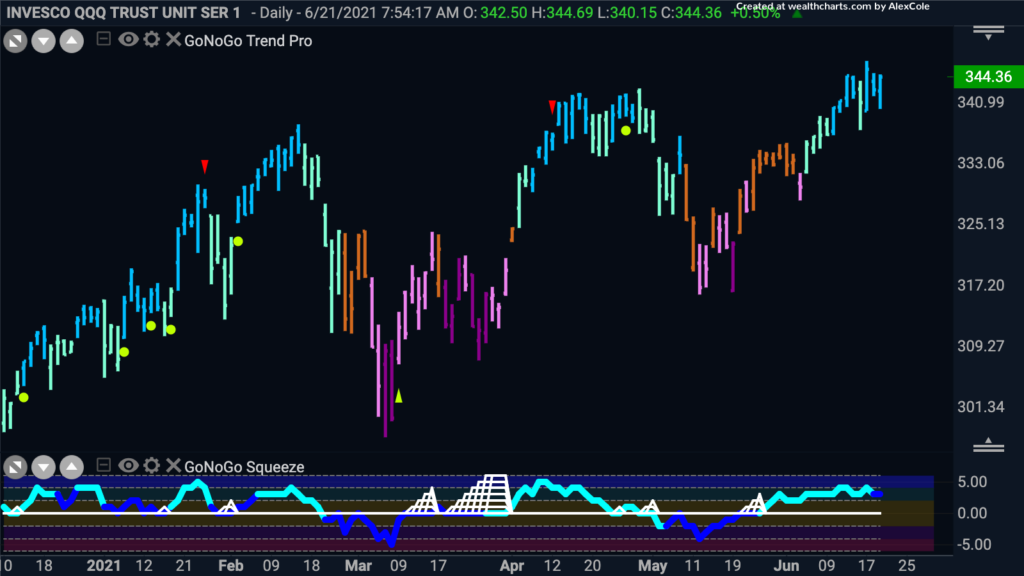
On the daily chart we can see that the “Go” trend has returned, as we have been able to set a new higher high. The GoNoGo Oscillator quickly rallied back into positive territory to suggest this trend change. There is positive momentum now as the GoNoGo Oscillator is in positive territory and rising but not yet overbought. Perhaps price can climb even higher.
We’ve seen large-cap outperform small-cap shares recently, lets look at some individual names that have strong long-term trends with healthy short-term setups.
Apple Inc
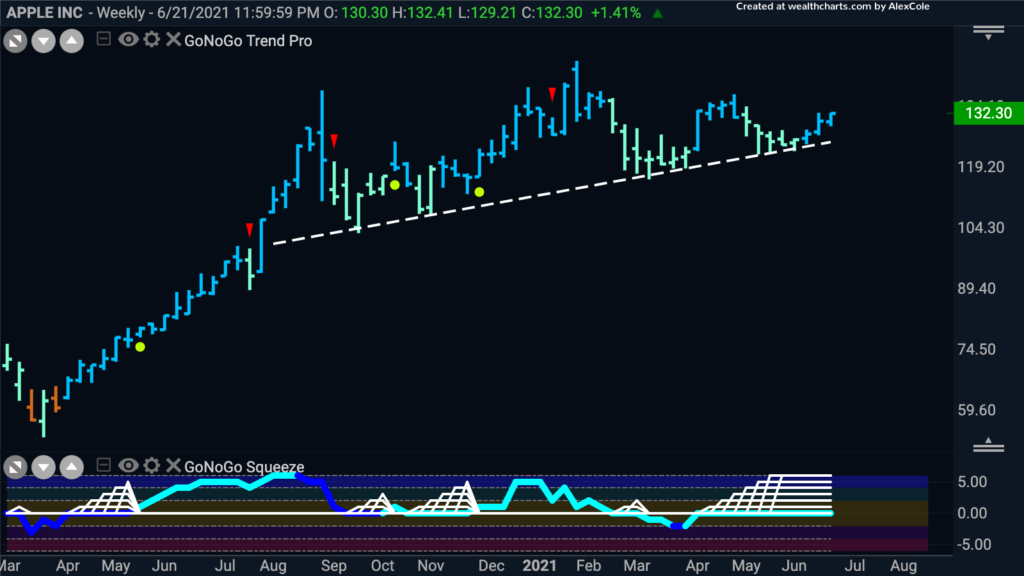
A look at the weekly GoNoGo Chart of Apple Inc shows us that the “Go” trend is still in place although price hasn’t been able to make a new high since January of this year. We have seen continued higher lows though as buyers are showing up at higher prices to support price. The GoNoGo Oscillator has been riding the zero line for 3 months. This reduced volatility is highlighted by the climbing grid of the GoNoGo Squeeze.
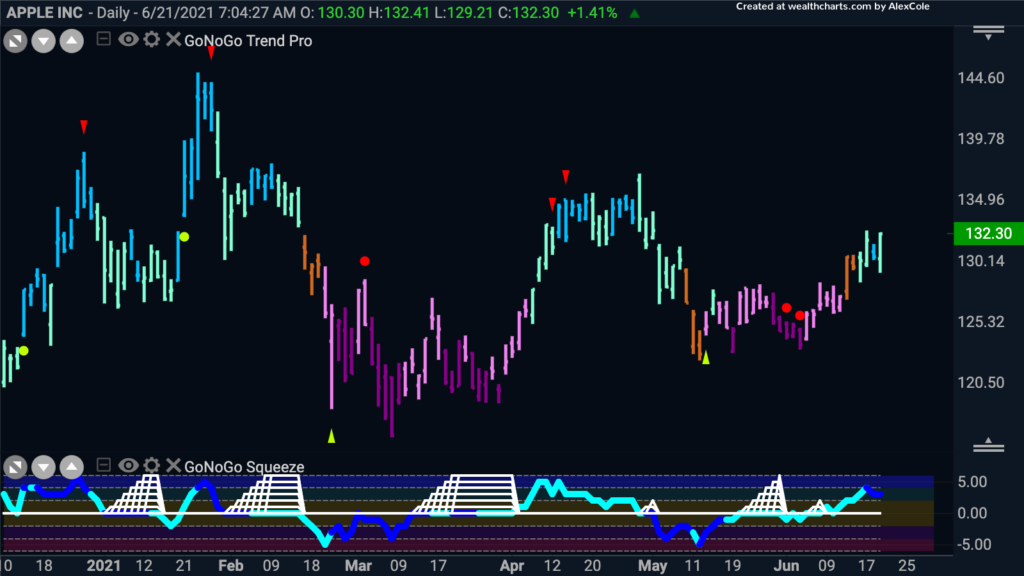
The daily GoNoGo Chart of Apple, Inc shows what a struggle it has been to make gains this year. As price has swung from the peaks to the troughs of the larger consolidation that we saw on the weekly chart, GoNoGo Oscillator has risen and fallen to extremes, and these shorter-term highs and lows have been depicted on the chart with the red and green arrows. Of interest as price rises, this time is that the GoNoGo Oscillator is not yet overbought. Perhaps there is a little more room for Apple to go higher.
Microsoft Corp
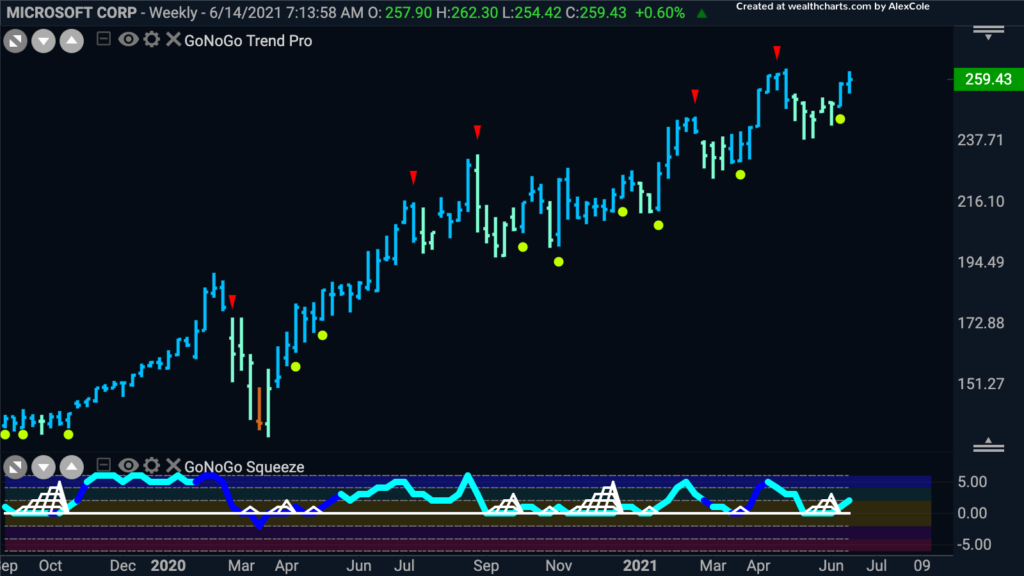
Below is the weekly chart of Microsoft prices. Microsoft has performed incredibly well since the pandemic lows in March 2020 with a series of higher highs and higher lows. During this time, the GoNoGo Oscillator has found support at the zero-line indicating that each time there is a pause in the trend momentum has returned in its direction. Currently, we see that the oscillator has bounced off the zero line and that momentum has sent price racing back to test prior highs.
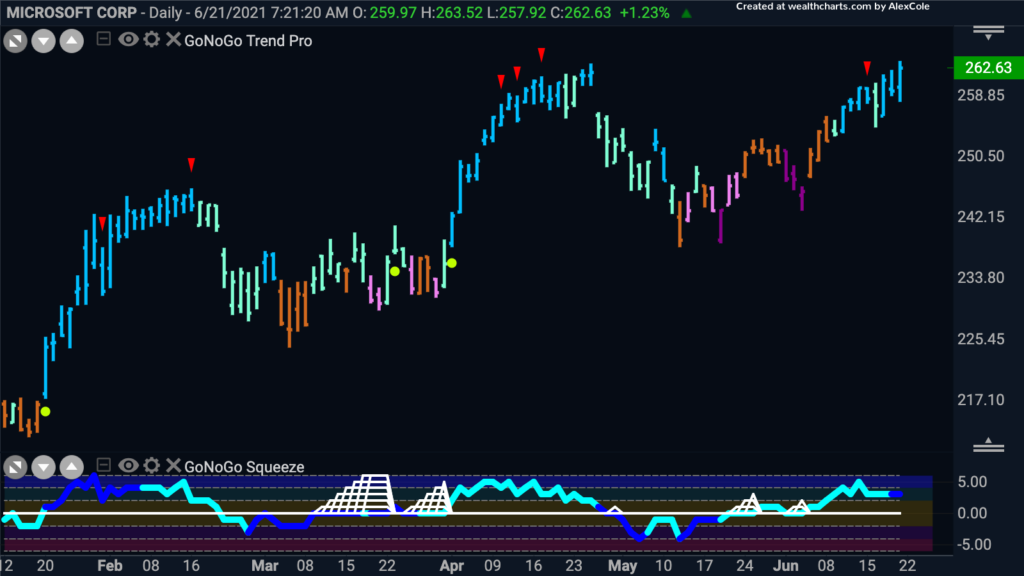
The daily chart below shows that although price has moved out of one trend and into another the general progression has still been higher. The corrections have caused the GoNoGo Trend to be unable to maintain the Go colors, alerting us to the potential of more losses, but the GoNoGo Oscillator has not fallen to extremes during these times. Currently, as price tries to set another higher high, the oscillator is in positive territory on heavy volume.
Tesla Inc
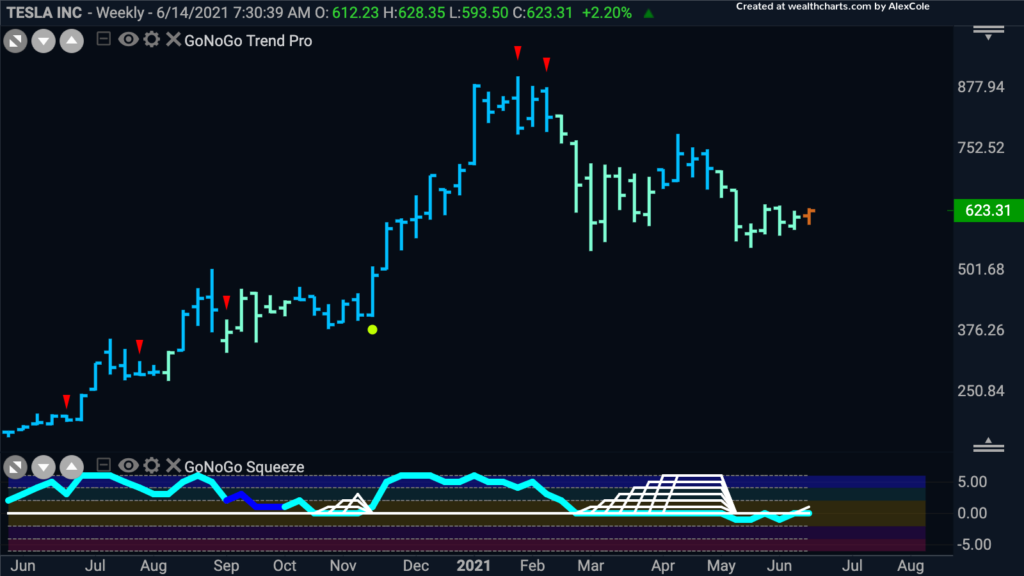
The largest company in the consumer discretionary sector, Tesla Inc enjoyed a remarkable run in 2020. It hasn’t been the same story so far in 2021. The weekly chart below shows that there is a crack in the electric carmakers armor. After correcting against the highs of almost $900 and then consolidating sideways for much of this year, the GoNoGo Trend for the first time is painting an amber “Go Fish” bar, suggesting that there are no longer enough bullish trend conditions for the indicator to remain in a “Go” trend. The GoNoGo Oscillator has fallen below zero and is testing it from below.
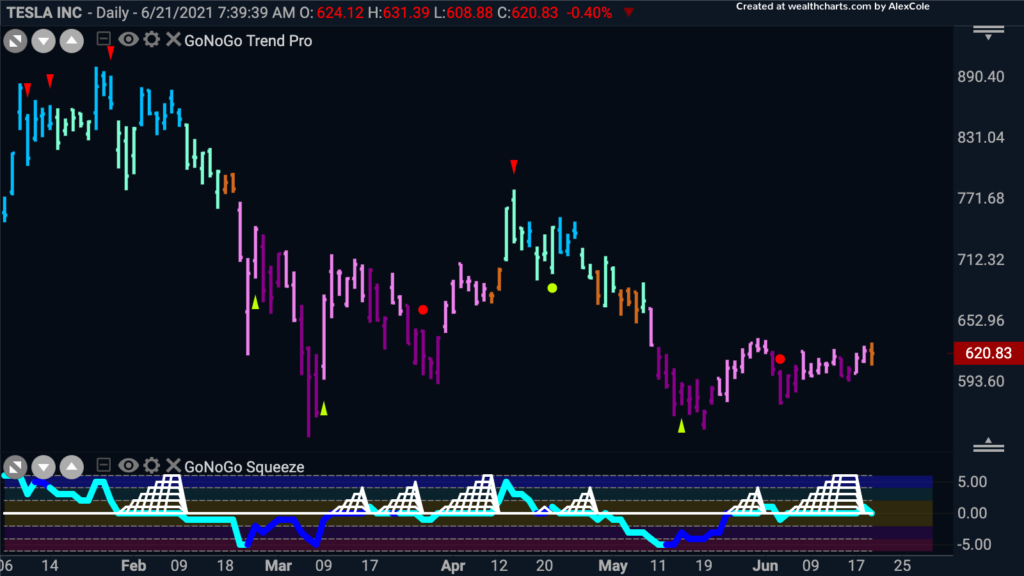
The daily chart below shows the general move lower. Currently, the GoNoGo Trend is painting mostly bearish NoGo bars. In some good news for the Tesla bulls, price seems to have found support at prior lows and we will look to the GoNoGo Oscillator to see if it can break back into positive territory.
Ark Innovation ETF
Heralded as one of the greatest investors of our time, Cathie Wood, CEO of Ark Invest, broke records as one of the fastest-growing funds ever as investors scrambled to get into her firm’s suite of ETFs in 2020. This year, that story has unwound, but the question is, whether Cathie is out of the Woods as we see the rotation back to growth?
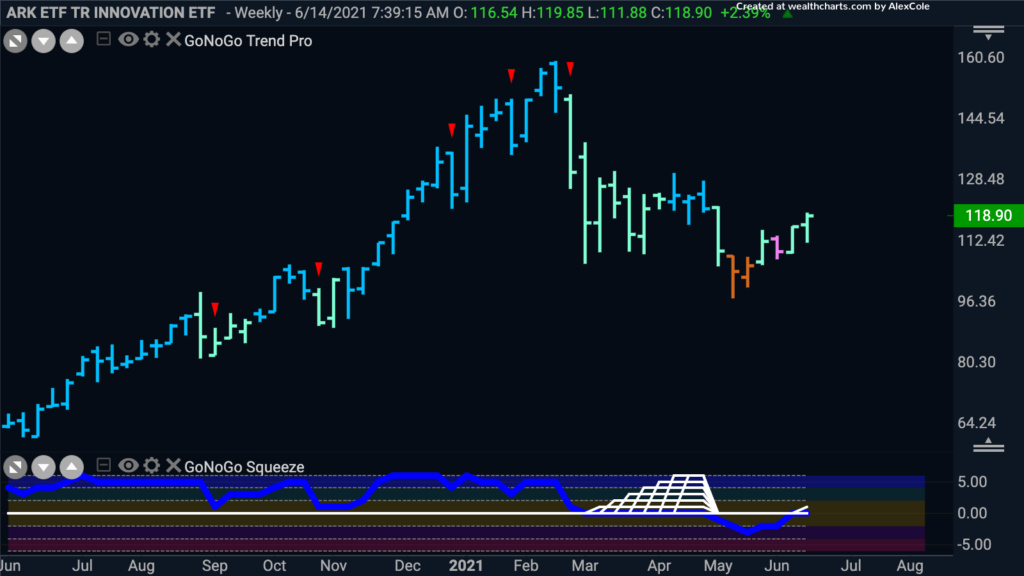
If there is any evidence to be bullish on the chart of Tesla, let’s look at $ARKK, which counts $TSLA as one of its biggest holdings. On a weekly chart we can see that although GoNoGo Trend briefly fell out of a “Go” trend, it has moved right back into a “Go” trend after rallying off the lows. However, the GoNoGo Oscillator did fall below zero and is now testing the zero line from below. We will look to see if the oscillator can get back into positive territory.
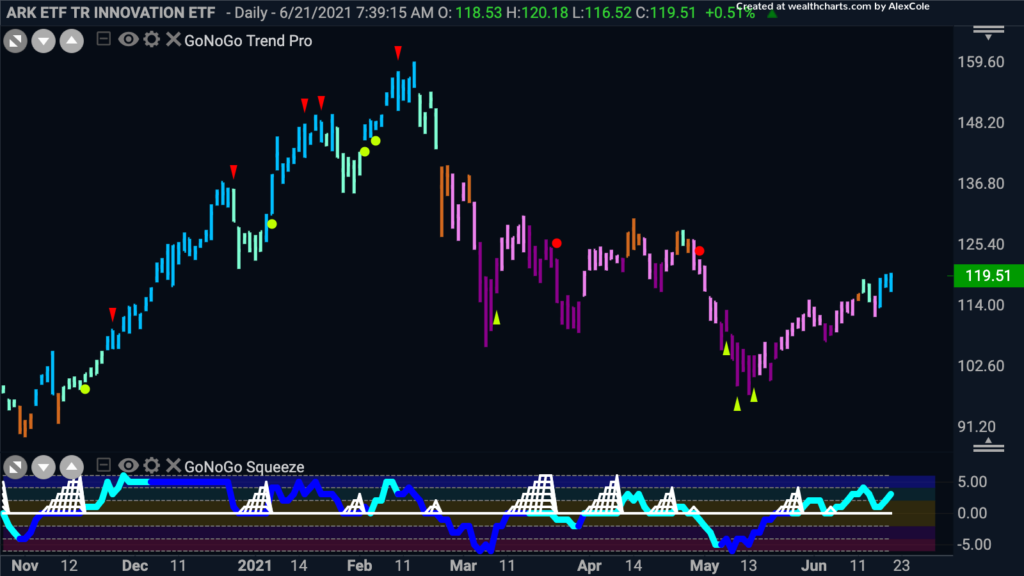
The daily chart shows some more signs of a “Go” trend resuming. After rallying off the recent lows, there was enough positive momentum for the GoNoGo Oscillator to break into positive territory and has since found support at this level. This led a change in trend to a new “Go” trend in the price chart above.
Investors will be catching up this week to regain positions in the relative and absolute leaders of the market. These flows will determine the longevity of the move back to growth equities at the index level, as thematic ETFs, and within individual names. We hope you have a great week ahead.


