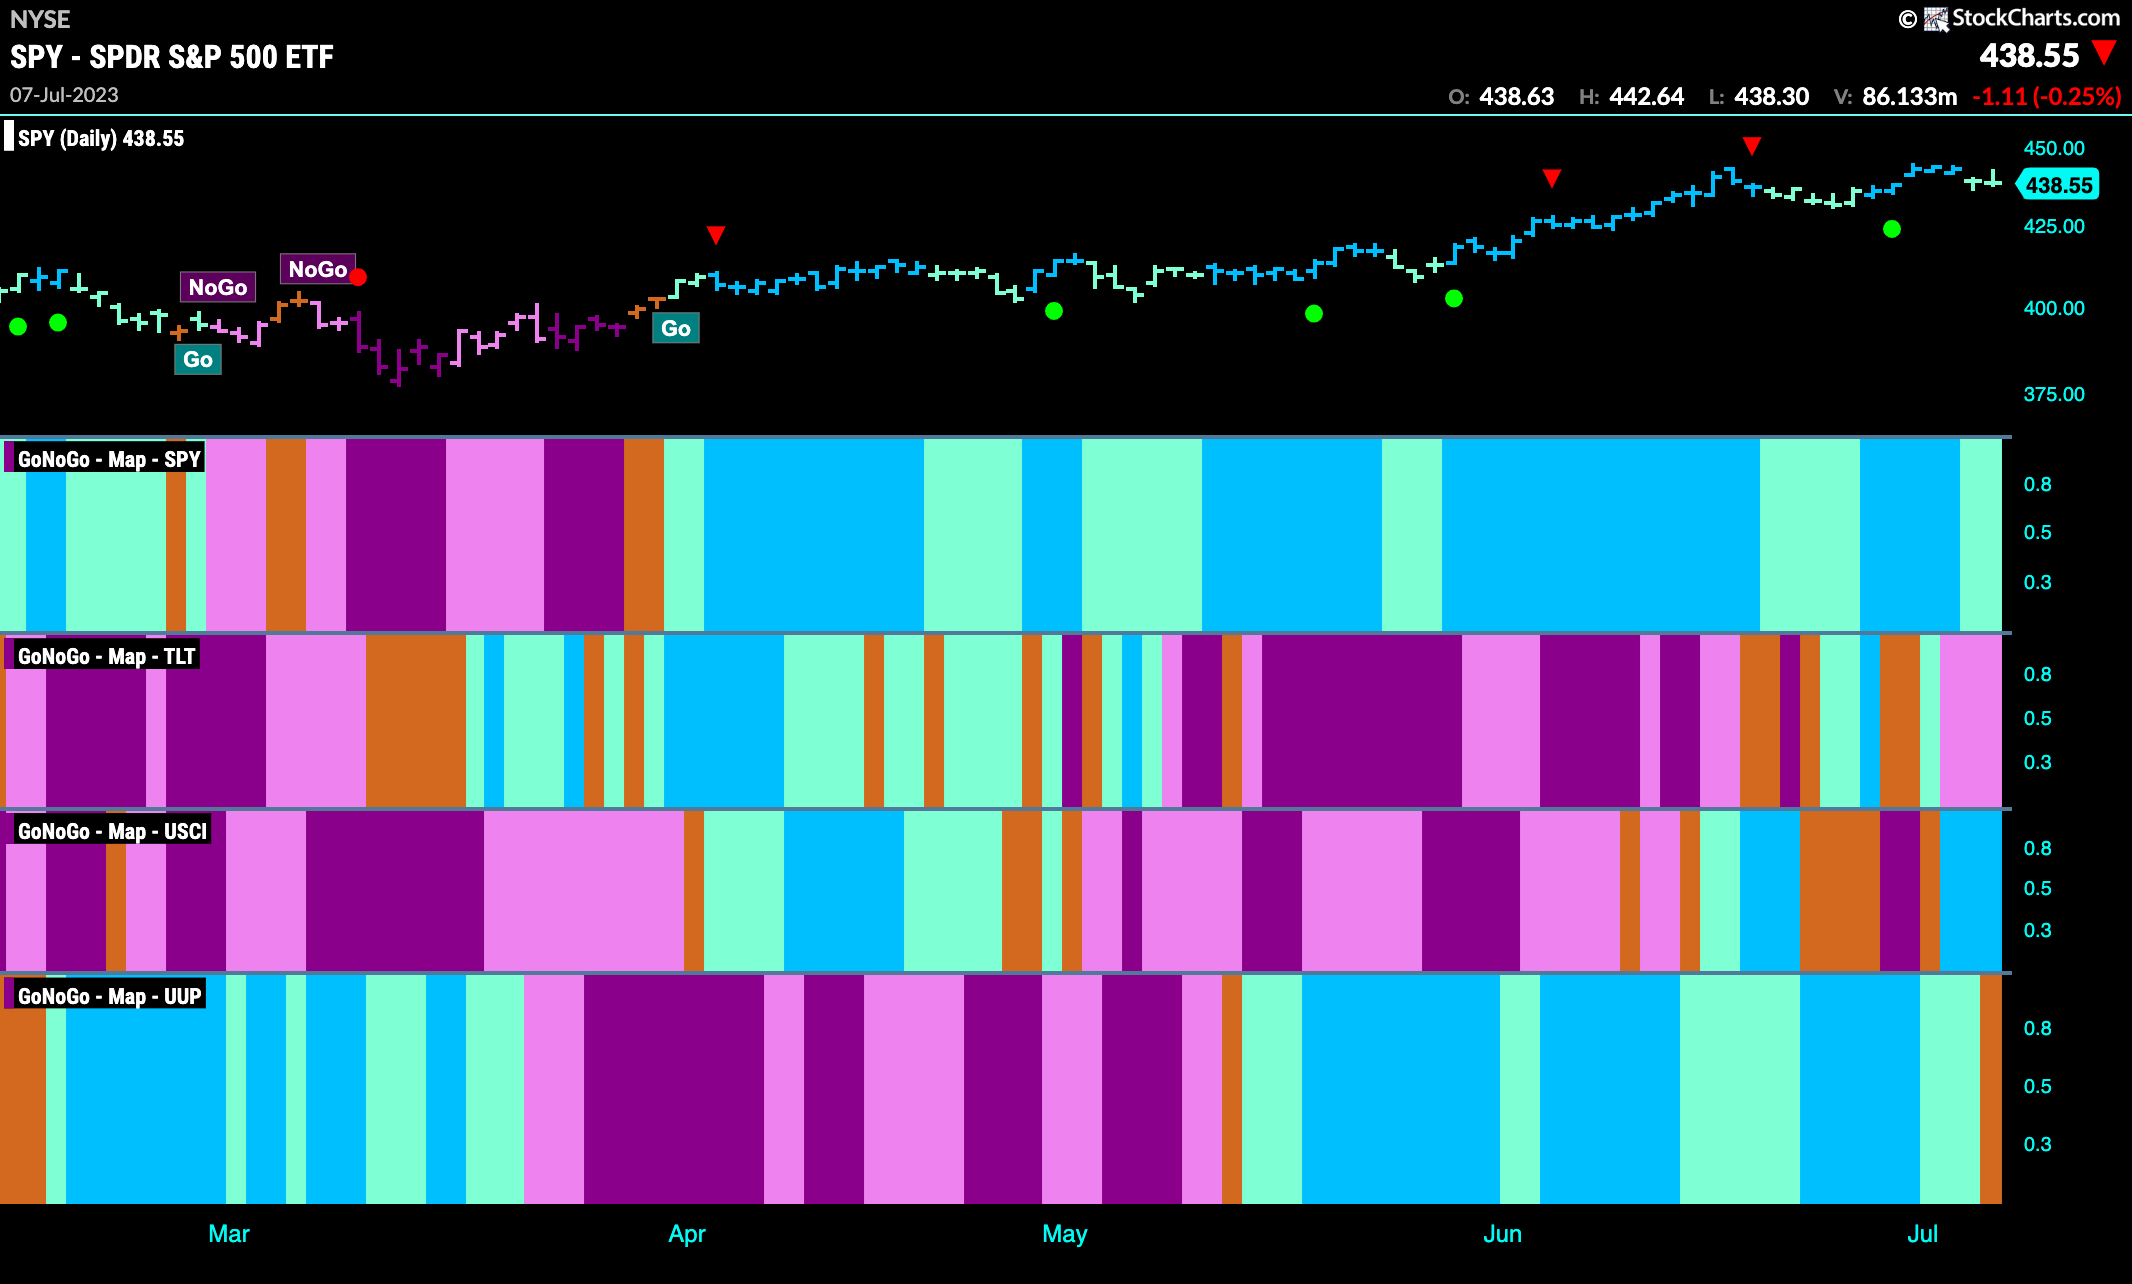
Good morning and welcome to this week’s Flight Path. The heat map shows that the “Go” trend in equities was able to continue this week although we do see some weakness as the week ends with a couple of aqua bars. Treasury bond prices stumble this week as pink “NoGo” bars creep in to the mix. The U.S. commodities index shows some strong blue “Go” bars and the dollar sees GoNoGo Trend paint an amber “Go Fish” bar of uncertainty.
Equity Fail at Resistance from Prior High
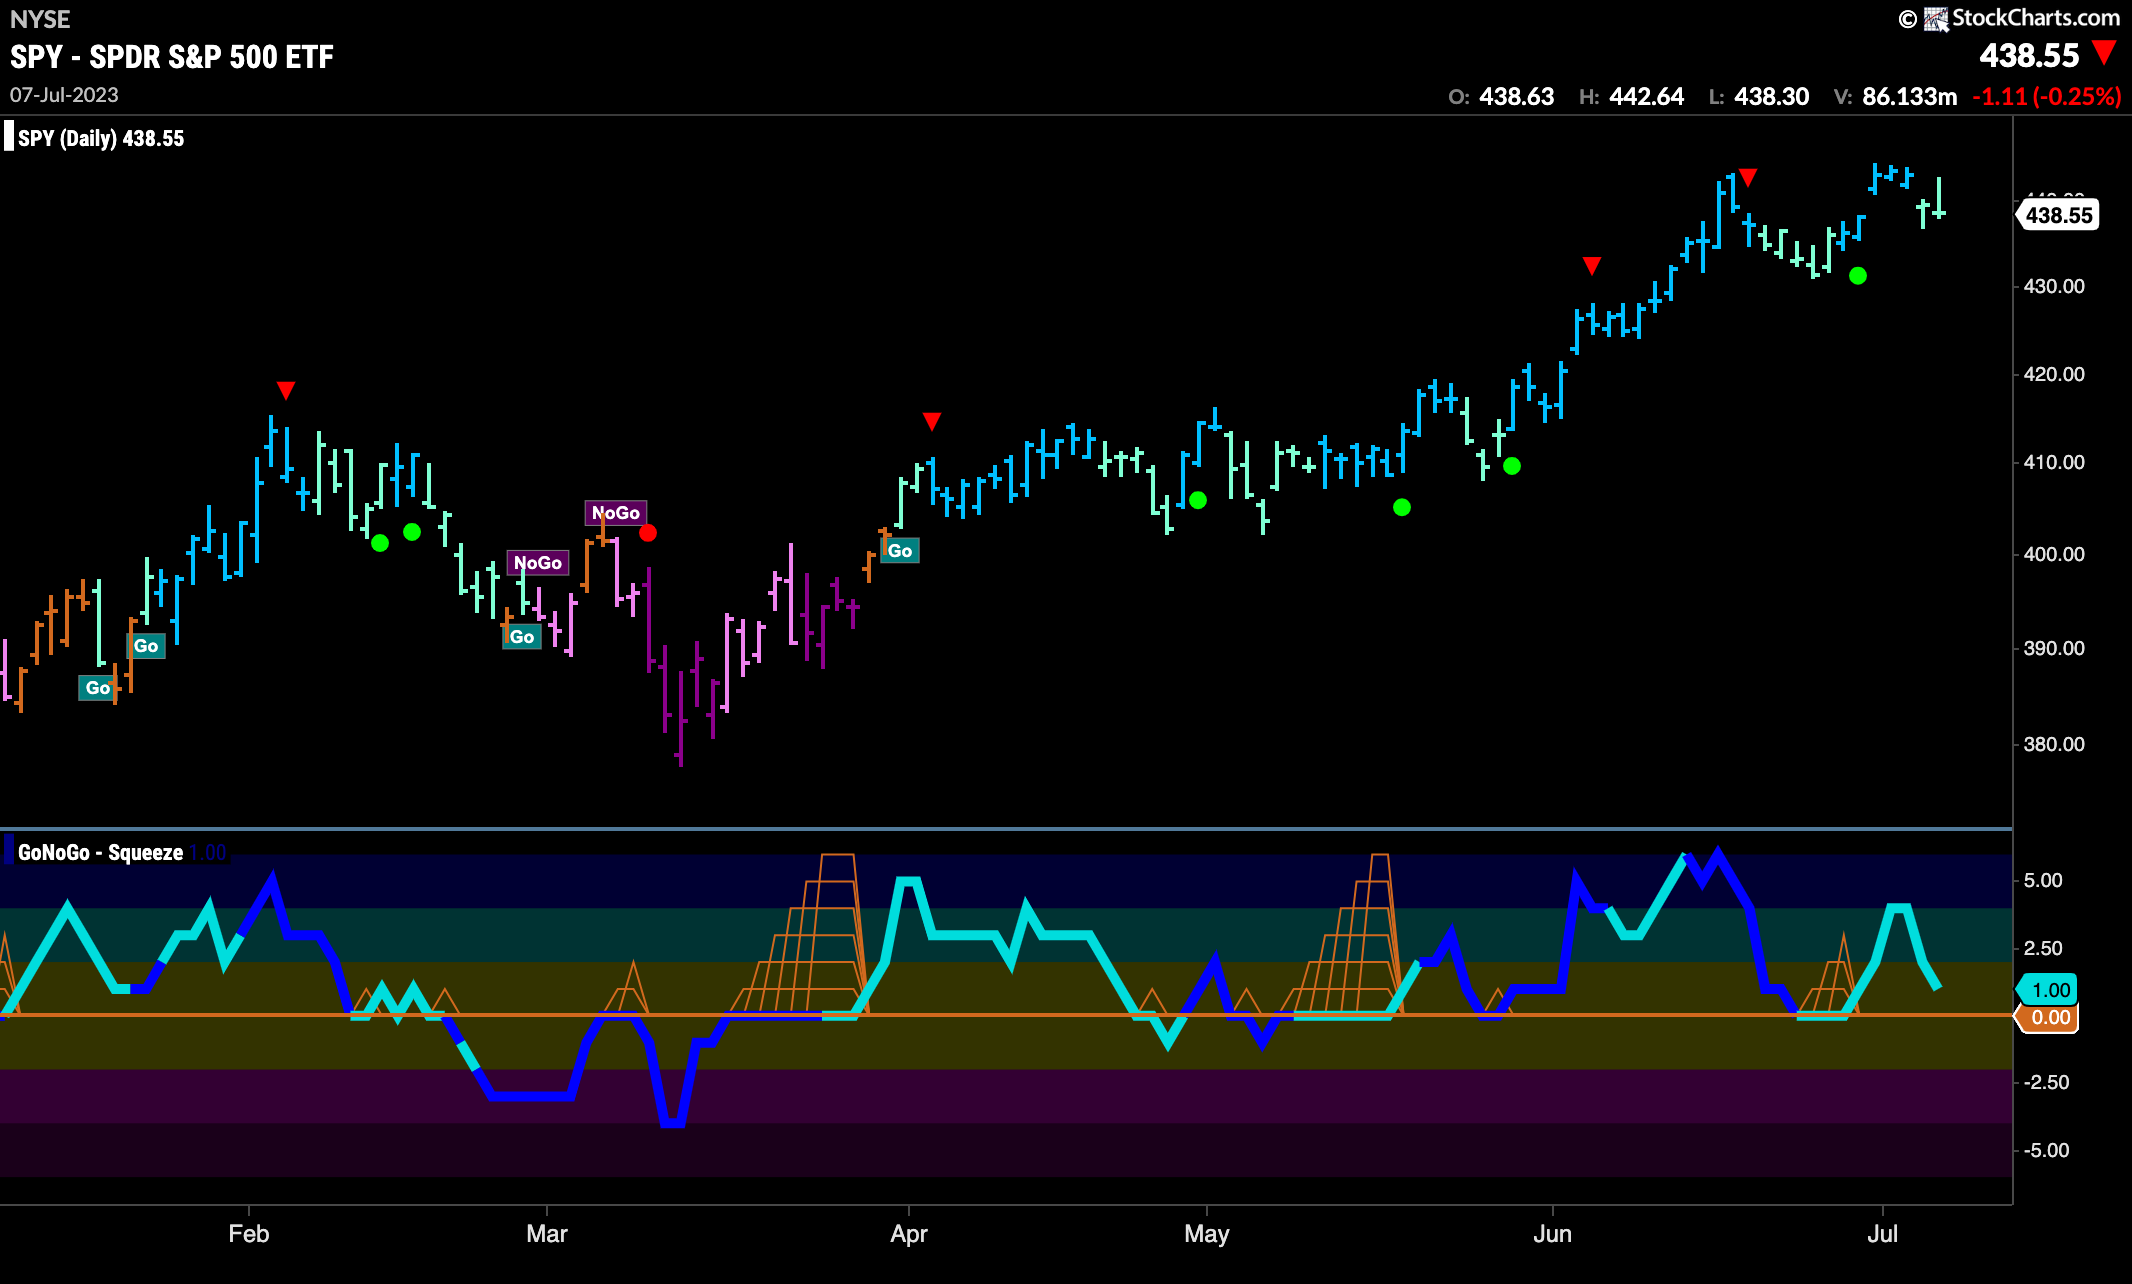
$SPY tried but failed to break above prior high resistance this week. After spending a few bars threatening to move higher we saw GoNoGo Trend paint weaker aqua “Go” bars as the week ended. GoNoGo Oscillator also rolled over and is approaching the zero line although it is still in positive territory. Volume is light.
The longer term weekly chart continues to show strength,. We can see that the “Go” trend emerged and price was able to break above downward sloping resistance a few bars after GoNoGo Oscillator found continued support at the zero line. Now, GoNoGo Trend still paints strong blue “Go” bars and GoNoGo Oscillator is in positive territory but no longer overbought. Volume remains lighter than usual. 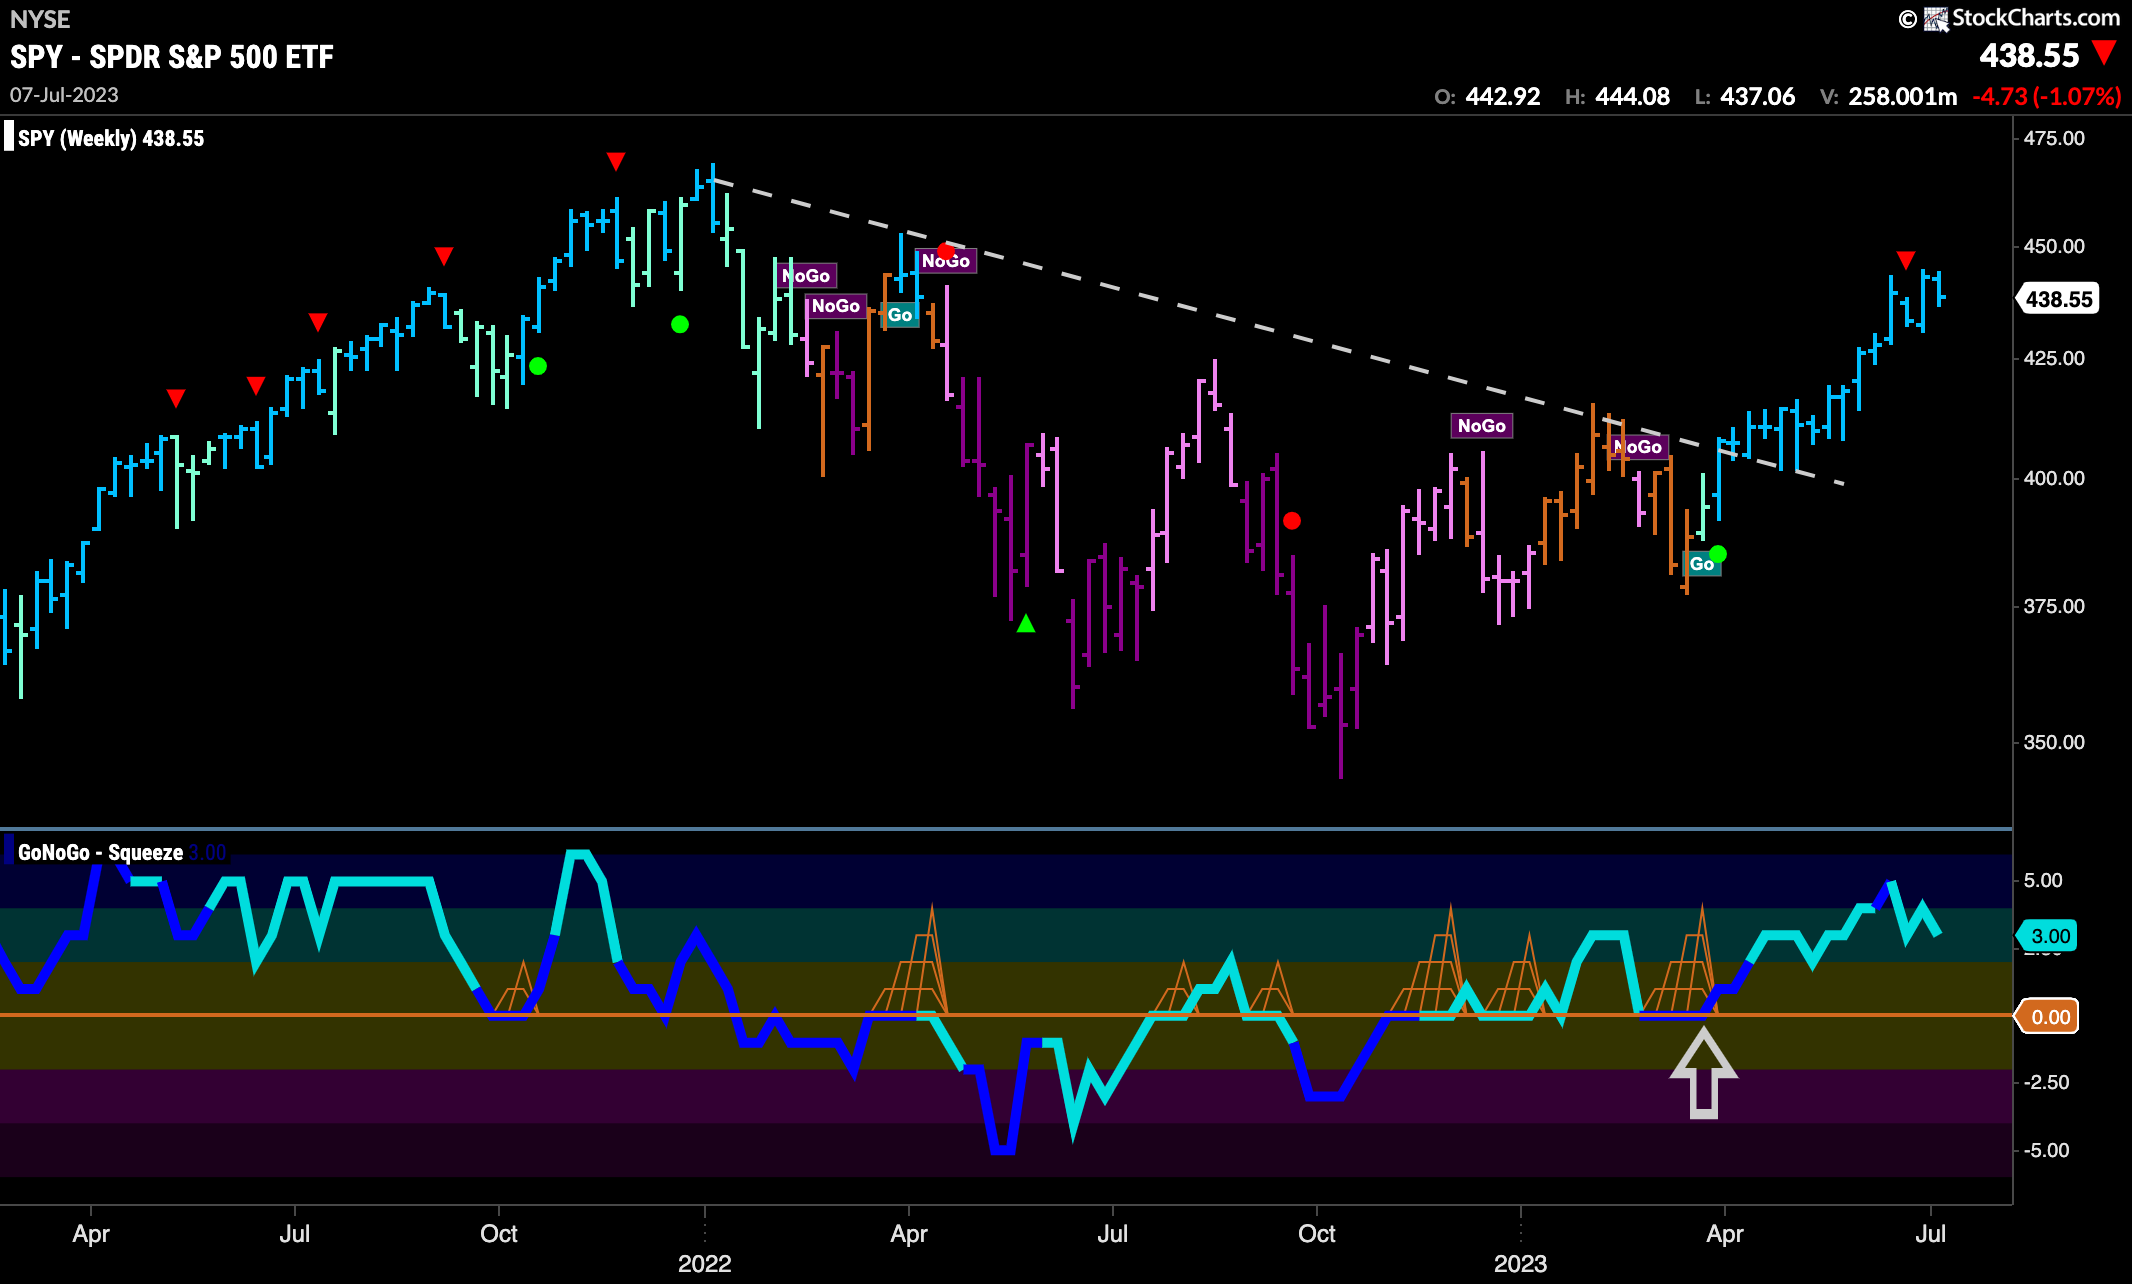
Treasury Bond Rates Rise
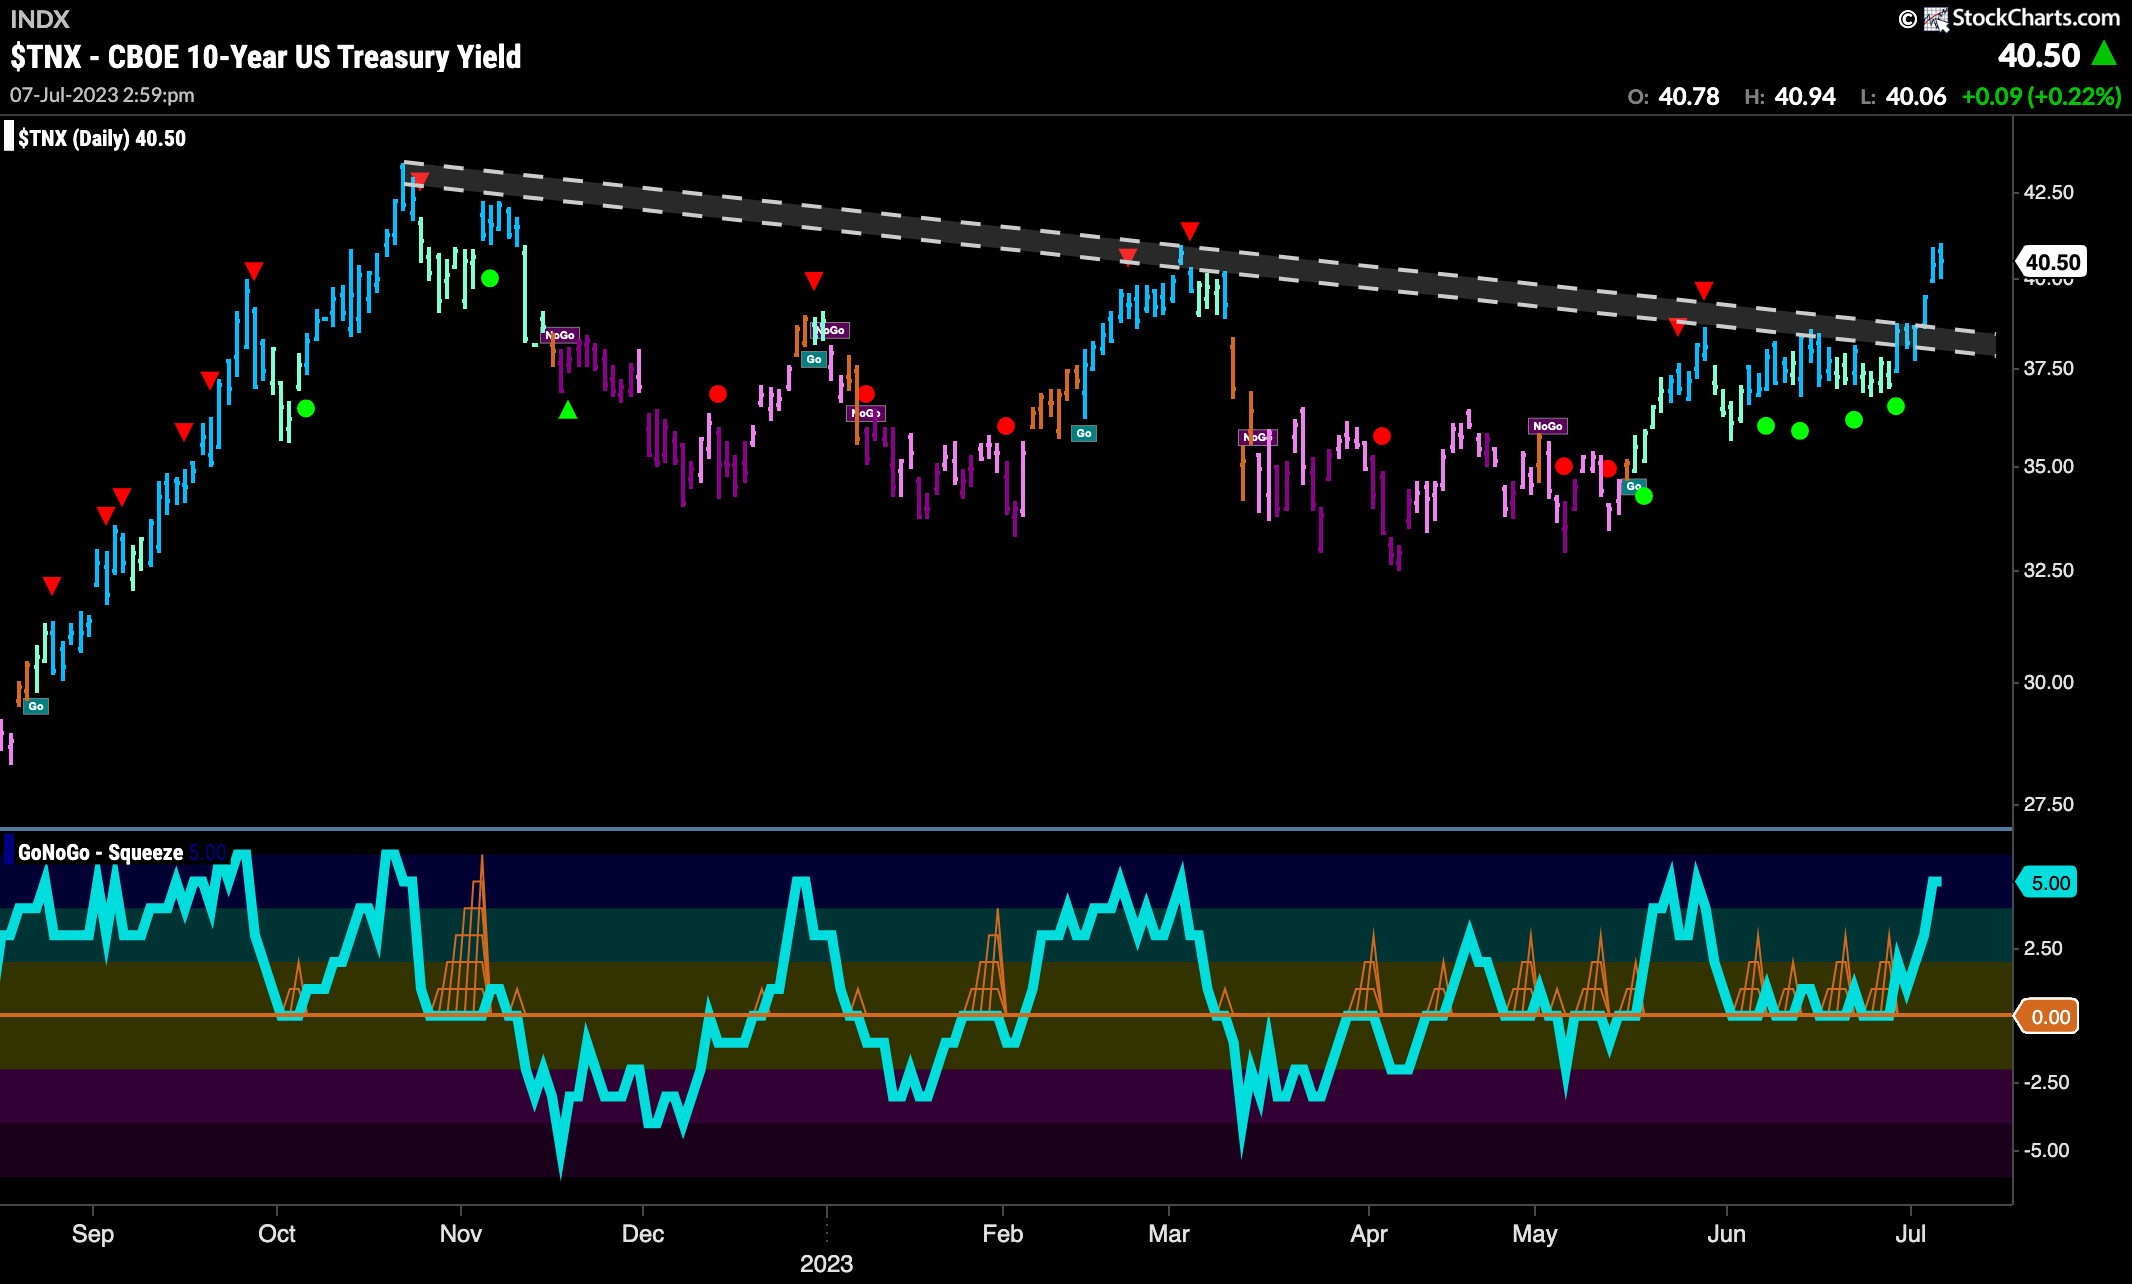
Last week we noted that treasury rates were testing the resistance from downward sloping trend lines. This week, we saw continued strong blue “Go” bars and price did indeed rally above that resistance. GoNoGo Oscillator has rallied further into positive territory after having shown repeated support at the zero line. The oscillator is now overbought.
Dollar Investors to “Go Fish”-ing
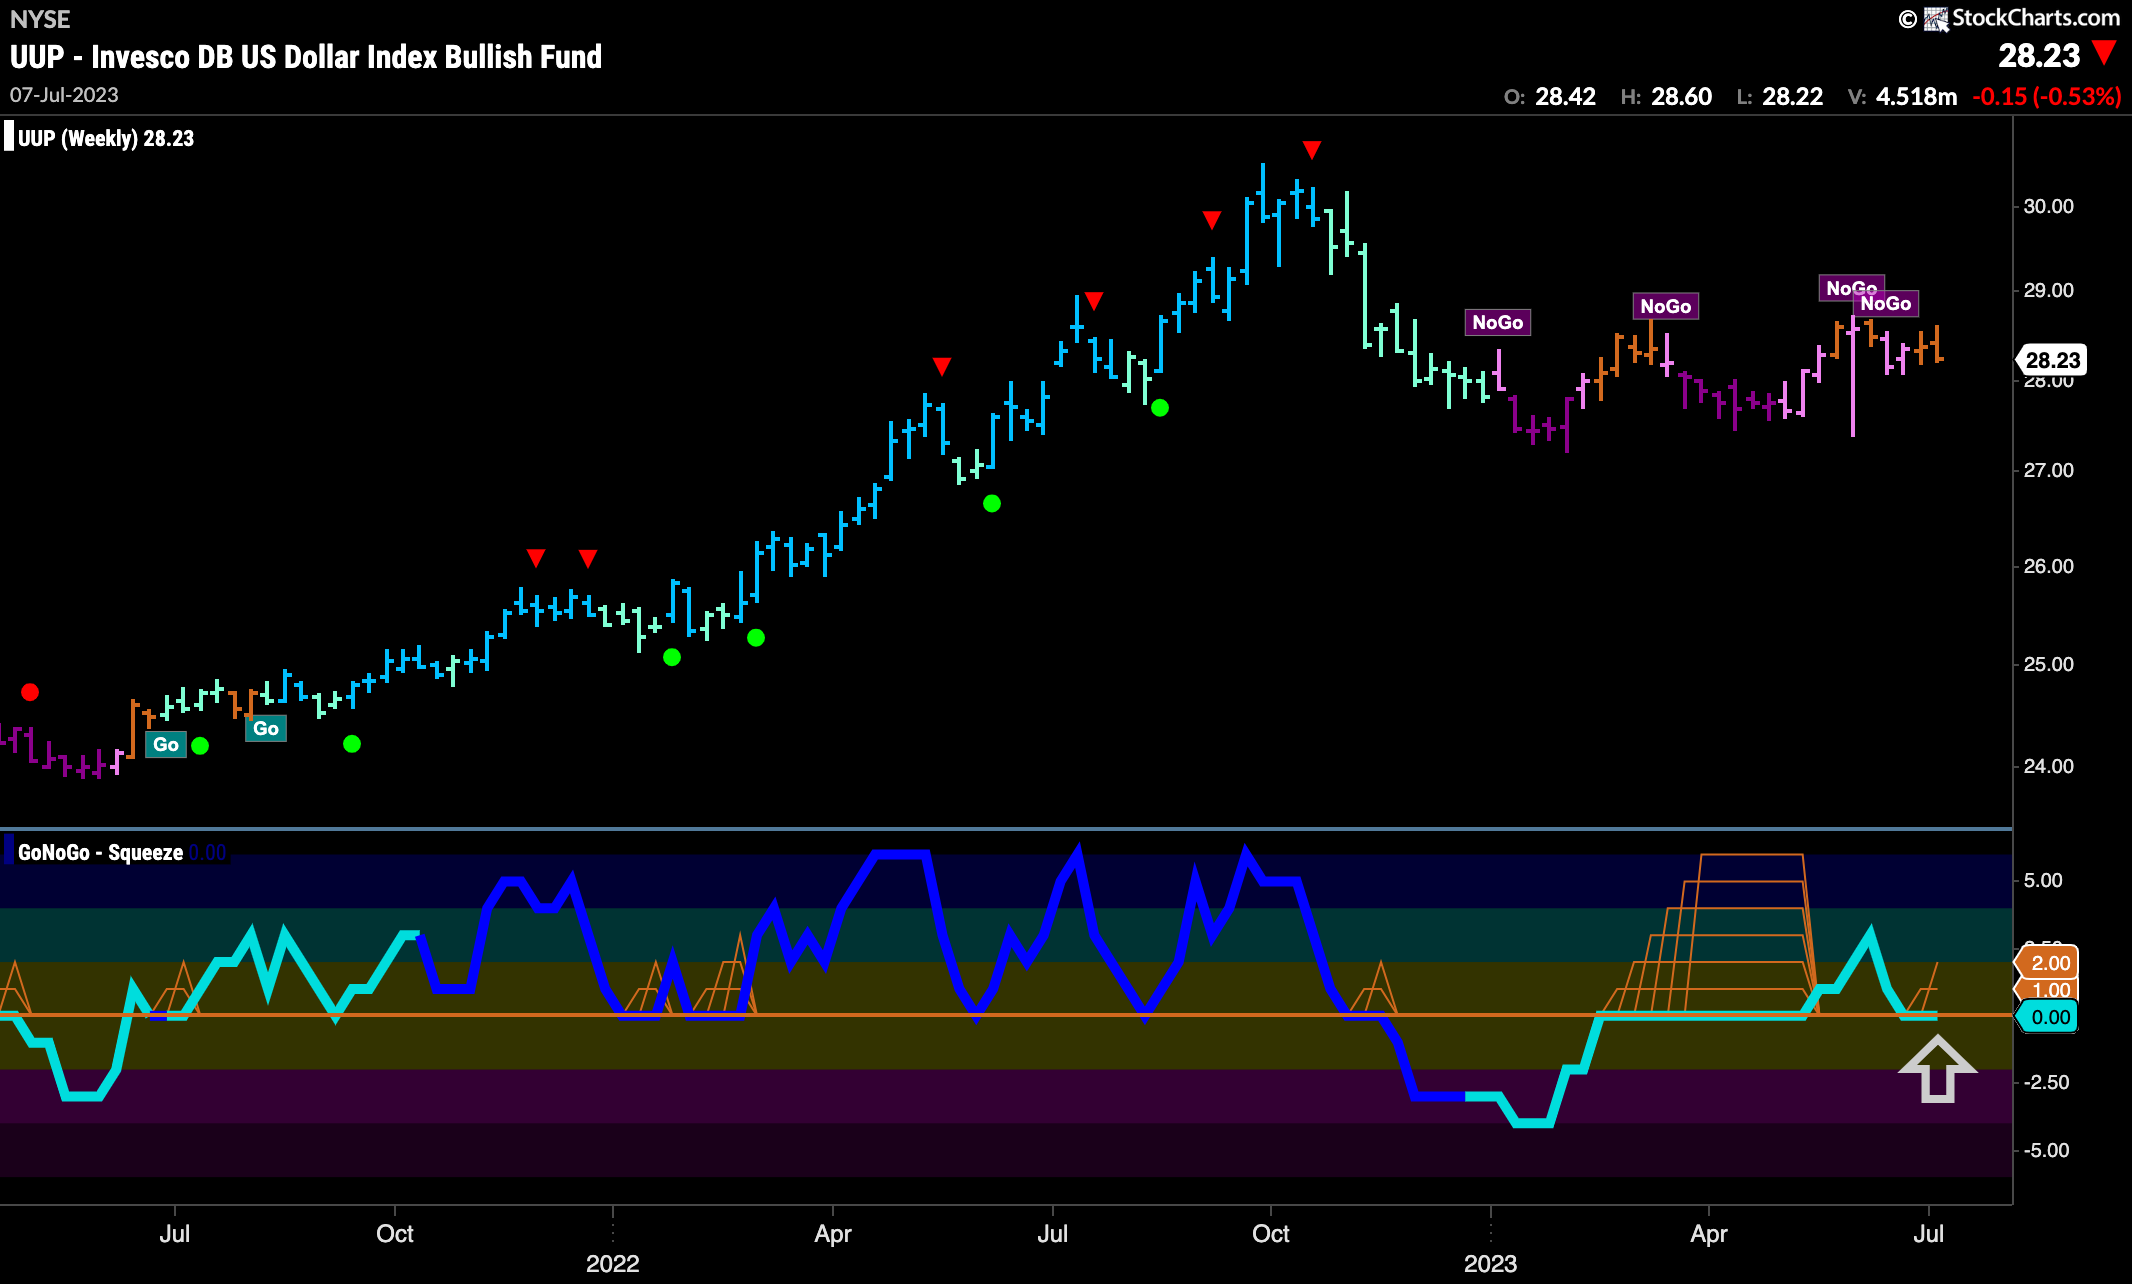
The weekly chart below shows that another amber “Go Fish” bar was painted by the GoNoGo Trend indicator. Still below the prior highs but above prior lows, price seems to be resting. GoNoGo Oscillator seems to confirm this neutrality as it is once again back at the zero line and we see the beginnings of another GoNoGo Squeeze building.
Oil – “NoGo” trend weakens
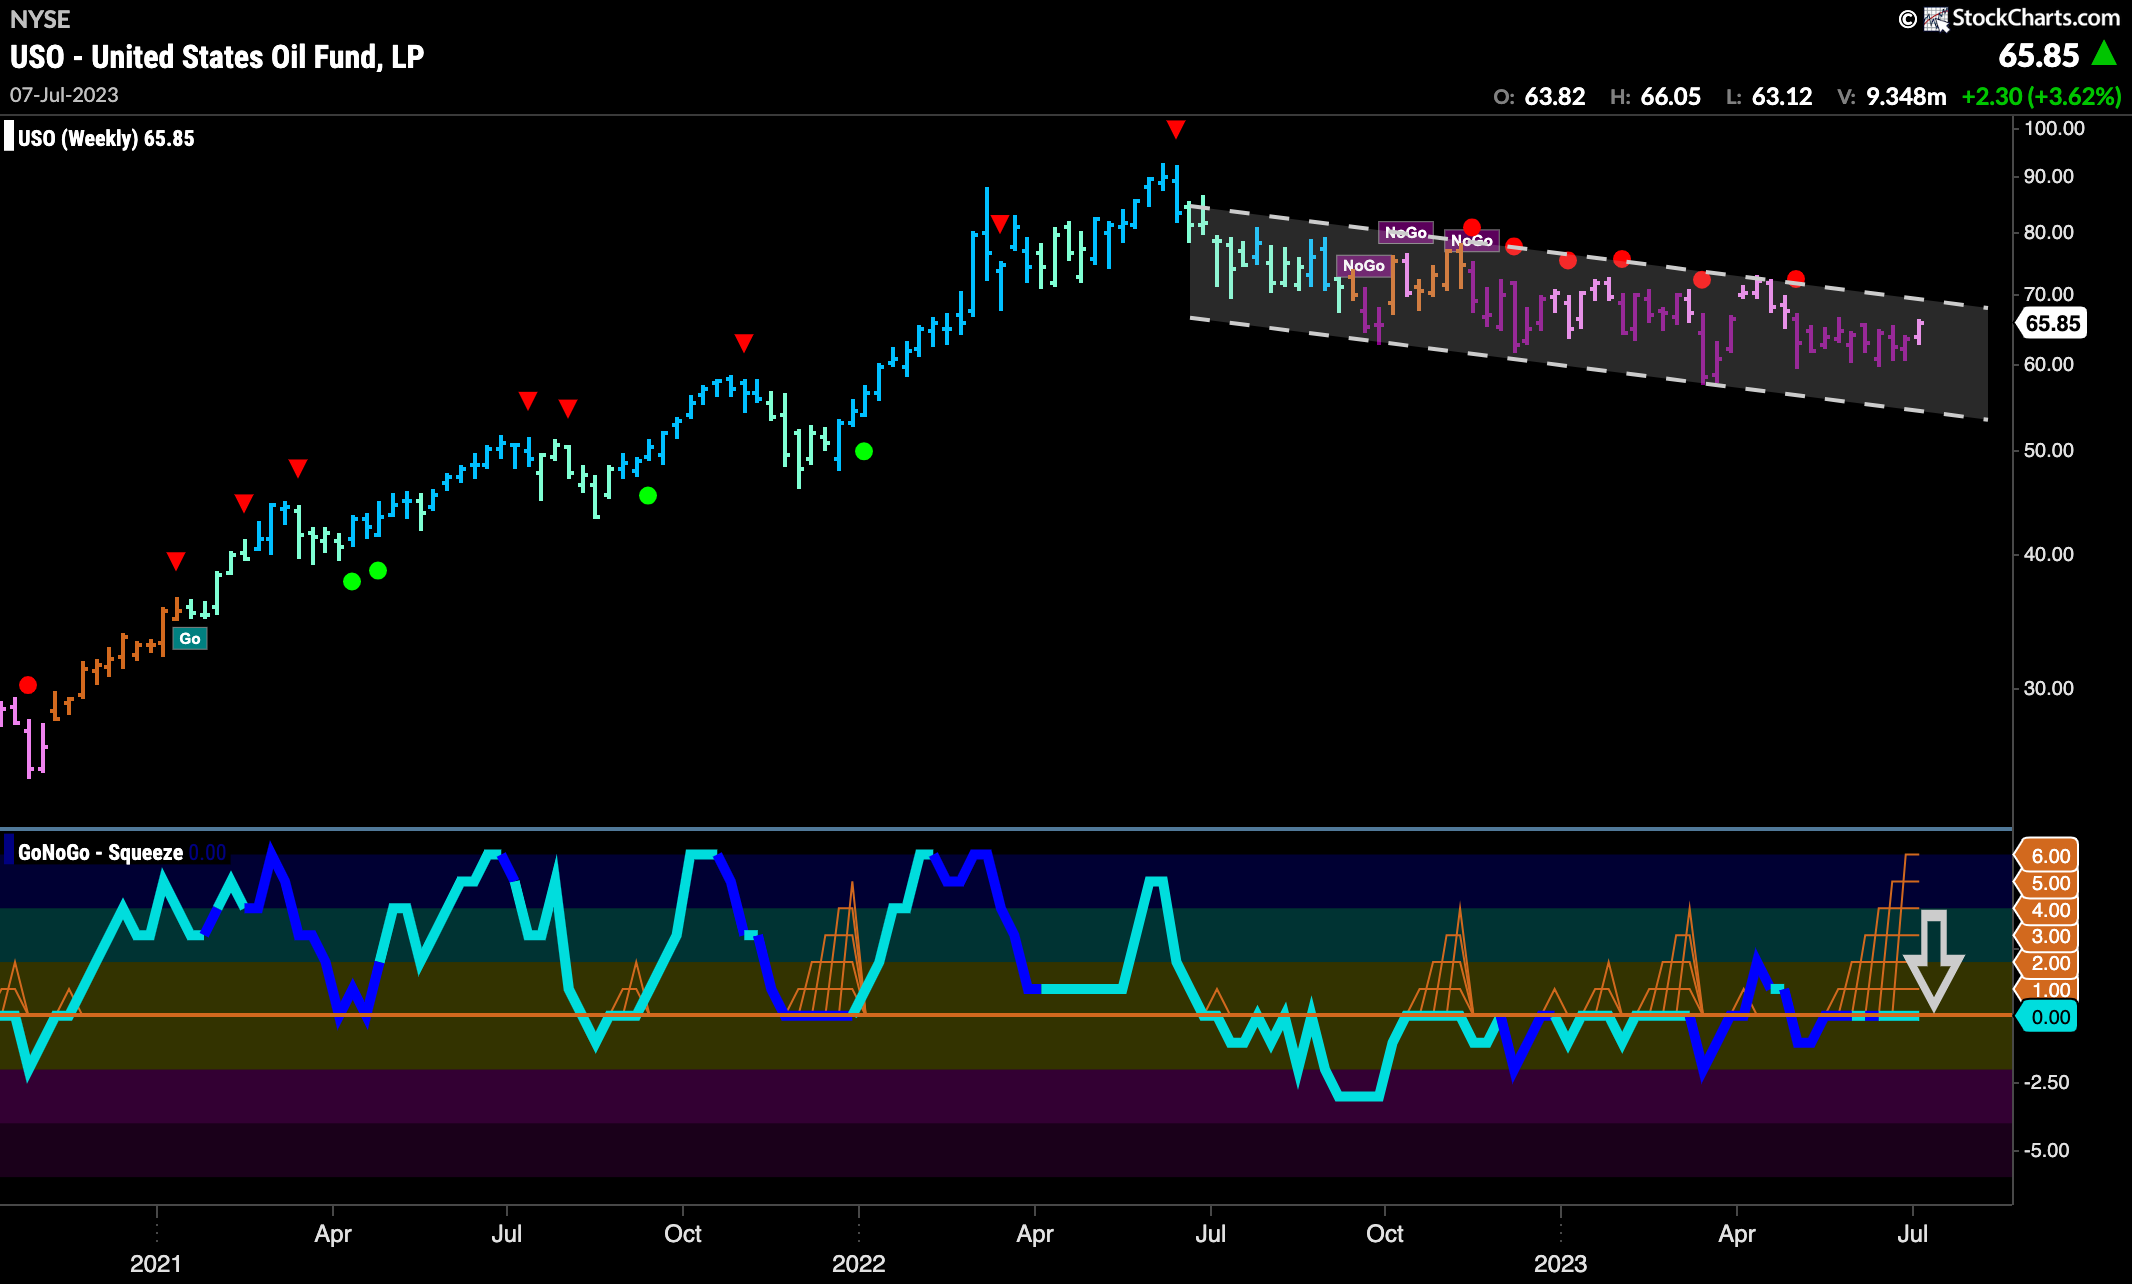
This week sees GoNoGo Trend paint a different color! A weaker pink “NoGo” bar enters the fray as price edges higher, toward the upper bound of the downward sloping trend channel. GoNoGo Oscillator shows that there is little directional momentum and that we are in a Max GoNoGo Squeeze. We will watch to see in which direction the Squeeze is broken and this will give us an indication of price’s next move.
Gold Sees Signs of Divergence
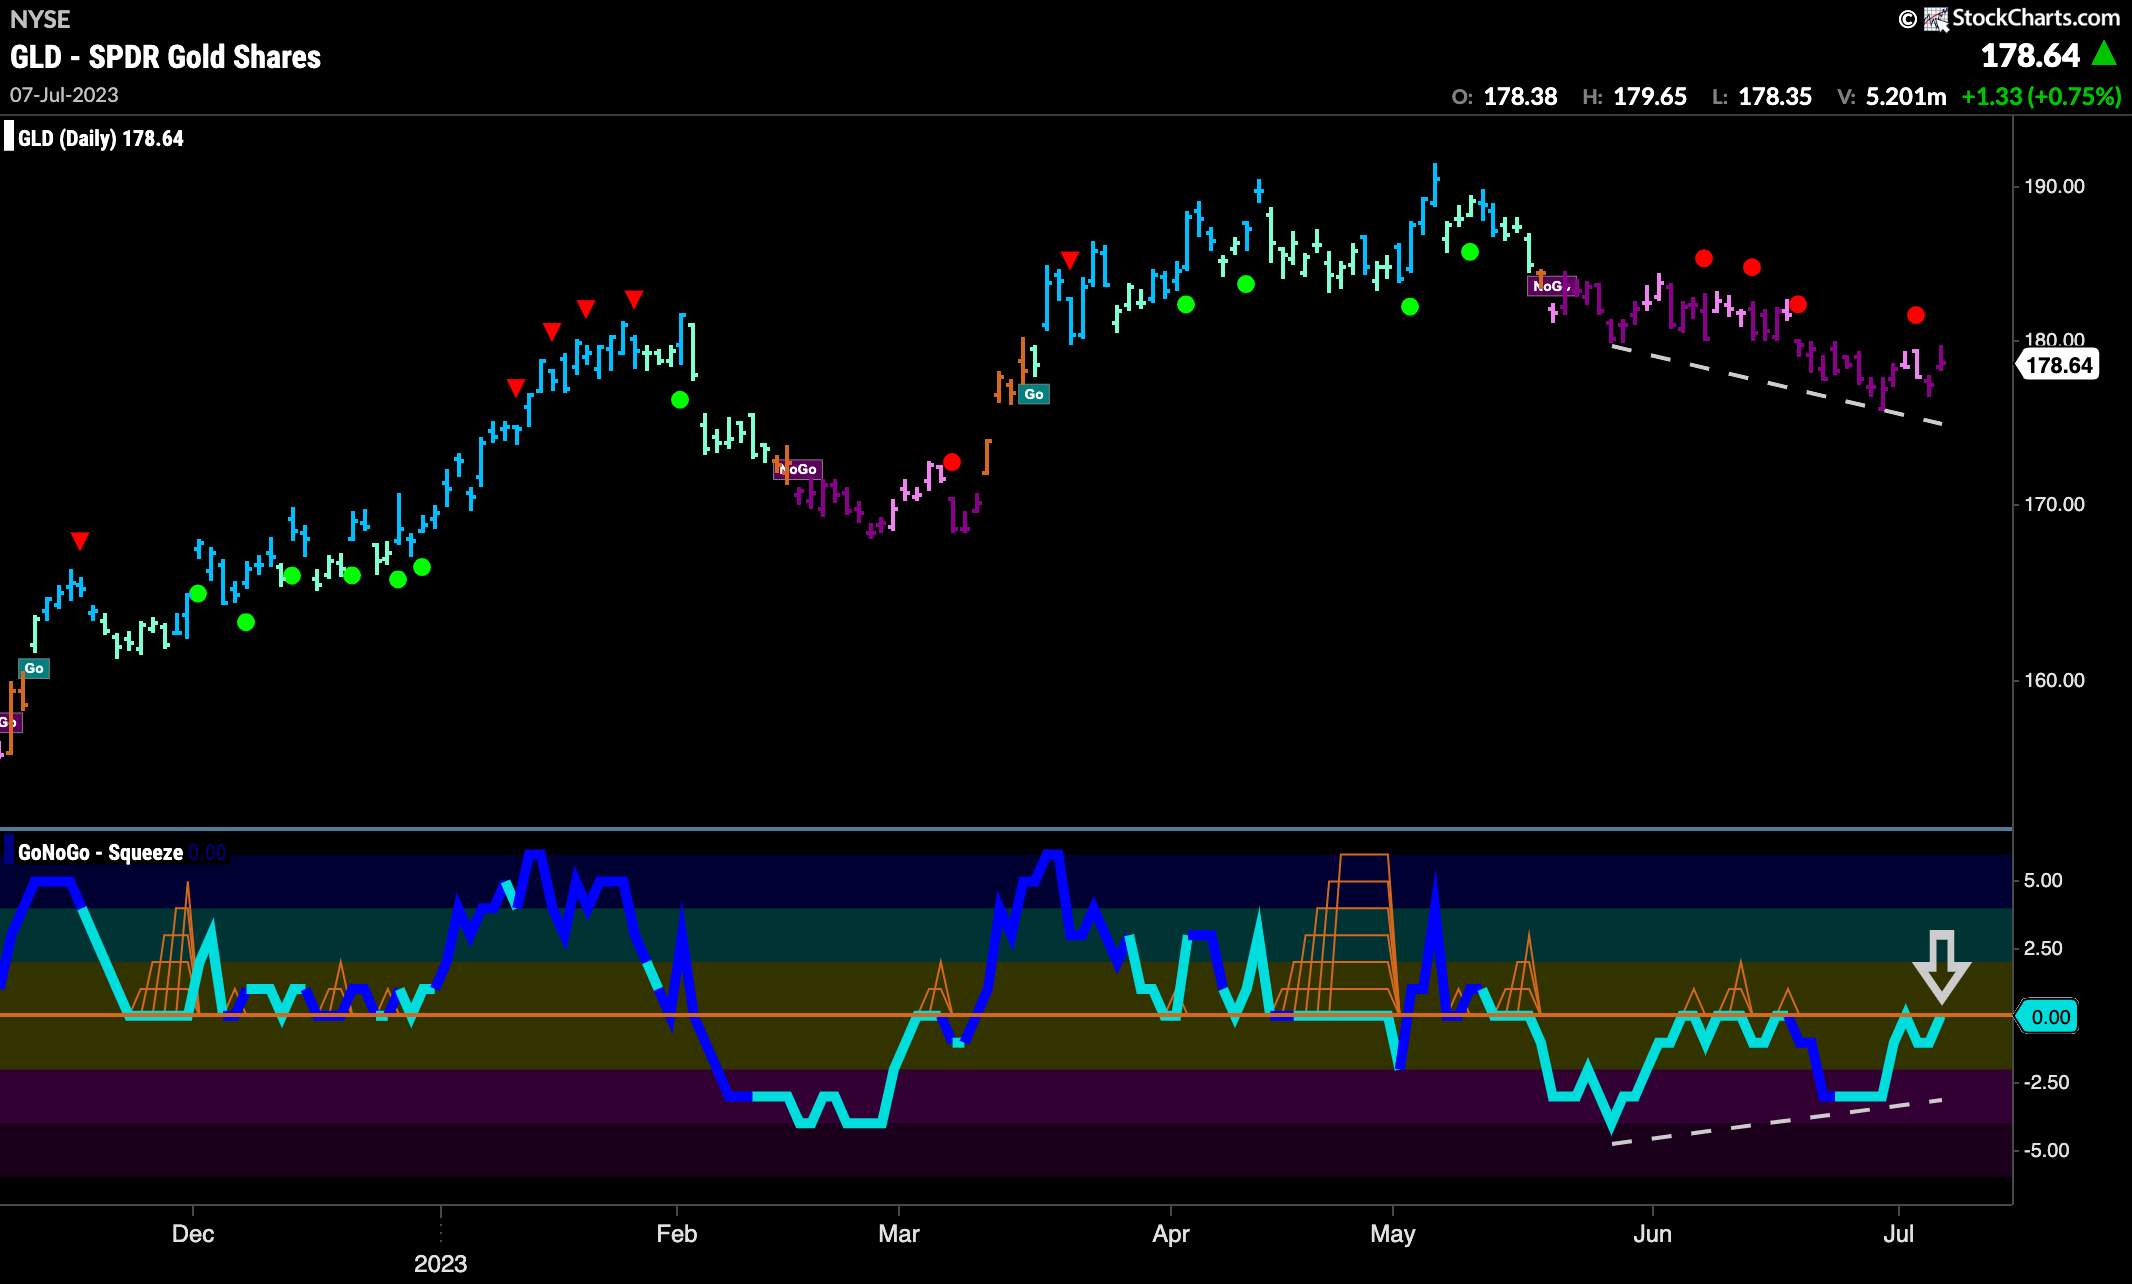
Price is in a “NoGo” trend and saw the week finish with strong purple “NoGo” bars. However, as price has made a series of lower lows, we see that GoNoGo Oscillator has made higher lows. This suggests that there is no confirmation from the oscillator and threatens the price trend. We will watch to see if the zero line continues to act as resistance or if it will give way this time.
Sector RelMap
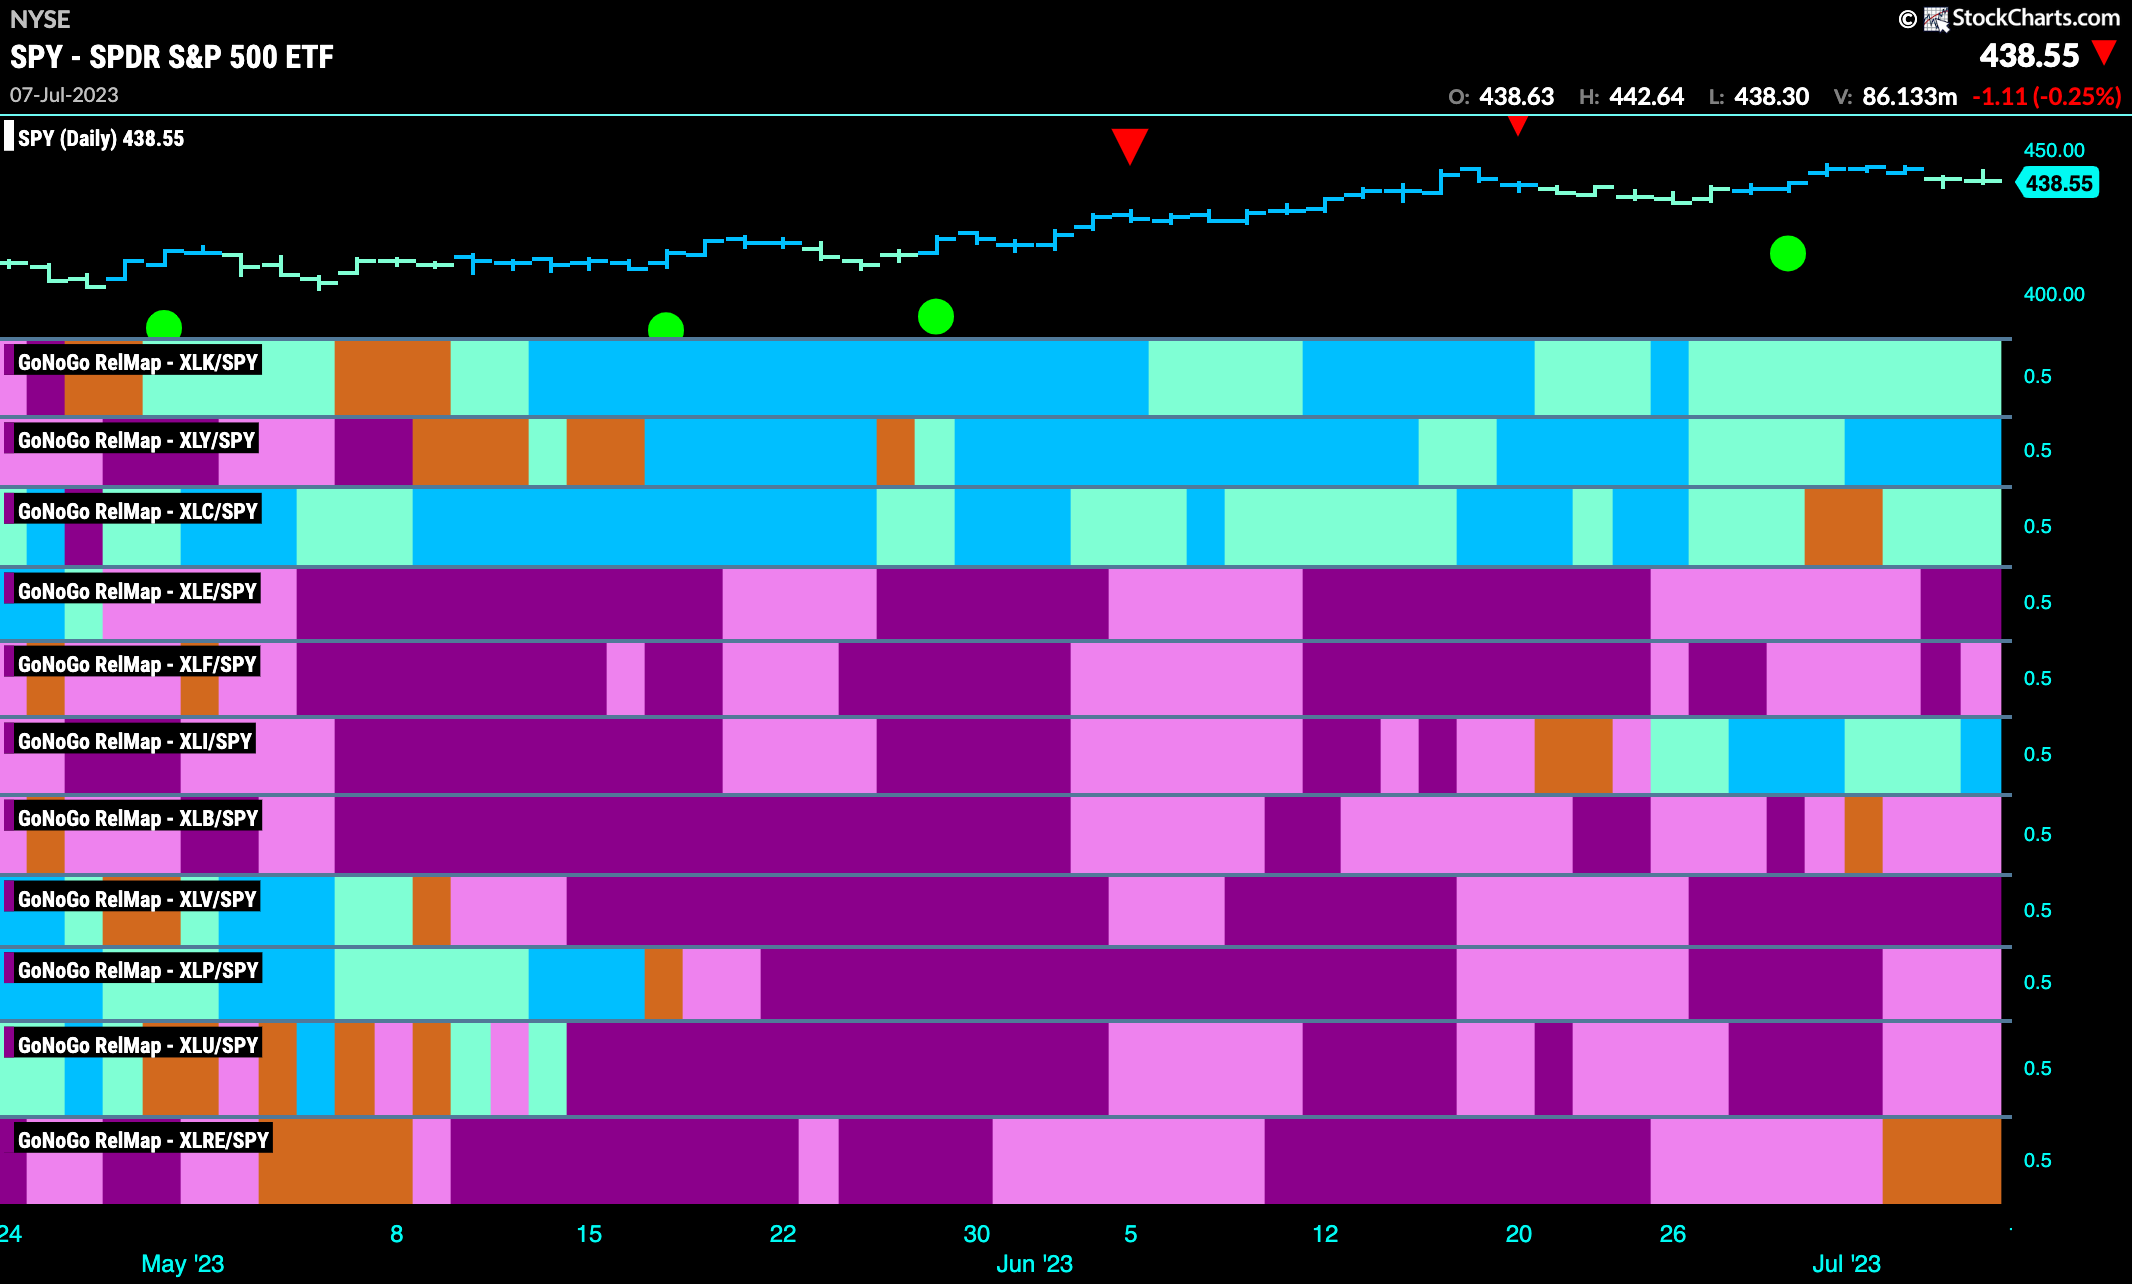
Below is the GoNoGo Sector RelMap. This GoNoGo RelMap applies the GoNoGo Trend to the relative strength ratios of the sectors to the base index. Looking at this map, we can quickly see where the relative outperformance is coming from as well as which sectors are lagging on a relative basis. 3 sectors are outperforming the base index this week. $XLK, $XLY, $XLC and $XLI are painting “Go” bars.
Industrials Inching Higher
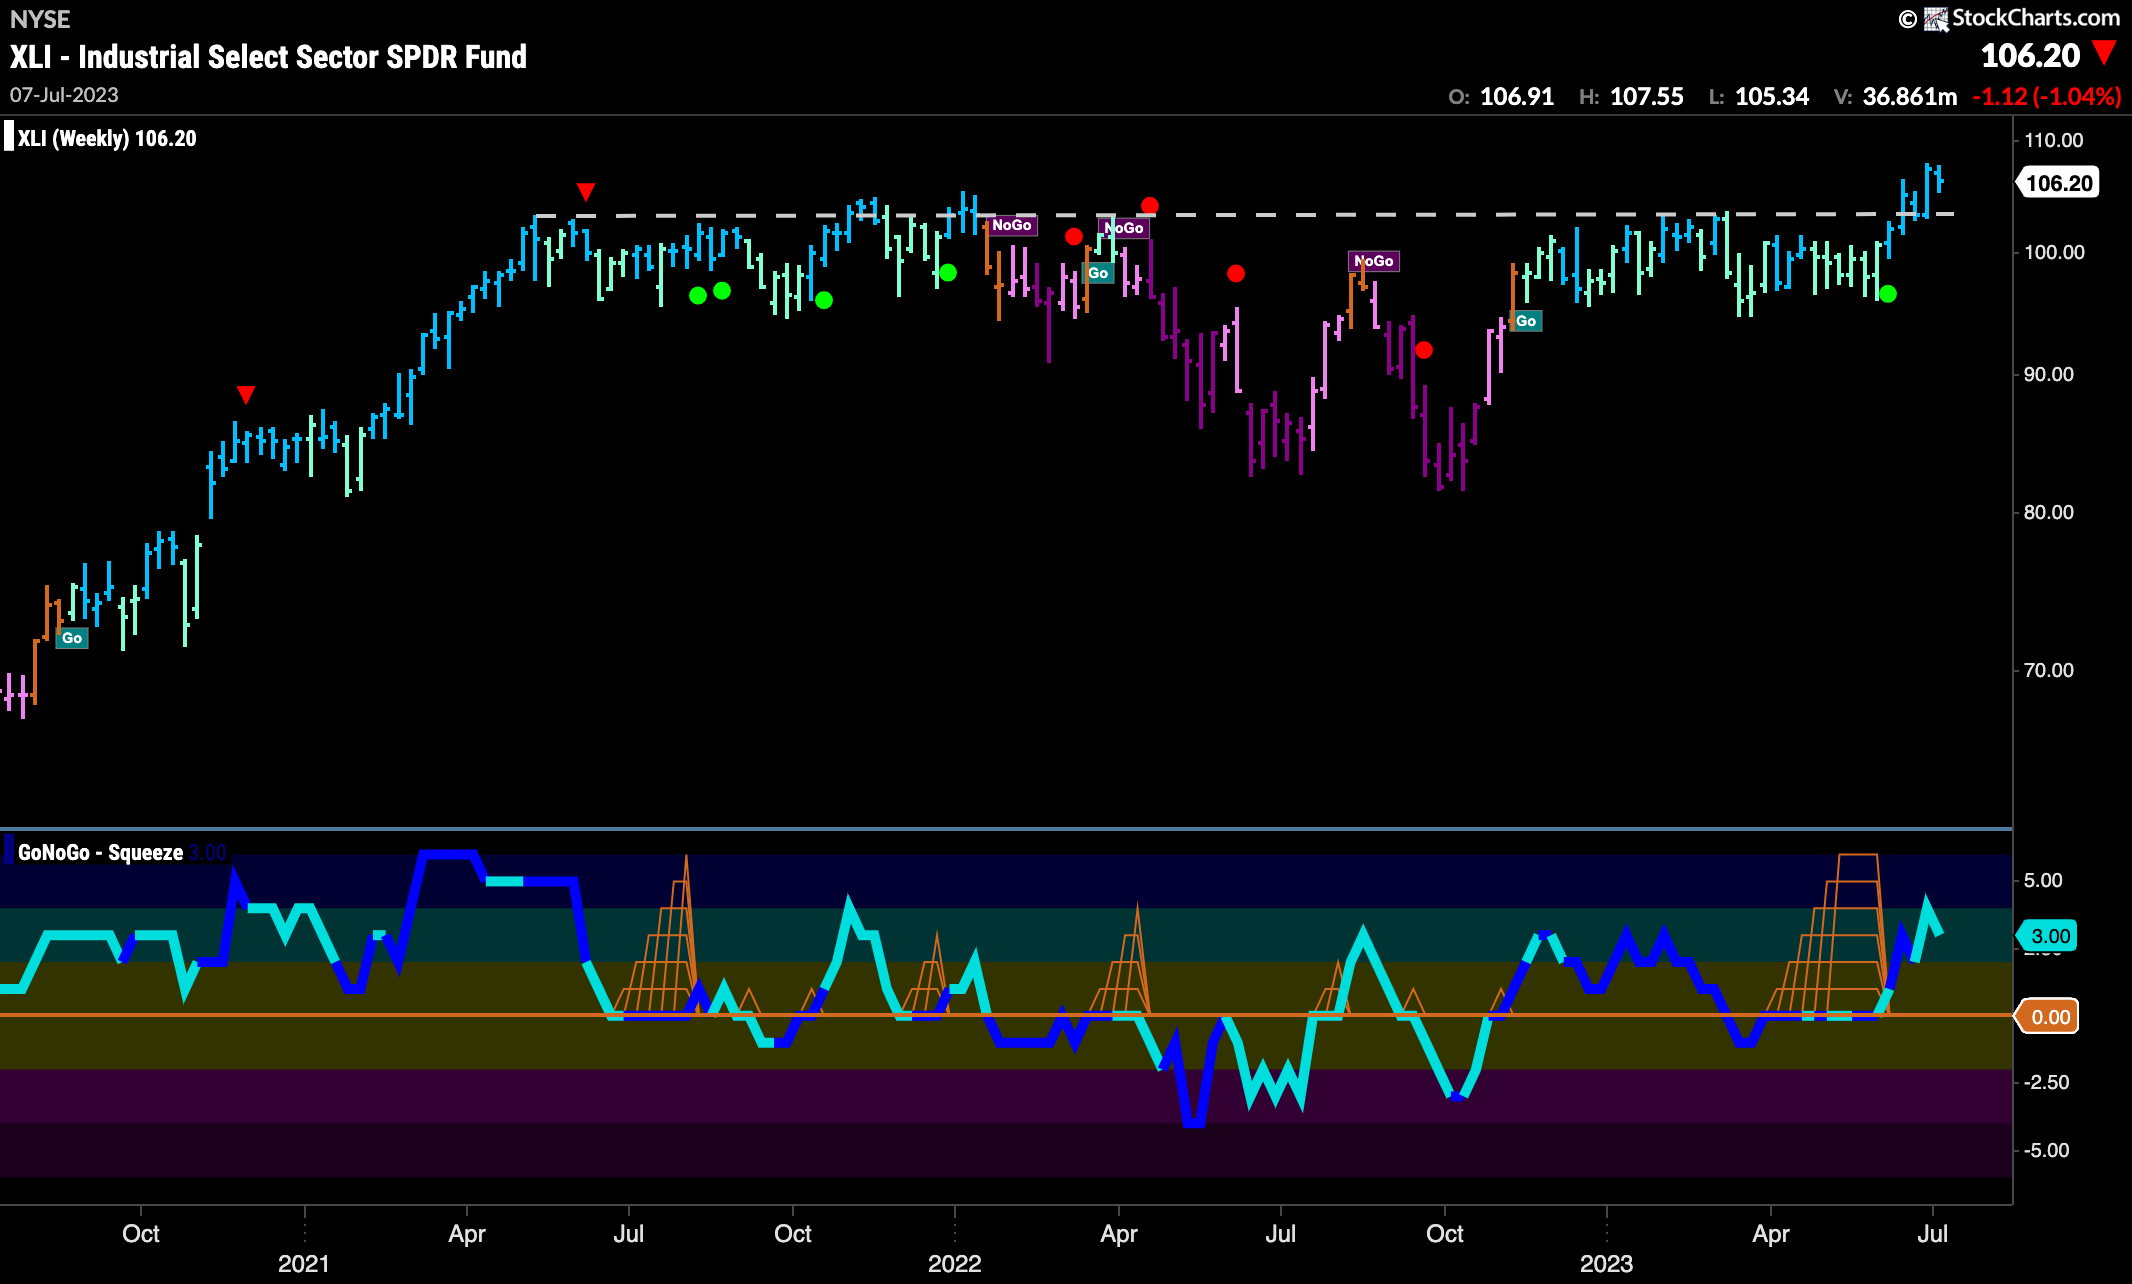
Last week we noted that on the longer term weekly chart the “Go” trend was looking strong and breaking above 2 year resistance. That continues this week with another strong blue “Go” bar above old resistance levels. GoNoGo Oscillator remains in positive territory but not overbought after having broken out of a Max GoNoGo Squeeze.
Relative Strength of Industrials to S&P 500
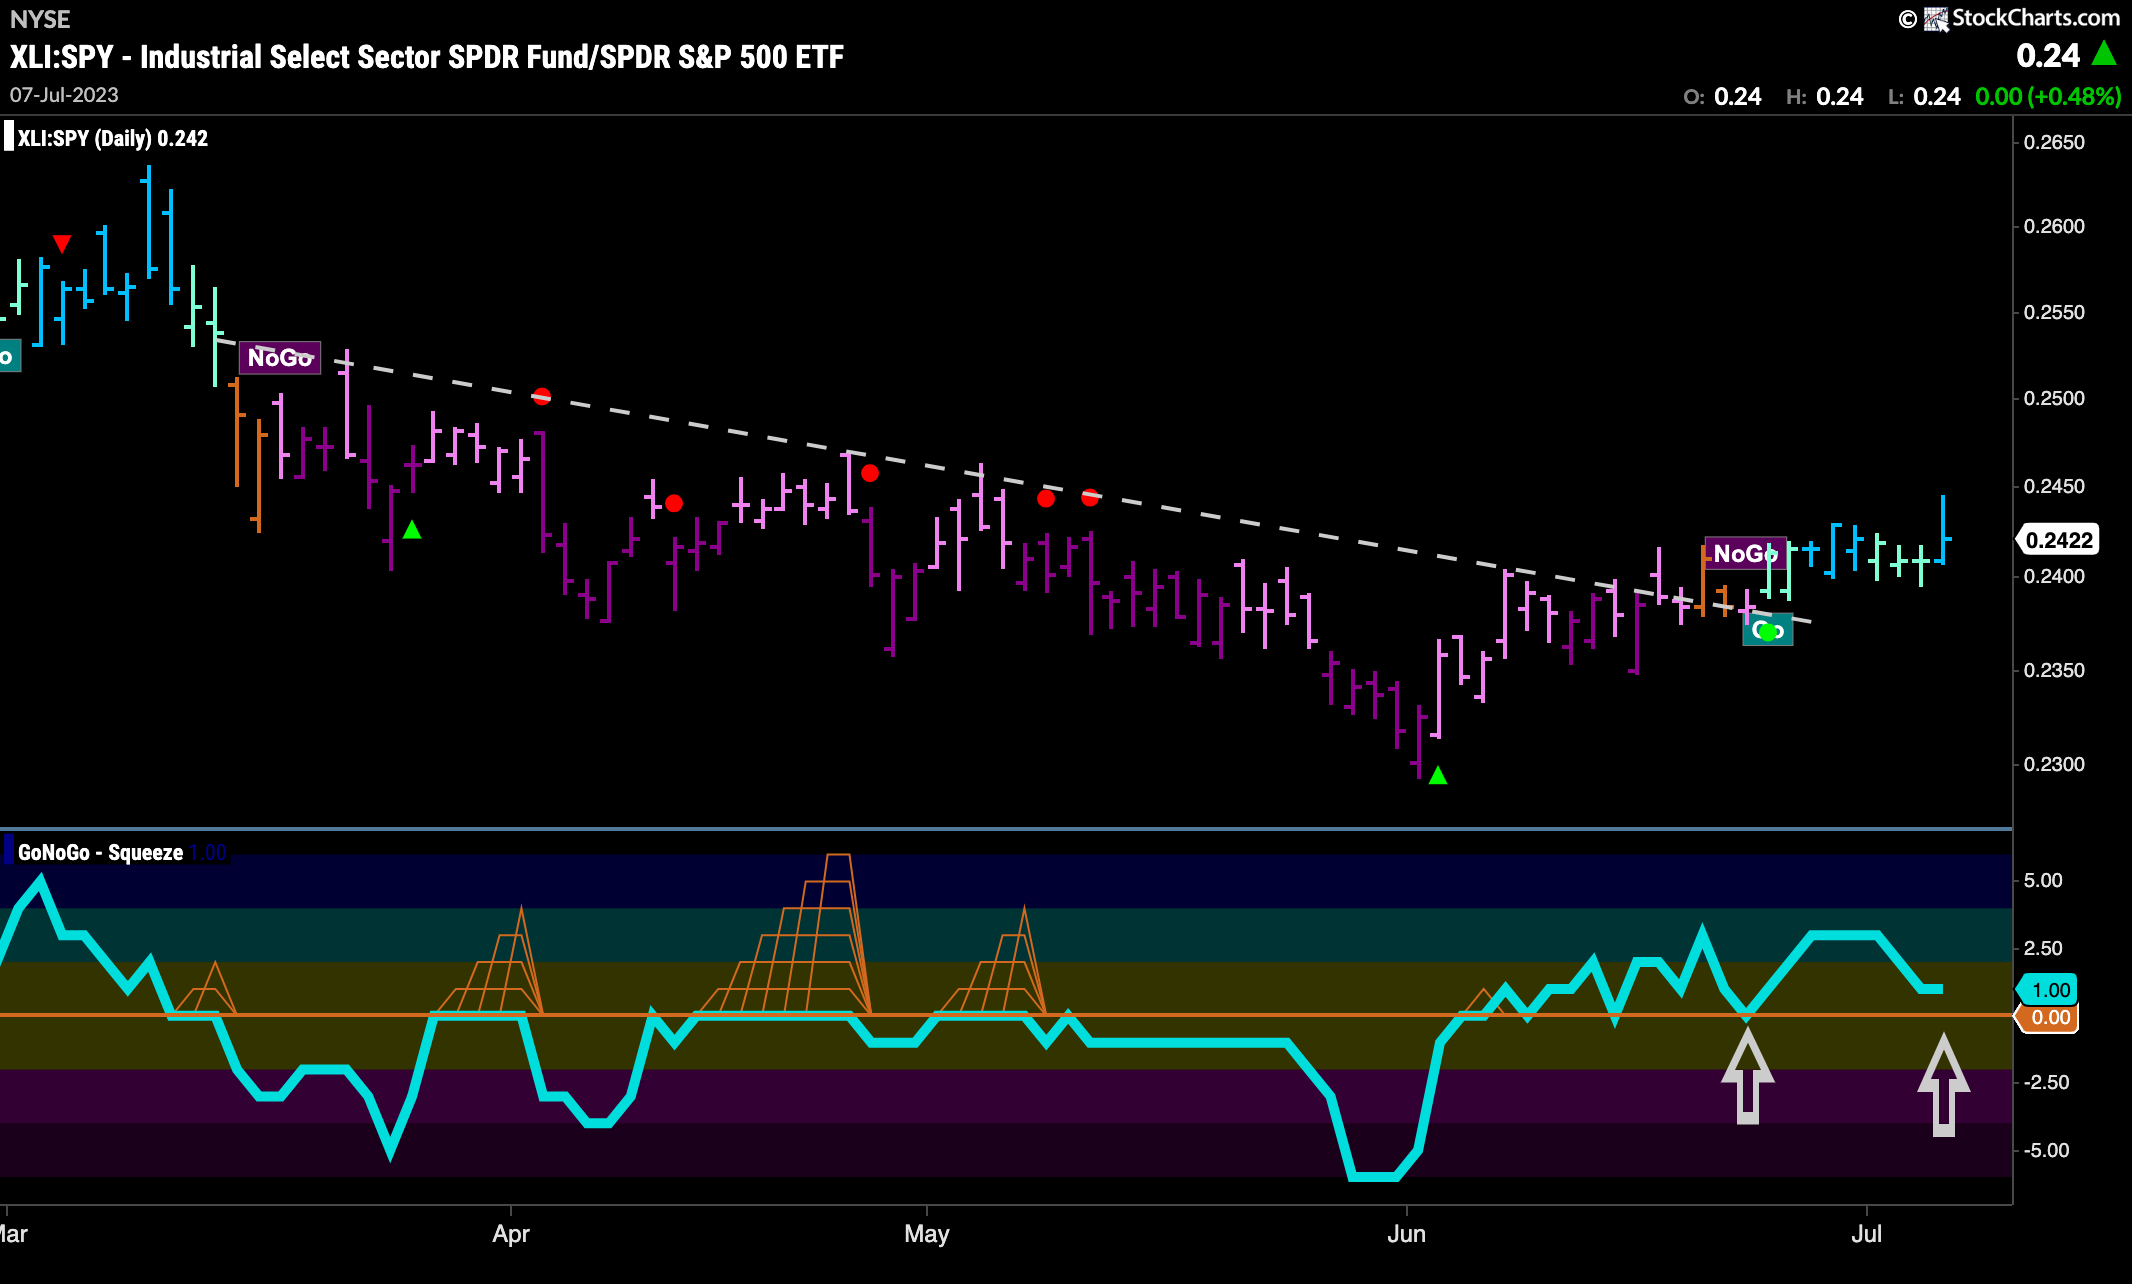
The daily chart below shows the relative strength of industrials to the $SPY and we can see that there has been a definite trend reversal over the last two weeks. The GoNoGo Oscillator tipped us off several bars earlier as it broke above the zero line. As it then continued to find support at that level we saw price break above a downward sloping trend line and GoNoGo Trend paint amber and then “Go” bars. This trend ended the week with a strong blue “Go” bar.
Big $CAT Ready to Pounce
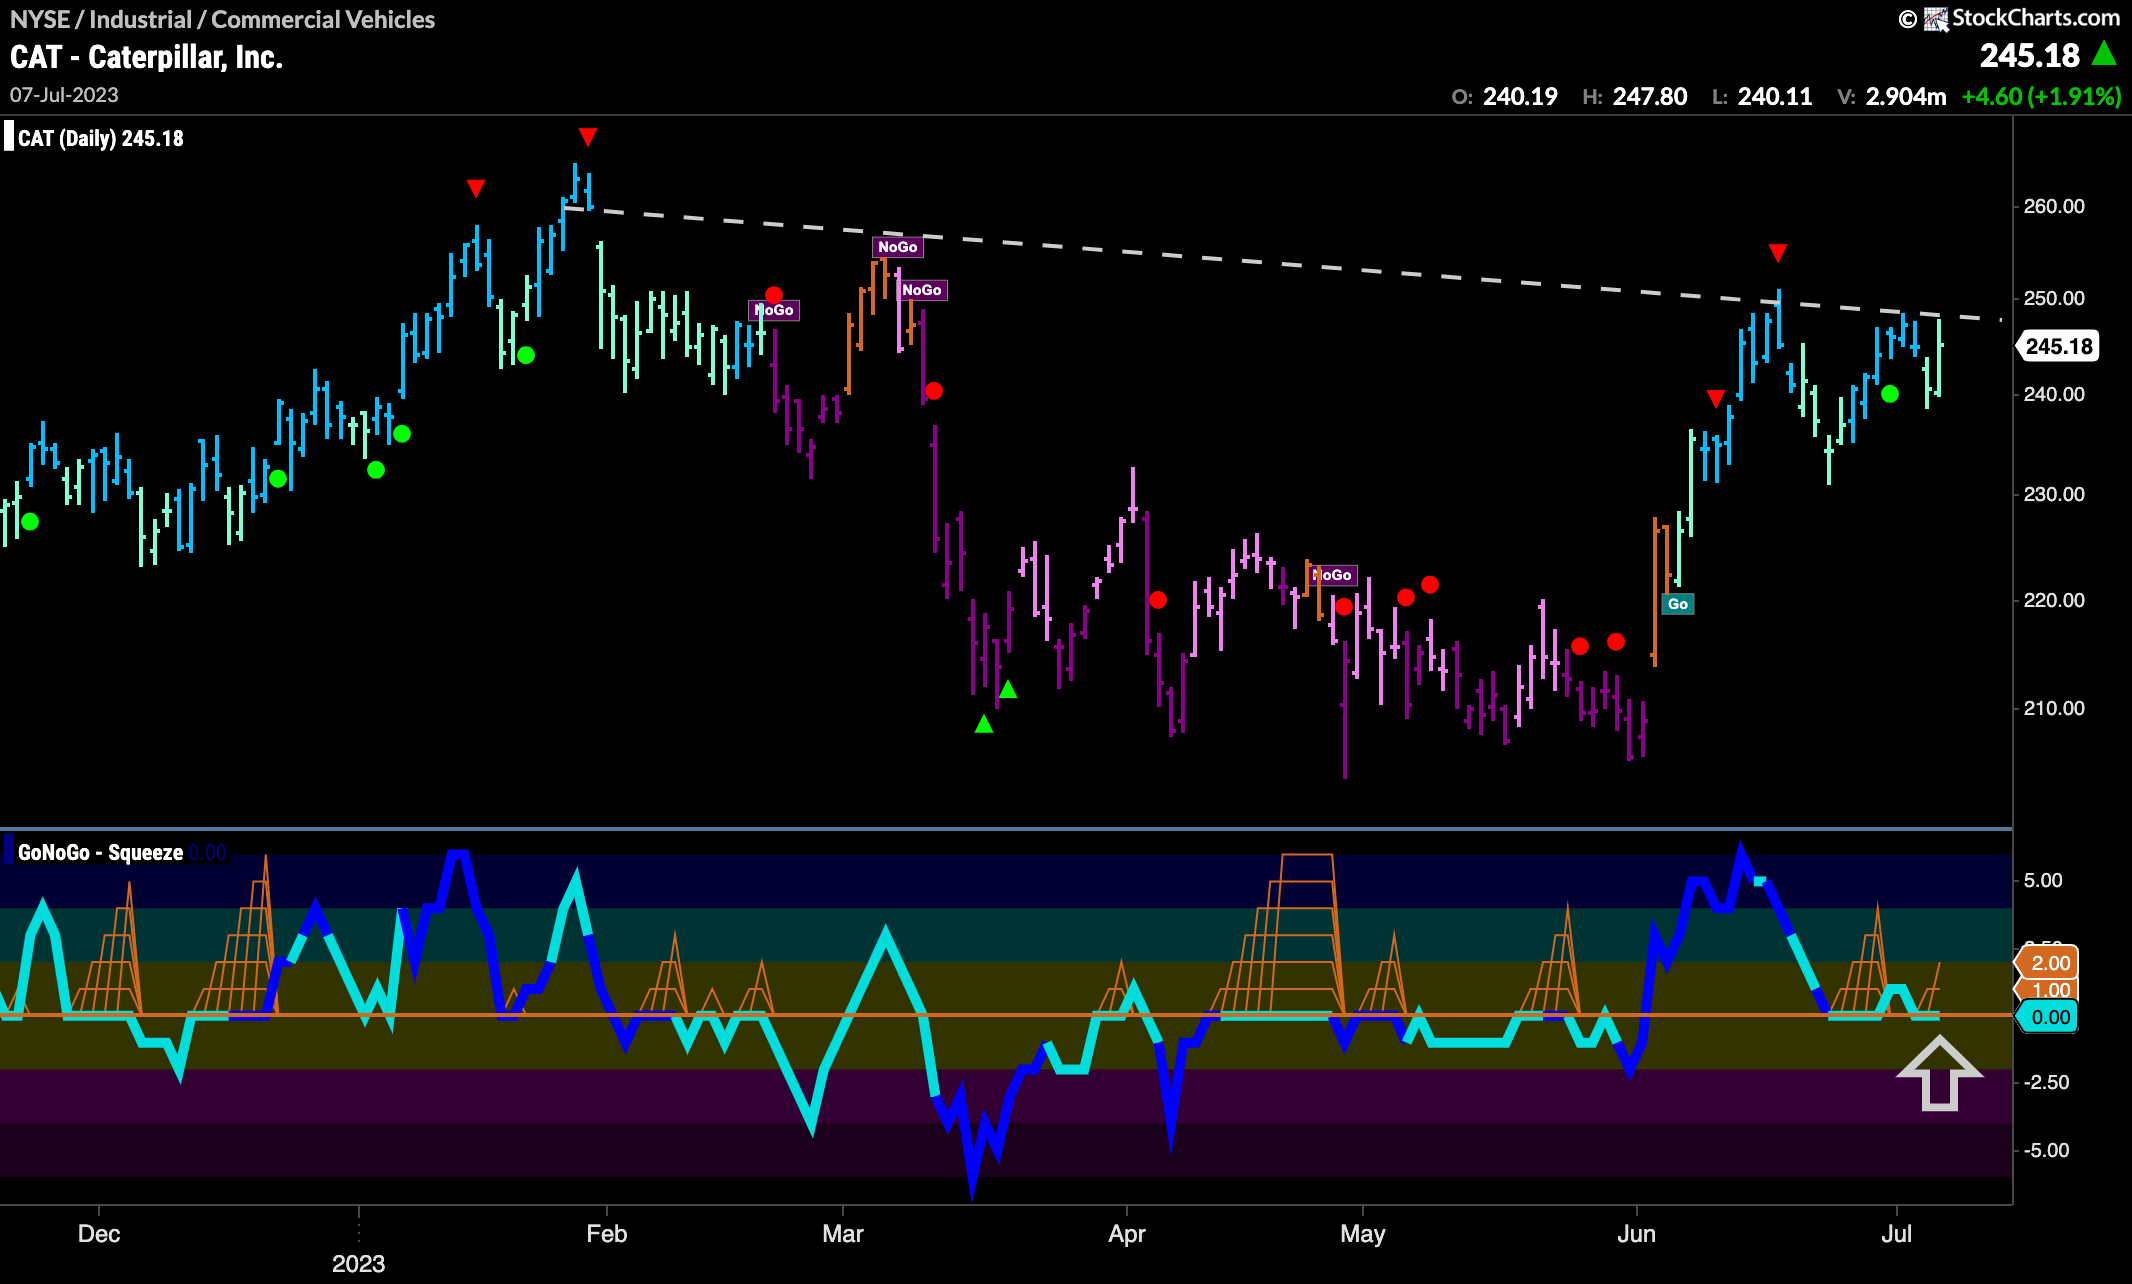
A giant in the industrials sector, $CAT has seen a “Go” trend emerge in June and survived since then. However, until now we see that downward sloping resistance has been too much for price to overcome. GoNoGo Oscillator is testing the zero line from above and we will watch to see if it can continue to find support. If the oscillator rallies back into positive territory then we could expect price to seriously challenge overhead resistance and perhaps set a new higher high.
