Good morning and welcome to this week’s Flight Path. The equity trend remains a “Go” but we have seen the indicator paint consecutive weaker aqua bars after falling from the Go Countertrend Correction Icon (red arrow) at the last high. Treasury bond prices have settled back into a “NoGo” trend having had over a week of market uncertainty and amber “Go Fish” bars. U.S. commodities paint strong purple bars as the “Go” trend ends. The dollar has been strong for the entire week as GoNoGo Trend paints an uninterrupted string of bright blue bars.
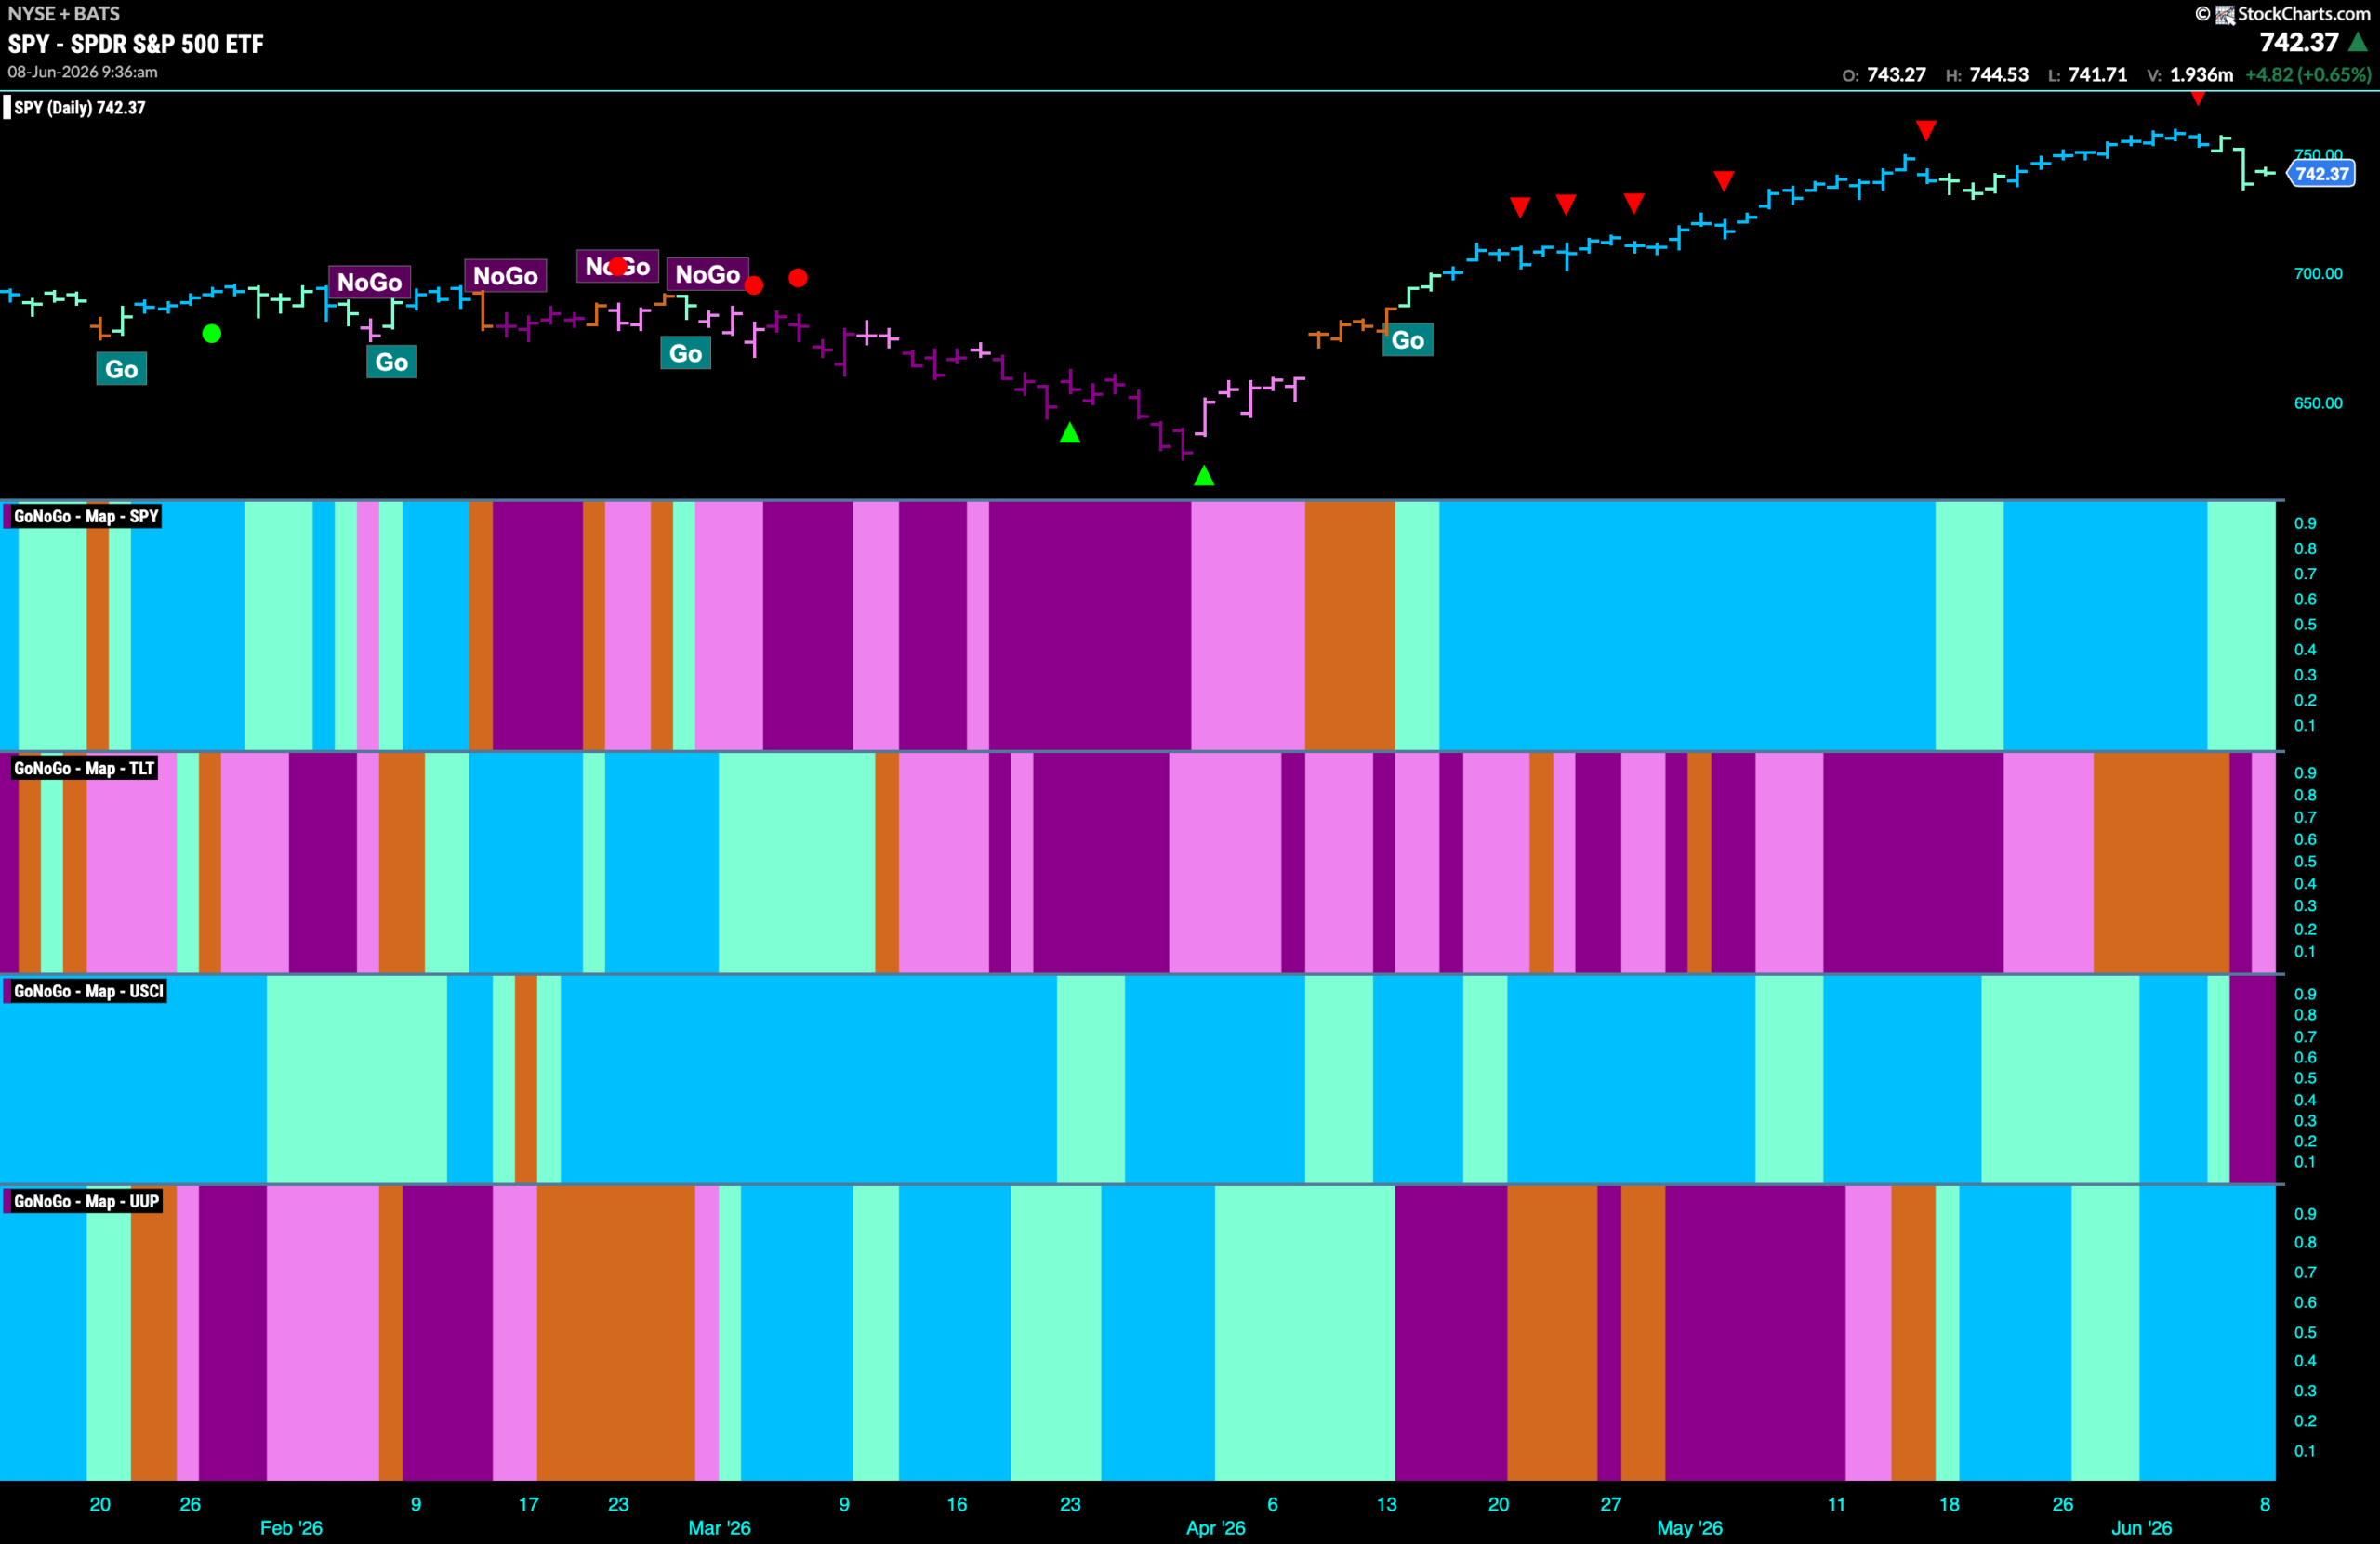
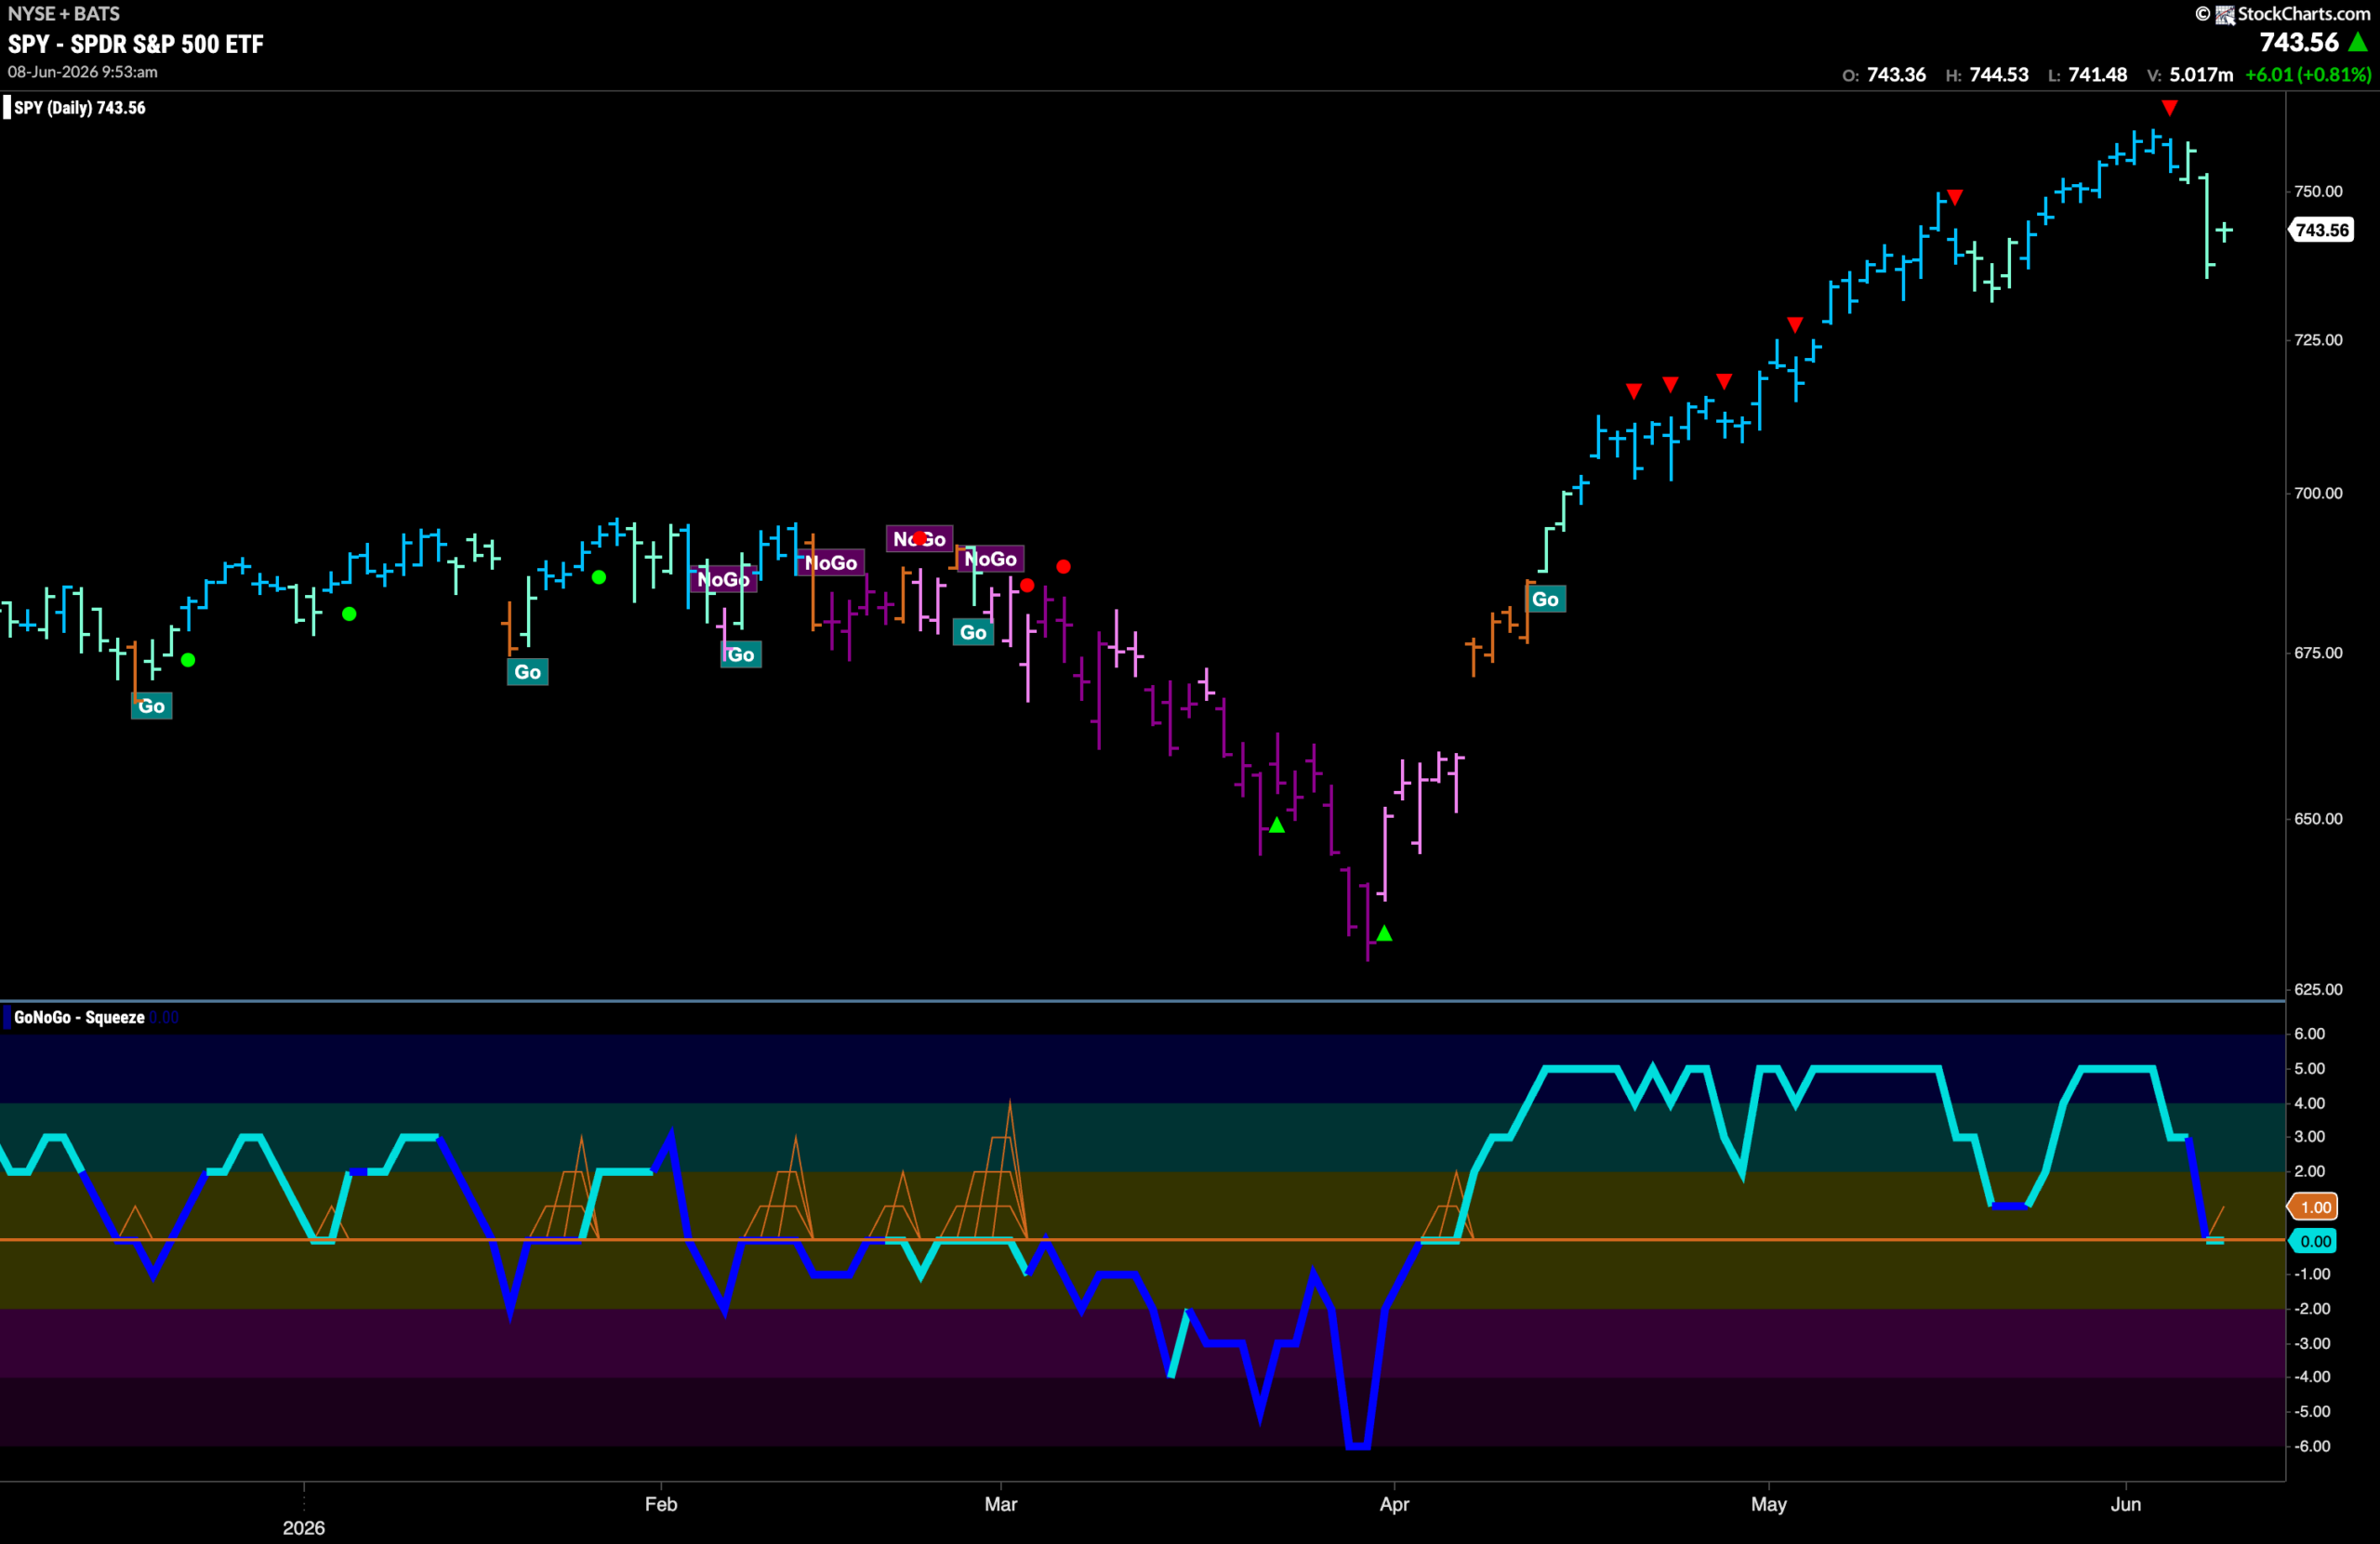
$SPY Falls From High
The GoNoGo chart below shows that the “Go” trend has remained in place for U.S. equities but we do see weaker aqua bars as price has fallen from the latest high. This comes after we saw a Go Countertrend Correction Icon at the last high (red arrow) indicating that price may struggle to go higher in the short term due to waning momentum. Now when we turn our attention to the lower panel we can see that GoNoGo Oscillator has fallen all the way to test the zero line. It will be important to note if the oscillator finds support at this level. If it does then we can expect the “Go” trend to continue on resurgent momentum.
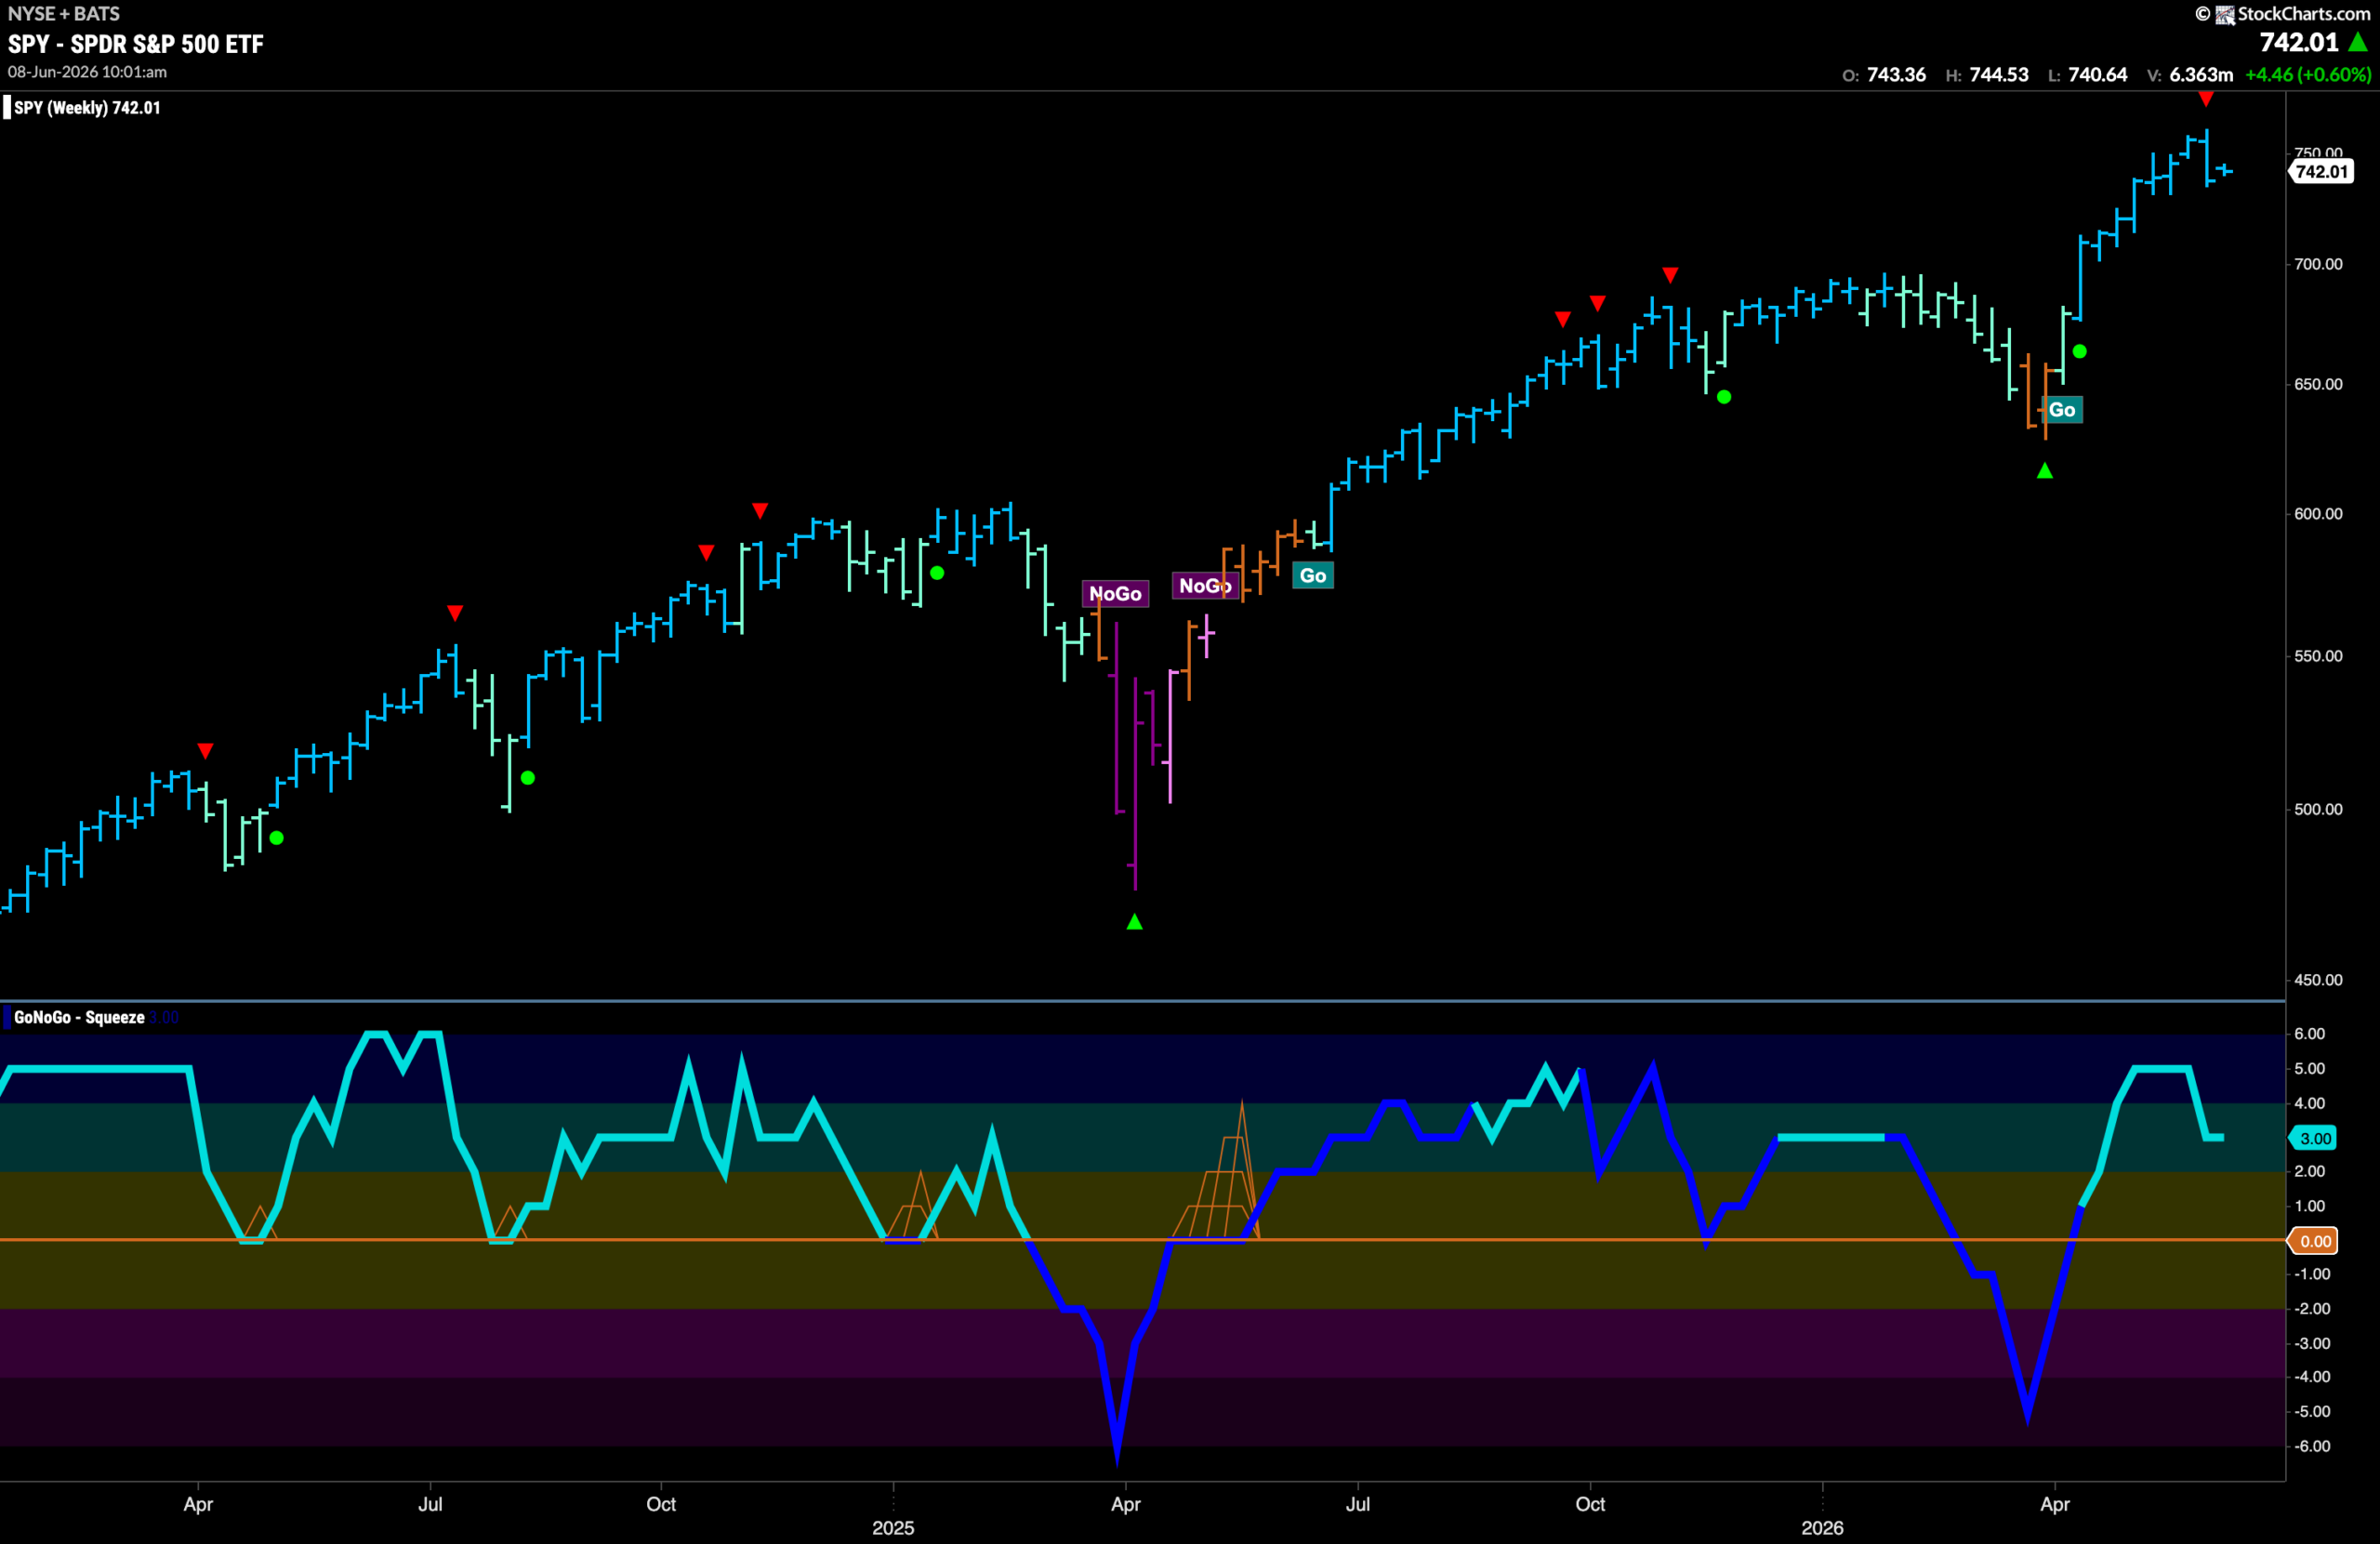
The weekly chart shows that the GoNoGo Trend indicator paints another “Go” bar but we do acknowledge the Go Countertrend Correction Icon (red arrow) that we see on the price chart. This tells us that price may struggle to go higher in the short term due to waning momentum. If we look at the oscillator panel we can see that it has fallen out of overbought territory but is not yet near the zero line at a value of 3.
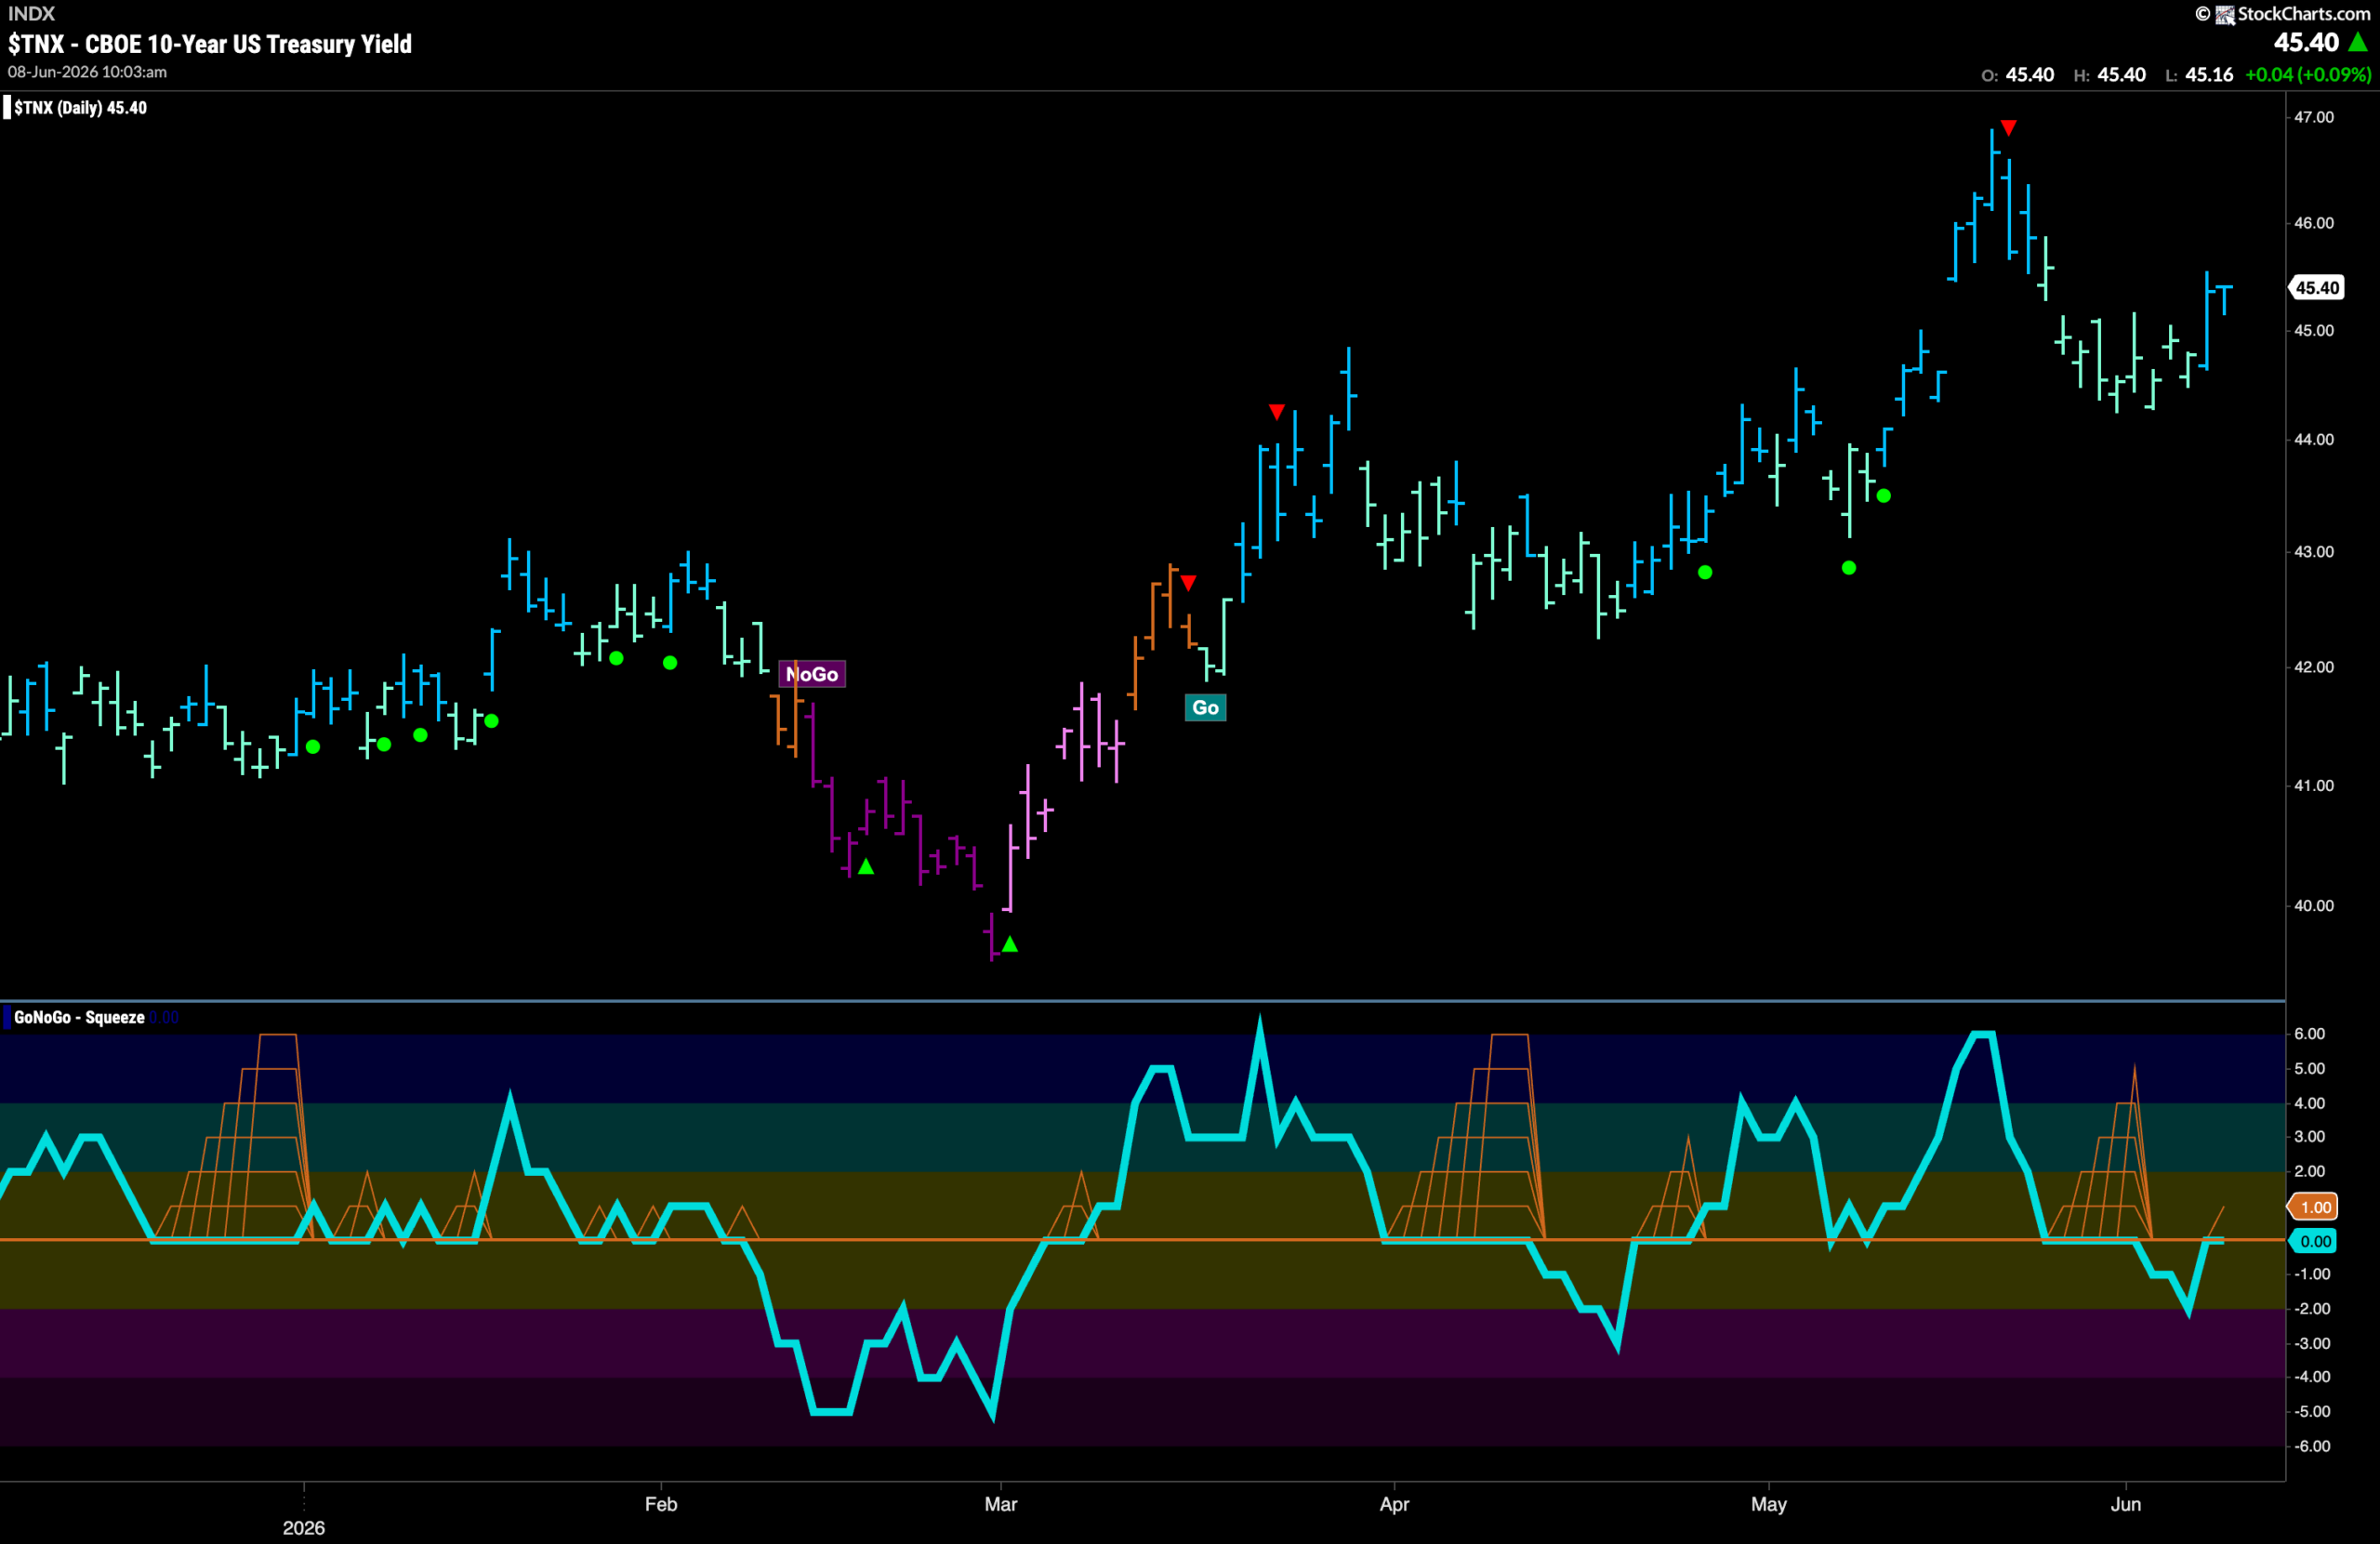
Treasury Rates See Strength in “Go” Return
GoNoGo Trend shows that the “Go” trend is still in place and we have seen price support as the string of weaker aqua bars has been replaced by a couple of strong blue “Go” bars as price makes a new higher low. Looking at the oscillator panel we see that GoNoGo Oscillator has recovered to challenge the zero line from below and we will watch to see if it can regain positive territory. If it does, we would know that momentum is once again on the side of rising rates and we’d look for an attempt at a new higher high.
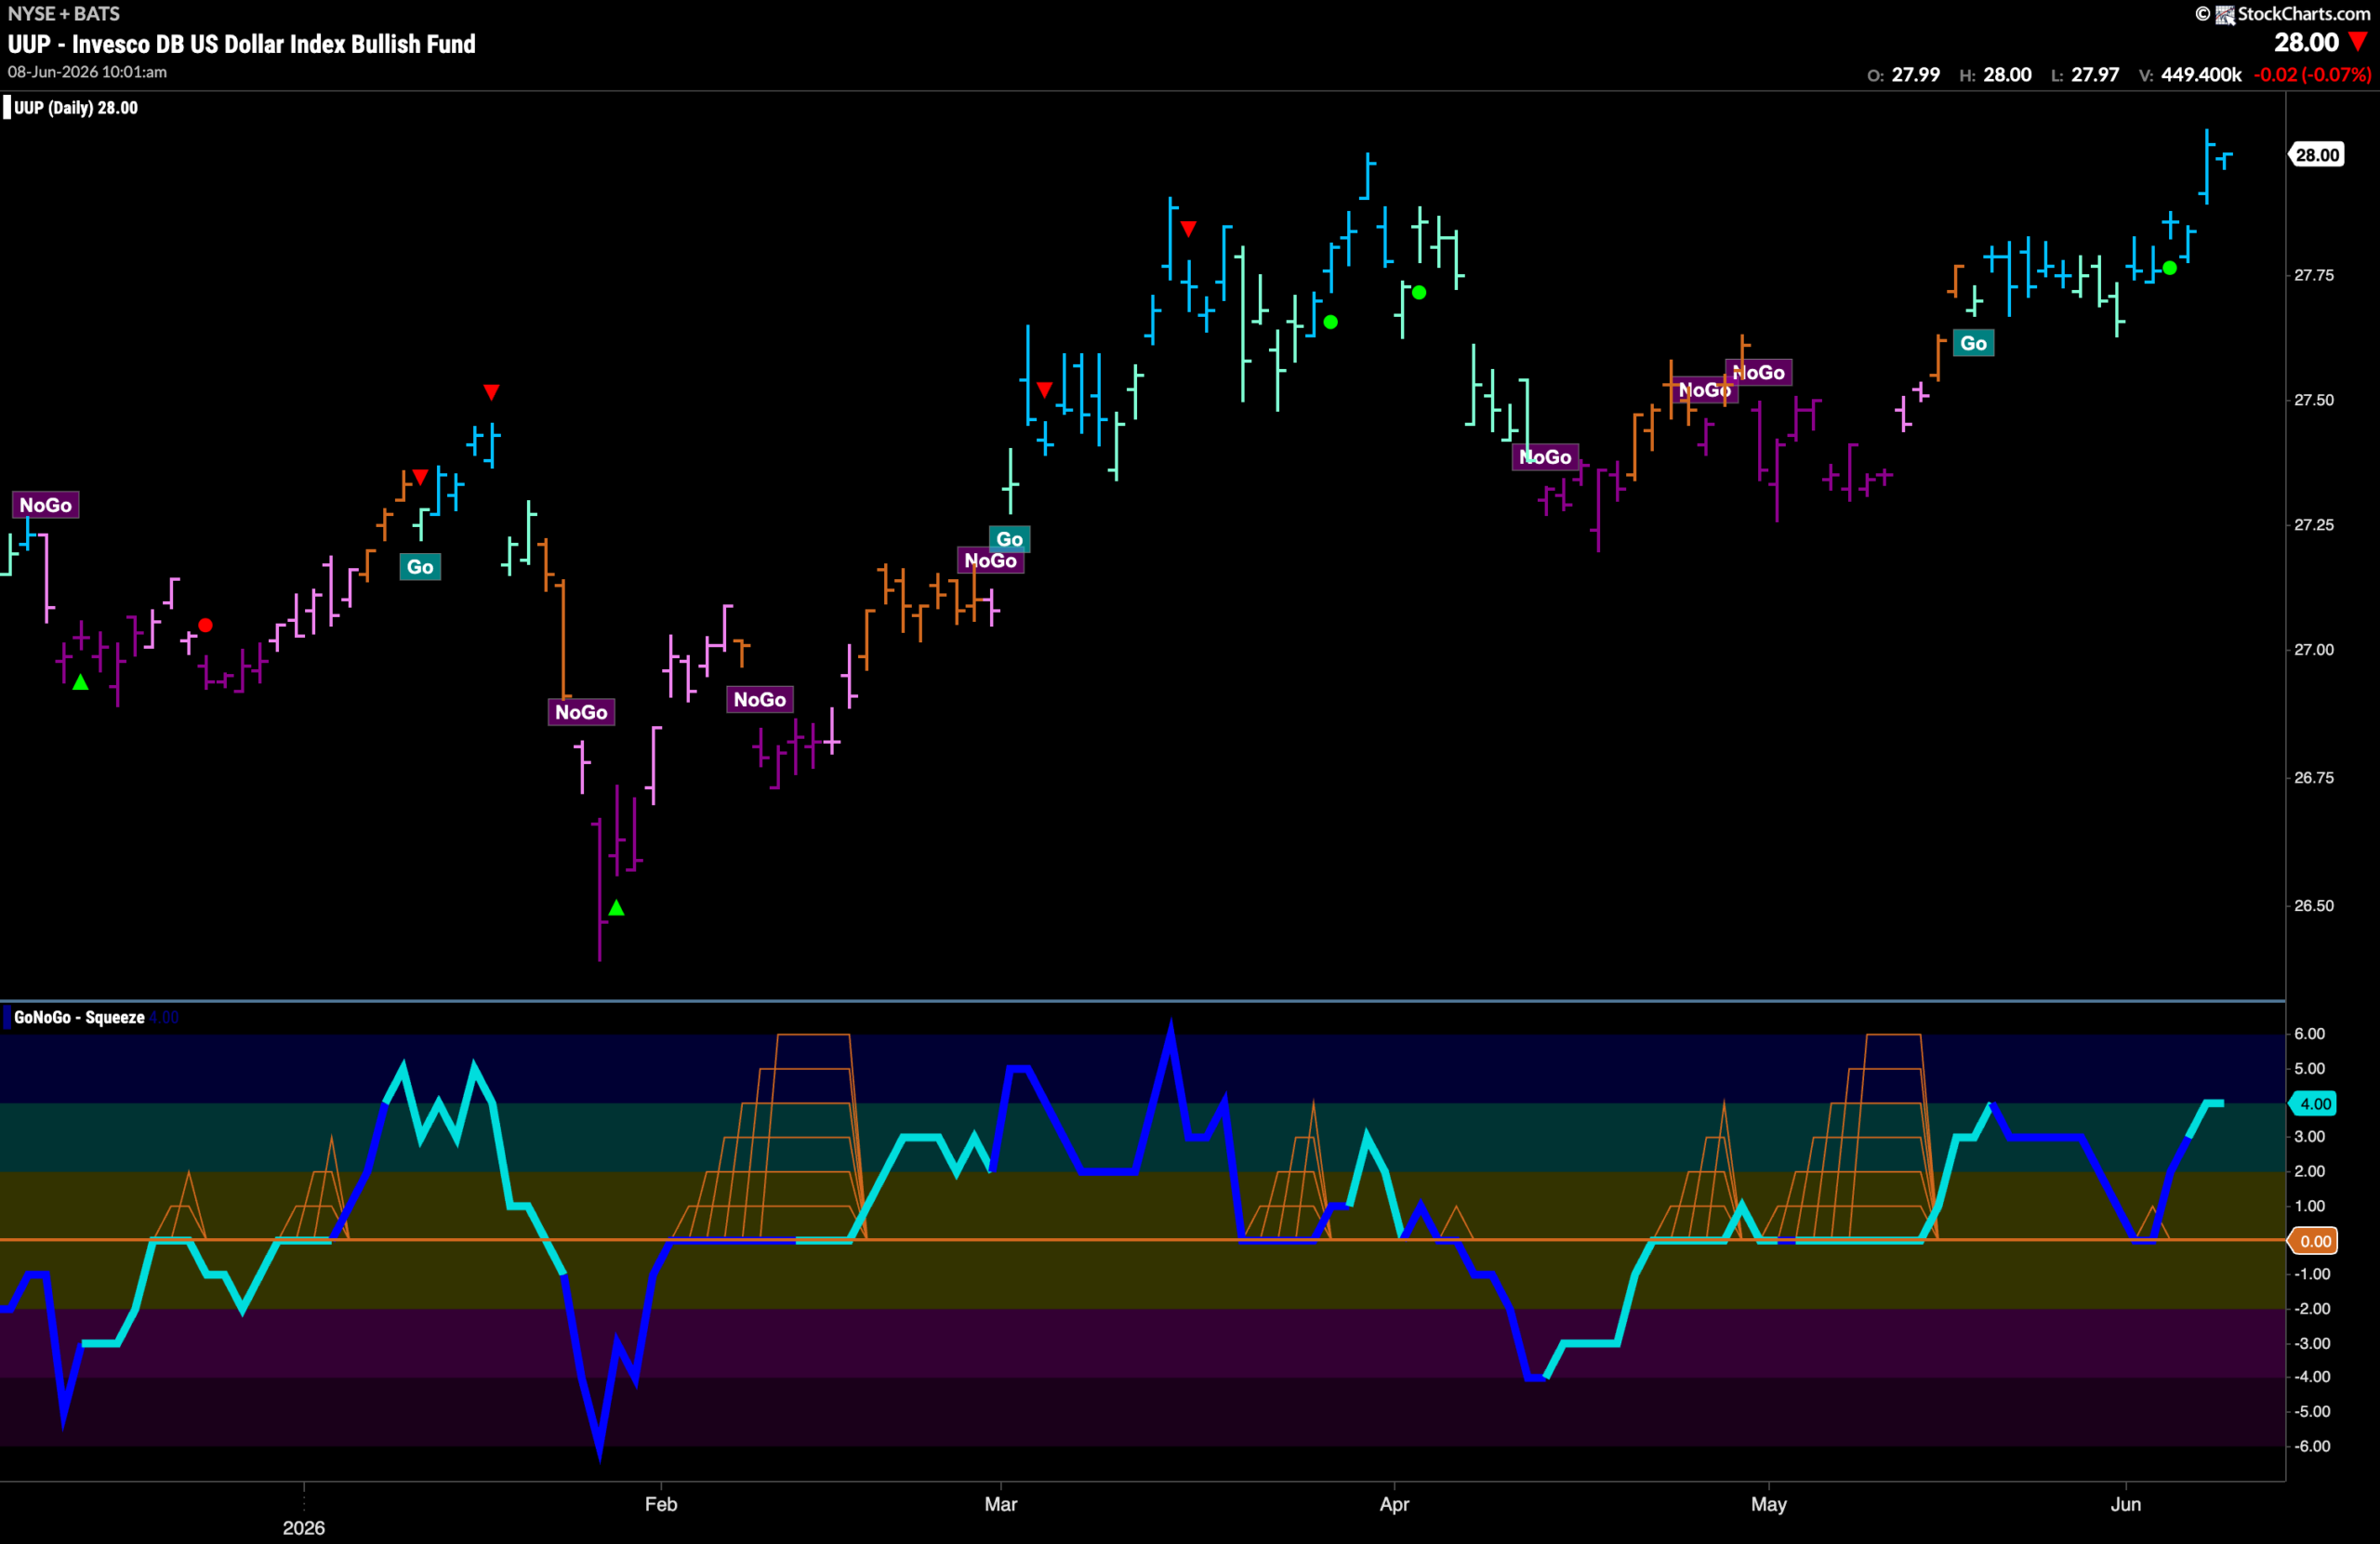
Dollar ($UUP) Makes New High On Strong “Go” Bars
The chart below shows that the “Go” trend has strengthened this past week as we see price rise to set a new higher high above those from late May. This came after GoNoGo Oscillator found support at the zero line. We saw a Go Trend Continuation Icon (green circle) telling us that momentum was resurgent in the direction of the underlying “Go” trend. This momentum push gave price the boost it needed to climb higher.
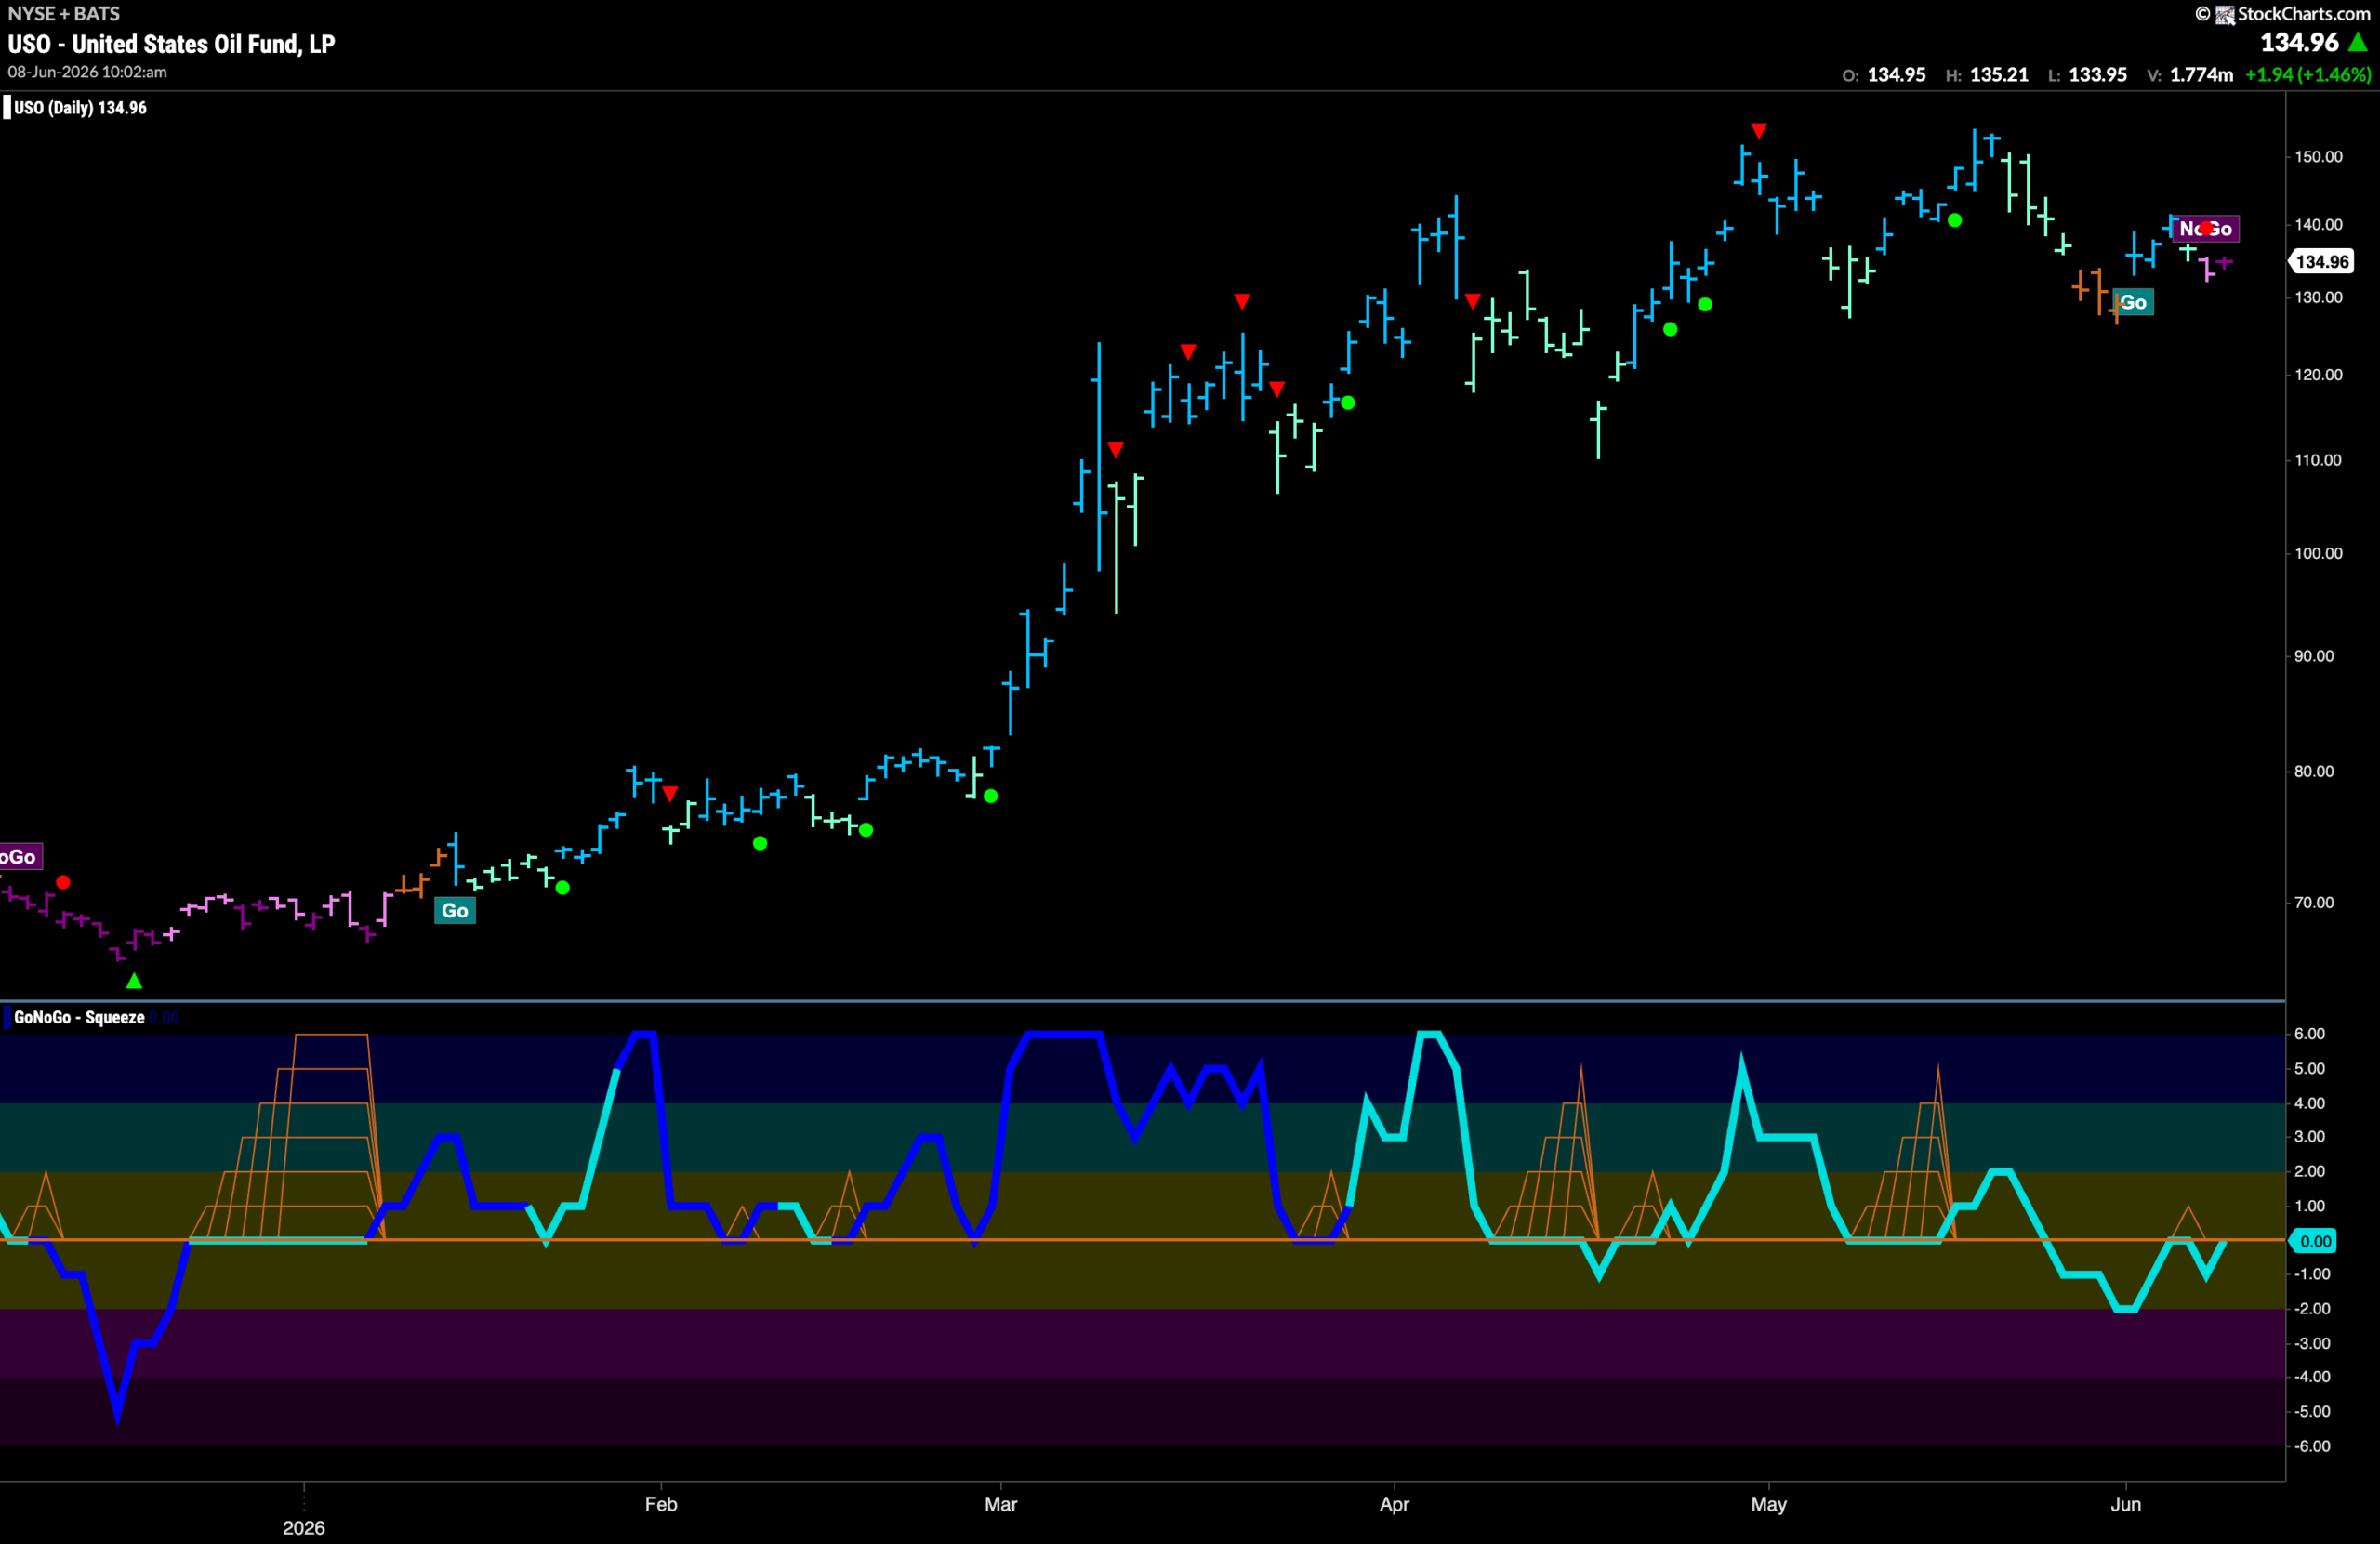
Oil ($USO) Falls into a “NoGo” Trend
GoNoGo Trend shows that there is a new trend for oil as the “Go” trend has given way to “NoGo” bars. First we saw a weaker pink bar and it was followed by a stronger purple bar. GoNoGo Oscillator is testing the zero line from below and we will watch to see if it gets rejected here. If it does, then we would expect further downward pressure and look for $USO to set a new lower low in the coming days and weeks.
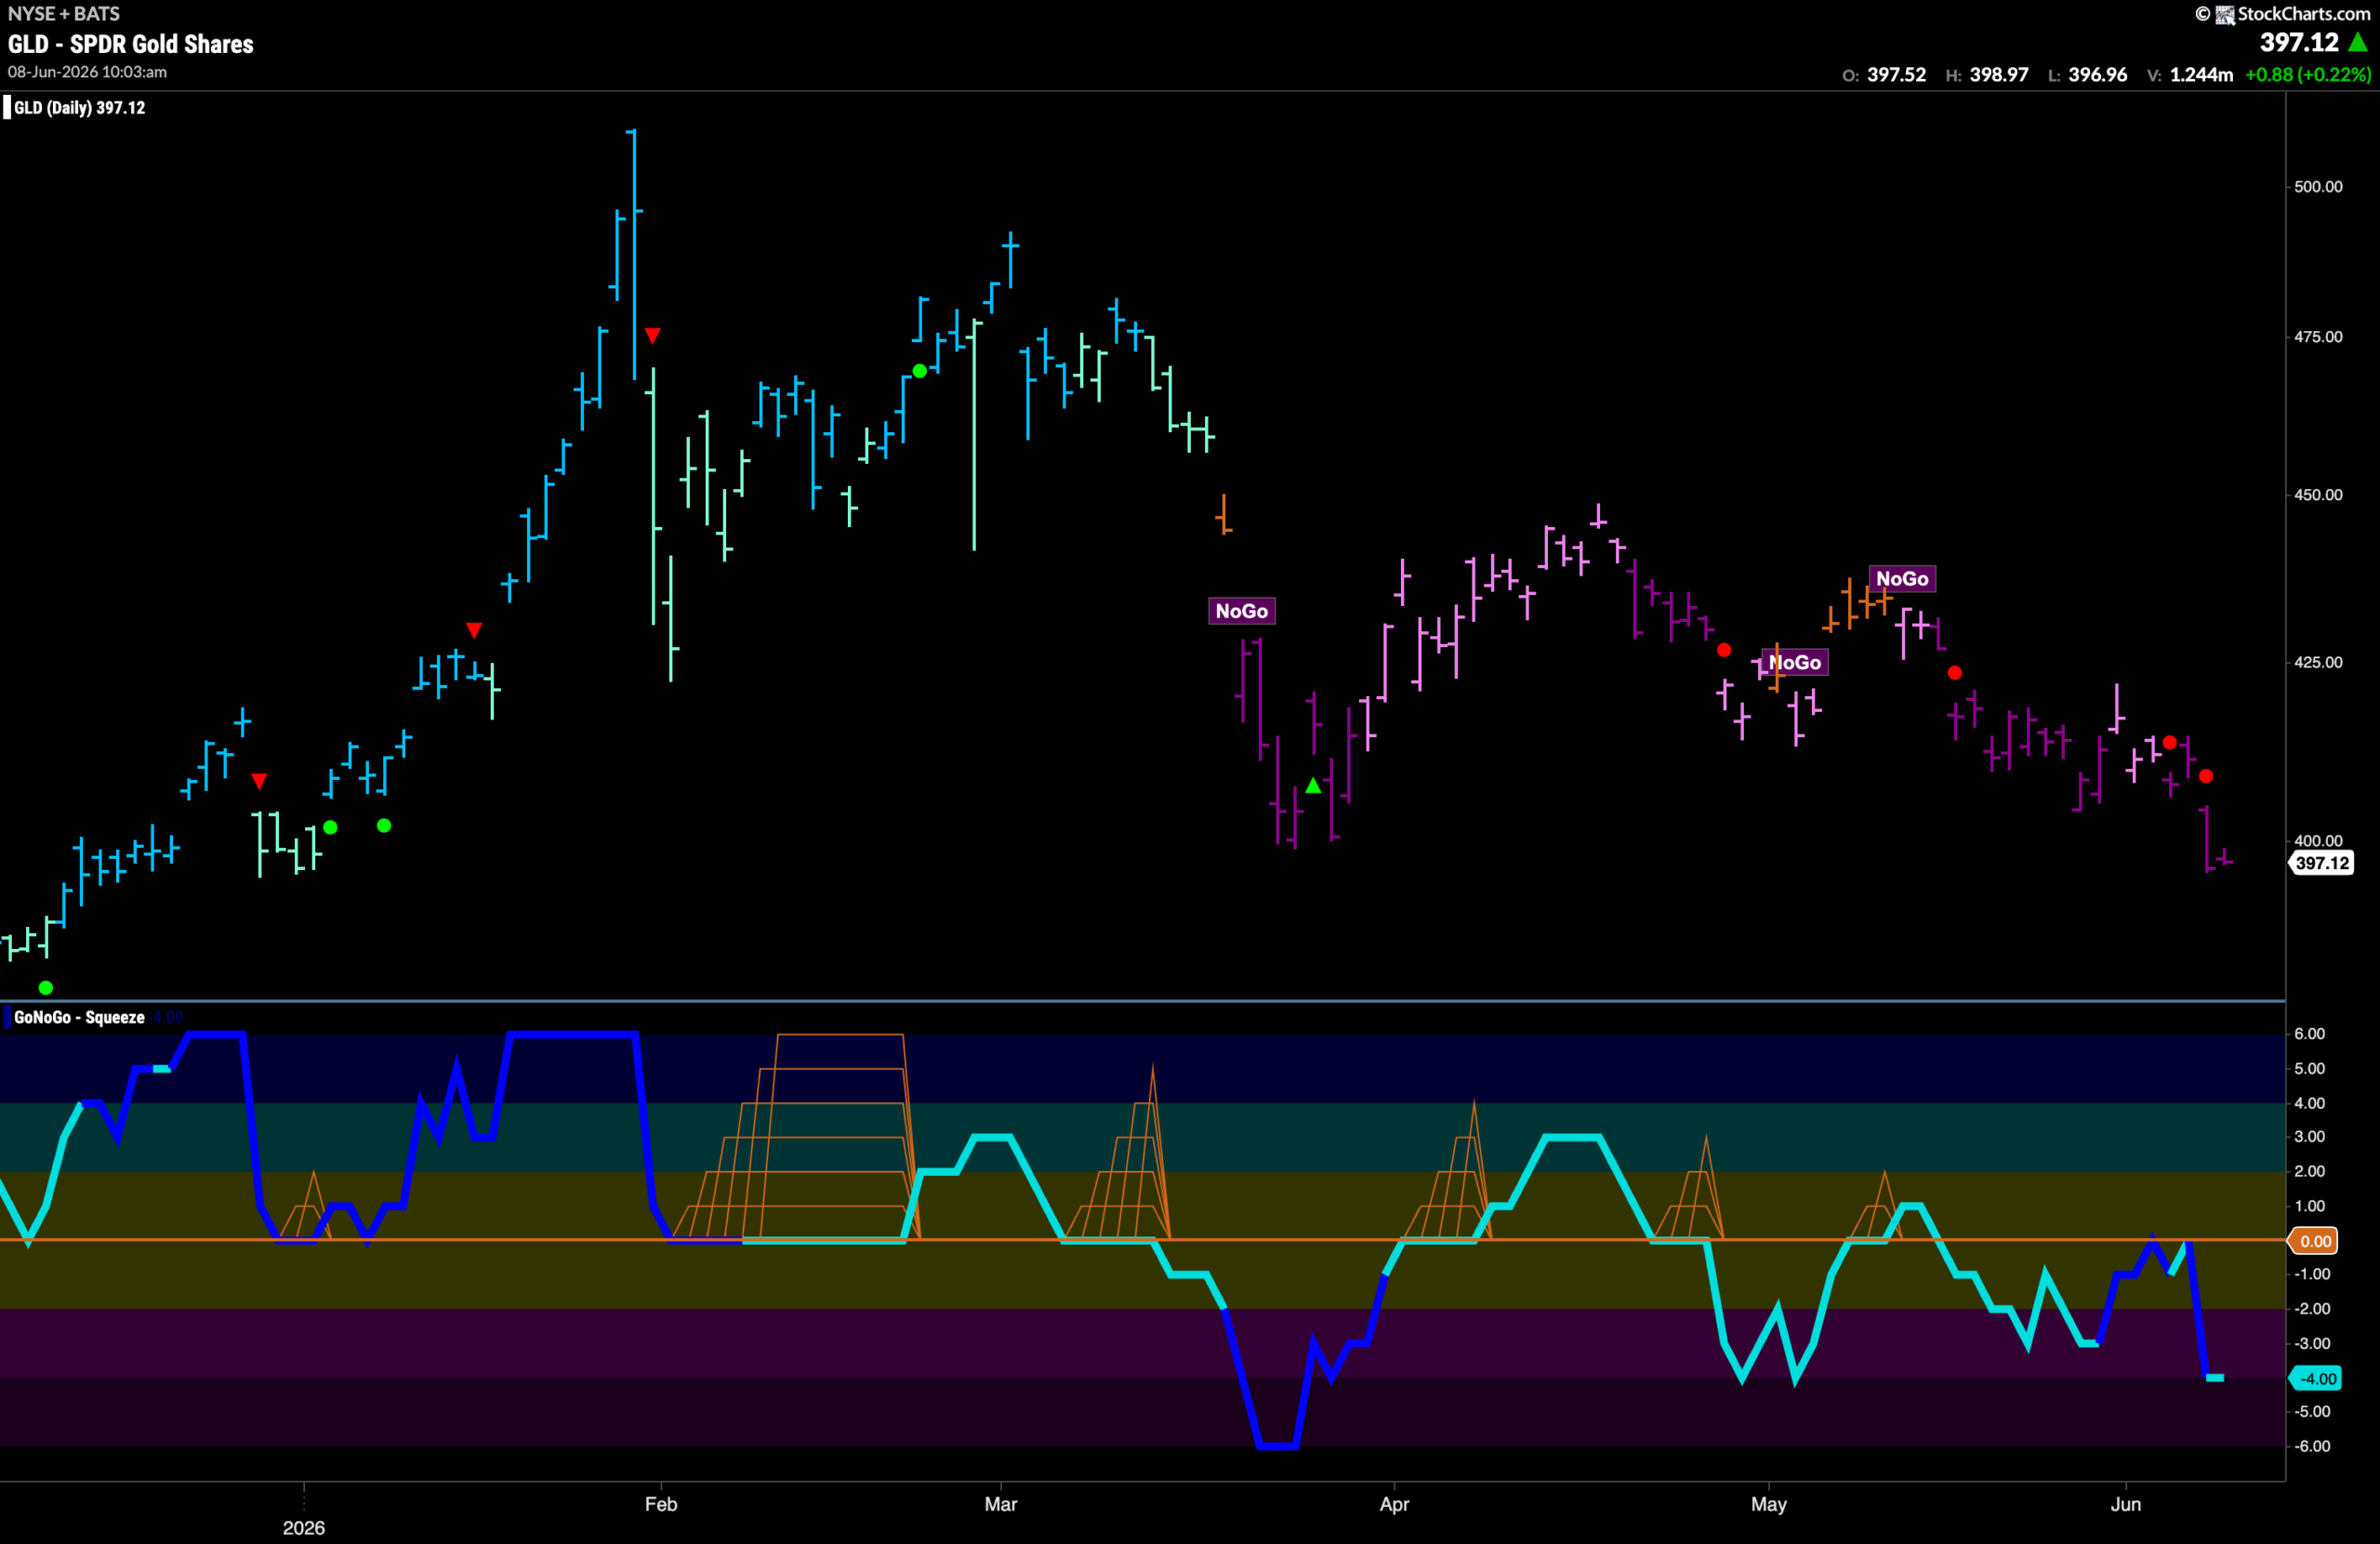
Gold ($GLD) “NoGo” Continues With Strong Purple Bars
The “NoGo” trend continues for gold this week as price sinks to test lows from late May. This comes after we saw a repeated test of the zero line and GoNoGo Oscillator was turned away from that level twice. This triggered NoGo Trend Continuation Icons (red circles) above price and told us that momentum was resurgent in the direction of the “NoGo” trend. With the oscillator at a value of -4 and not yet oversold, we will watch to see if this gives price a push in its challenge for new lower lows.
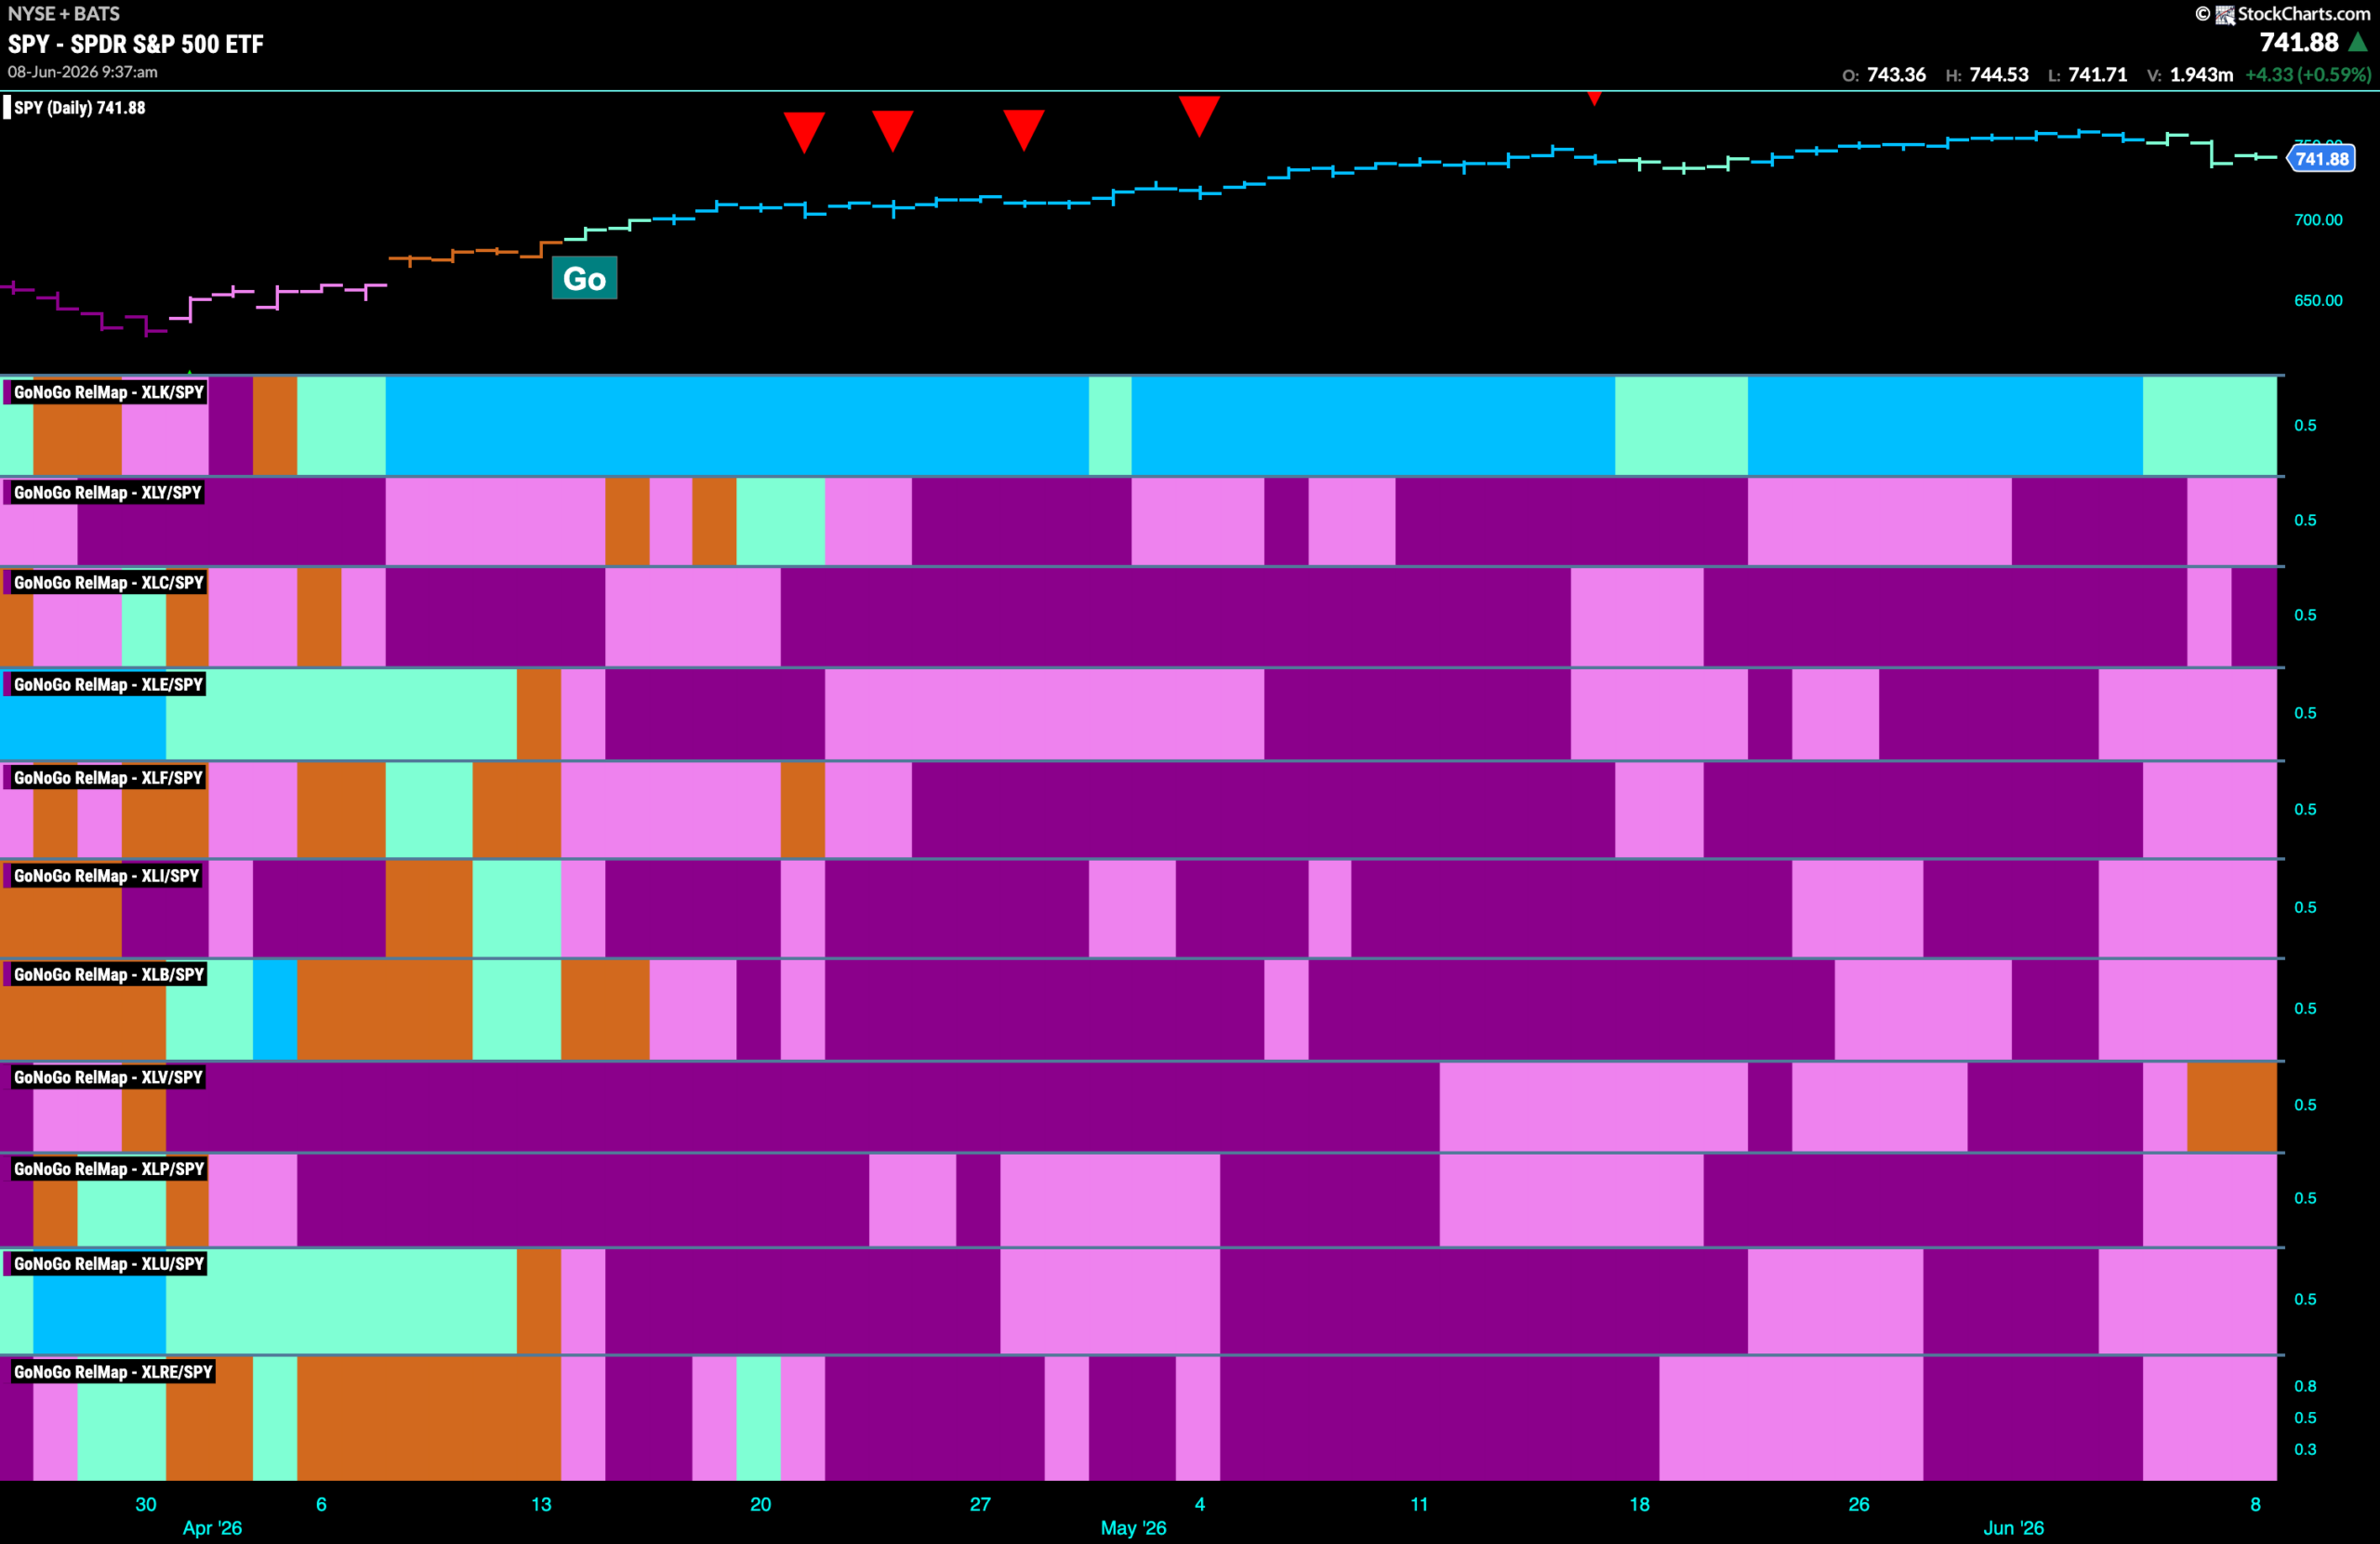
Sector RelMap
Below is the GoNoGo Sector RelMap. This GoNoGo RelMap applies the GoNoGo Trend to the relative strength ratios of the sectors to the base index. With this view we can get a sense of the relative out performance and relative underperformance of the sectors. 1 sector is in a relative “Go” trend. $XLK, is painting relative “Go” bars. $XLV is the only sector painting amber “Go Fish” bars of uncertainty.
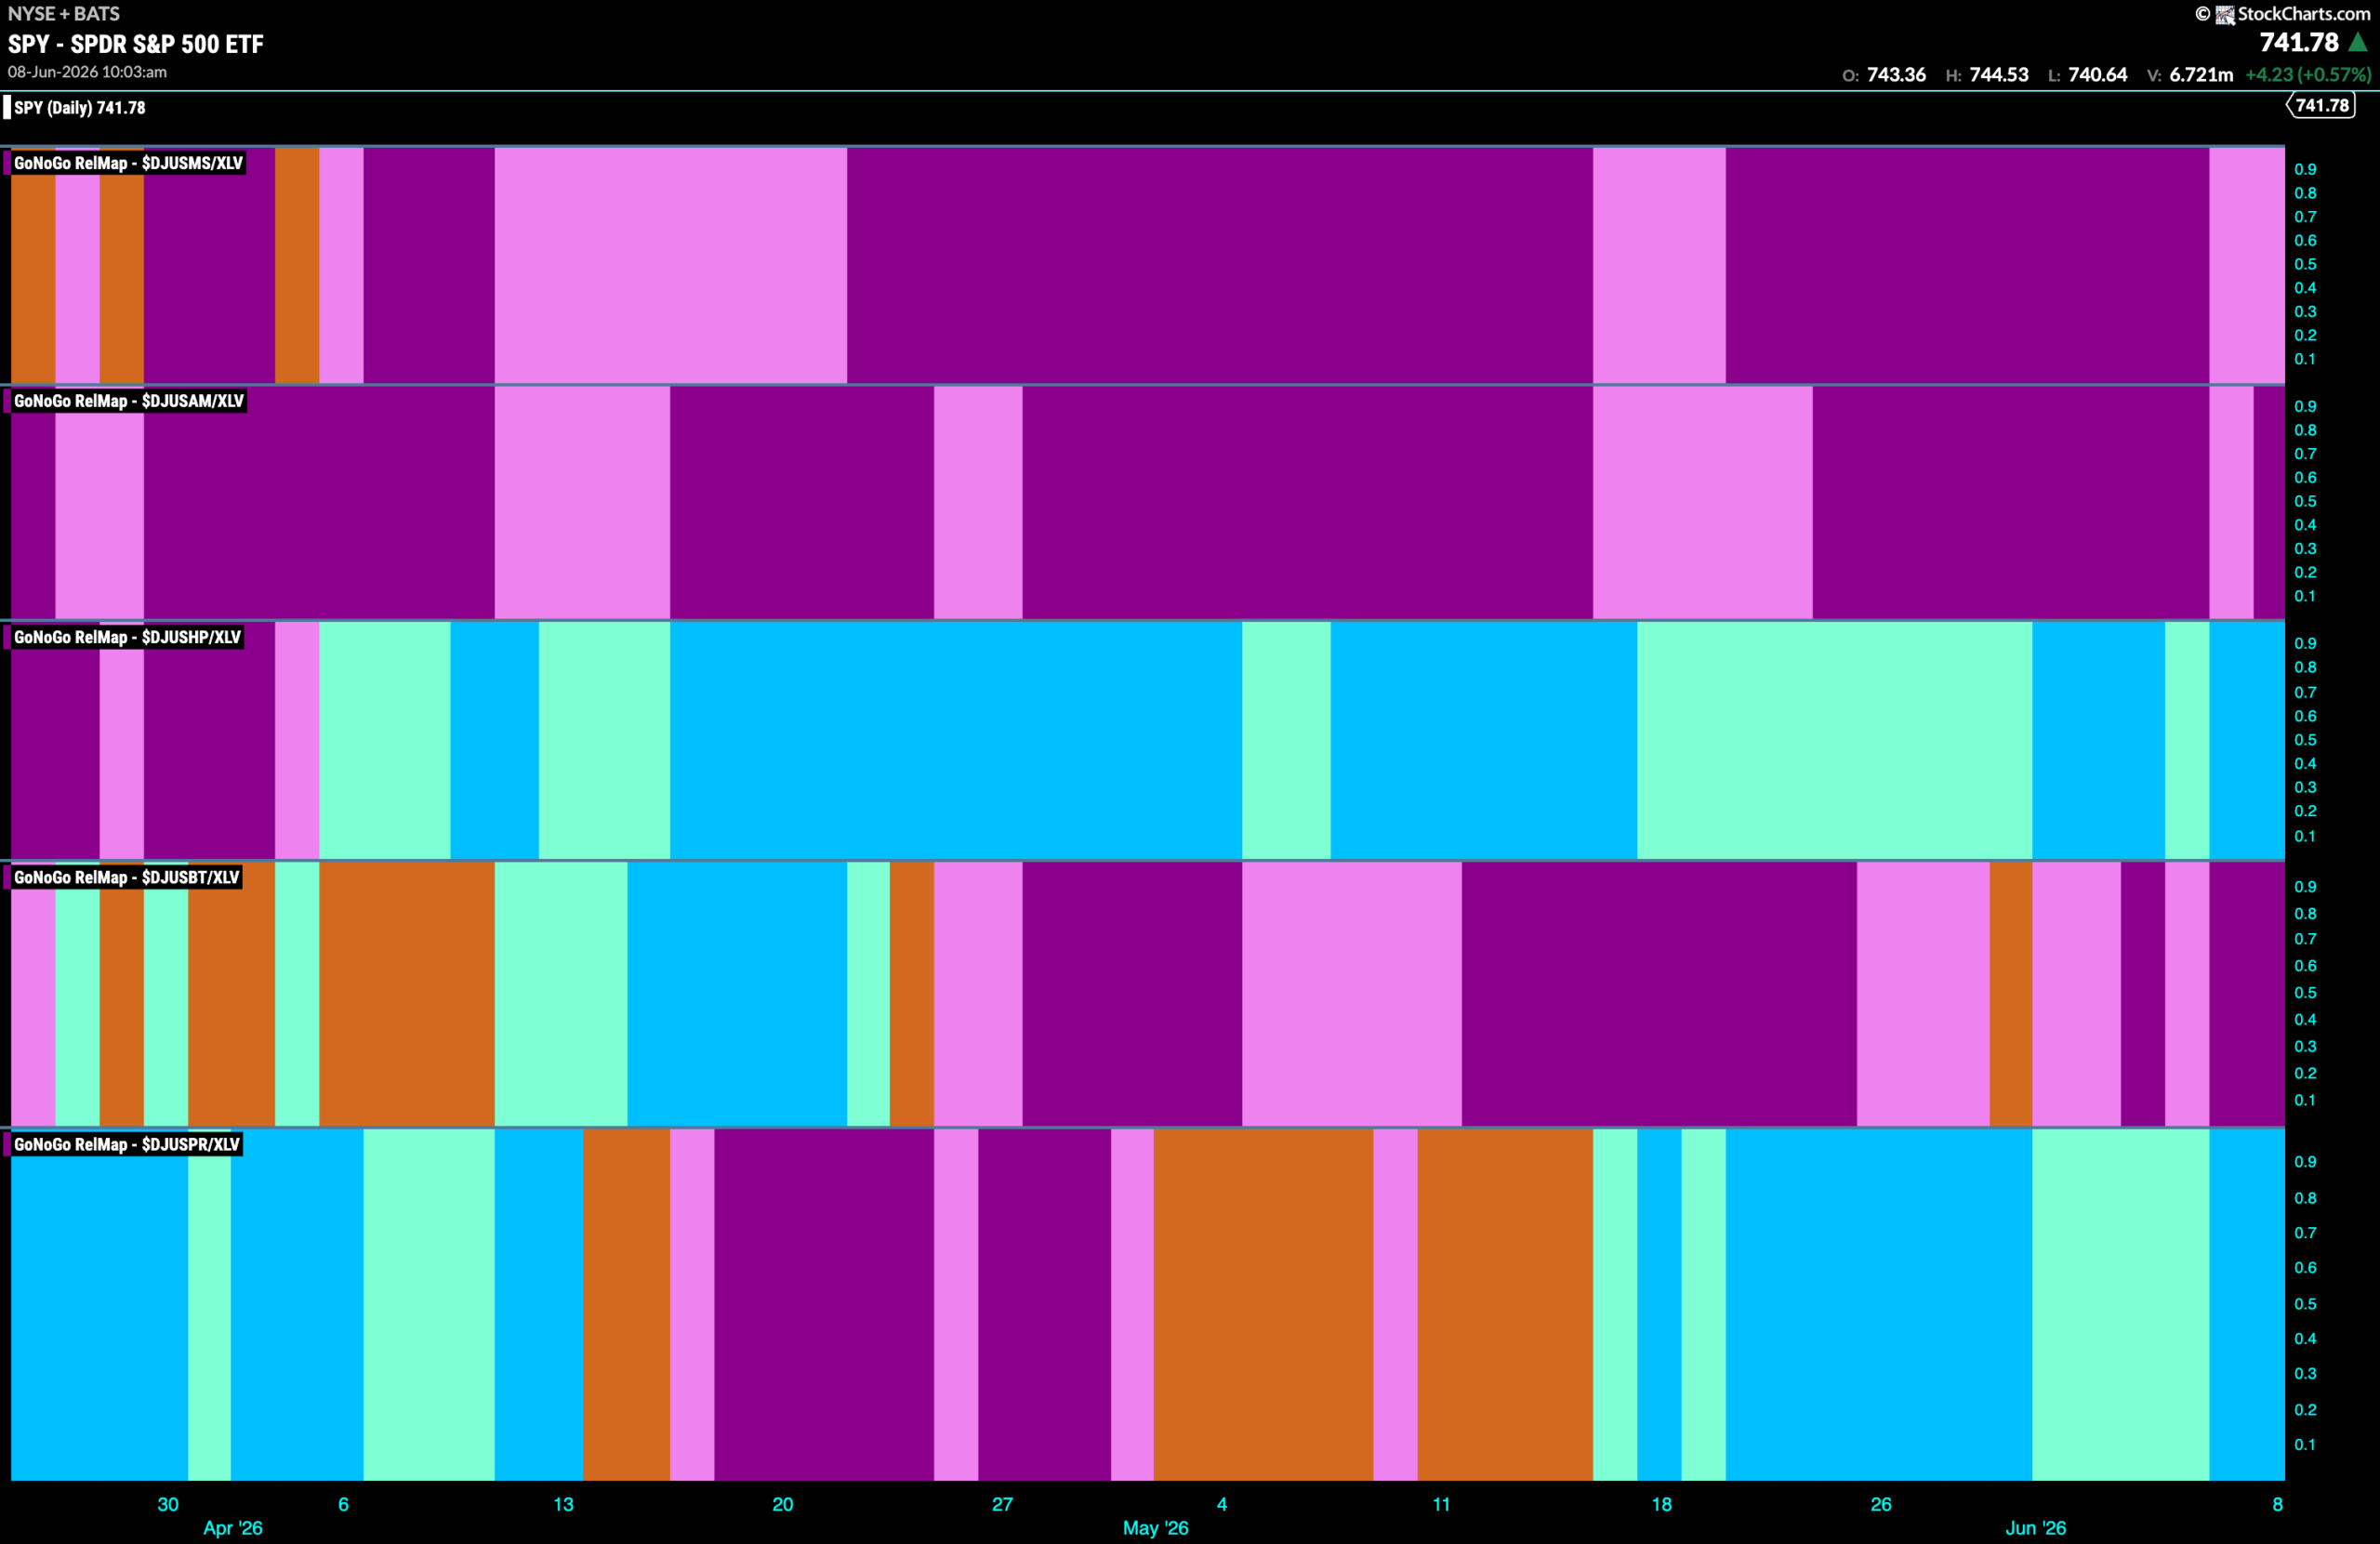
Healthcare Sub-Group RelMap
The chart below shows a relative trend breakdown of the sub groups within the healthcare sector this week. The Sub-Group RelMap plots the GoNoGo Trend of each sub index to the $XLV. We saw in the above GoNoGo Sector HeatMap that $XLV is painting consecutive amber “Go Fish” bars representing market uncertainty. When we look at the below RelMap we can see that the healthcare providers index in the 3rd panel is painting strong blue “Go” bars on a relative basis.
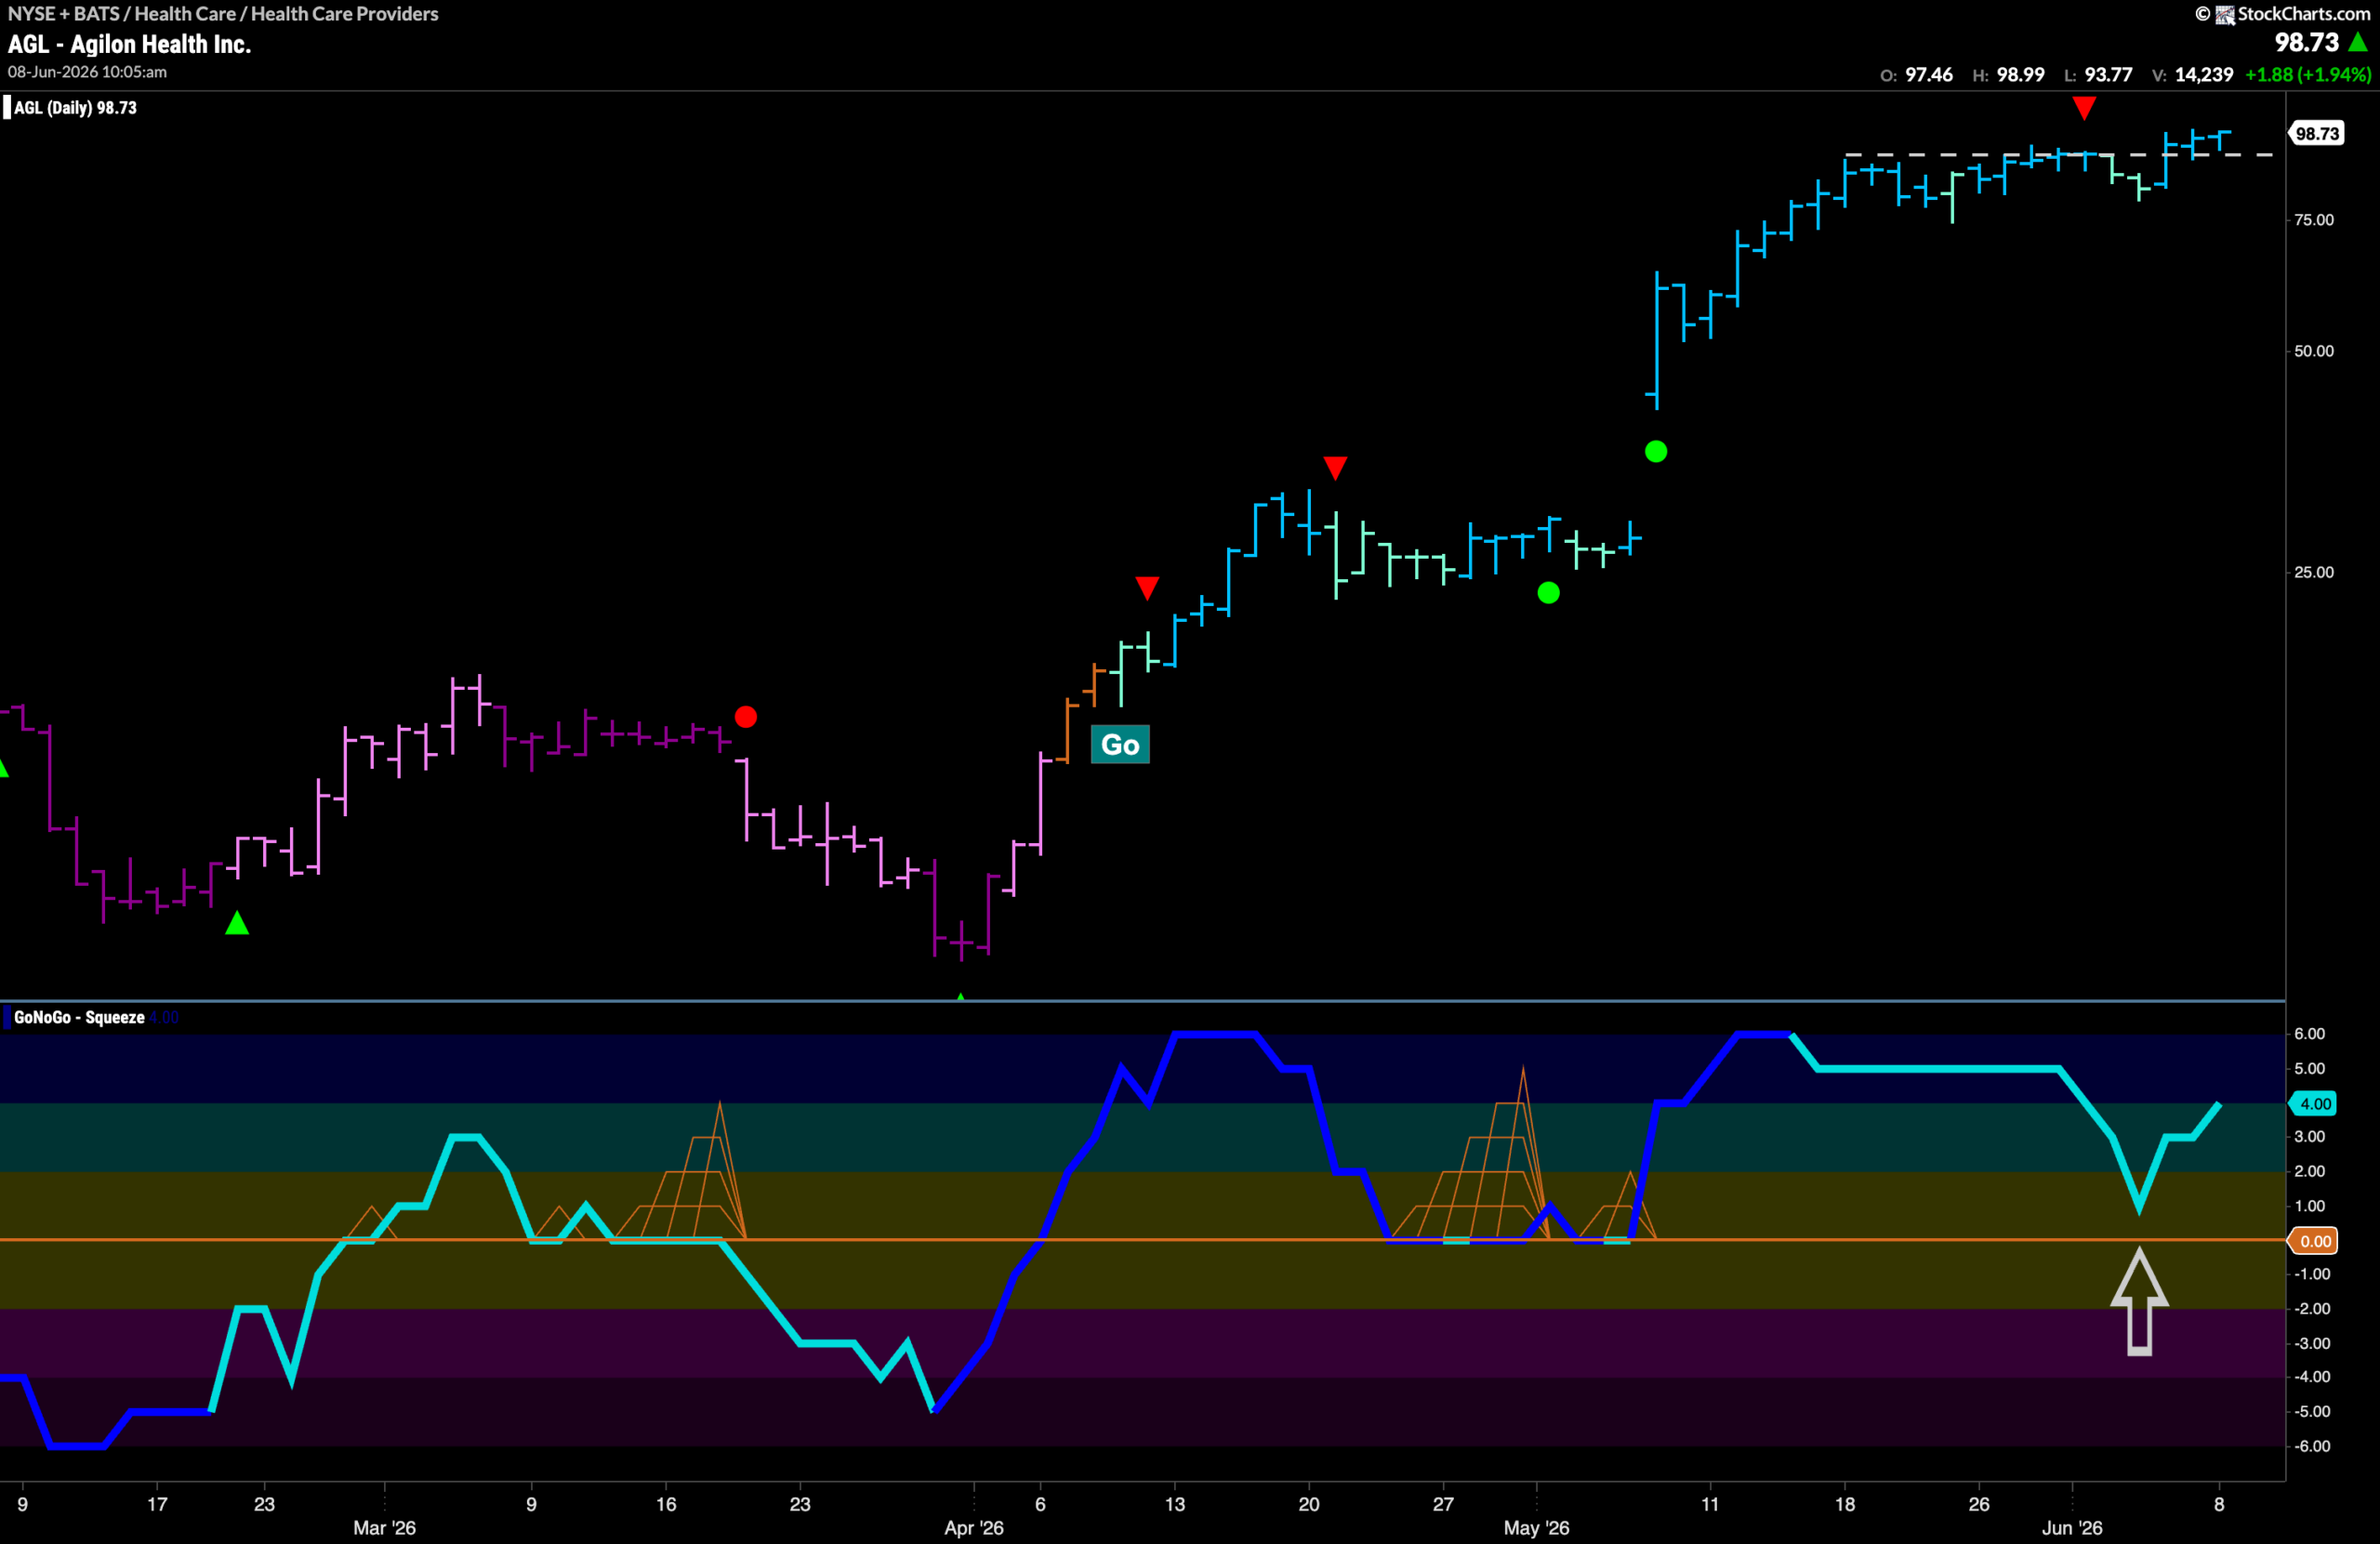
$AGL Creeps Above Resistance
The GoNoGo Chart below shows that price has edged its way above resistance as the “Go” trend continues. GoNoGo Trend paints strong blue bars having seen price knock out the resistance and also the Go Countertrend Correction Icon (red arrow). We can see that momentum is clearly on side with the GoNoGo Oscillator reversing course before even reaching zero. Now, with momentum rising and at a value of 4 we know that there is market enthusiasm behind this current move.
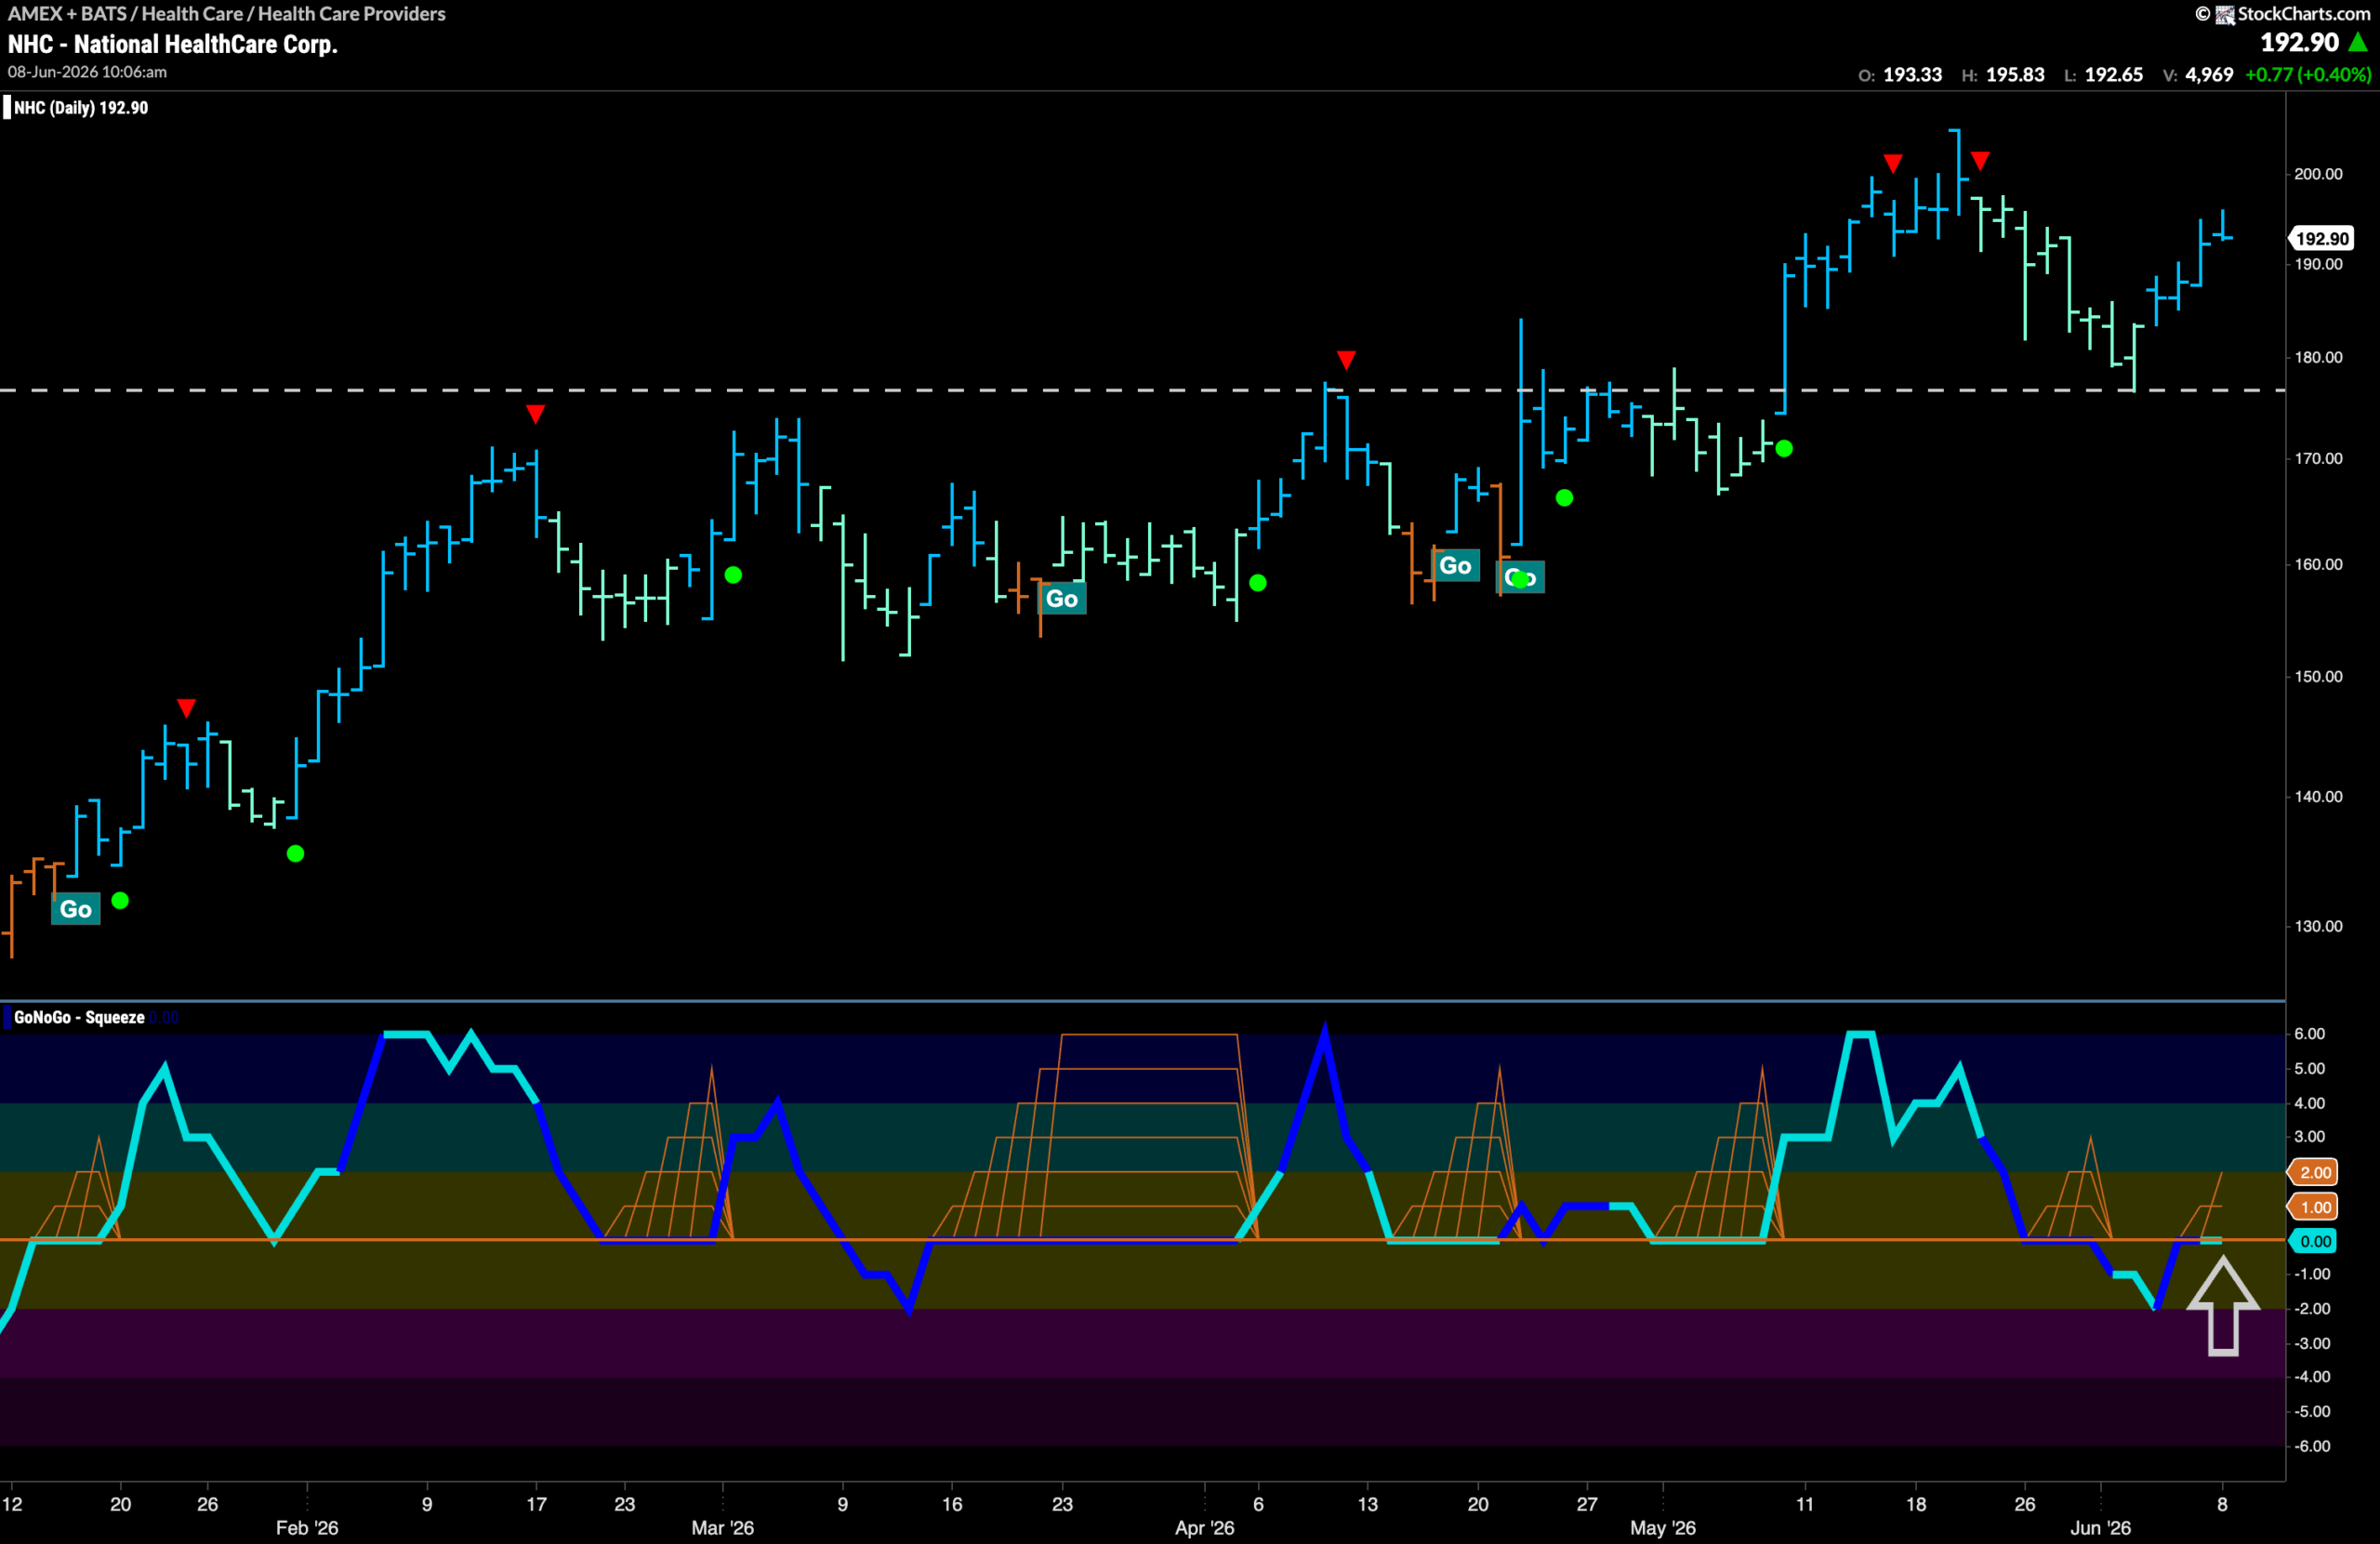
$NHC Bounces off Long Term Support
The “Go” trend continues for NHC. We noted a long run of weaker aqua bars that saw price fall significantly from the recent high and multiple Go Countertrend Correction Icons (red arrows). This weakness caused price to fall to a level that provided support. This horizontal level was once resistance and represents the concept of polarity with that resistance now becoming support. During the extended weakness, GoNoGo Oscillator fell briefly into negative territory. Now, it has quickly rallied back to test the zero line from below. We will watch to see if it can regain positive territory. If it does, then we will expect price to mount a serious challenge to surpass those prior highs.