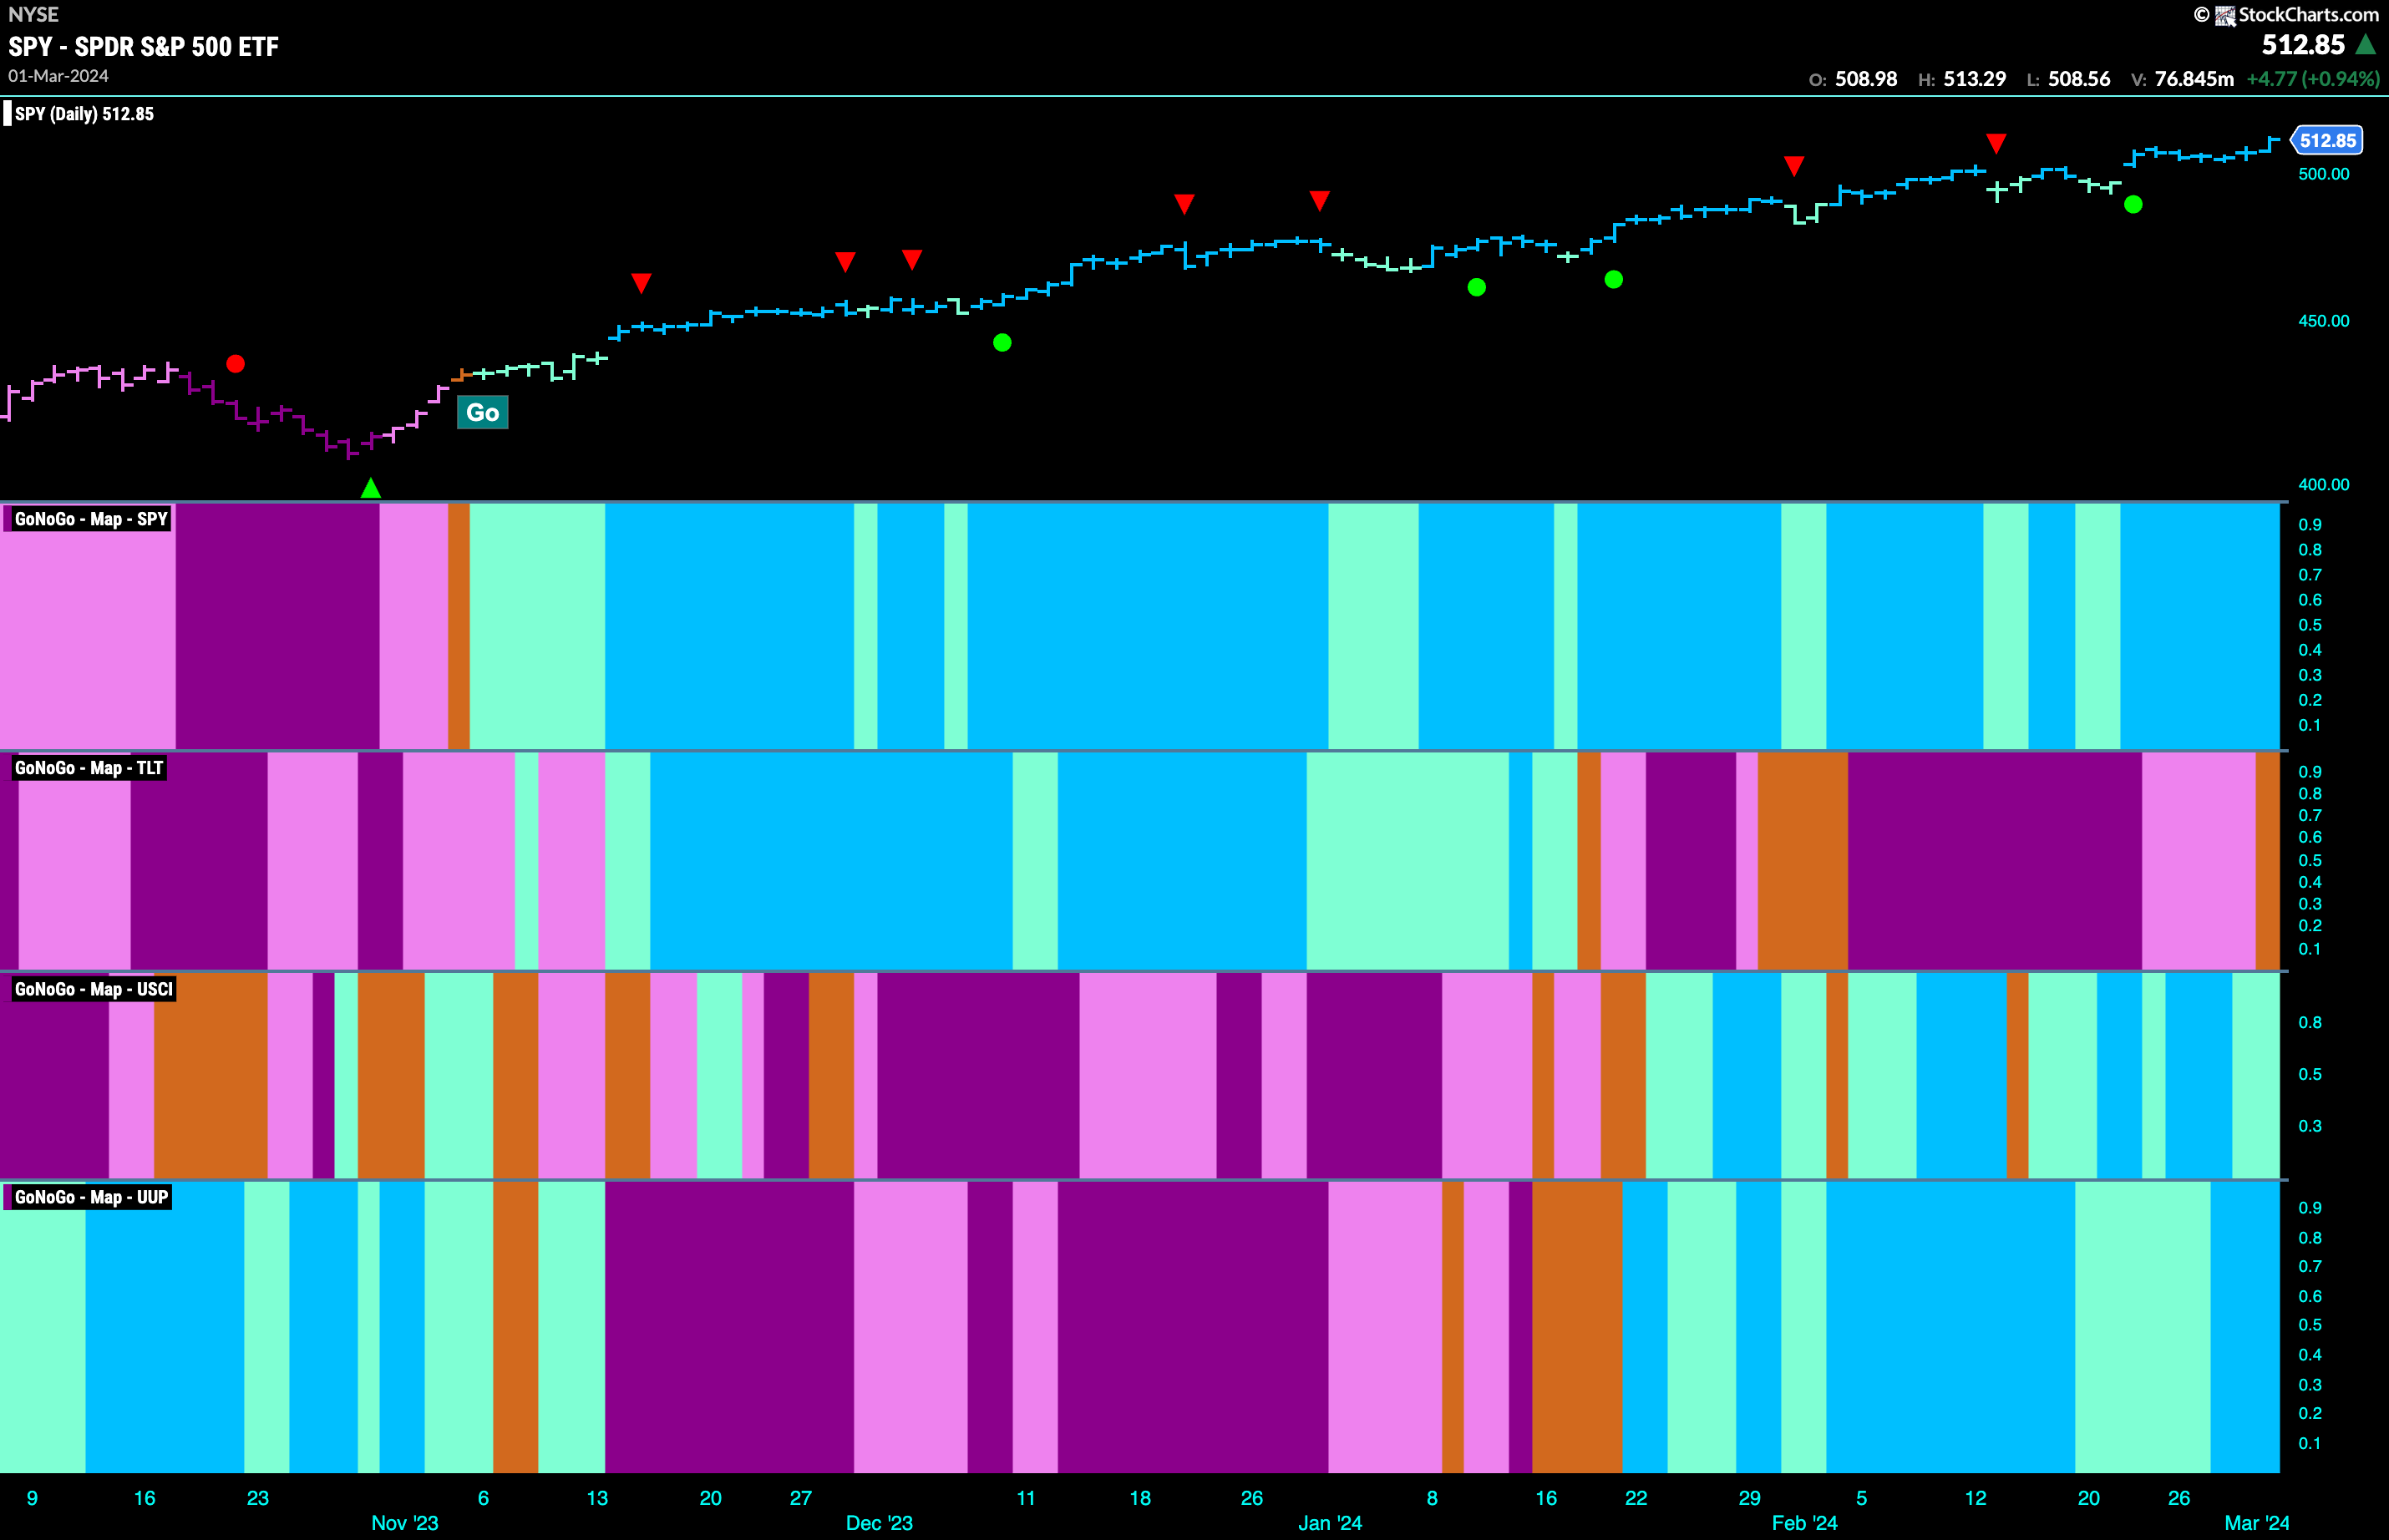
Good morning and welcome to this week’s Flight Path. Equities exhibited continued strength this week as we saw a string of uninterrupted strong blue “Go” bars and price at new highs. Treasury bond prices finished the week strongly with an amber bar as the “NoGo” looks to be in trouble. We will see what this means for rates a little later. Commodity index was able to hold on to “Go” bars albeit finishing the week with weaker aqua bars. The dollar, having shown some weakness of late finished the week with strong blue “Go” bars.
U.S. Equities How High Can You Go?
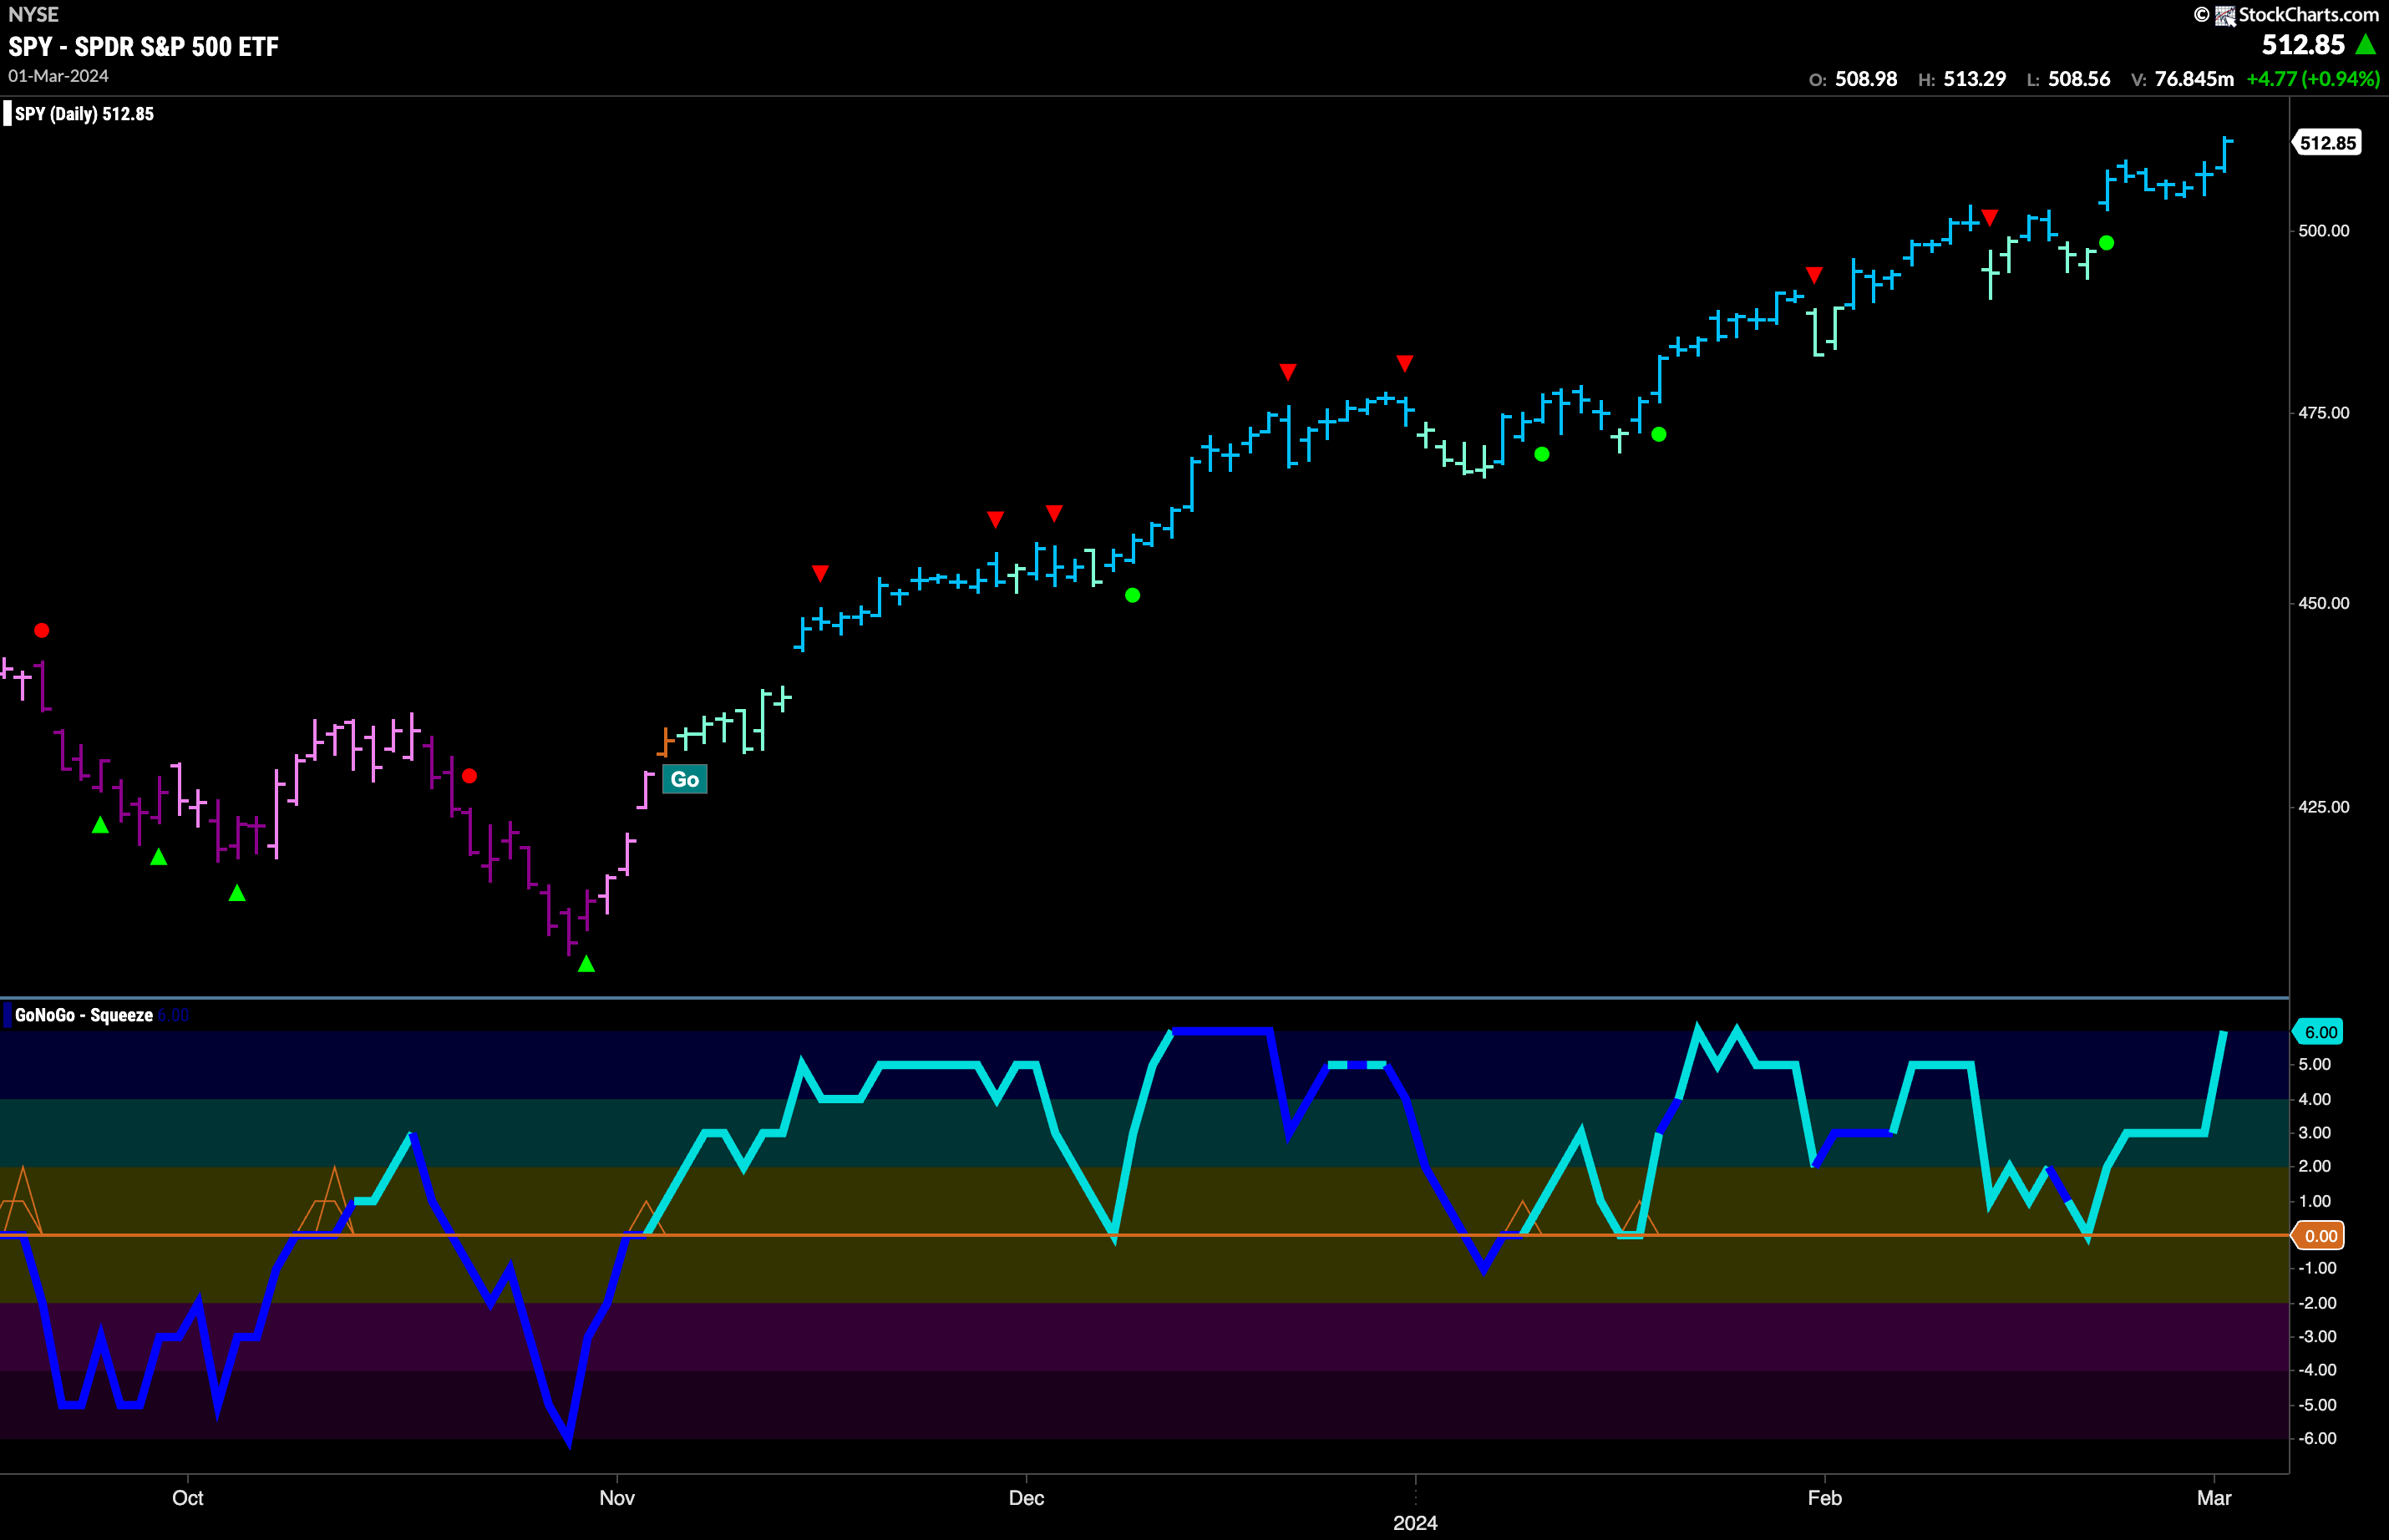
This “Go” trend in equities hit new heights this week as the week closed higher. GoNoGo Trend painted nothing but strong blue bars. GoNoGo Oscillator raced back into overbought territory indicating strong directional momentum to go along with the price movement. We do note light volume on this latest high and so we will watch to see if there is any cooling of momentum as investors digest these highs in the coming days and weeks.
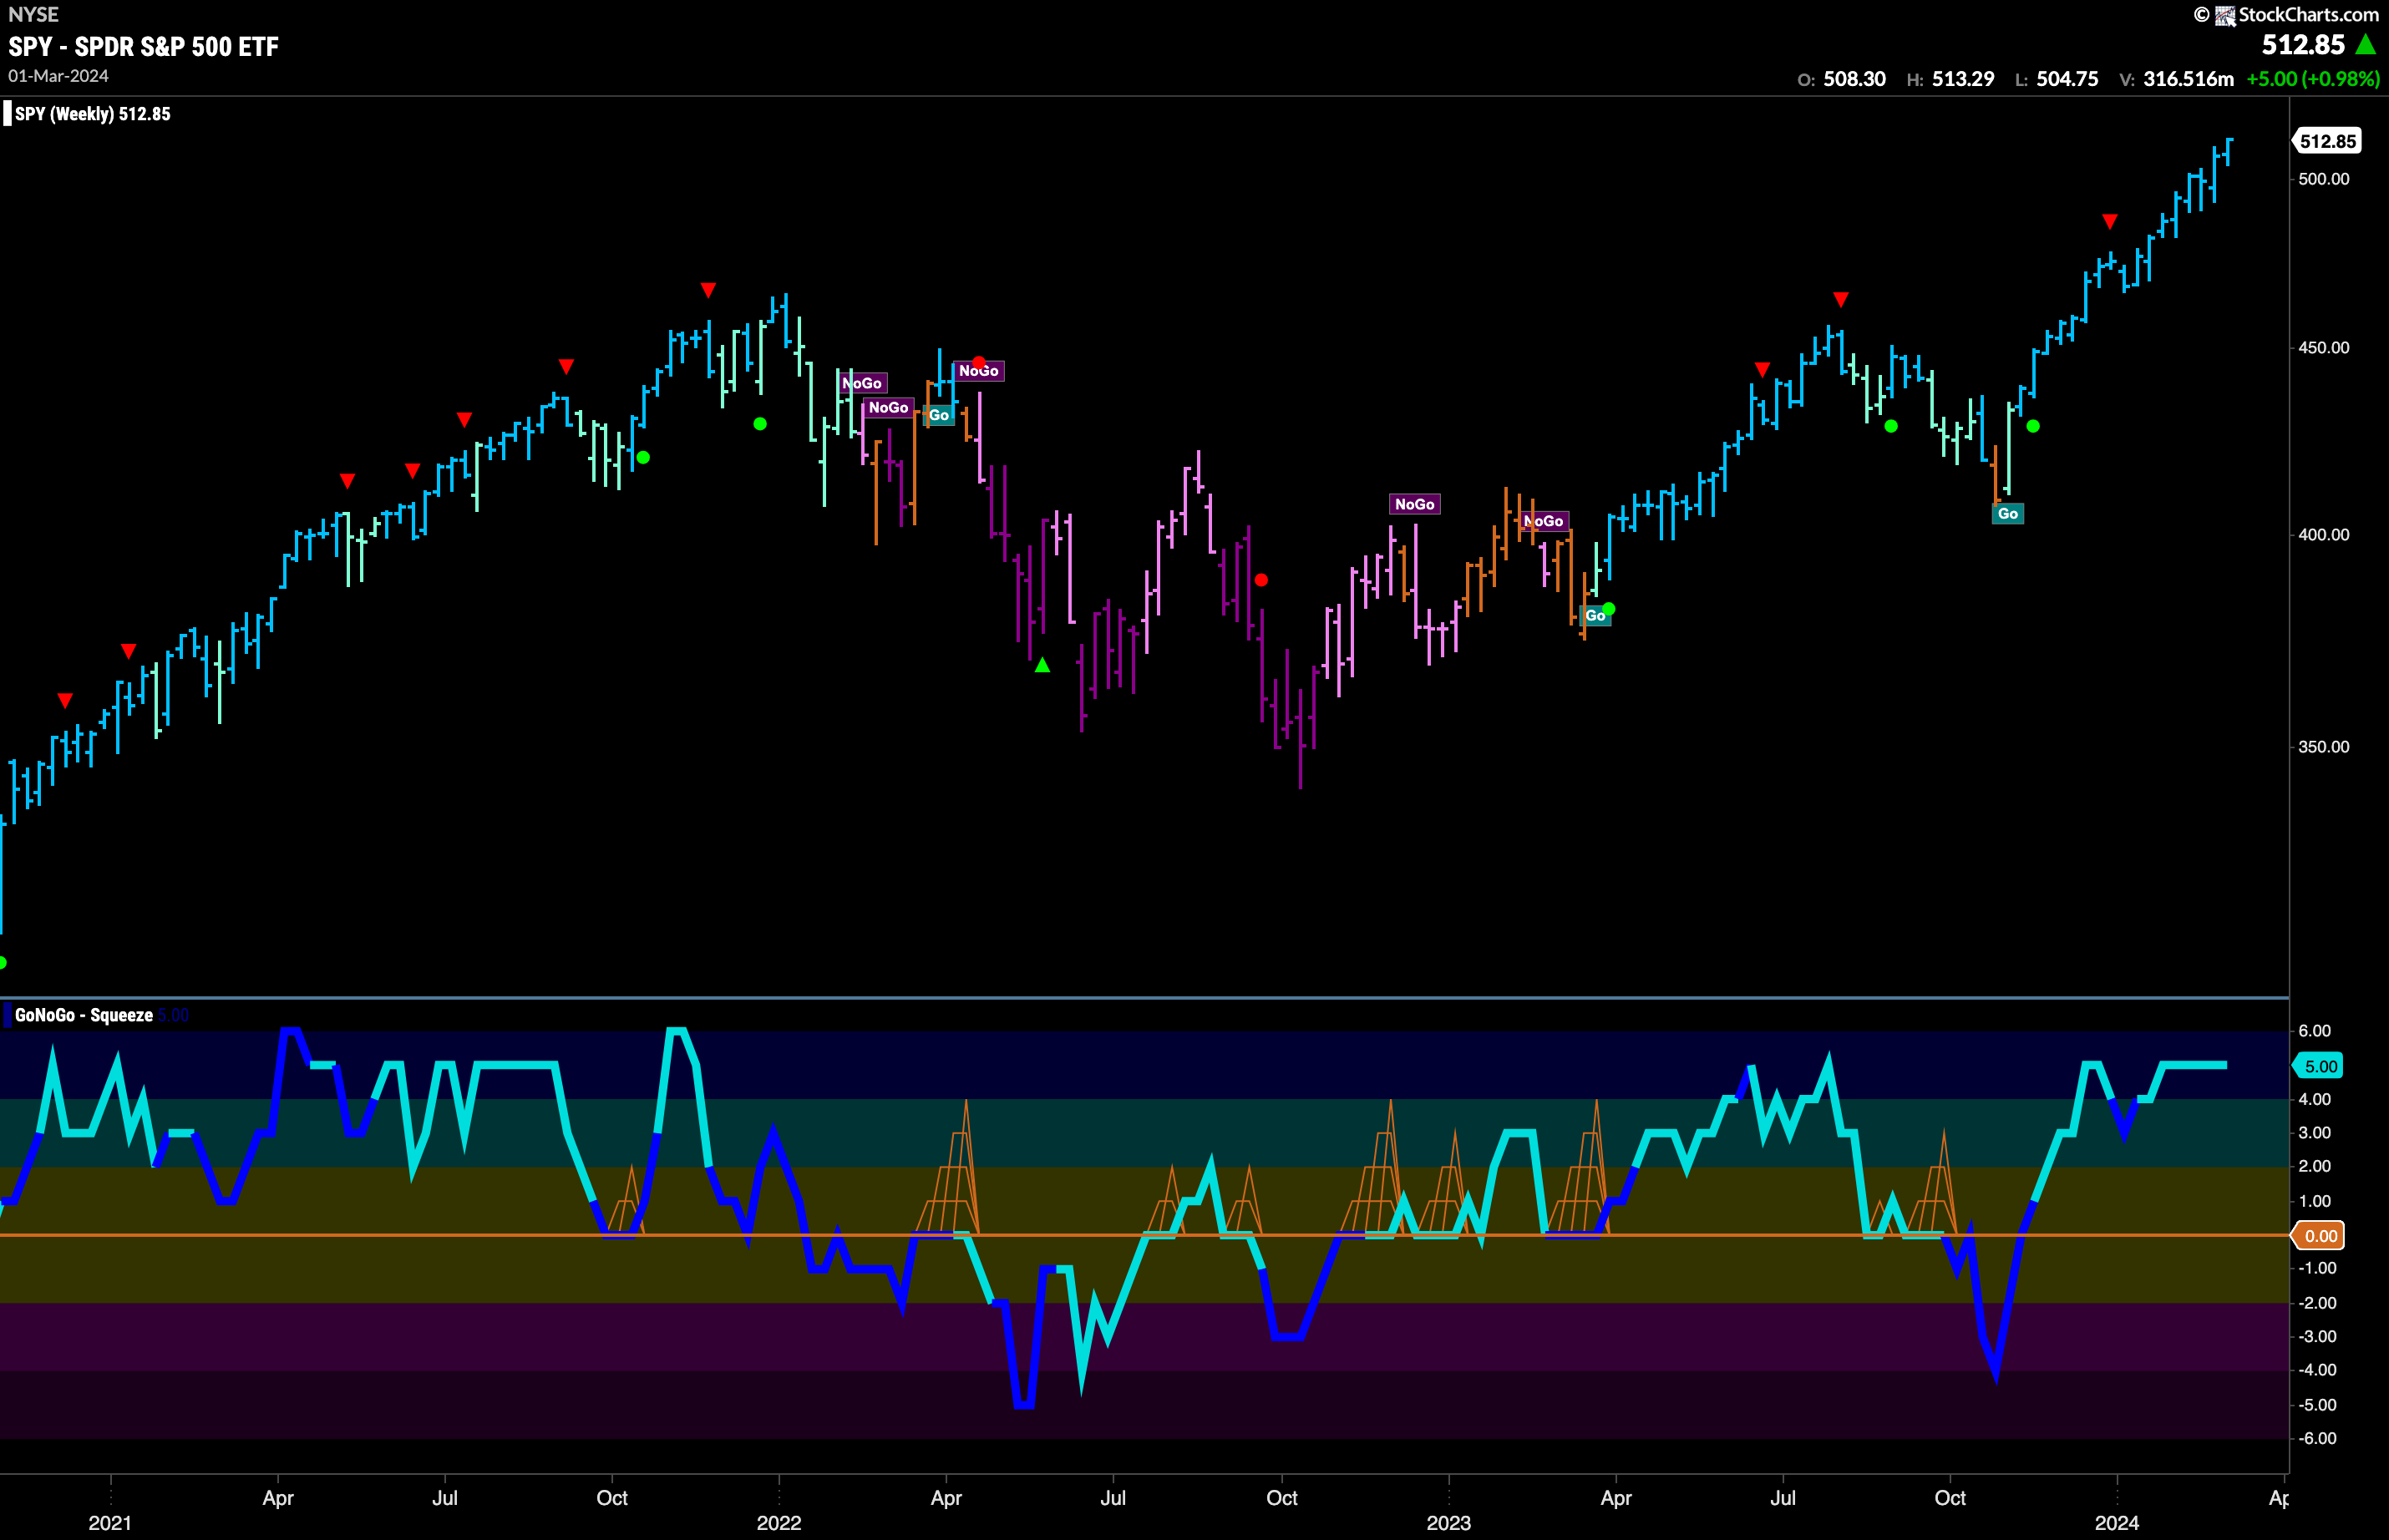
I’m starting to sound like a broken record here; the larger time frame chart shows that this trend is strong. We see another strong blue “Go” bar on another higher weekly close. That is 17 consecutive strong blue bars and 15 out of 17 higher weekly closes. GoNoGo Oscillator remains at a value of 5 (overbought). We will watch to see what happens when the oscillator finally moves back below 5. Volume is light over the last month or so.
Rates at Inflection Point
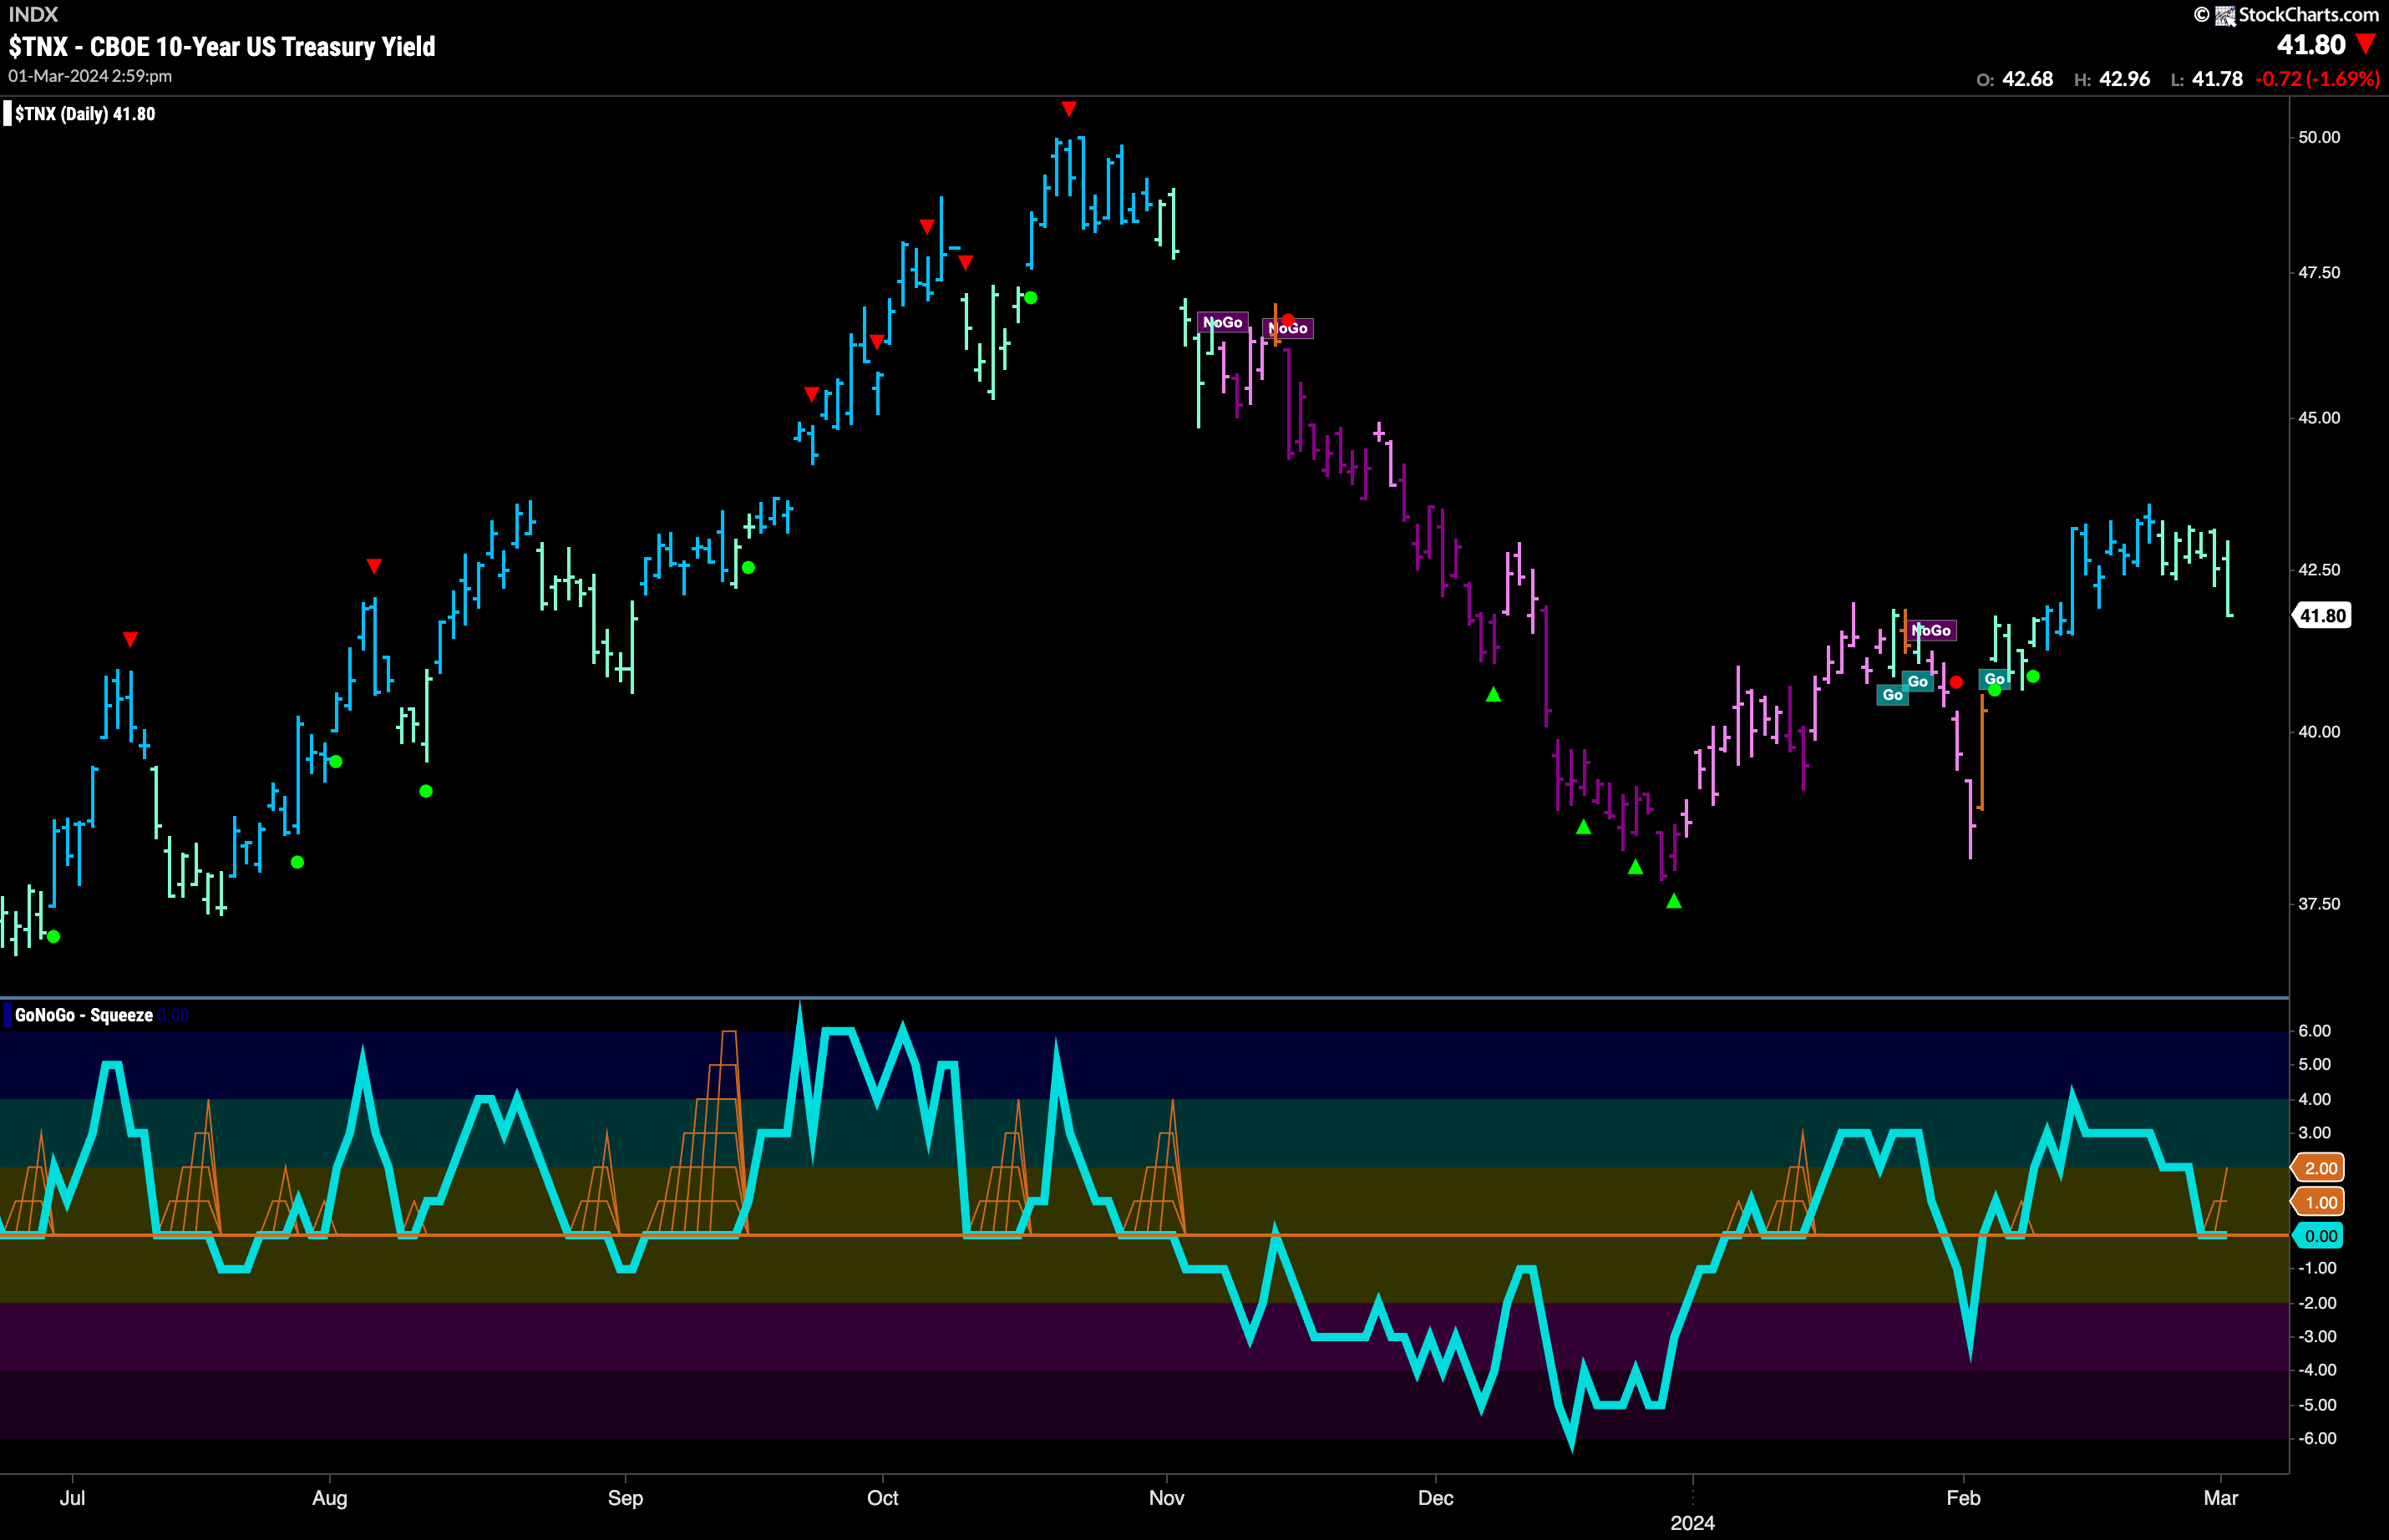
Treasury rates moved mostly sideways or slightly down this week as the strong blue “Go” bars gave way to a weaker aqua color. Having set a higher high in this relatively young “Go” trend, we will now watch to see if we get a higher low as well. GoNoGo Oscillator is testing the zero line from above where we will watch to see if it finds support. Should it rally back into positive territory that would signal trend continuation and a likely leg higher in price. If the oscillator on the other hand breaks below zero into negative territory that would threaten the “Go” trend and suggest a larger correction.
The Dollar Tried to Rally
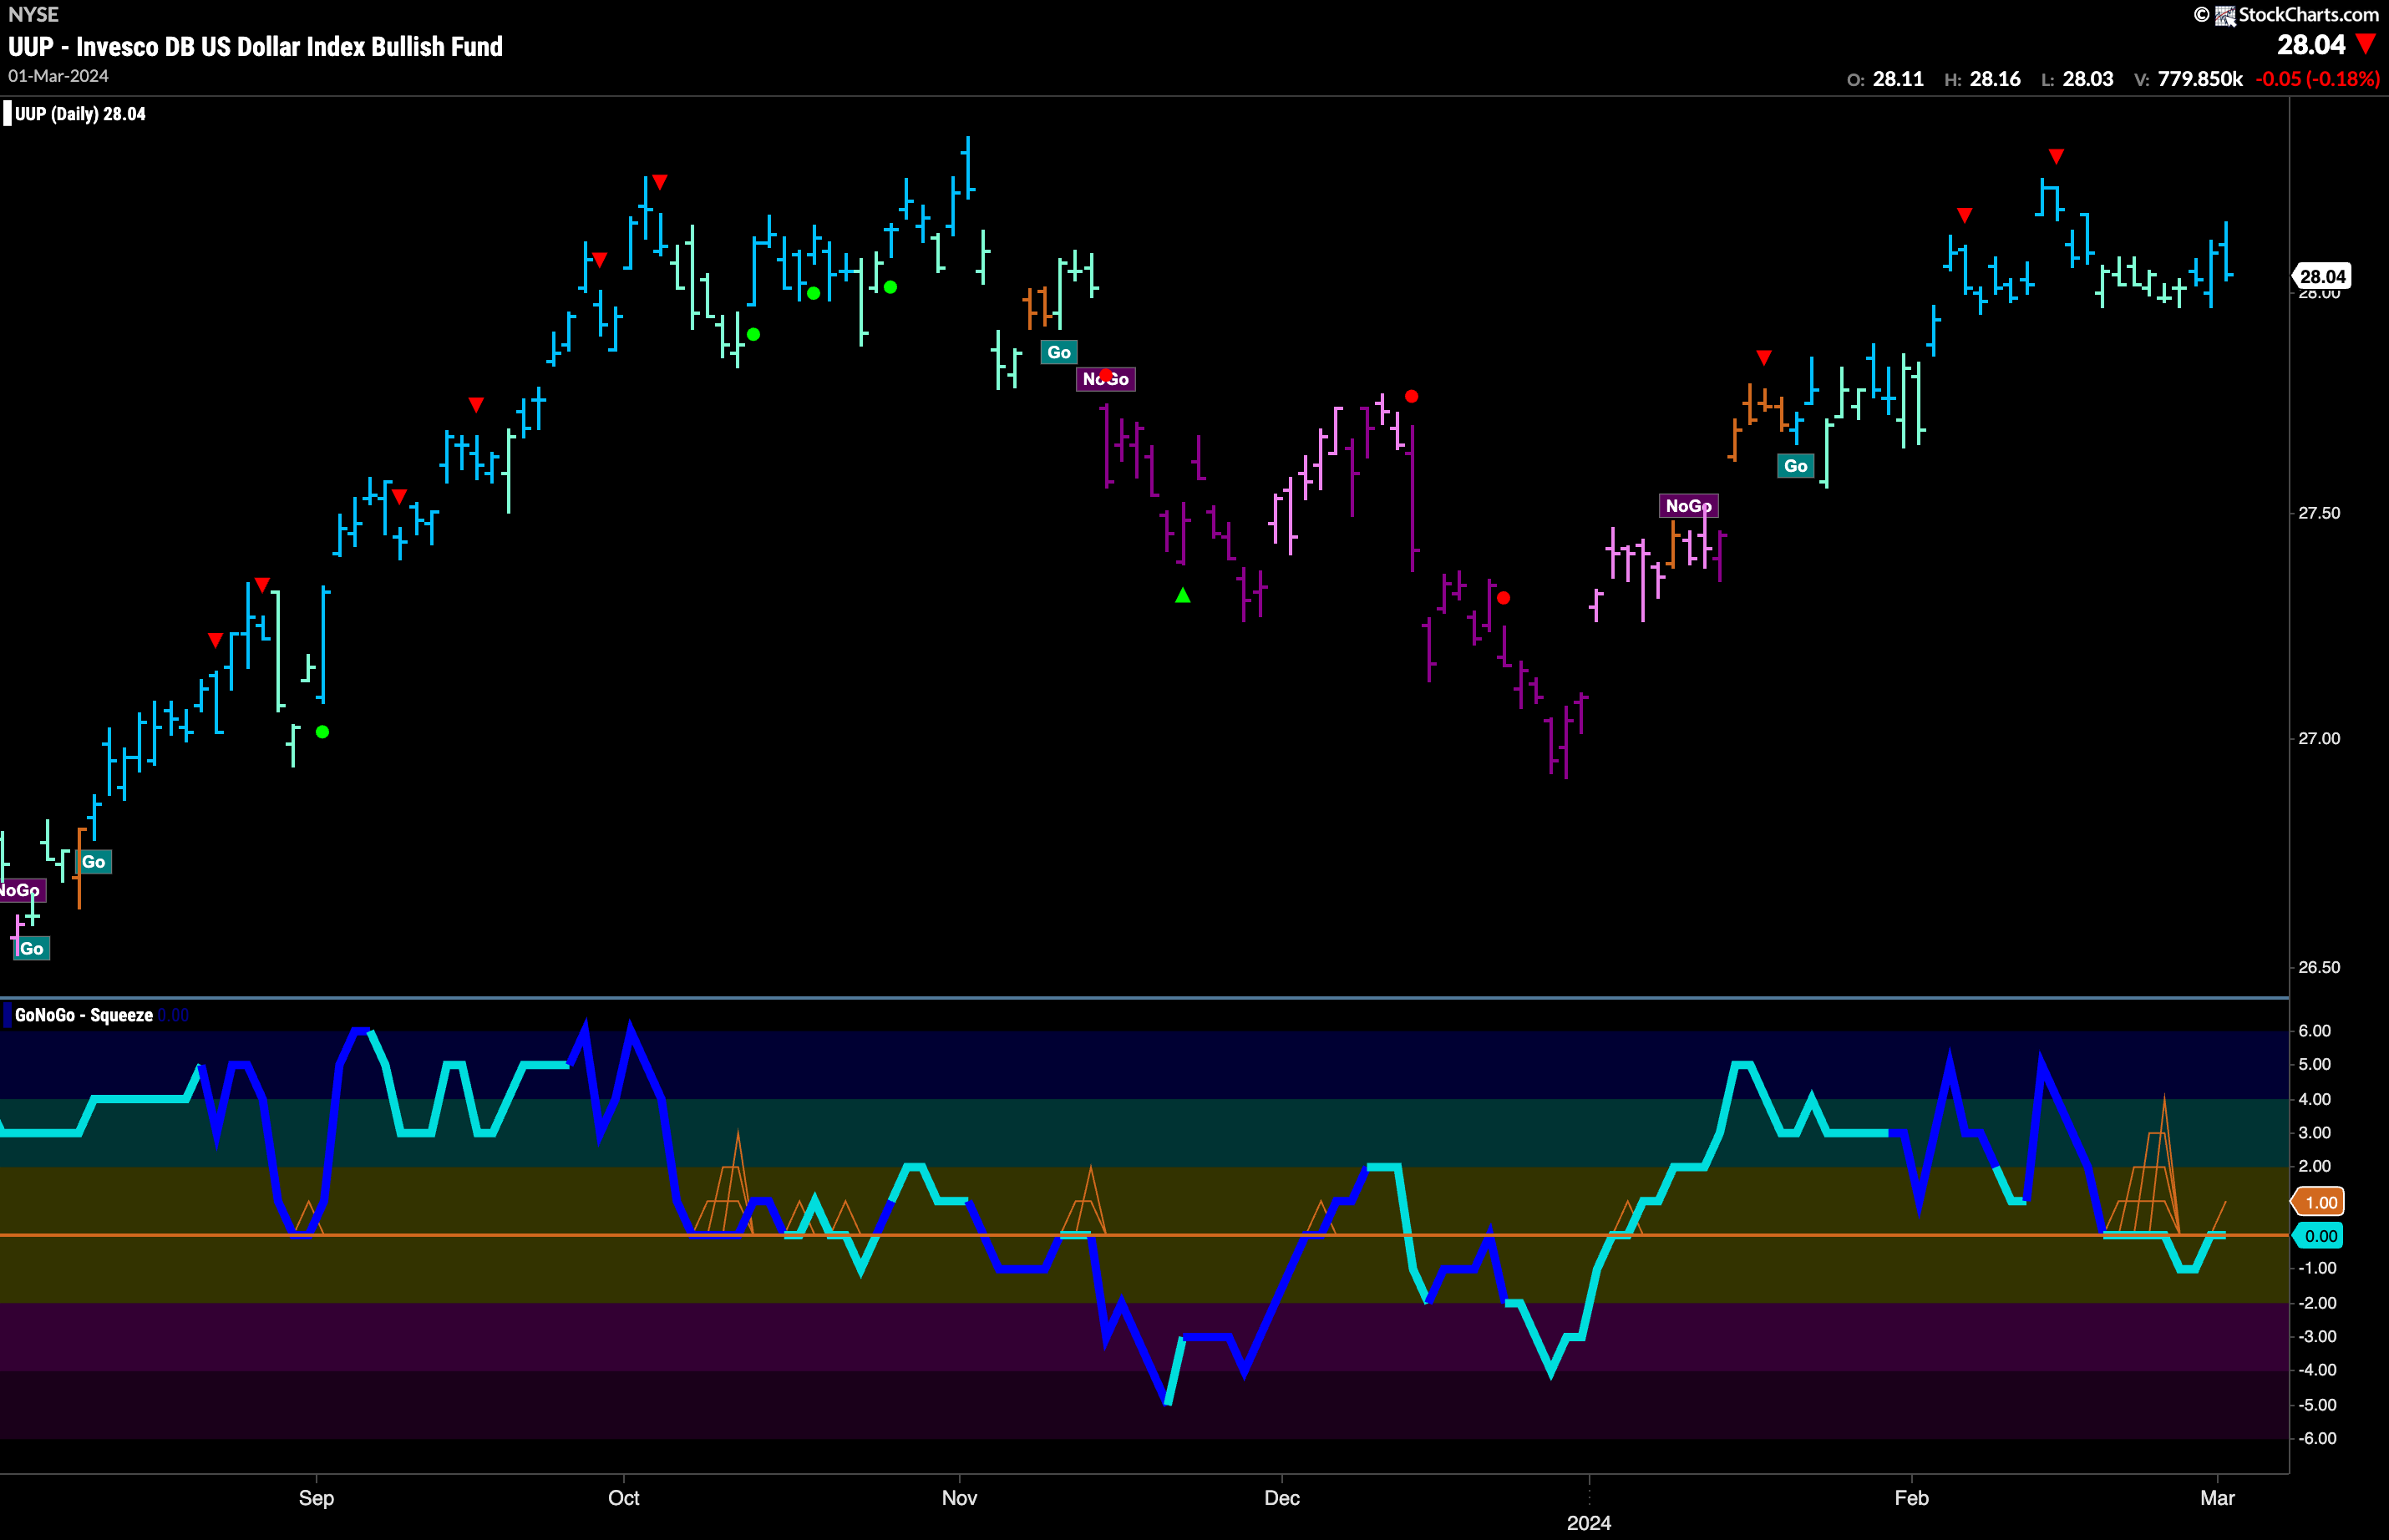
The dollar tried to rally this week and we saw GoNoGo Trend return to painting stronger blue “Go” bars at the end of the week. Since the Go Countertrend Correction Icon (red arrow) we have seen price fall and the GoNoGo Trend paint several weaker aqua bars as price looked for support. GoNoGo Oscillator fell out of a GoNoGo Squeeze briefly into negative territory which was a concern for the “Go” trend but has quickly returned to test that level from below. This is a key moment. Will the oscillator get rejected by zero and fall back into negative territory? If this happens, we would see price likely fall further. If on the other hand, the oscillator is able to move back above zero, this “Go” trend is likely to continue and we’ll see an attack on a new higher high.
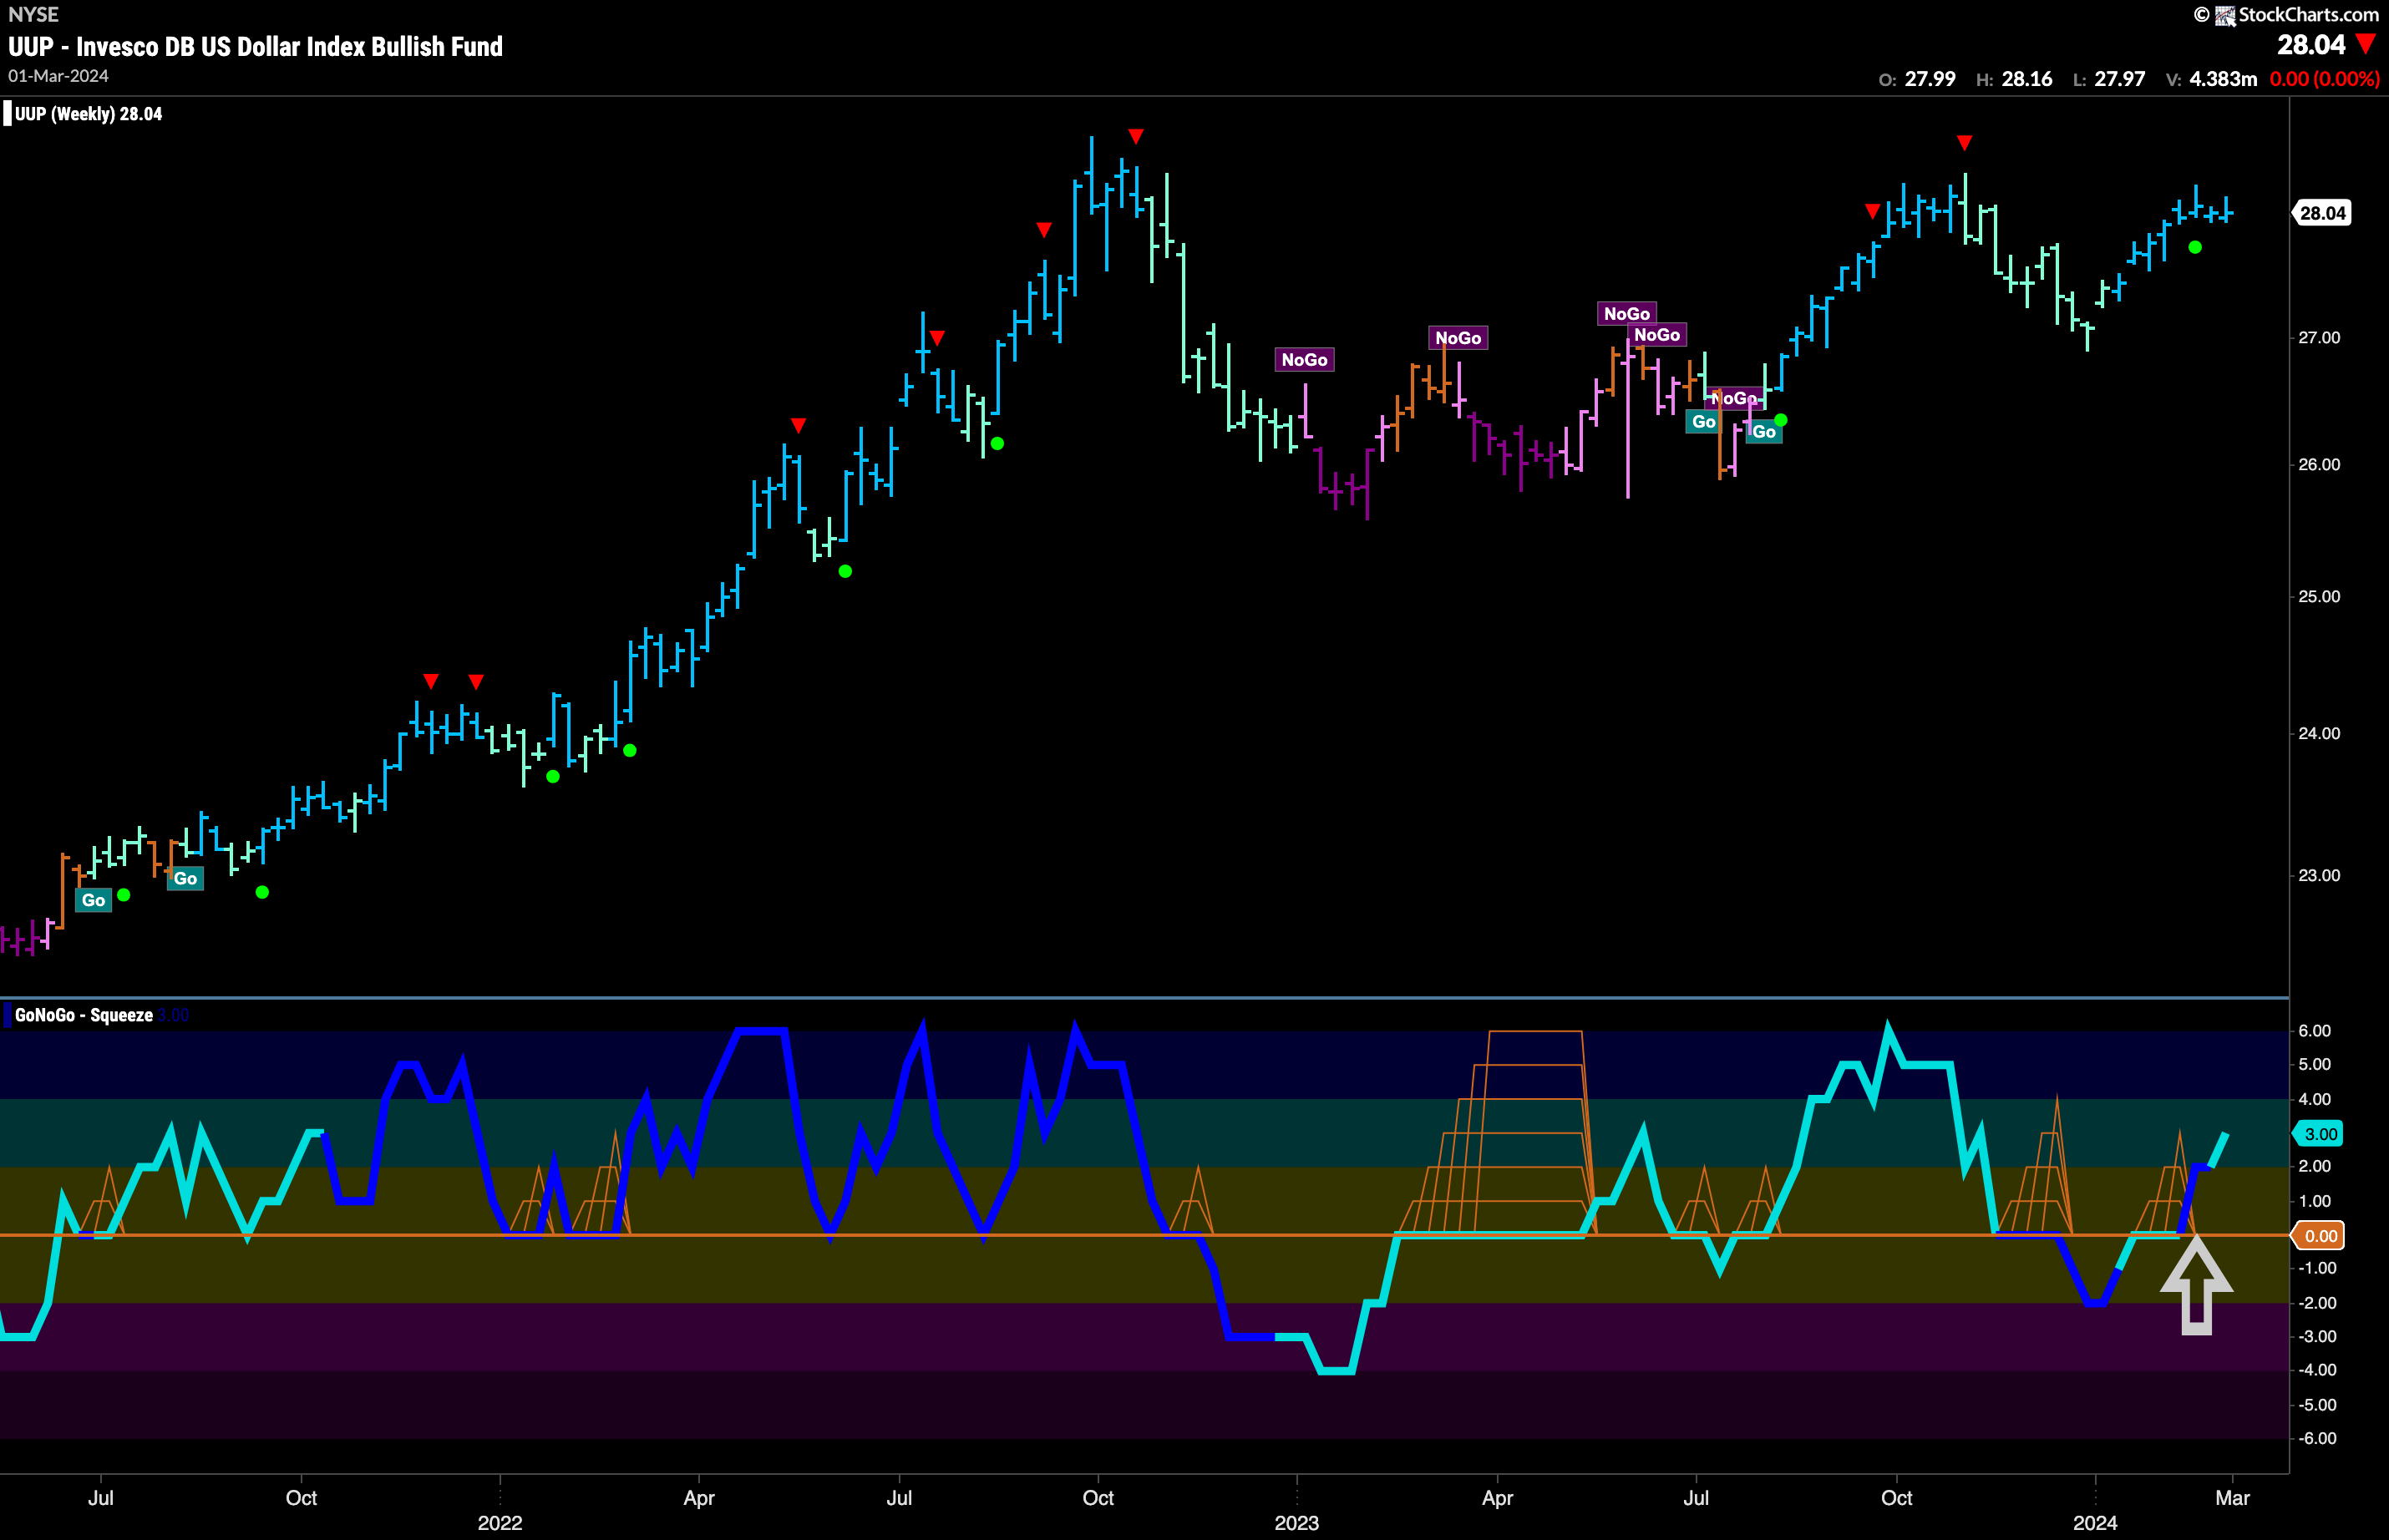
The longer term chart shows that we may be wise to favor the bullish perspective for the dollar. GoNoGo Oscillator has burst into positive territory after having spent a few bars at zero. This suggests trend continuation as momentum is resurgent in the direction of the underlying “Go” trend. We see GoNoGo Trend painting strong blue “Go” bars in the price panel above. There is clear resistance on the chart from prior highs but we will look for price to try to challenge those levels again in the next few weeks.
Oil Sees Strength Return
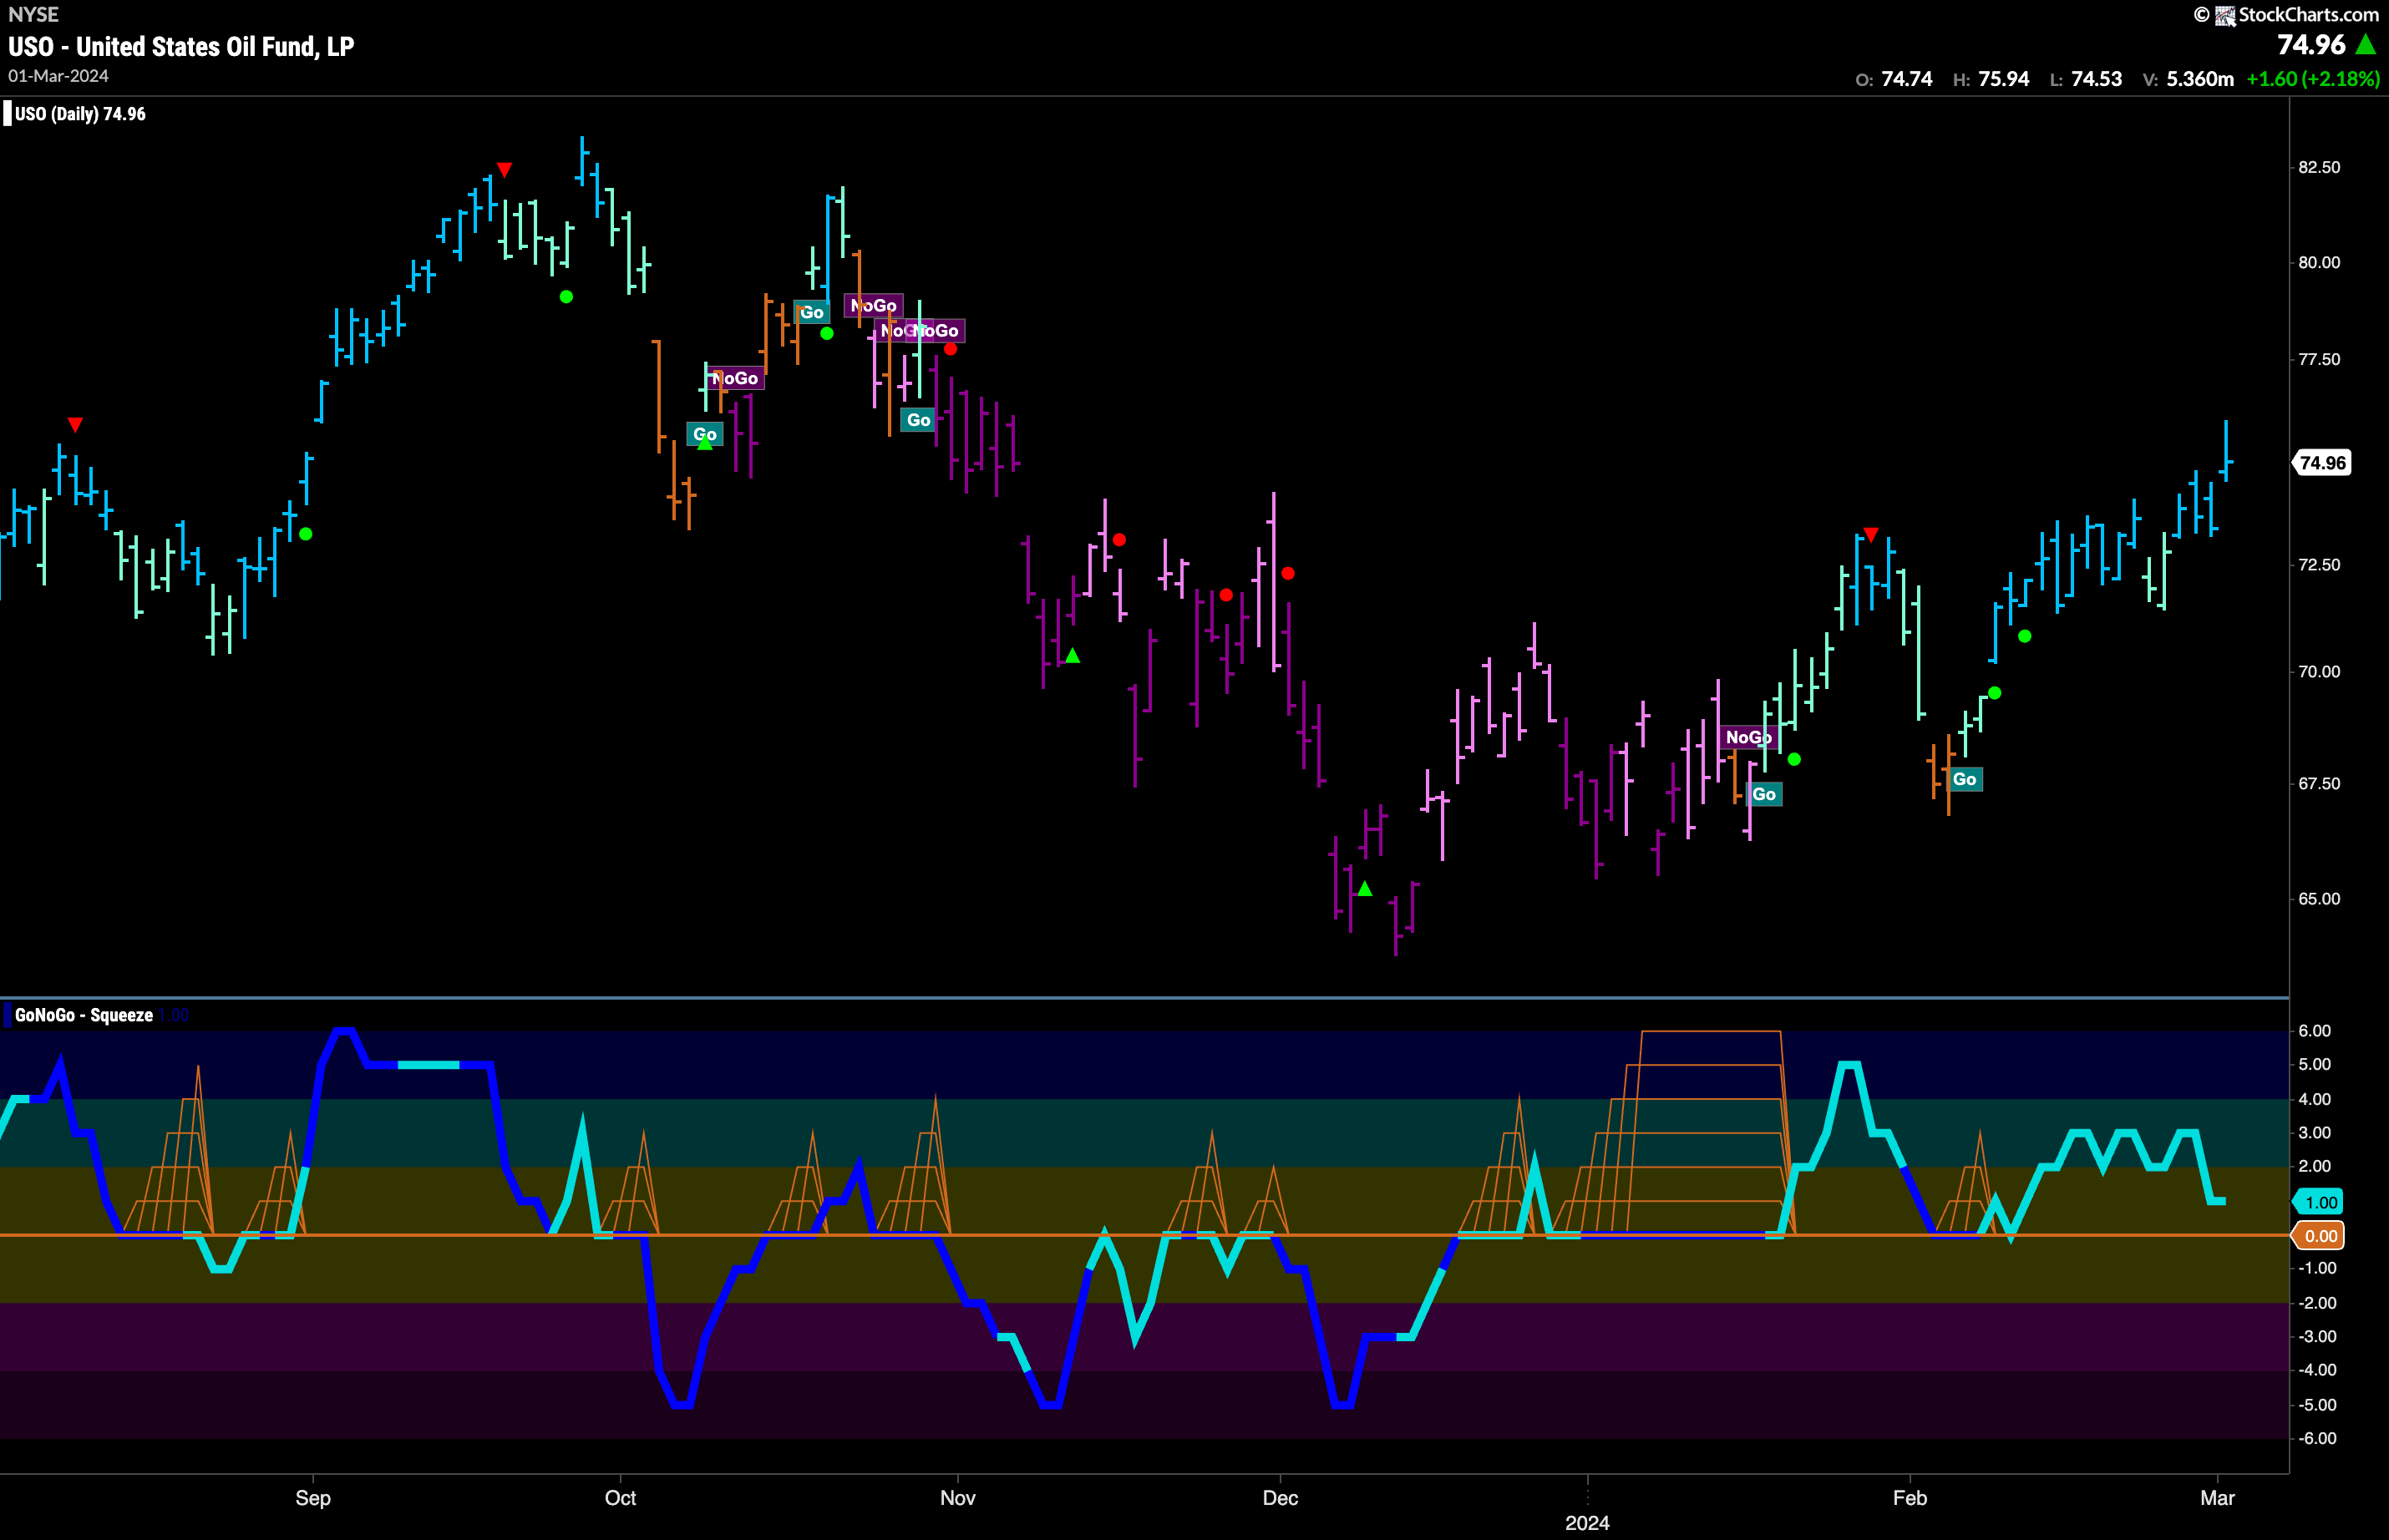
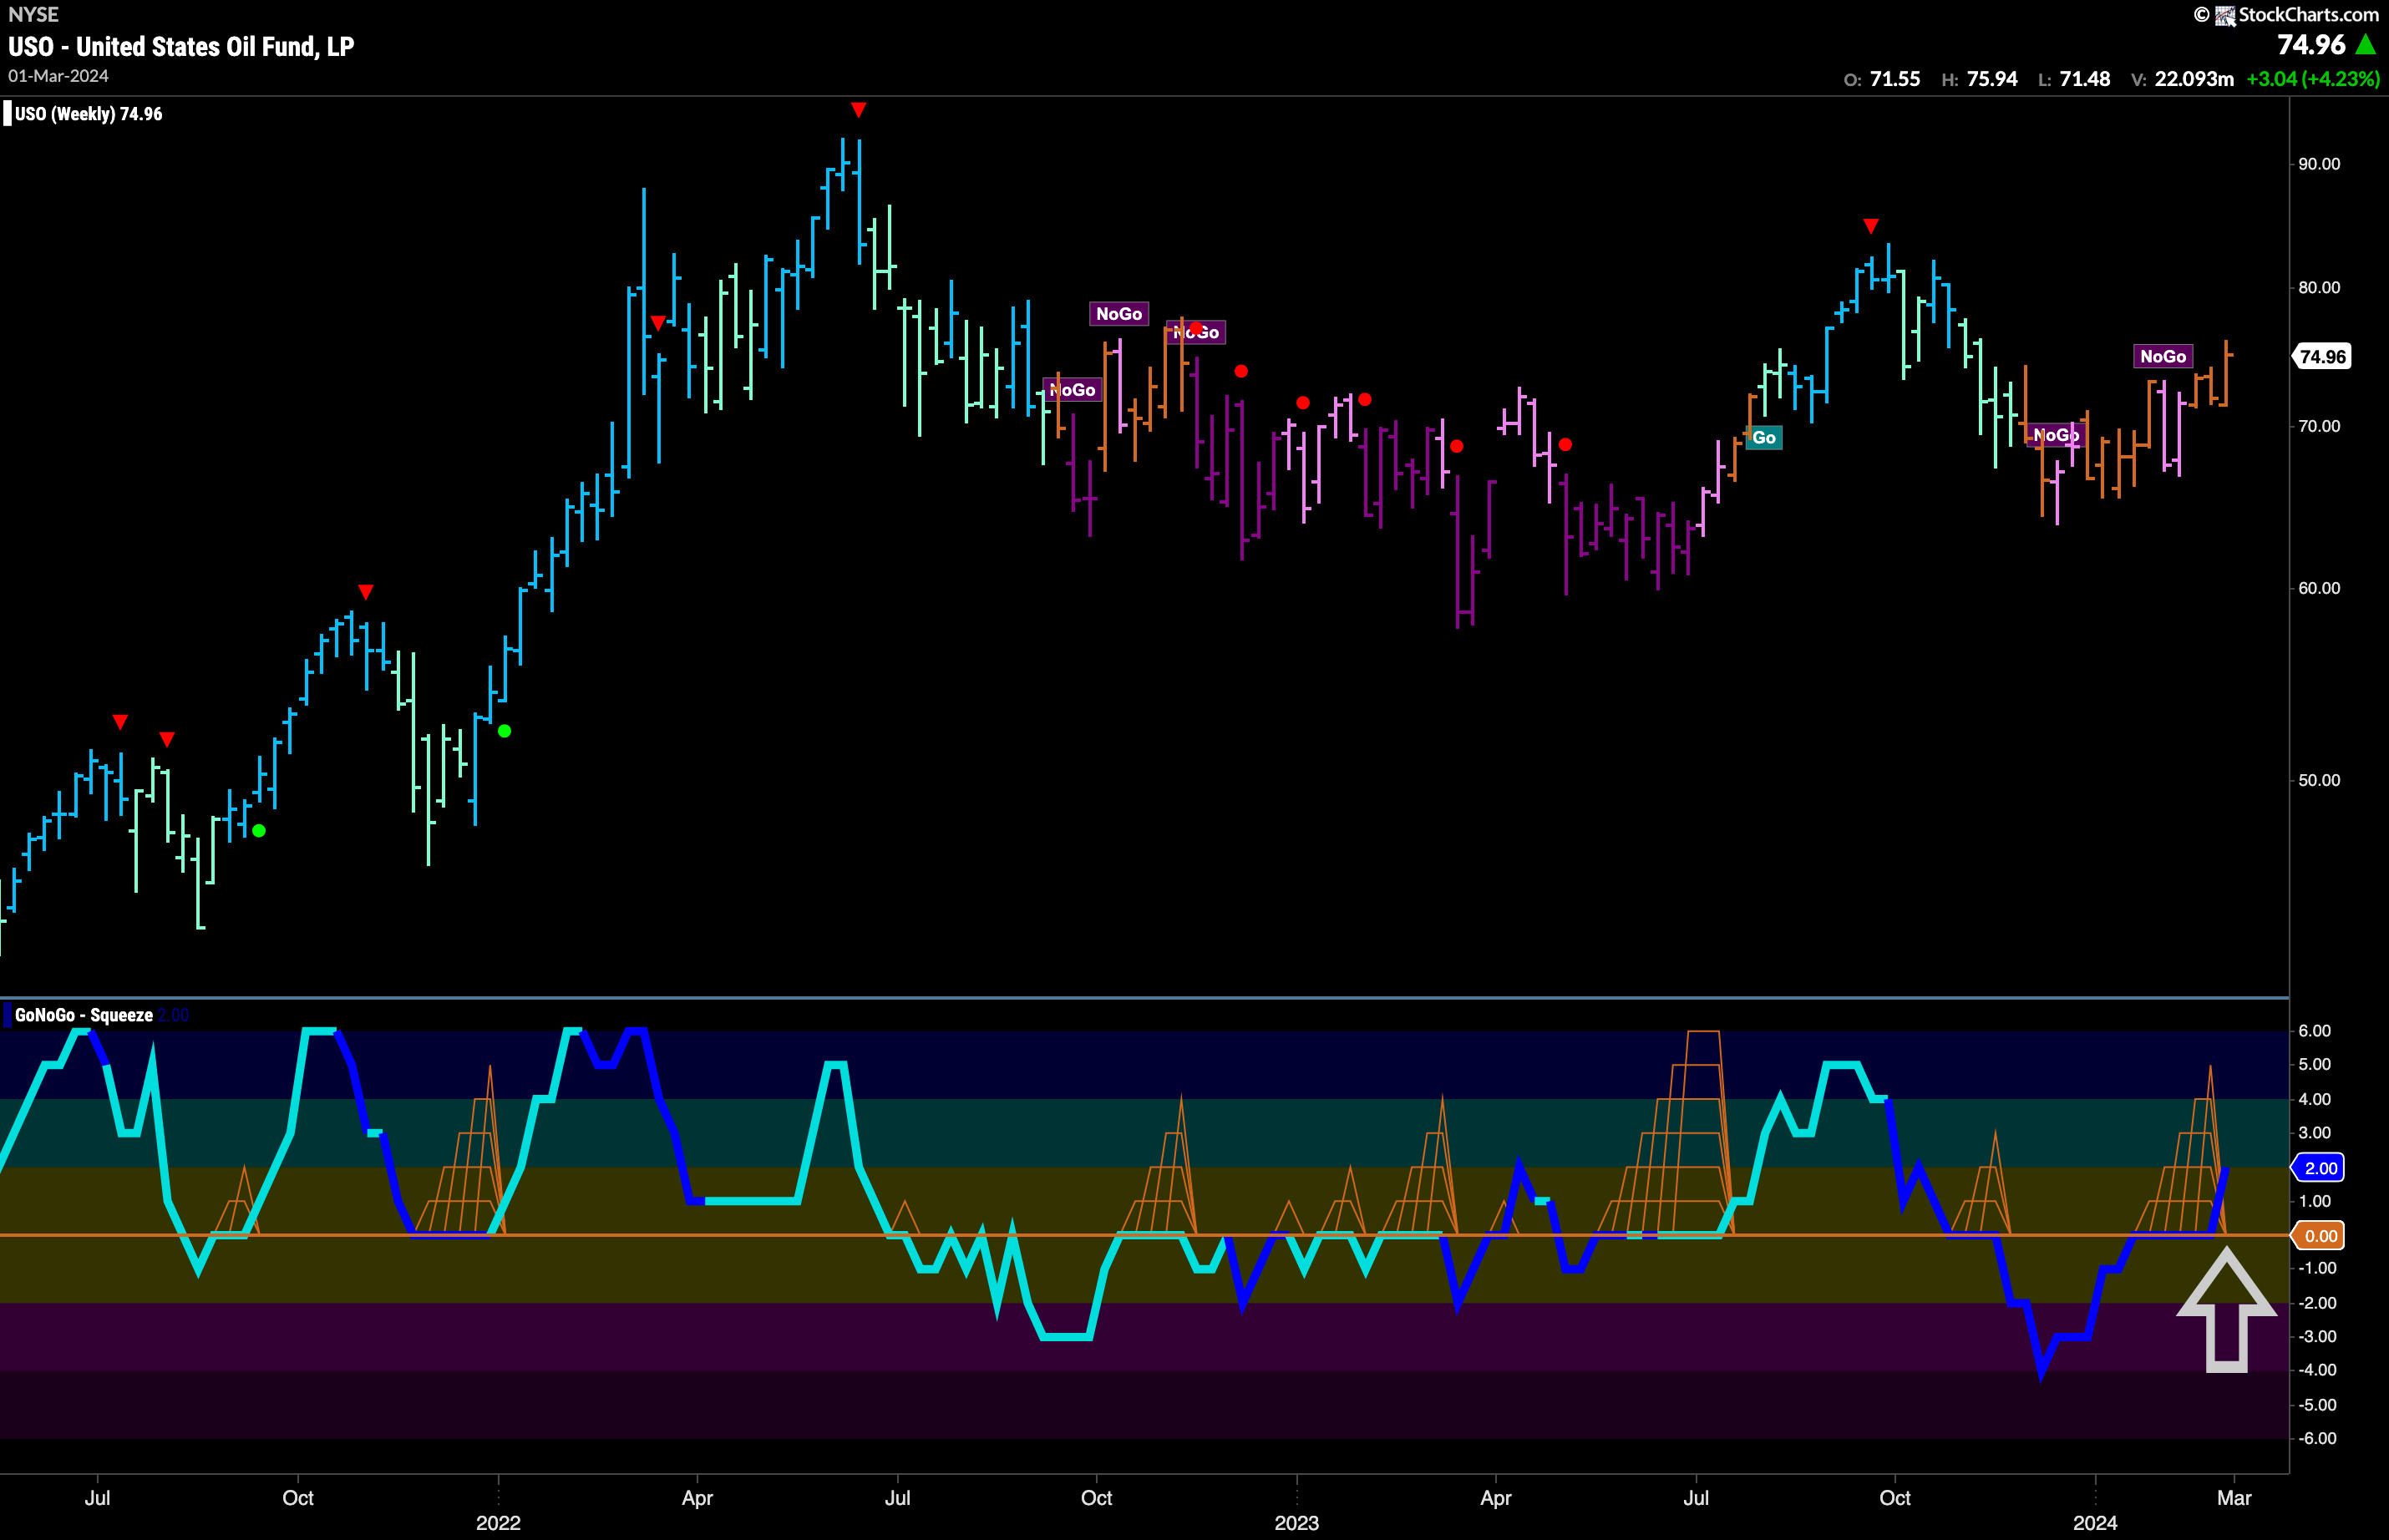
GoNoGo Trend resumed painting strong blue “Go” bars this week after a couple of weaker aqua bars. Price has now made a clear higher high which is a positive for the commodity. GoNoGo Oscillator is at a value of 1 and hasn’t been overbought for a few weeks now. We will watch to see if the oscillator can remain in positive territory and if it does that would provide some support for the “Go” trend.
The weekly chart shows that we may be seeing signs of life on a longer term basis. We have seen a majority of amber “Go Fish” bars for the past few months as the “NoGo” has not been convincing. GoNoGo Oscillator rode the zero line for a few weeks causing a GoNoGo Squeeze to build. We are now seeing that GoNoGo Squeeze broken into positive territory and on heavy volume. This suggests heavy buying and therefore we might look for the GoNoGo Trend to move from amber to “Go” colors as price inches higher.
Gold Makes a Move!
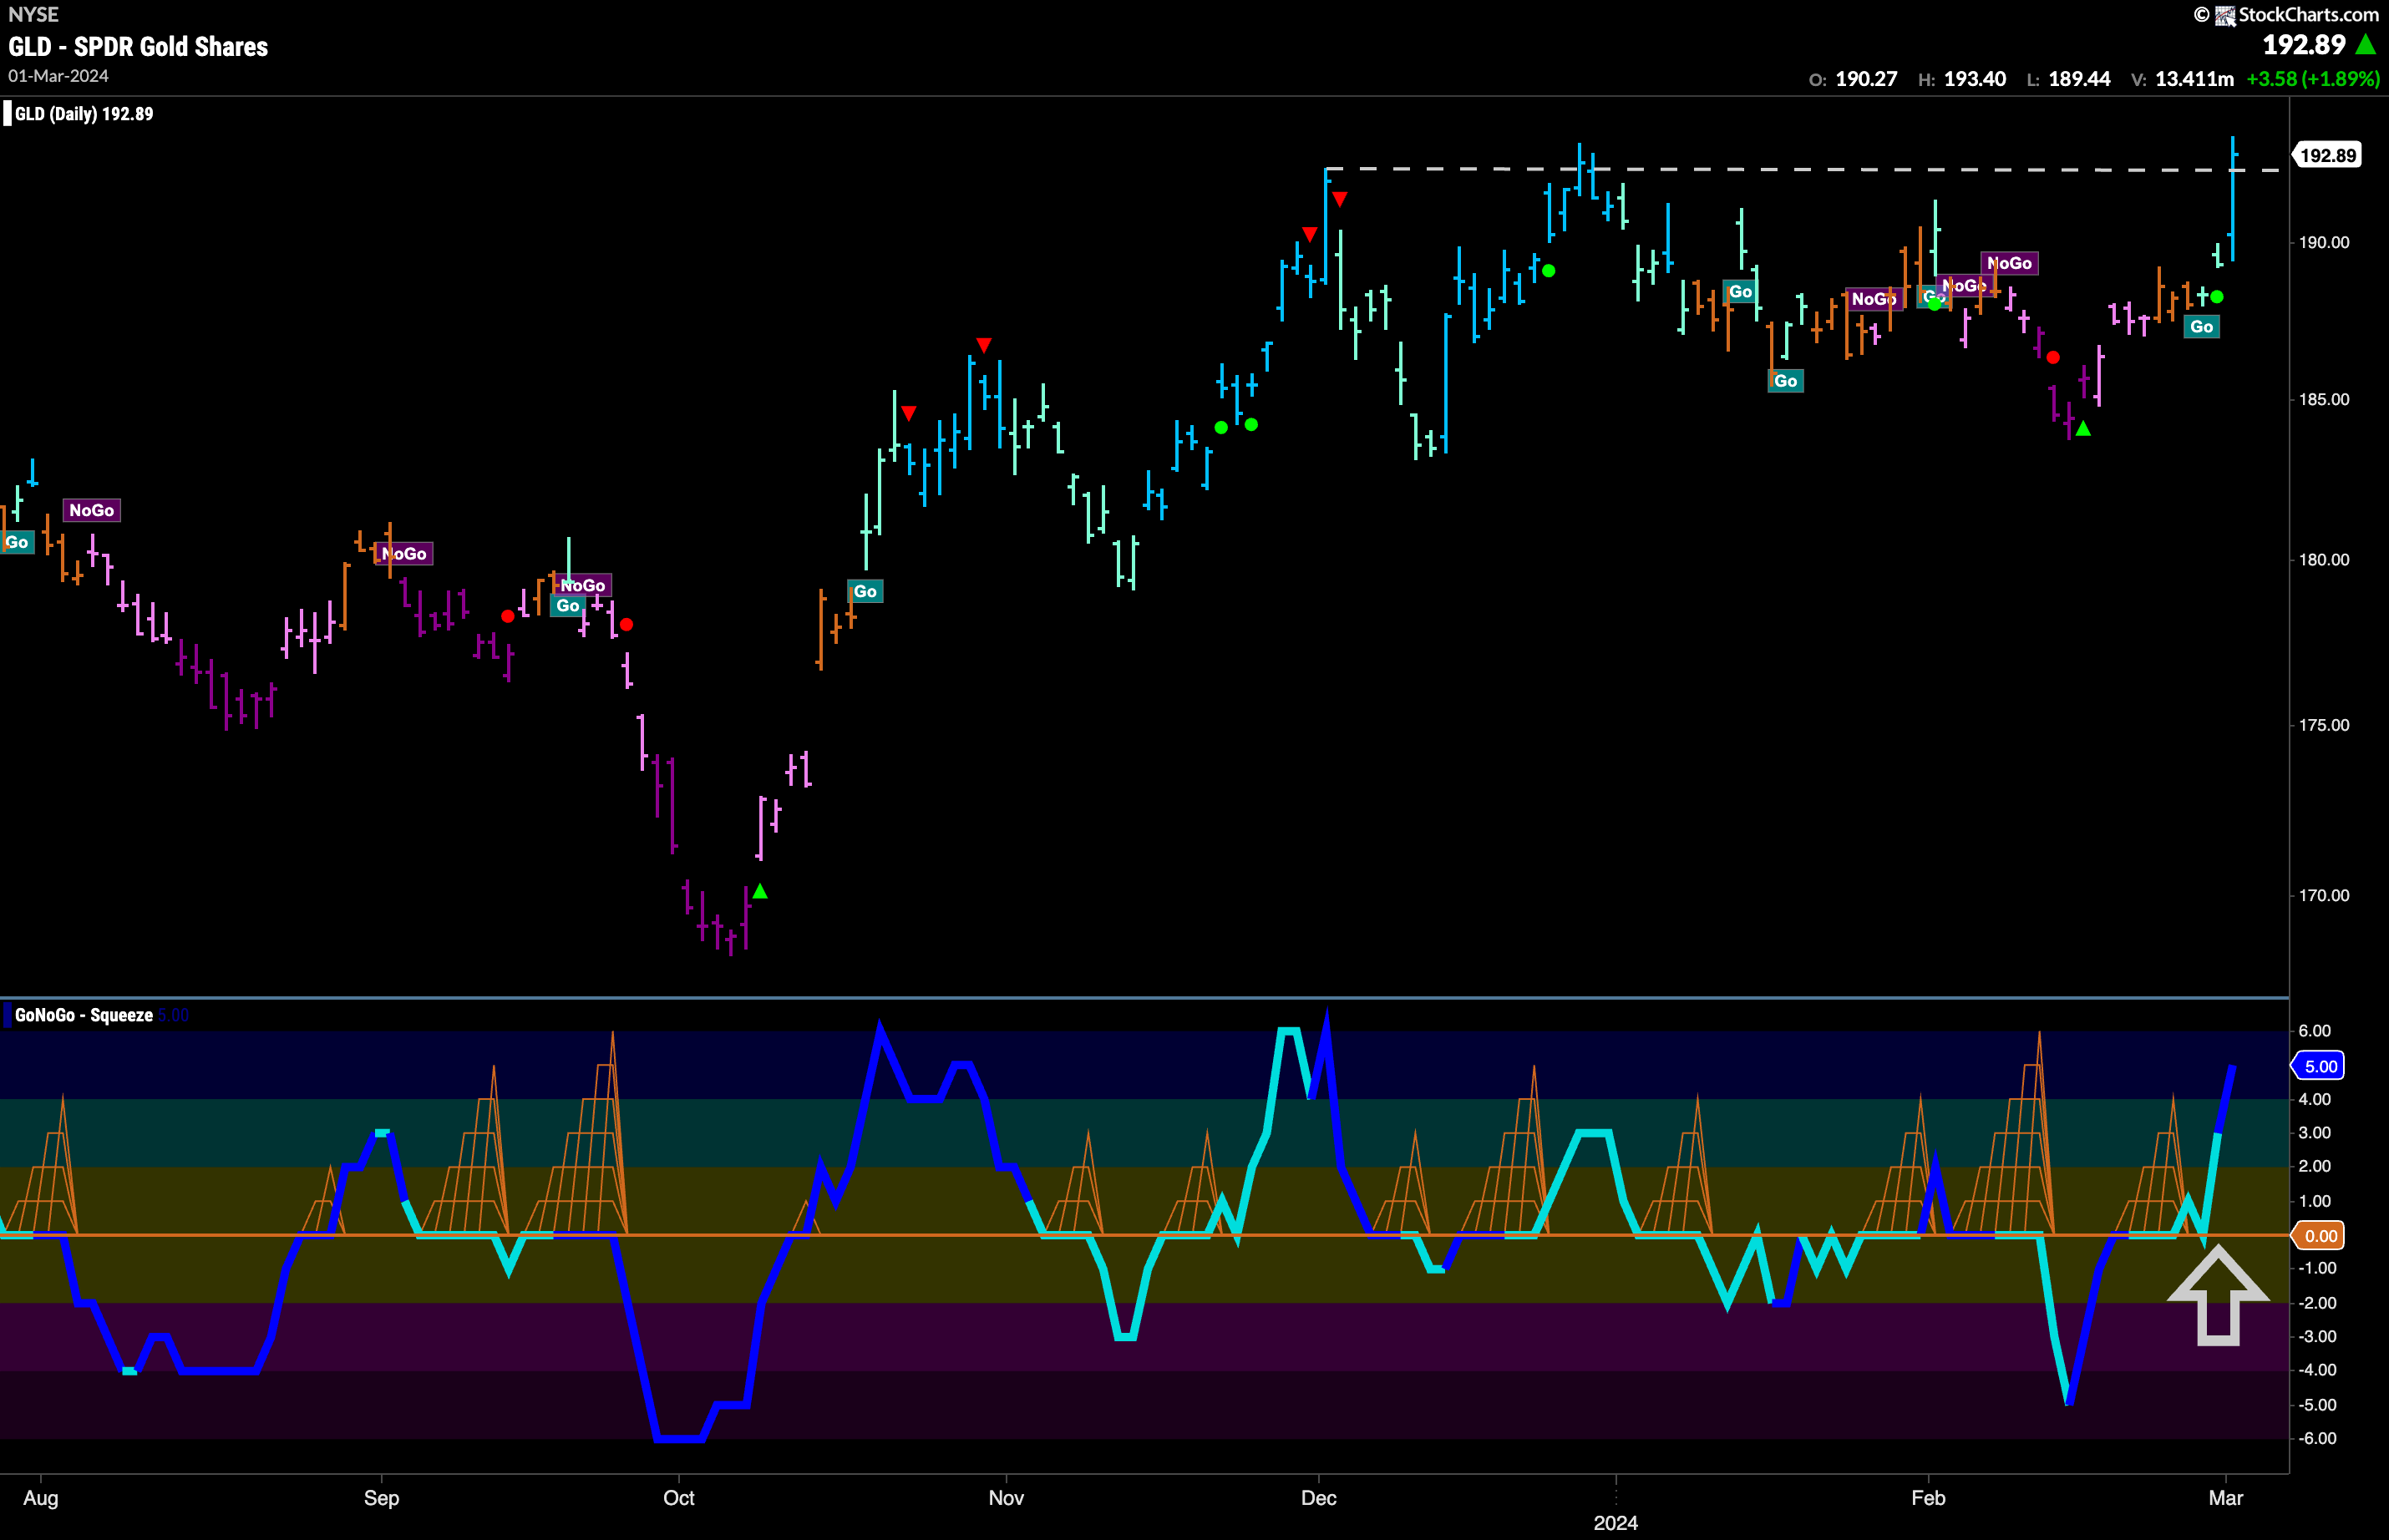
Is this some bravery we are seeing on the part of the precious metal? After months of choppiness we see a very strong “Go” bar to end last week. GoNoGo Trend painted a strong blue bar as GoNoGo Oscillator quickly retested the zero line having broken out of a small GoNoGo Squeeze into positive territory. For the first time since December we appear to have a new high from Friday’s close. With heavy volume, we will watch to see if price can consolidate at these levels which would build some support for a new leg higher.
Sector RelMap
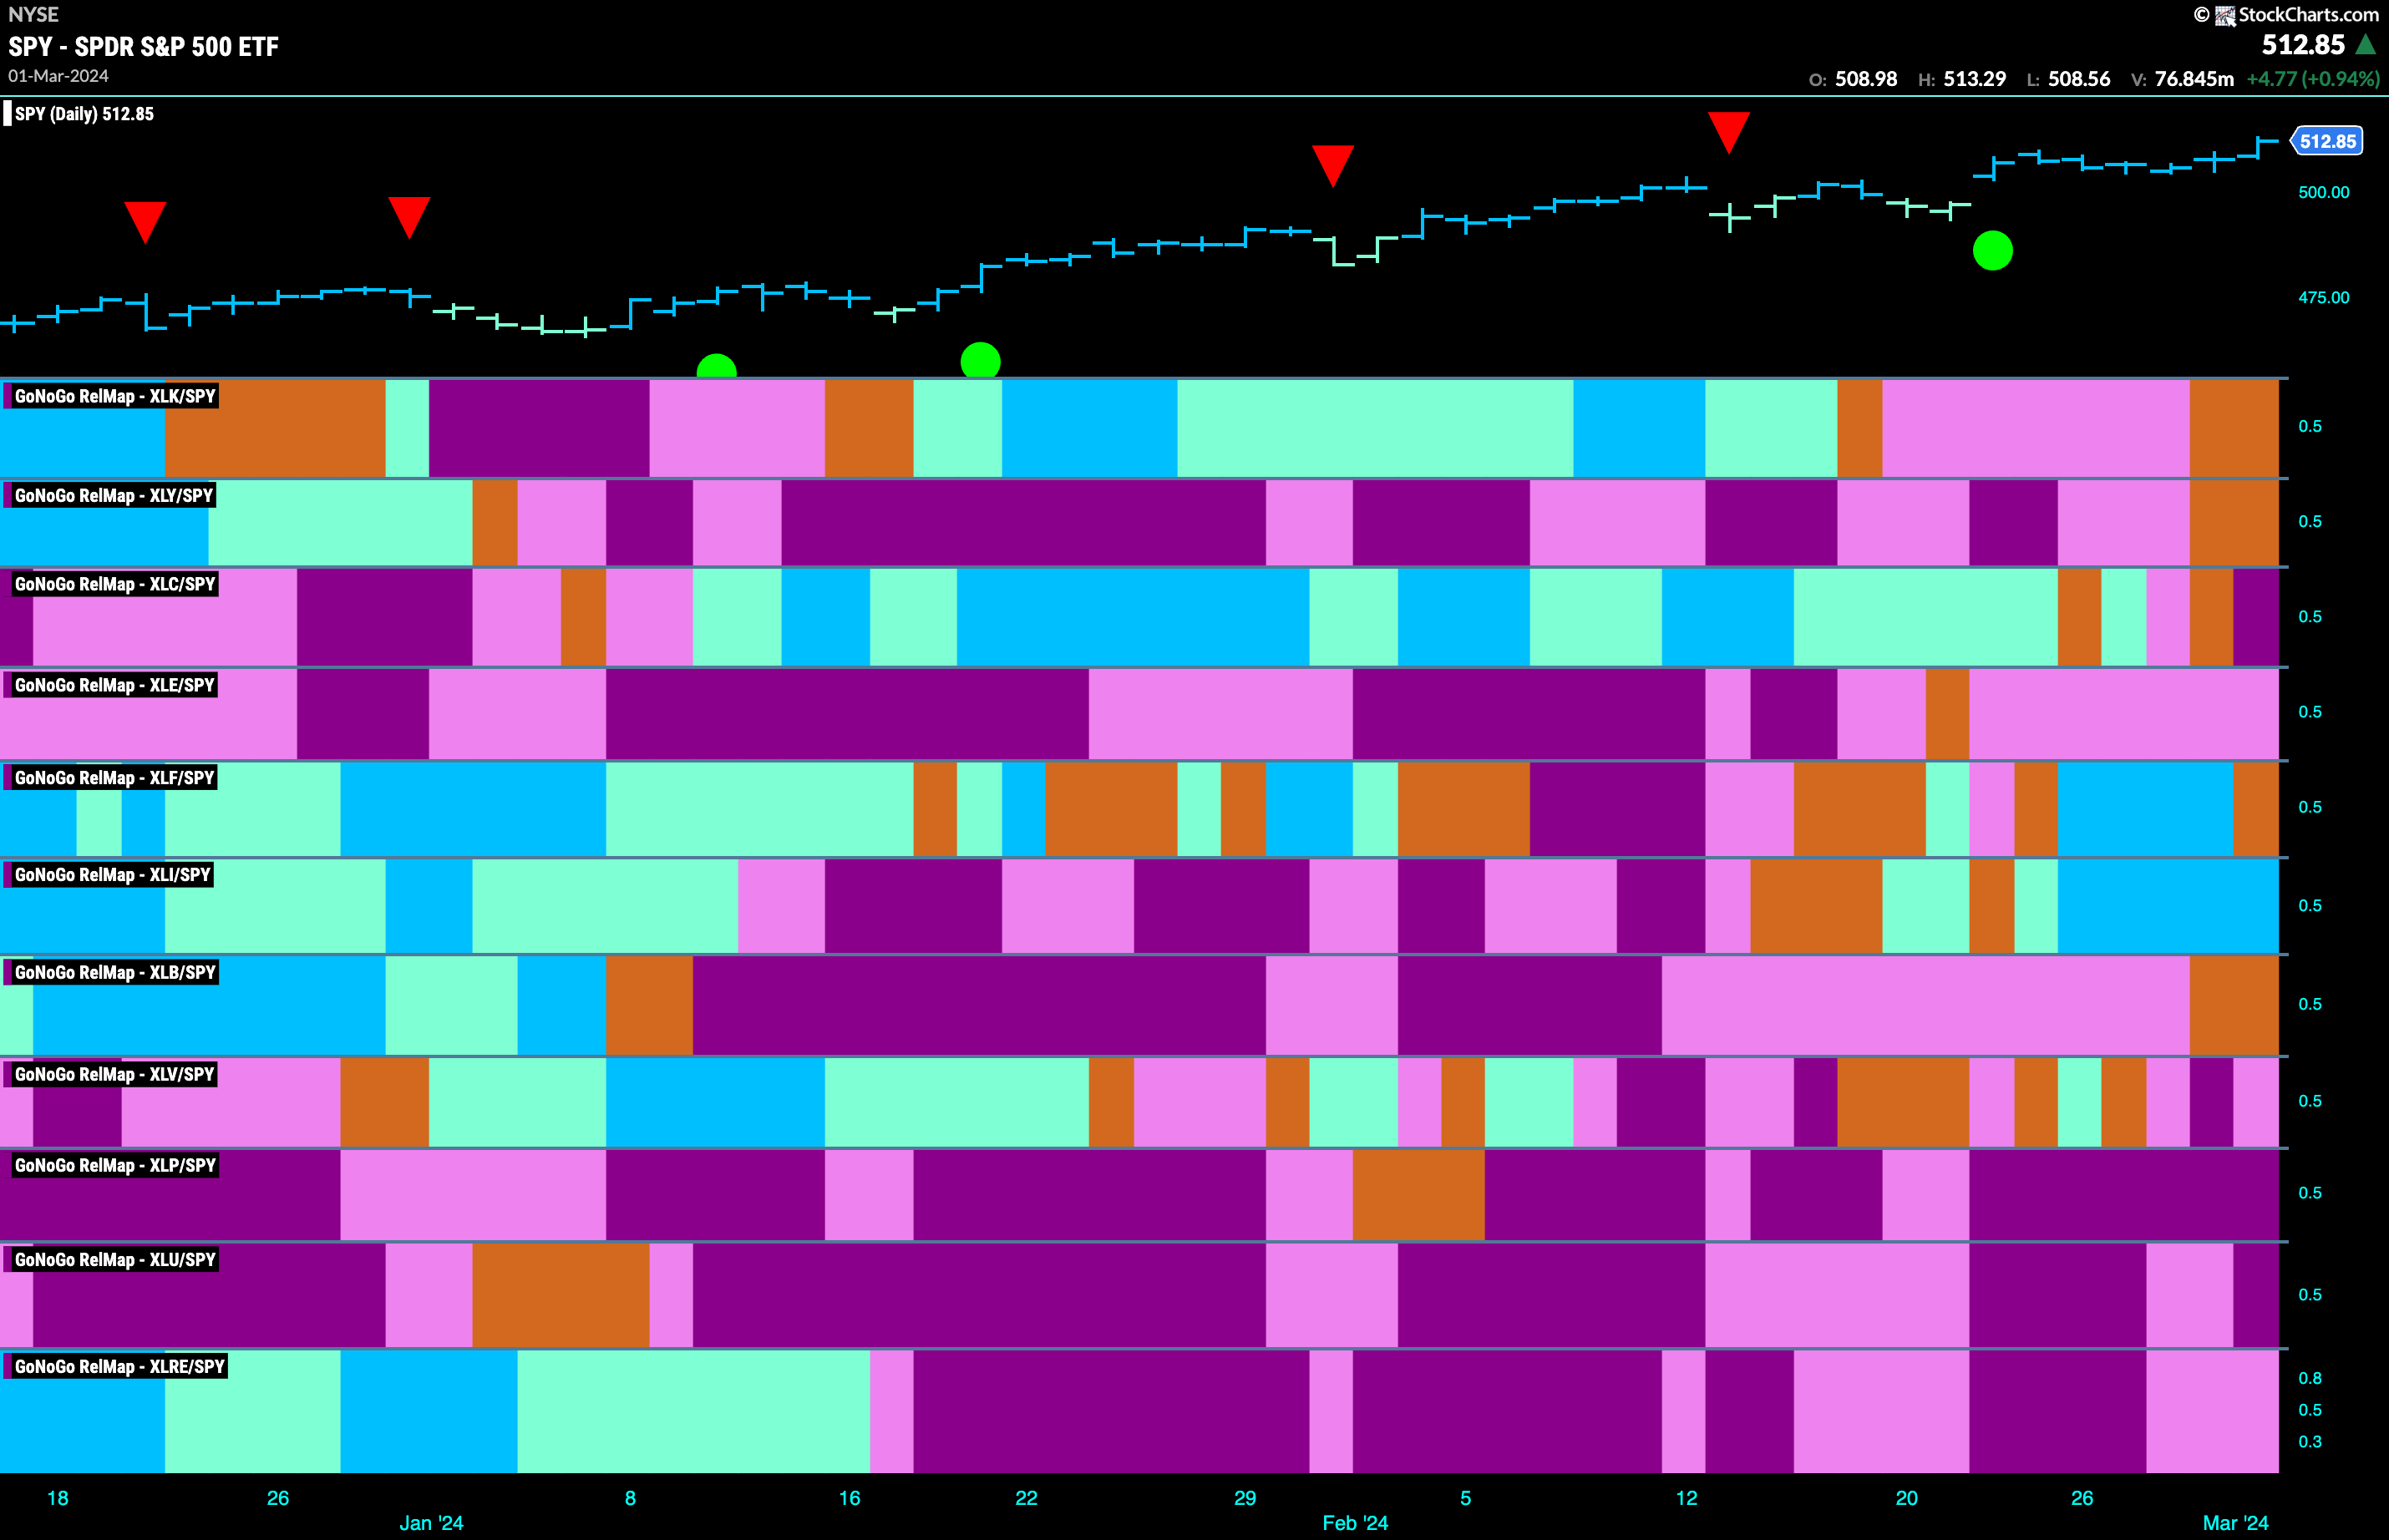
Below is the GoNoGo Sector RelMap. This GoNoGo RelMap applies the GoNoGo Trend to the relative strength ratios of the sectors to the base index. Looking at this map, we can quickly see where the relative outperformance is coming from as well as which sectors are lagging on a relative basis. Only 1 sector is outperforming the base index this week. $XLI is painting relative “Go” bars.
$XLI Maintains Leadership
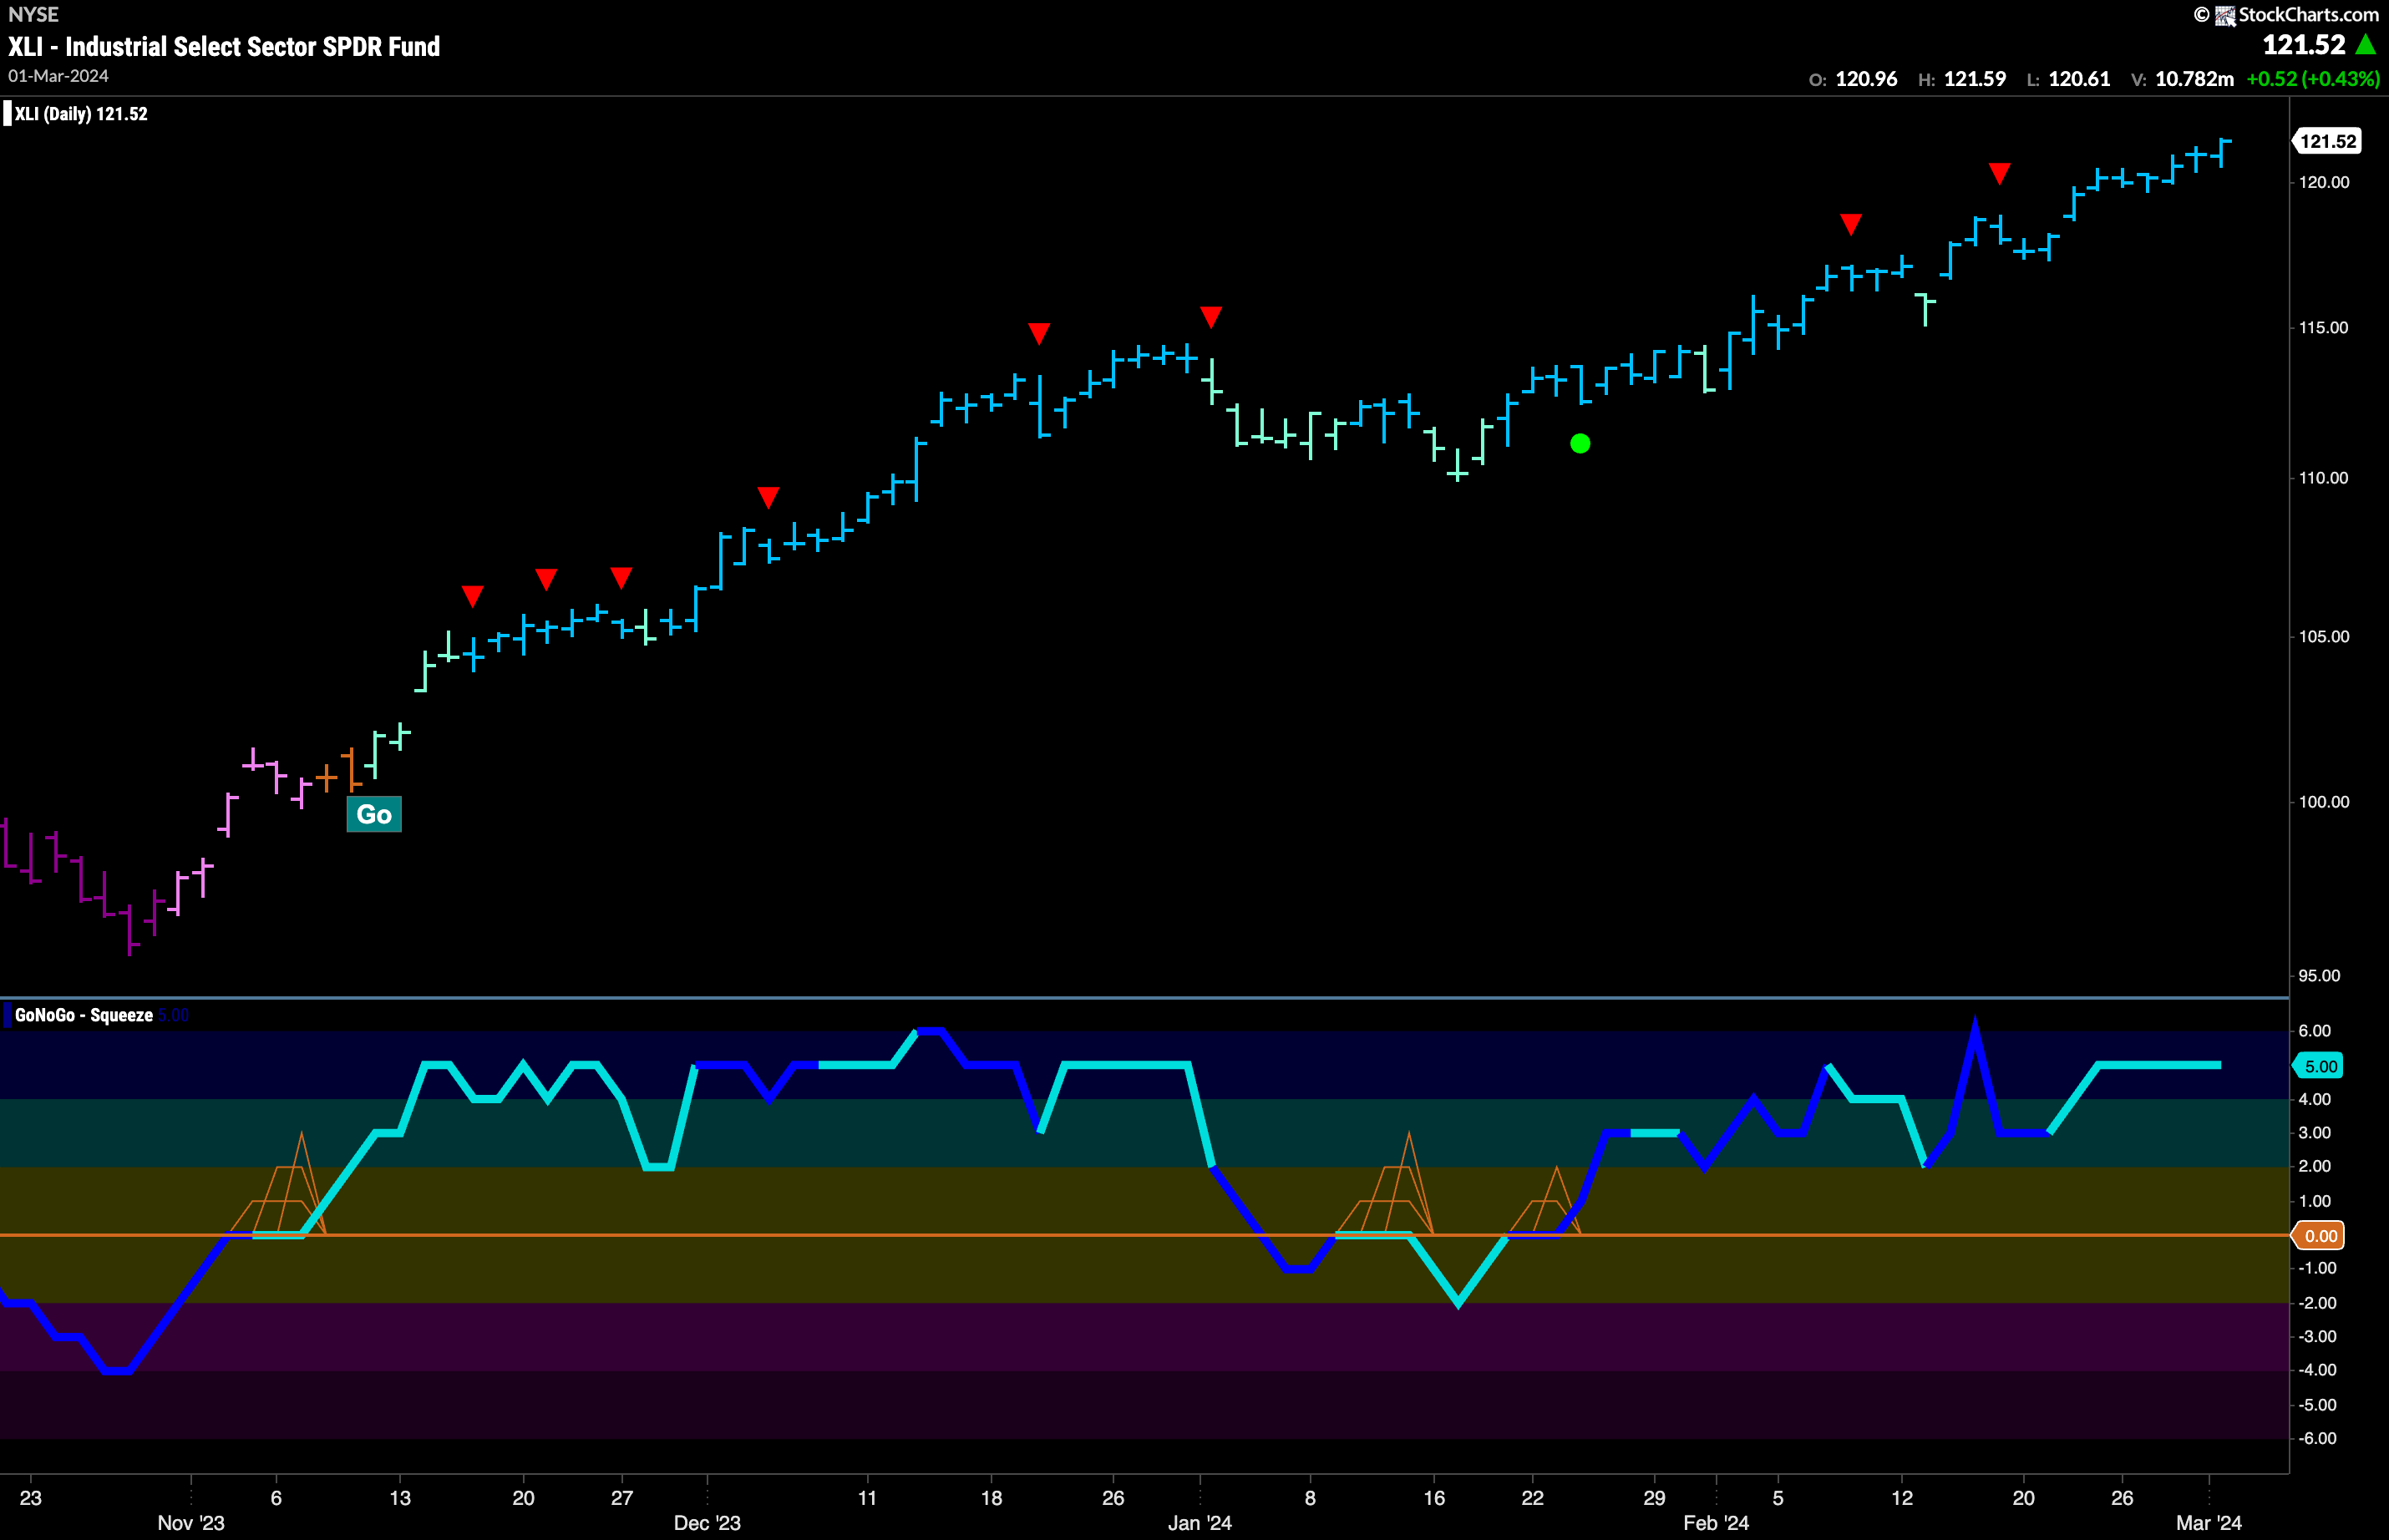
$XLI remains the power player this week as it is forging higher once again. I didn’t forget to update the chart! We have seen another string of uninterrupted strong blue “Go” bars as price raced to new highs every day of the week. GoNoGo Oscillator has remained at a value of 5 the entire week which tells us that there is much market enthusiasm for these higher prices. We will watch to see if momentum cools at some point this week and if it does we will see a Go Countertrend Correction Icon on the chart which could signal a pause. However, as we have seen so far in this trend, those countertrend corrections haven’t lasted long and haven’t done much damage to the price movement.
Industrials Sub-Group RelMap
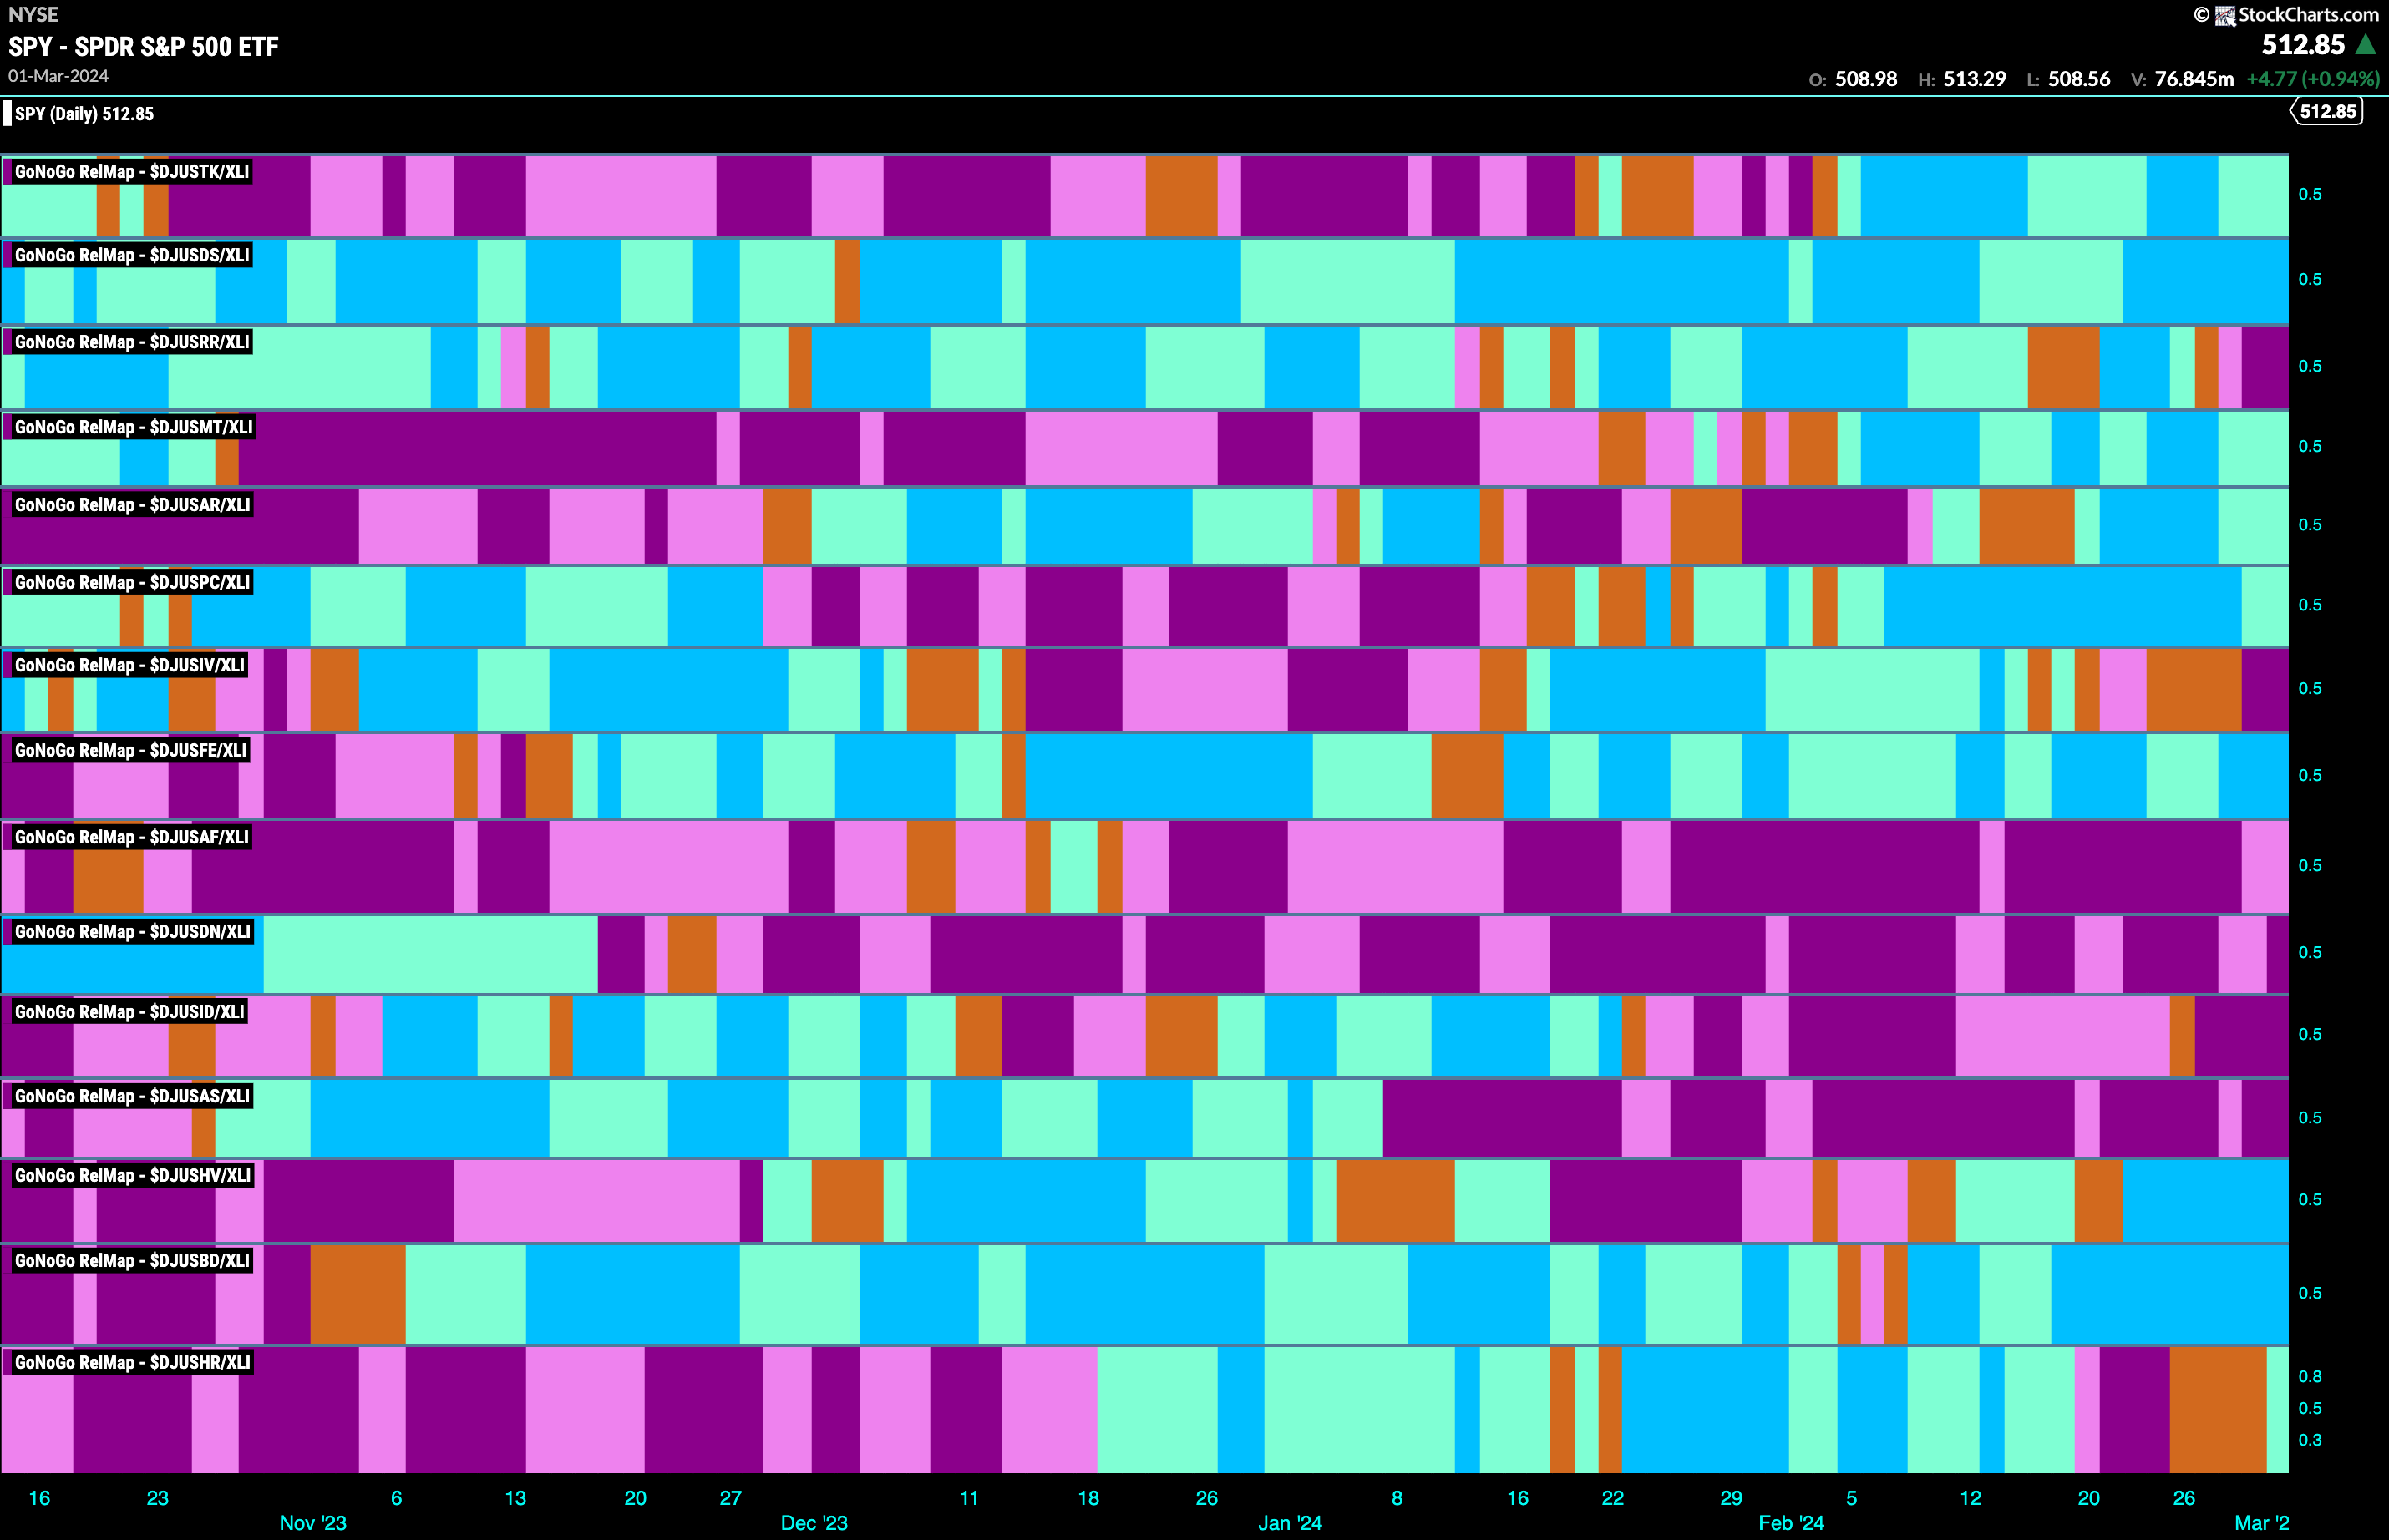
The GoNoGo Sector RelMap above shows that the industrials sector continues to outperform on a relative basis for another week. Below, we see the individual groups of the sector relative to the sector itself. We apply the GoNoGo Trend to those ratios to understand where the relative outperformance is coming from within a sector. Again we see 9 out of the 15 sub groups are showing relative “Go” trends. The second panel still jumps out as the strongest and most consistent performer over this time period. The second panel is the industrial suppliers index.
$MLI Breaks to New Highs
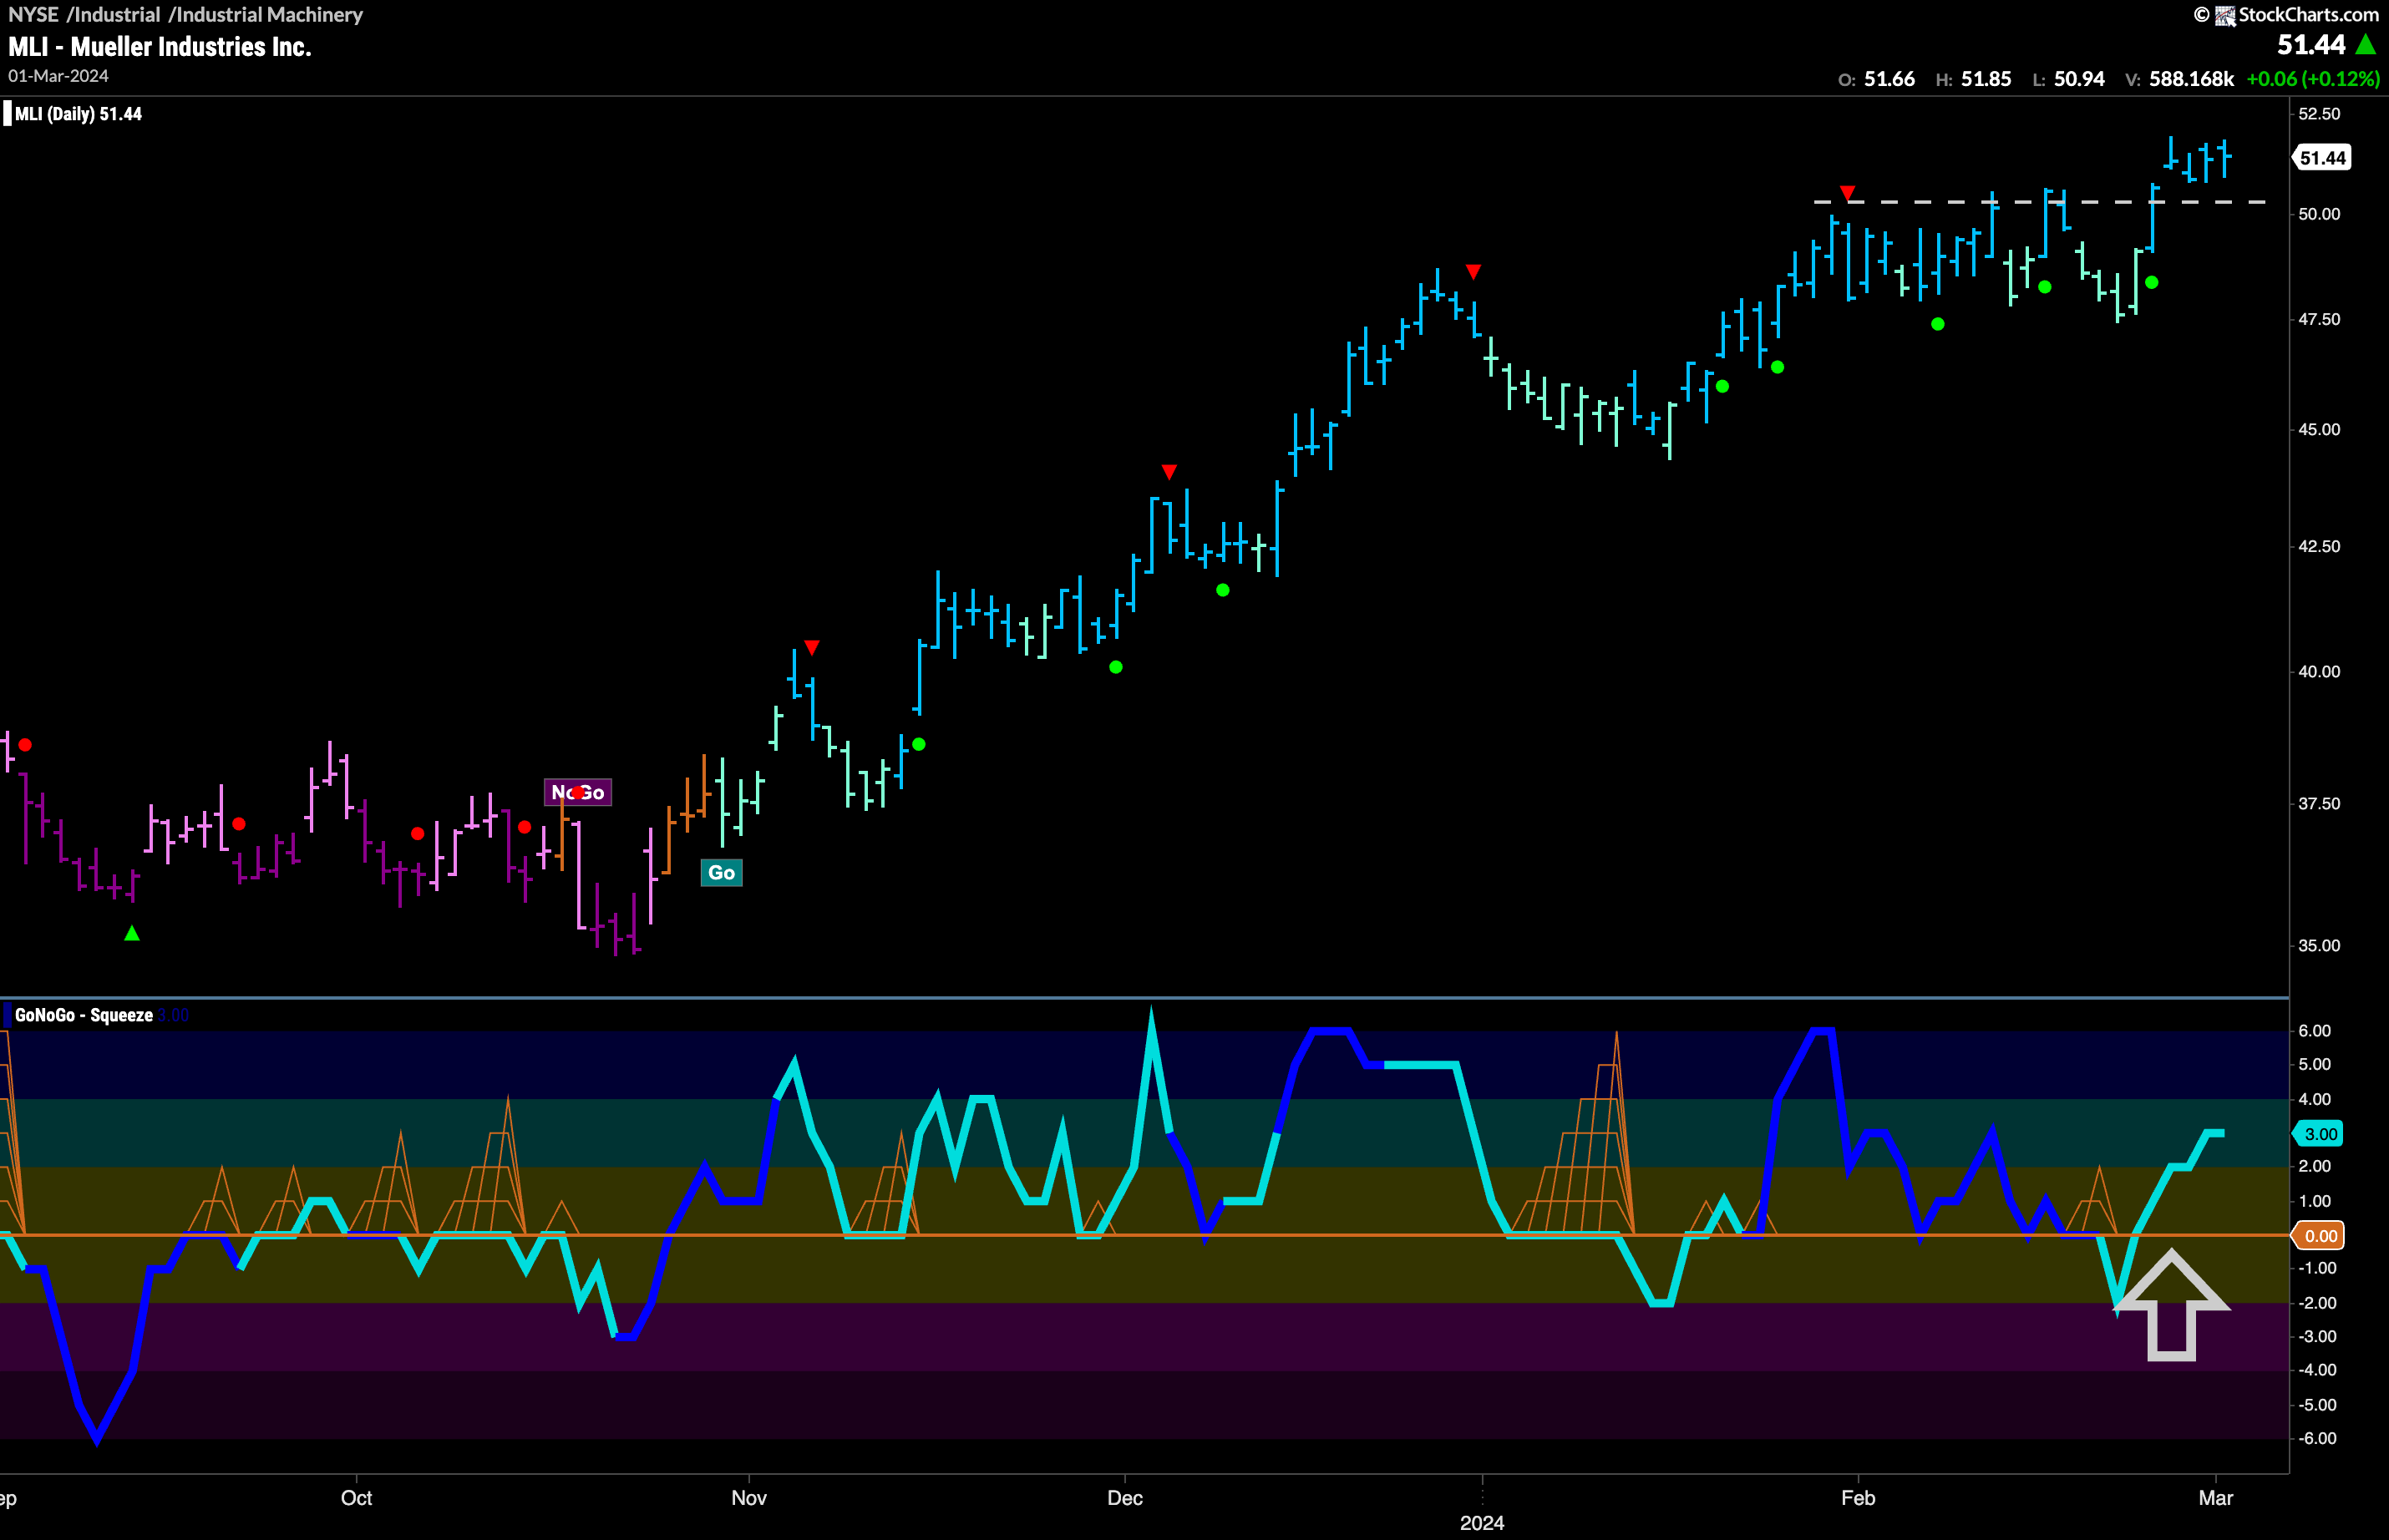
If we continue to fish where the fish are we can cast our net over a few more securities in the industrial suppliers index. $MLI has been in a strong “Go” trend since November of last year and we have seen a series of higher highs and higher lows. In February price hit a new high and we saw a Go Countertrend Correction Icon (red arrow) that told us price may struggle to move higher in the short term. Indeed, we then saw that level provide resistance. Last week we saw GoNoGo Oscillator burst through the zero line and another Go Continuation Icon (green circle) appear on the chart. This seems to have given price the push it needed to get above resistance. Price has consolidated at this level and we will look for it to climb higher from here.
$HYLN Flags New “Go” Trend
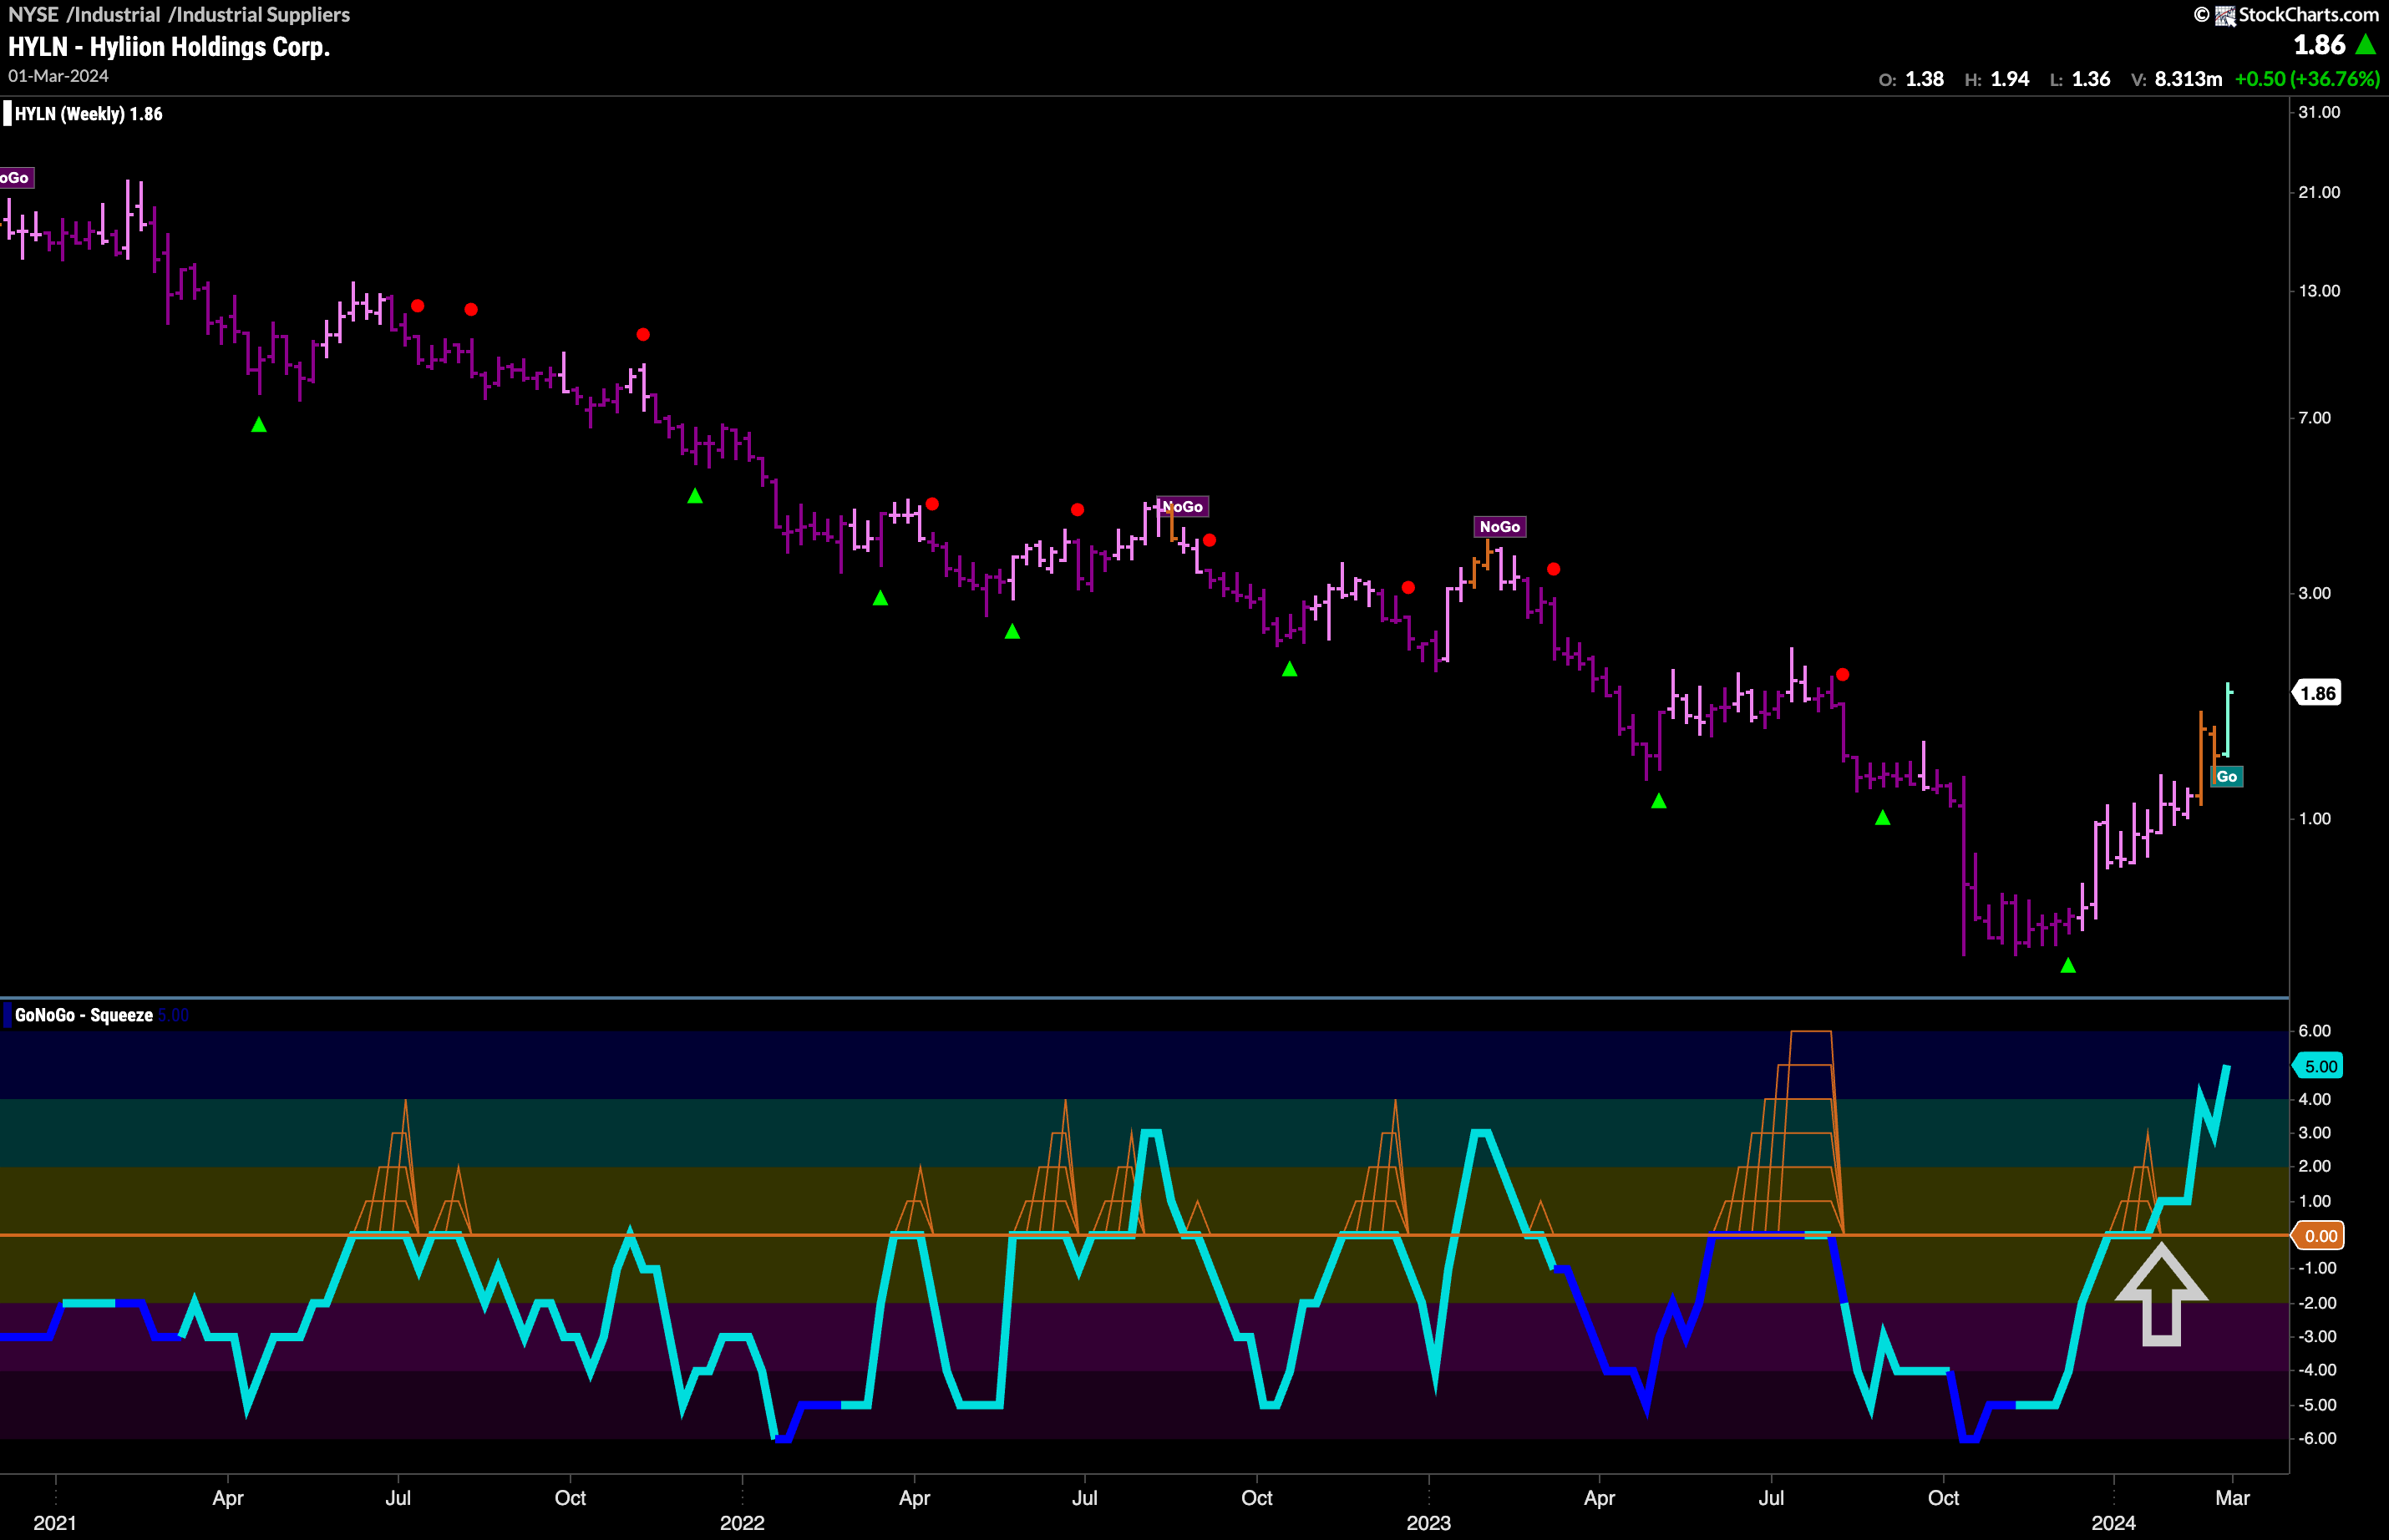
Does a rising tide lift all ships? We will see if $HYLN can capitalize on the outperformance of industrial suppliers as the chart below shows trend reversal. This is a weekly chart and we saw after the latest low in the “NoGo” trend how GoNoGo Oscillator rose to challenge the zero line from below before breaking through and into positive territory. GoNoGo Trend then painted a couple of “Go Fish” bars as the market showed some uncertainty with the “NoGo” trend. Now, GoNoGo Trend is painting an aqua “Go” bar. With momentum firmly on the side of the “Go” trend, we will watch for the “Go” trend to strengthen to blue bars and for price to make a new high above $2.
