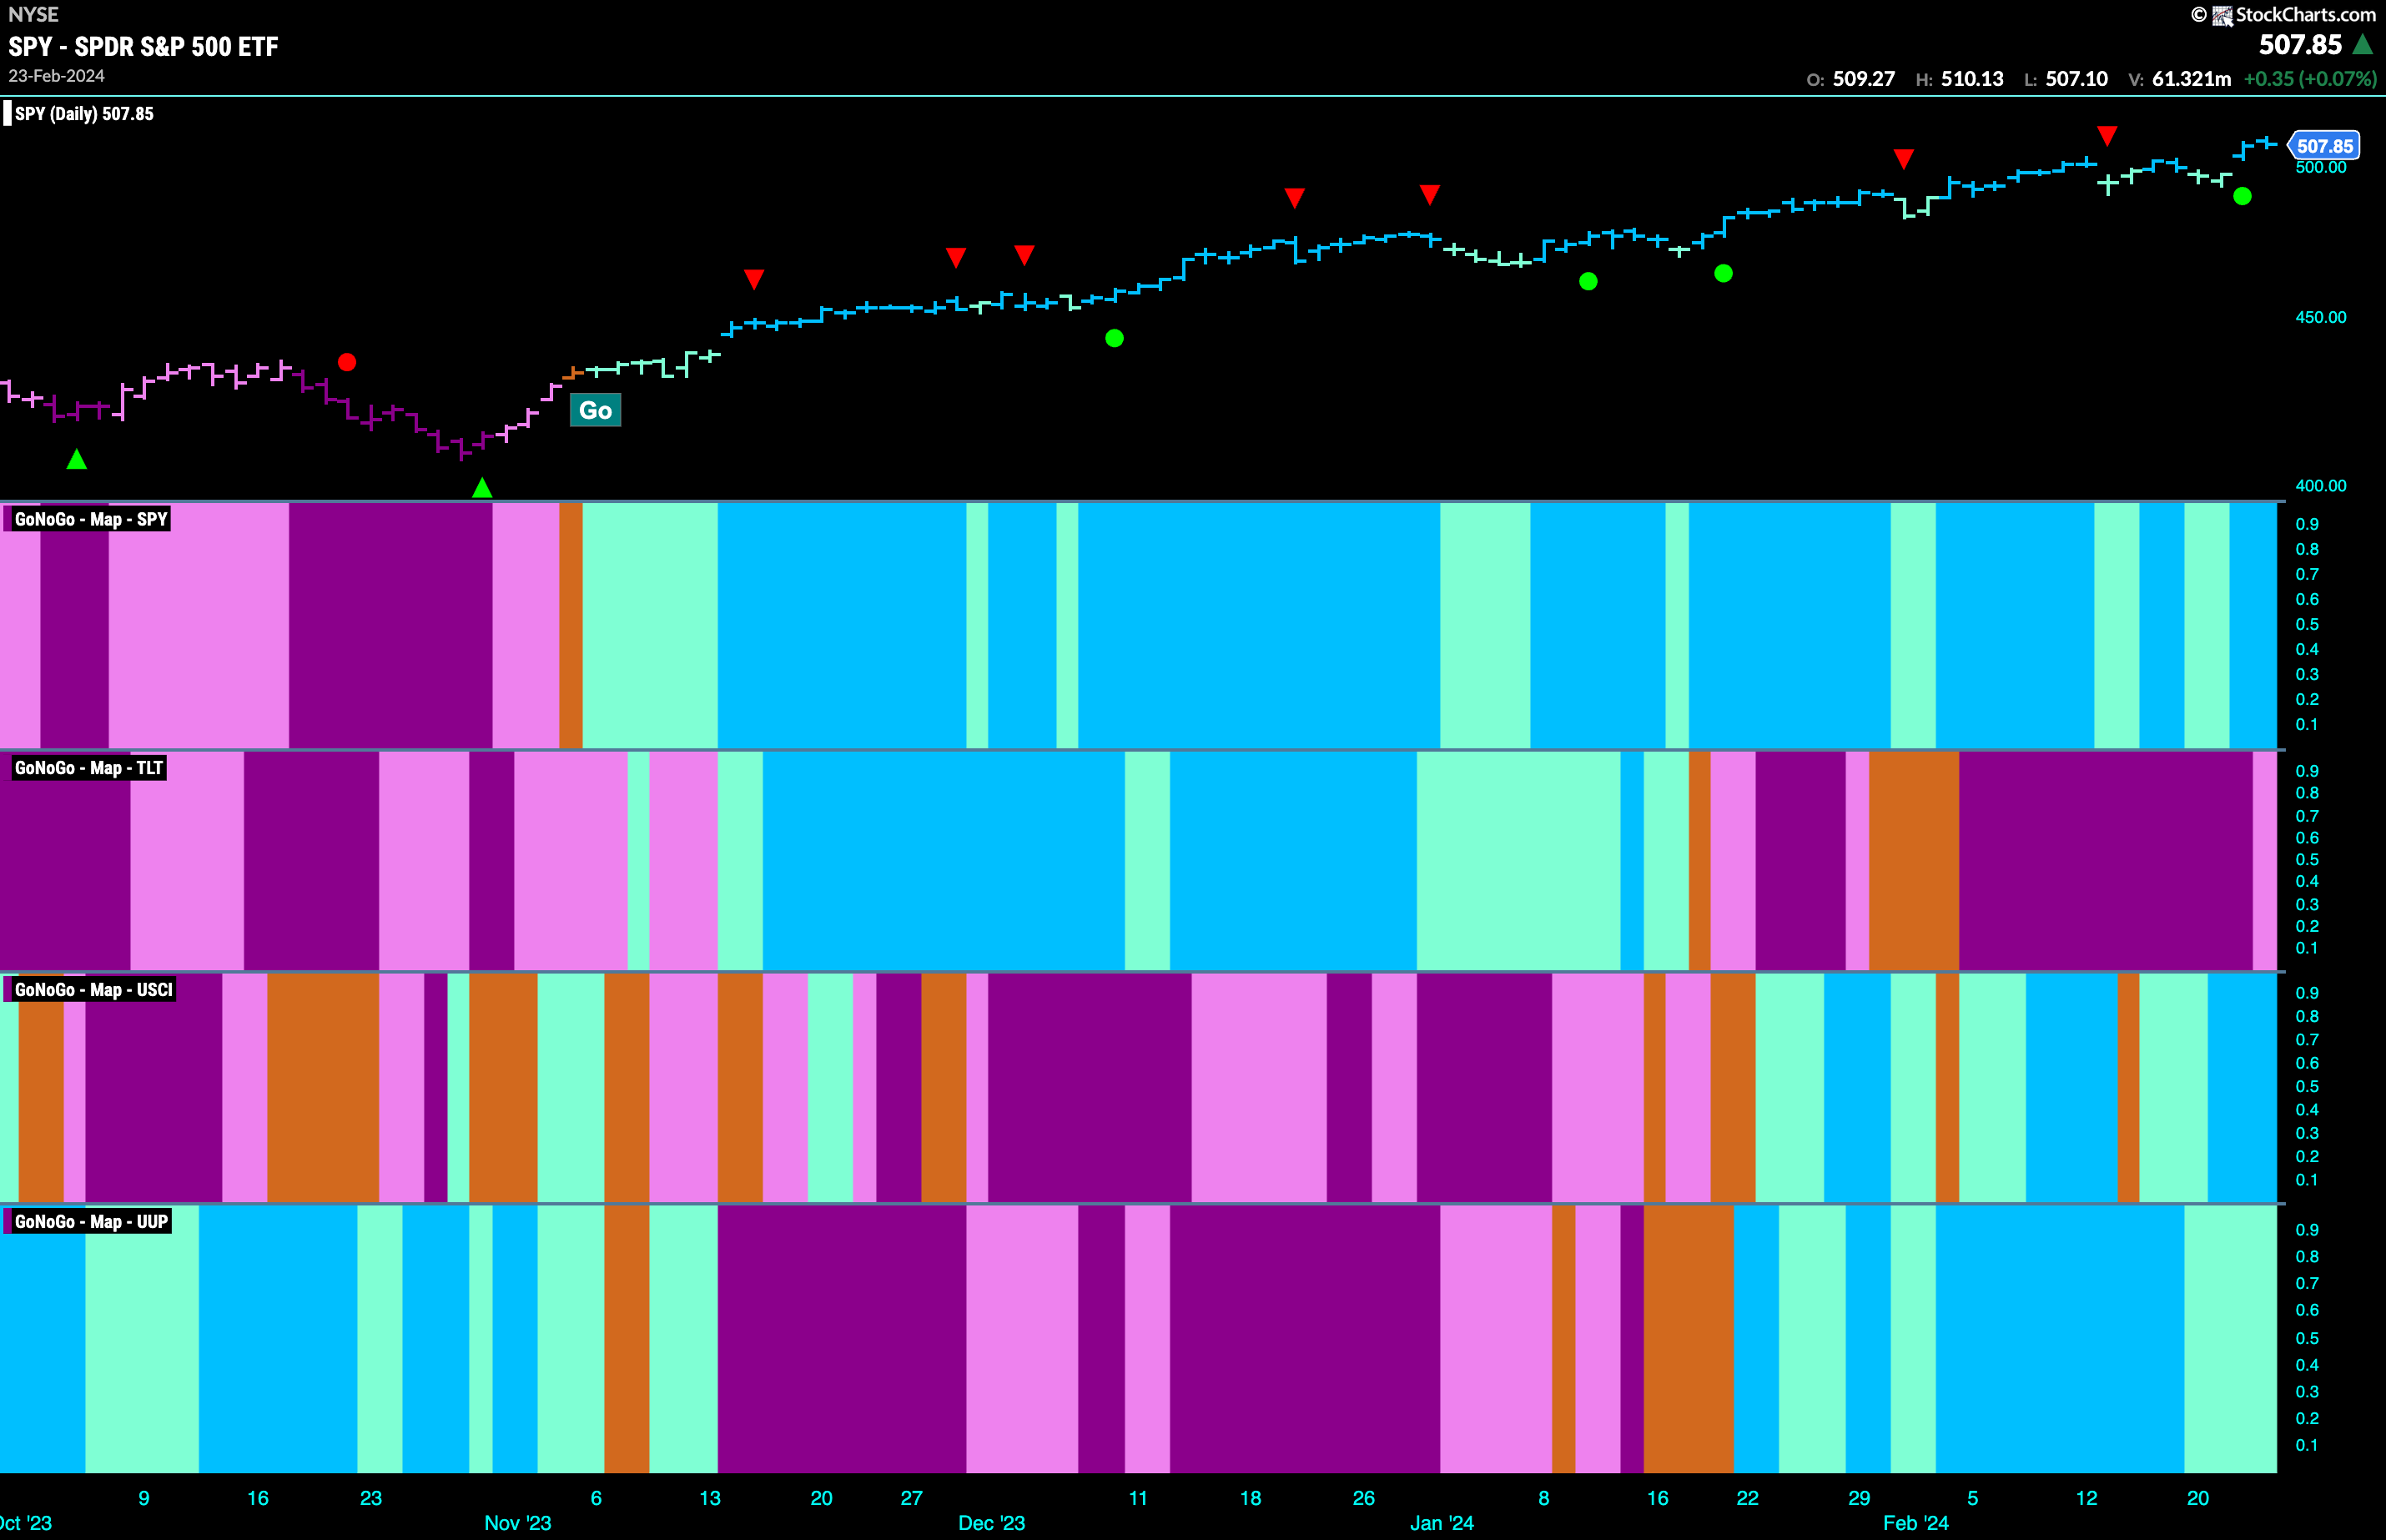
Good morning and welcome to this week’s Flight Path. Equities saw a strong end to the week after falling slightly at the beginning. GoNoGo Trend ended painting strong blue “Go” bars as price hit a new high. Treasury bond prices remained in the “NoGo” trend but we saw a weaker pink bar as trading finished for the week. The U.S. commodity index saw GoNoGo Trend paint stronger blue “Go” bars as this new “Go” persists for now. The dollar was able to maintain “Go” bars but we saw weaker aqua bars for most of the week.
U.S. Equities Hit Another Higher High
This “Go” trend in U.S. equities is proving to be strong, stubbornly moving to new highs each week. We saw a few aqua bars early in the week as price corrected from the last high but as the week went on the market determined it was ready for higher prices. GoNoGo Oscillator fell to test the zero line from above and immediately found support, rallying back into positive territory. With momentum resurgent in the direction of the underlying “Go” trend, price was able to push higher with GoNoGo Trend painting strong blue bars once again.
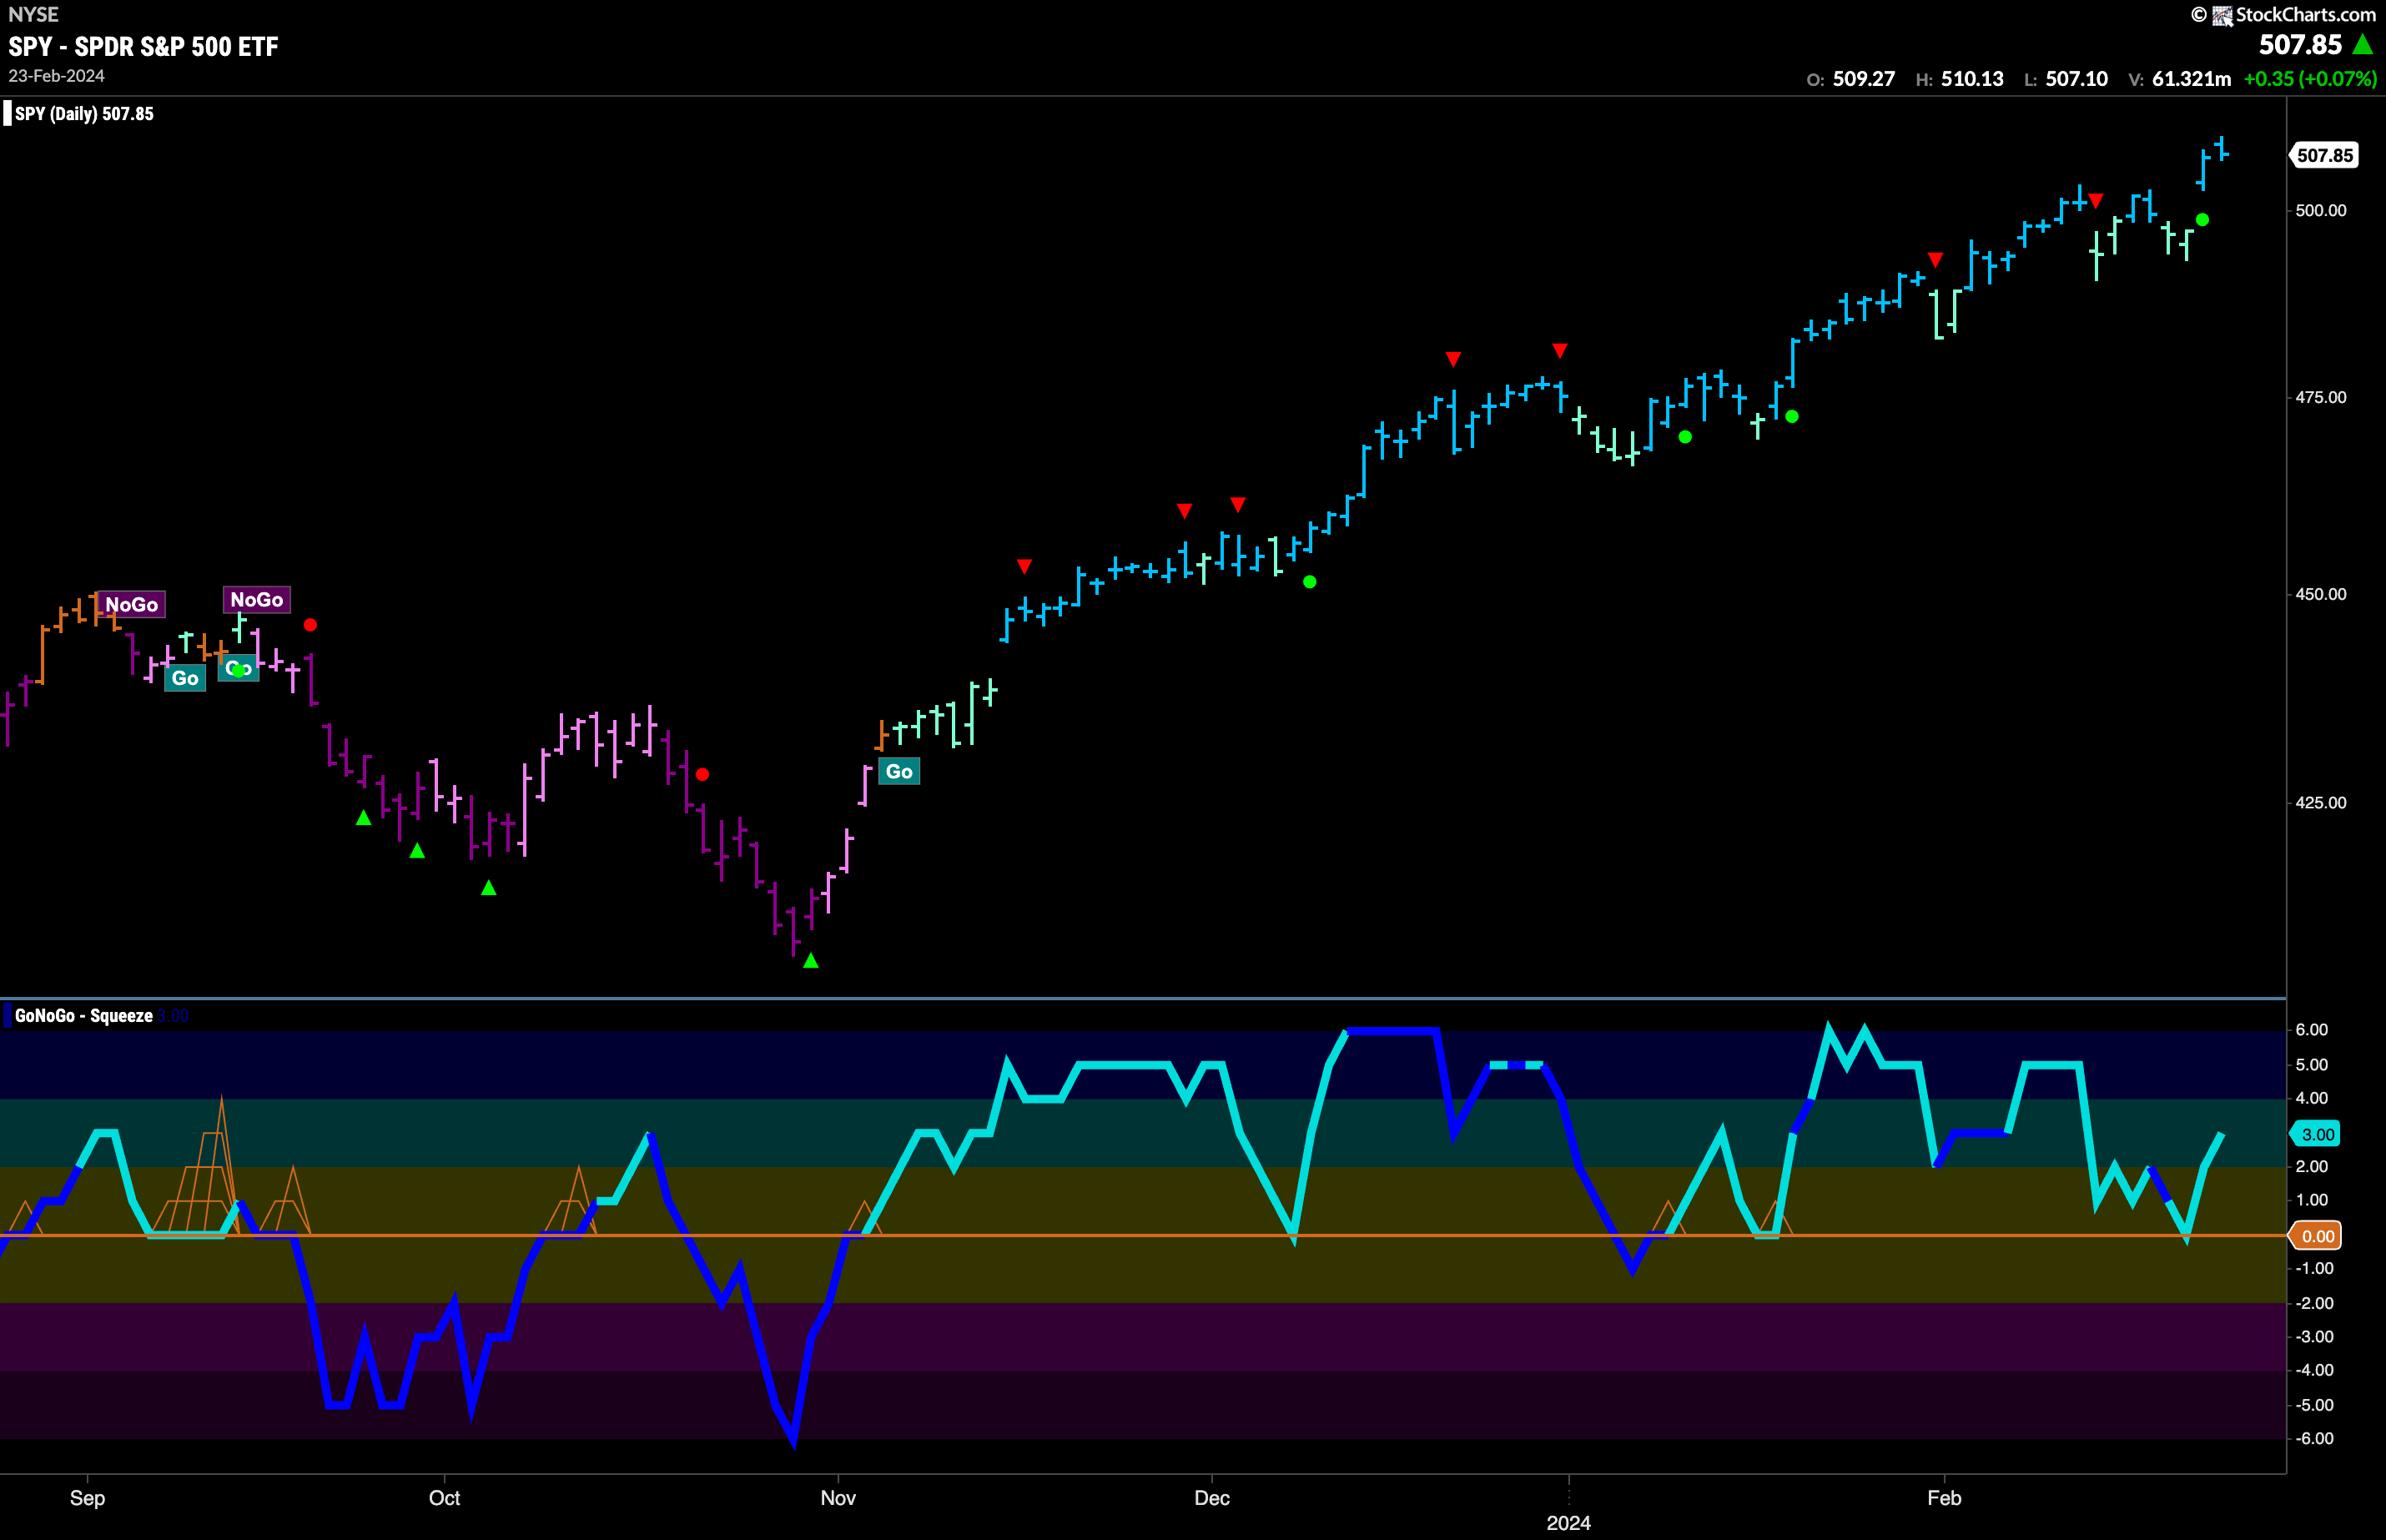
The weekly chart shows just how incredibly strong this “Go” trend has been. Another higher weekly close takes prices further into unchartered territory. It has been several months now since we have seen any weakness in the trend with an uninterrupted string of strong blue “Go” bars stretching back to end of October ’23. GoNoGo Oscillator remains over bought for another week. We will watch to see if there is any cooling of momentum in the coming few weeks.
Rates in Strong “Go” Trend
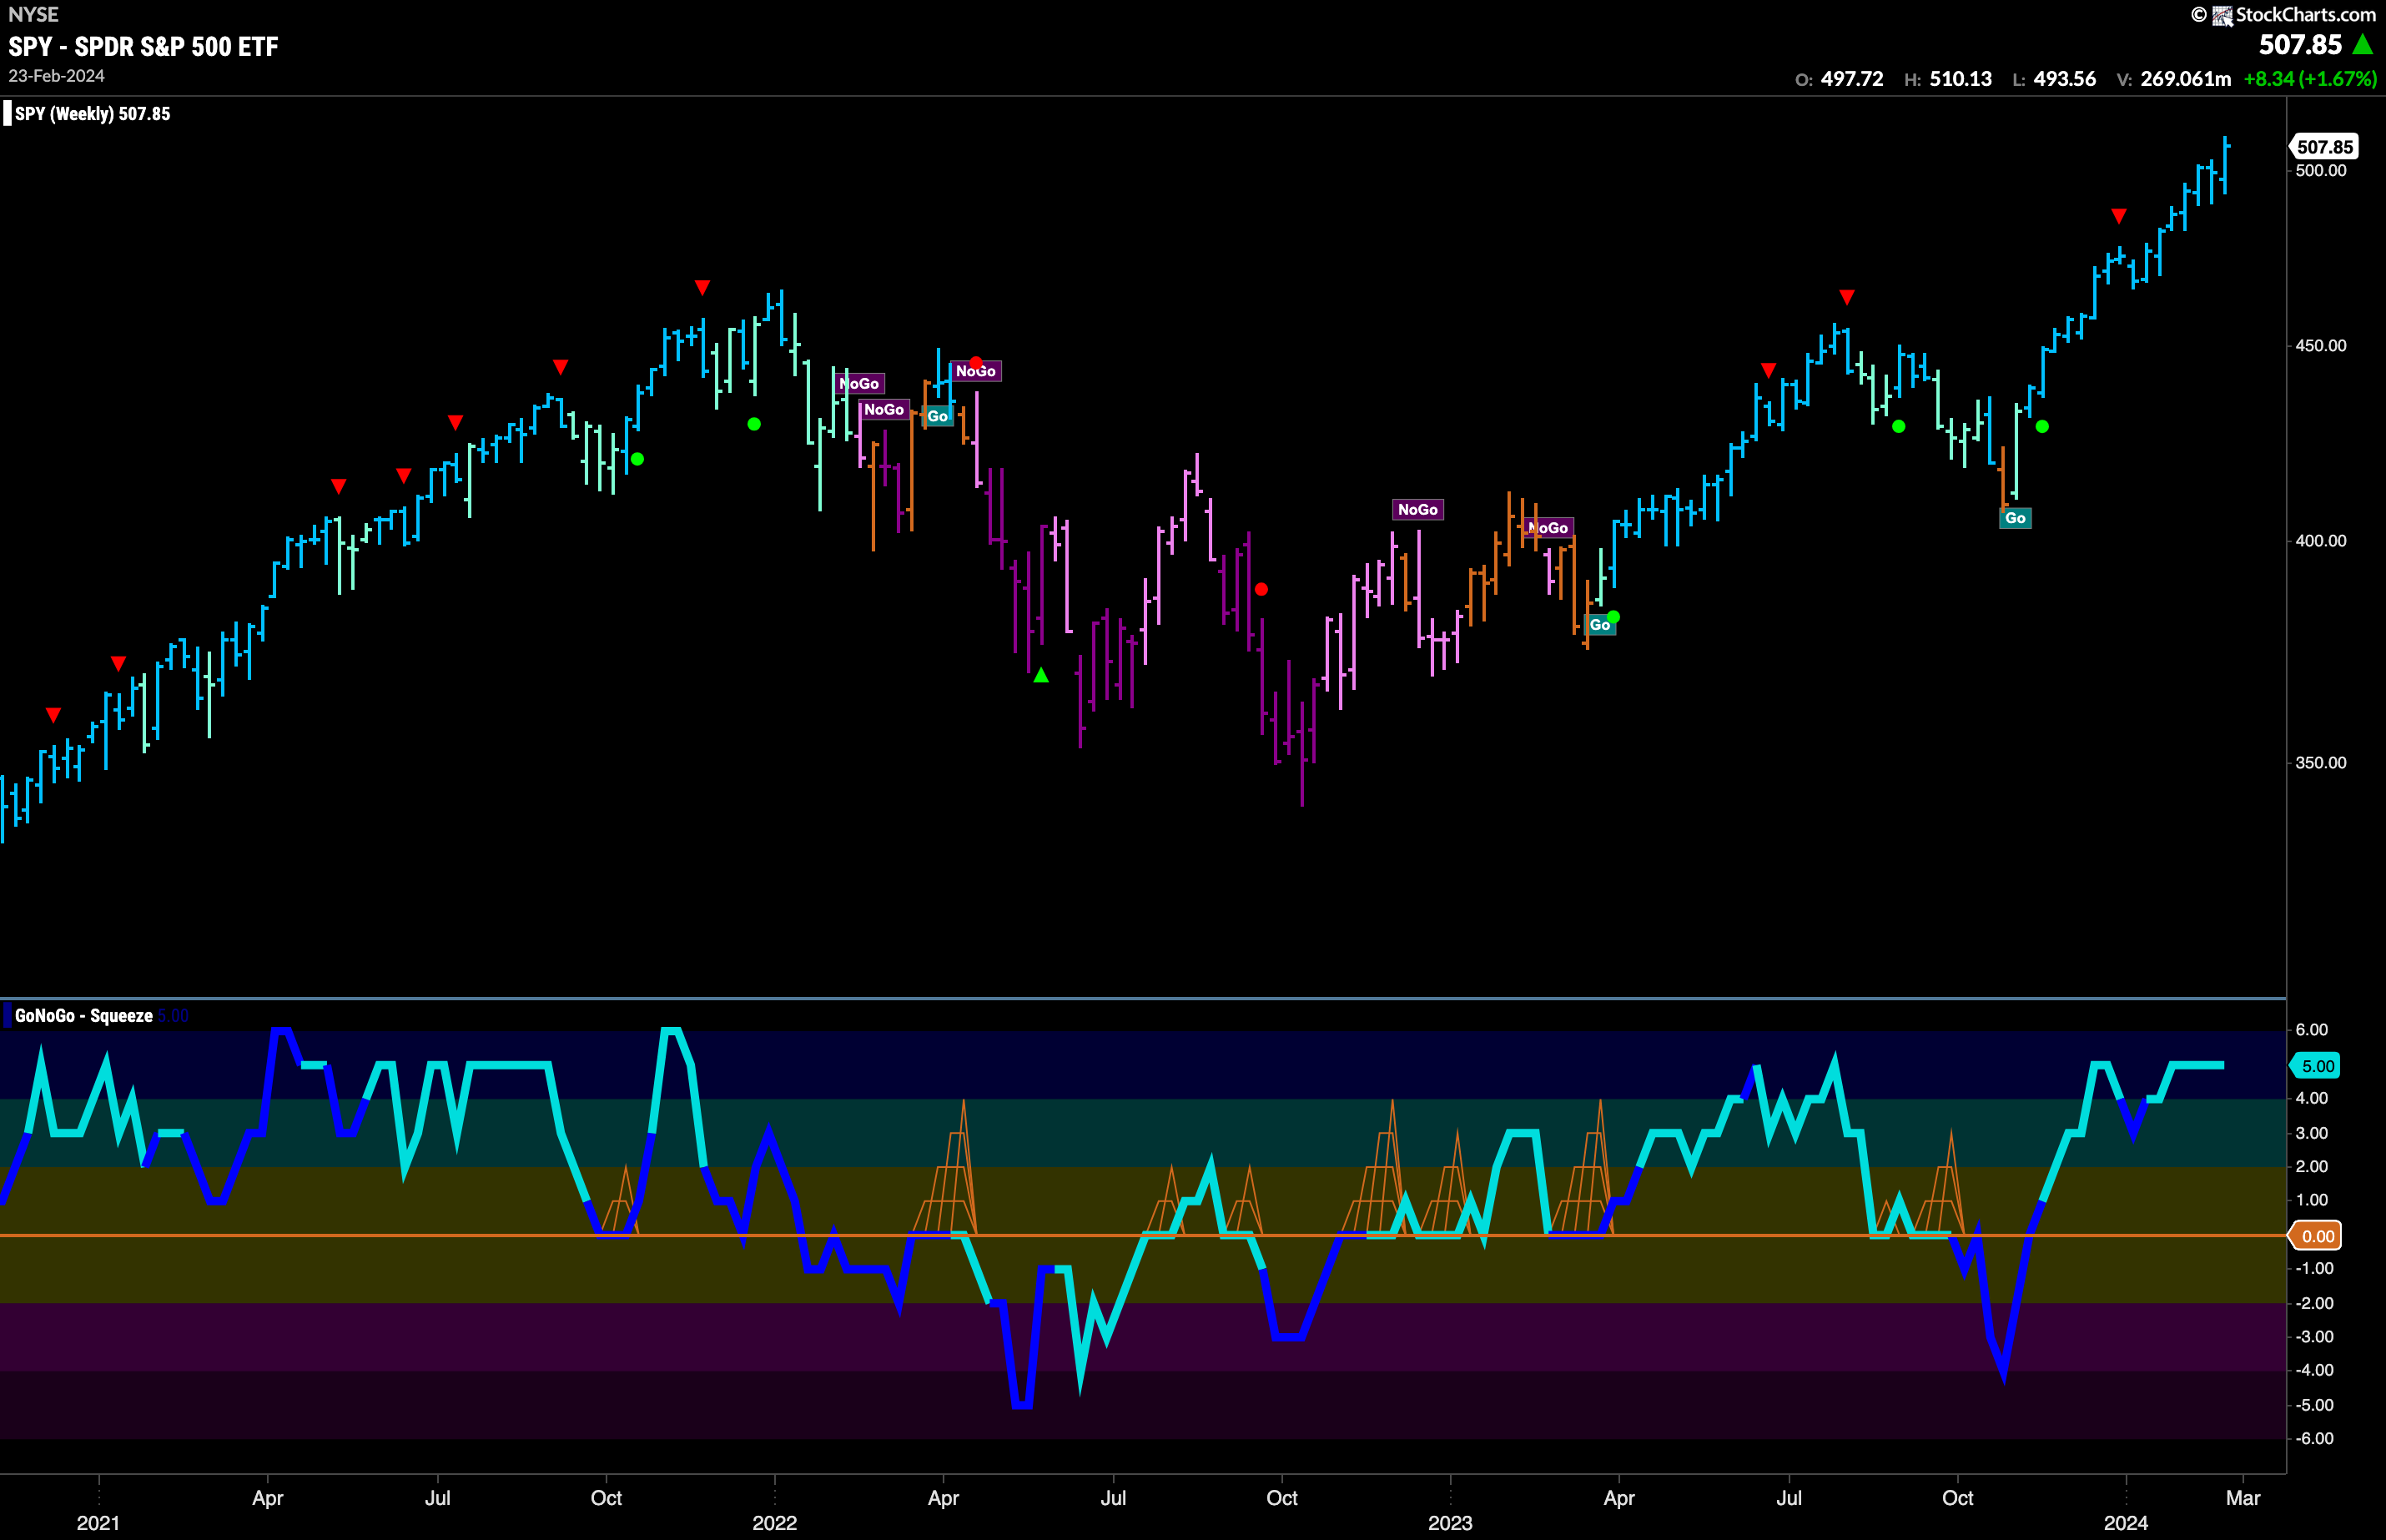
Treasury rates saw continued strength this week as GoNoGo Trend indicator painted a string of strong blue bars. Price consolidated at higher prices and we are now several weeks into a new “Go” trend. After breaking through the zero line earlier this month and then quickly fiding support at that level, GoNoGo Oscillator has been in positive territory but has not yet moved into overbought territory. Now, at a value of 2, there seems to be some room for this “Go” trend to run.
The Dollar is at an Inflection Point
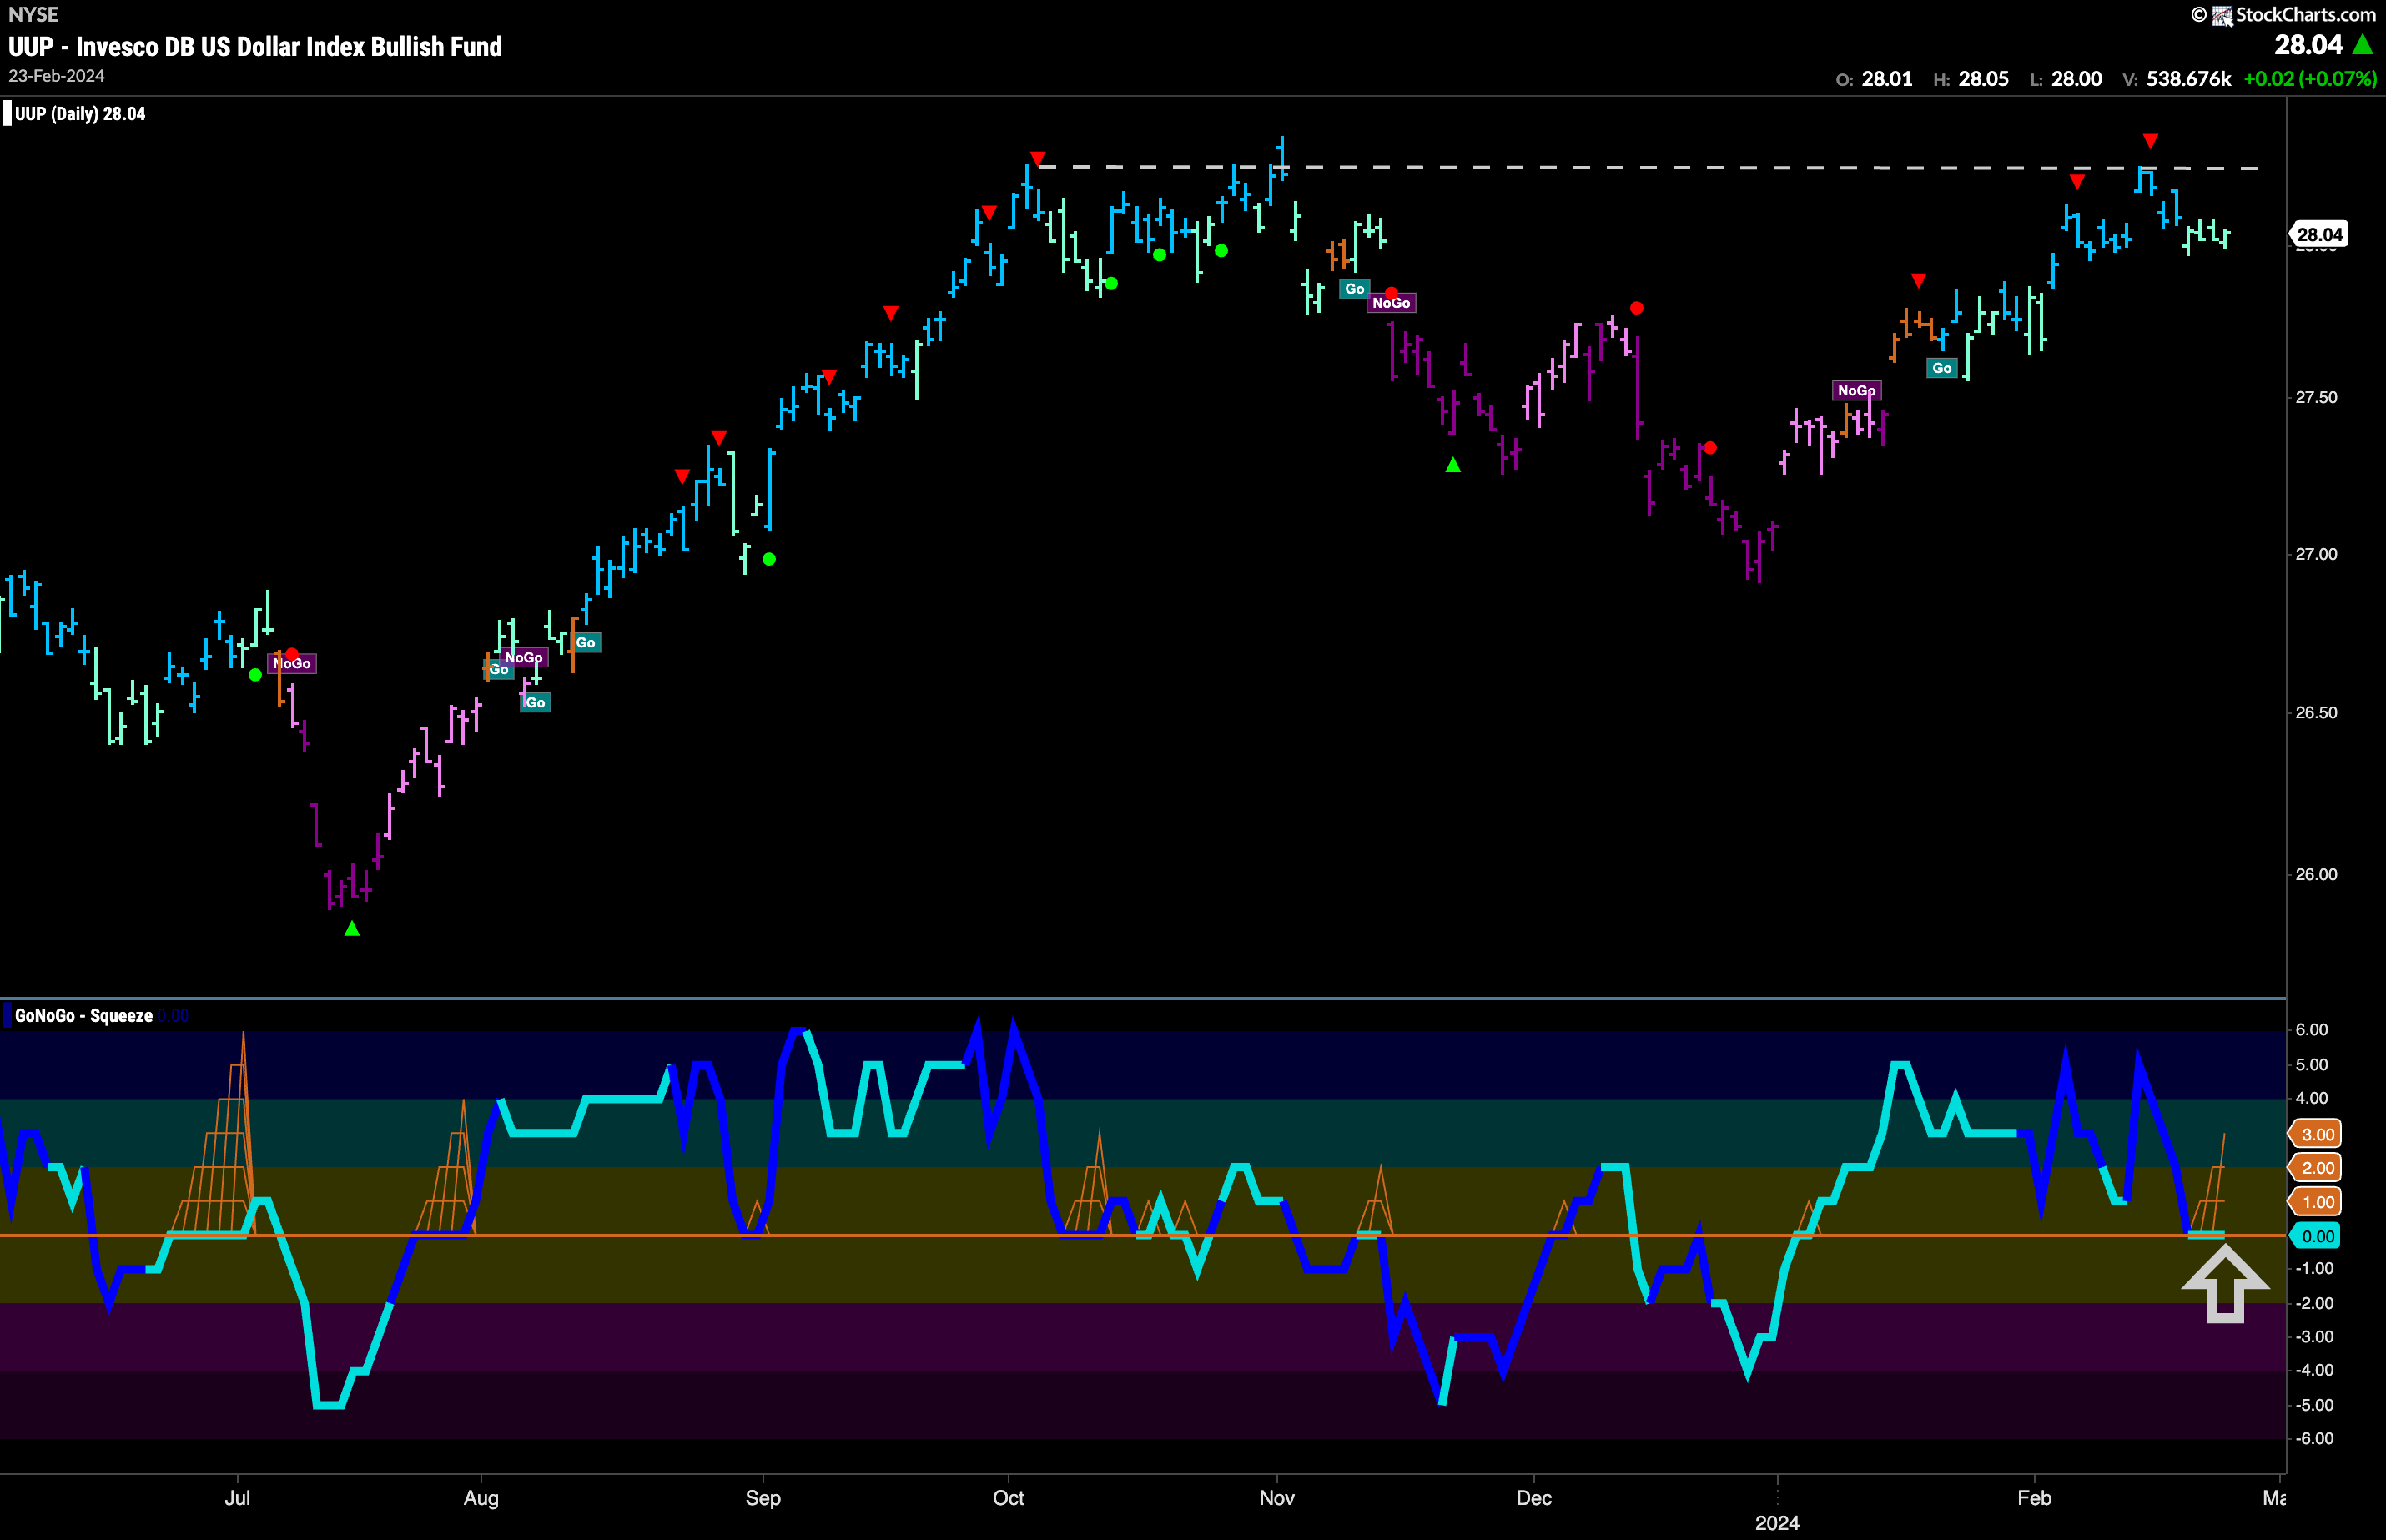
The chart below shows that the “Go” trend remained in place this week albeit painting a majority of weaker aqua bars. This comes after price hit resistance last week and we saw a Go Countertrend Correction Icon (red arrow) indicating that price would struggle to go higher in the short term. Indeed, price fell from those levels and we saw the indicator then move to paint weaker “Go” bars. GoNoGo Oscillator has fallen to test the zero line from above and we see that it has remained at that level for a couple of bars and a GoNoGo Squeeze is starting to build. We will look to see if the oscillator finds support at zero, and if it does we will then expect price to make an attack on a new high.
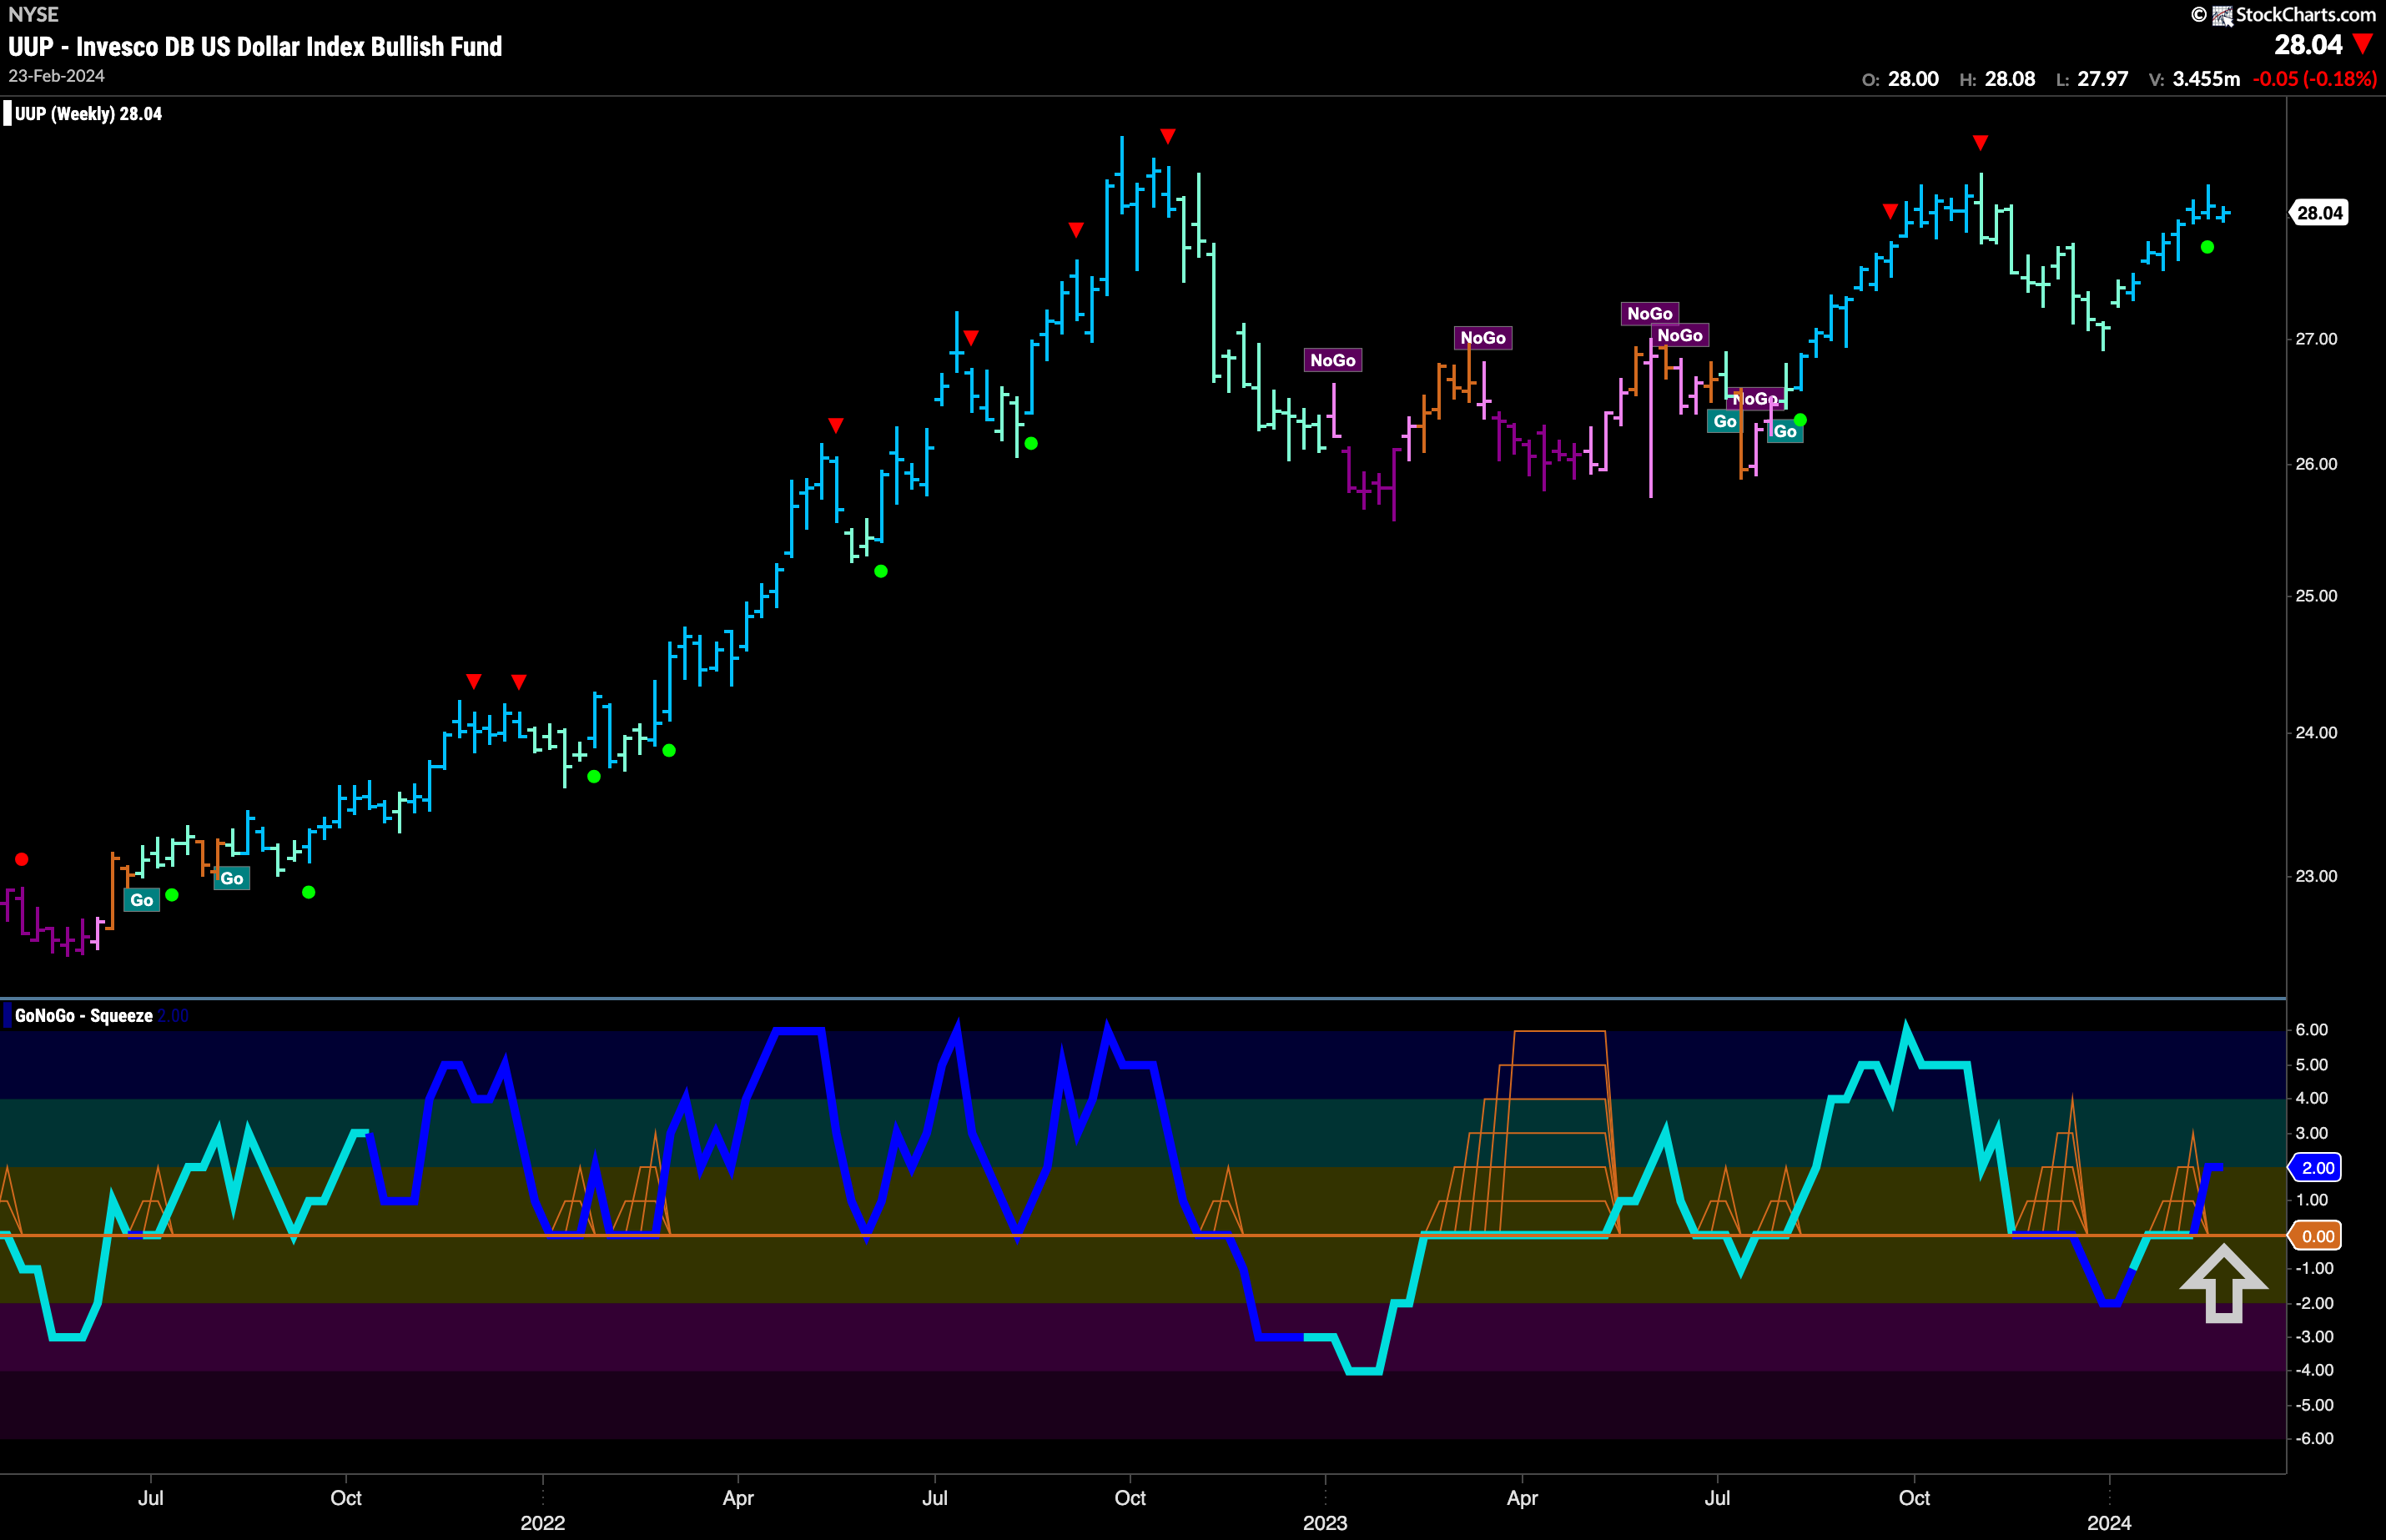
The longer term chart shows signs of health. As GoNoGo Trend continues to paint strong blue bars we see that GoNoGo Oscillator has broken out of a small GoNoGo Squeeze into positive territory and on heavy volume. This tells us that momentum is surging once again in the direction of the underlying “Go” trend and we see a Go Trend Continuation Icon (green circle) on the price chart. We will look to see if this gives price the push it needs to move to new highs.
Oil “Go” Trend Shows Weakness
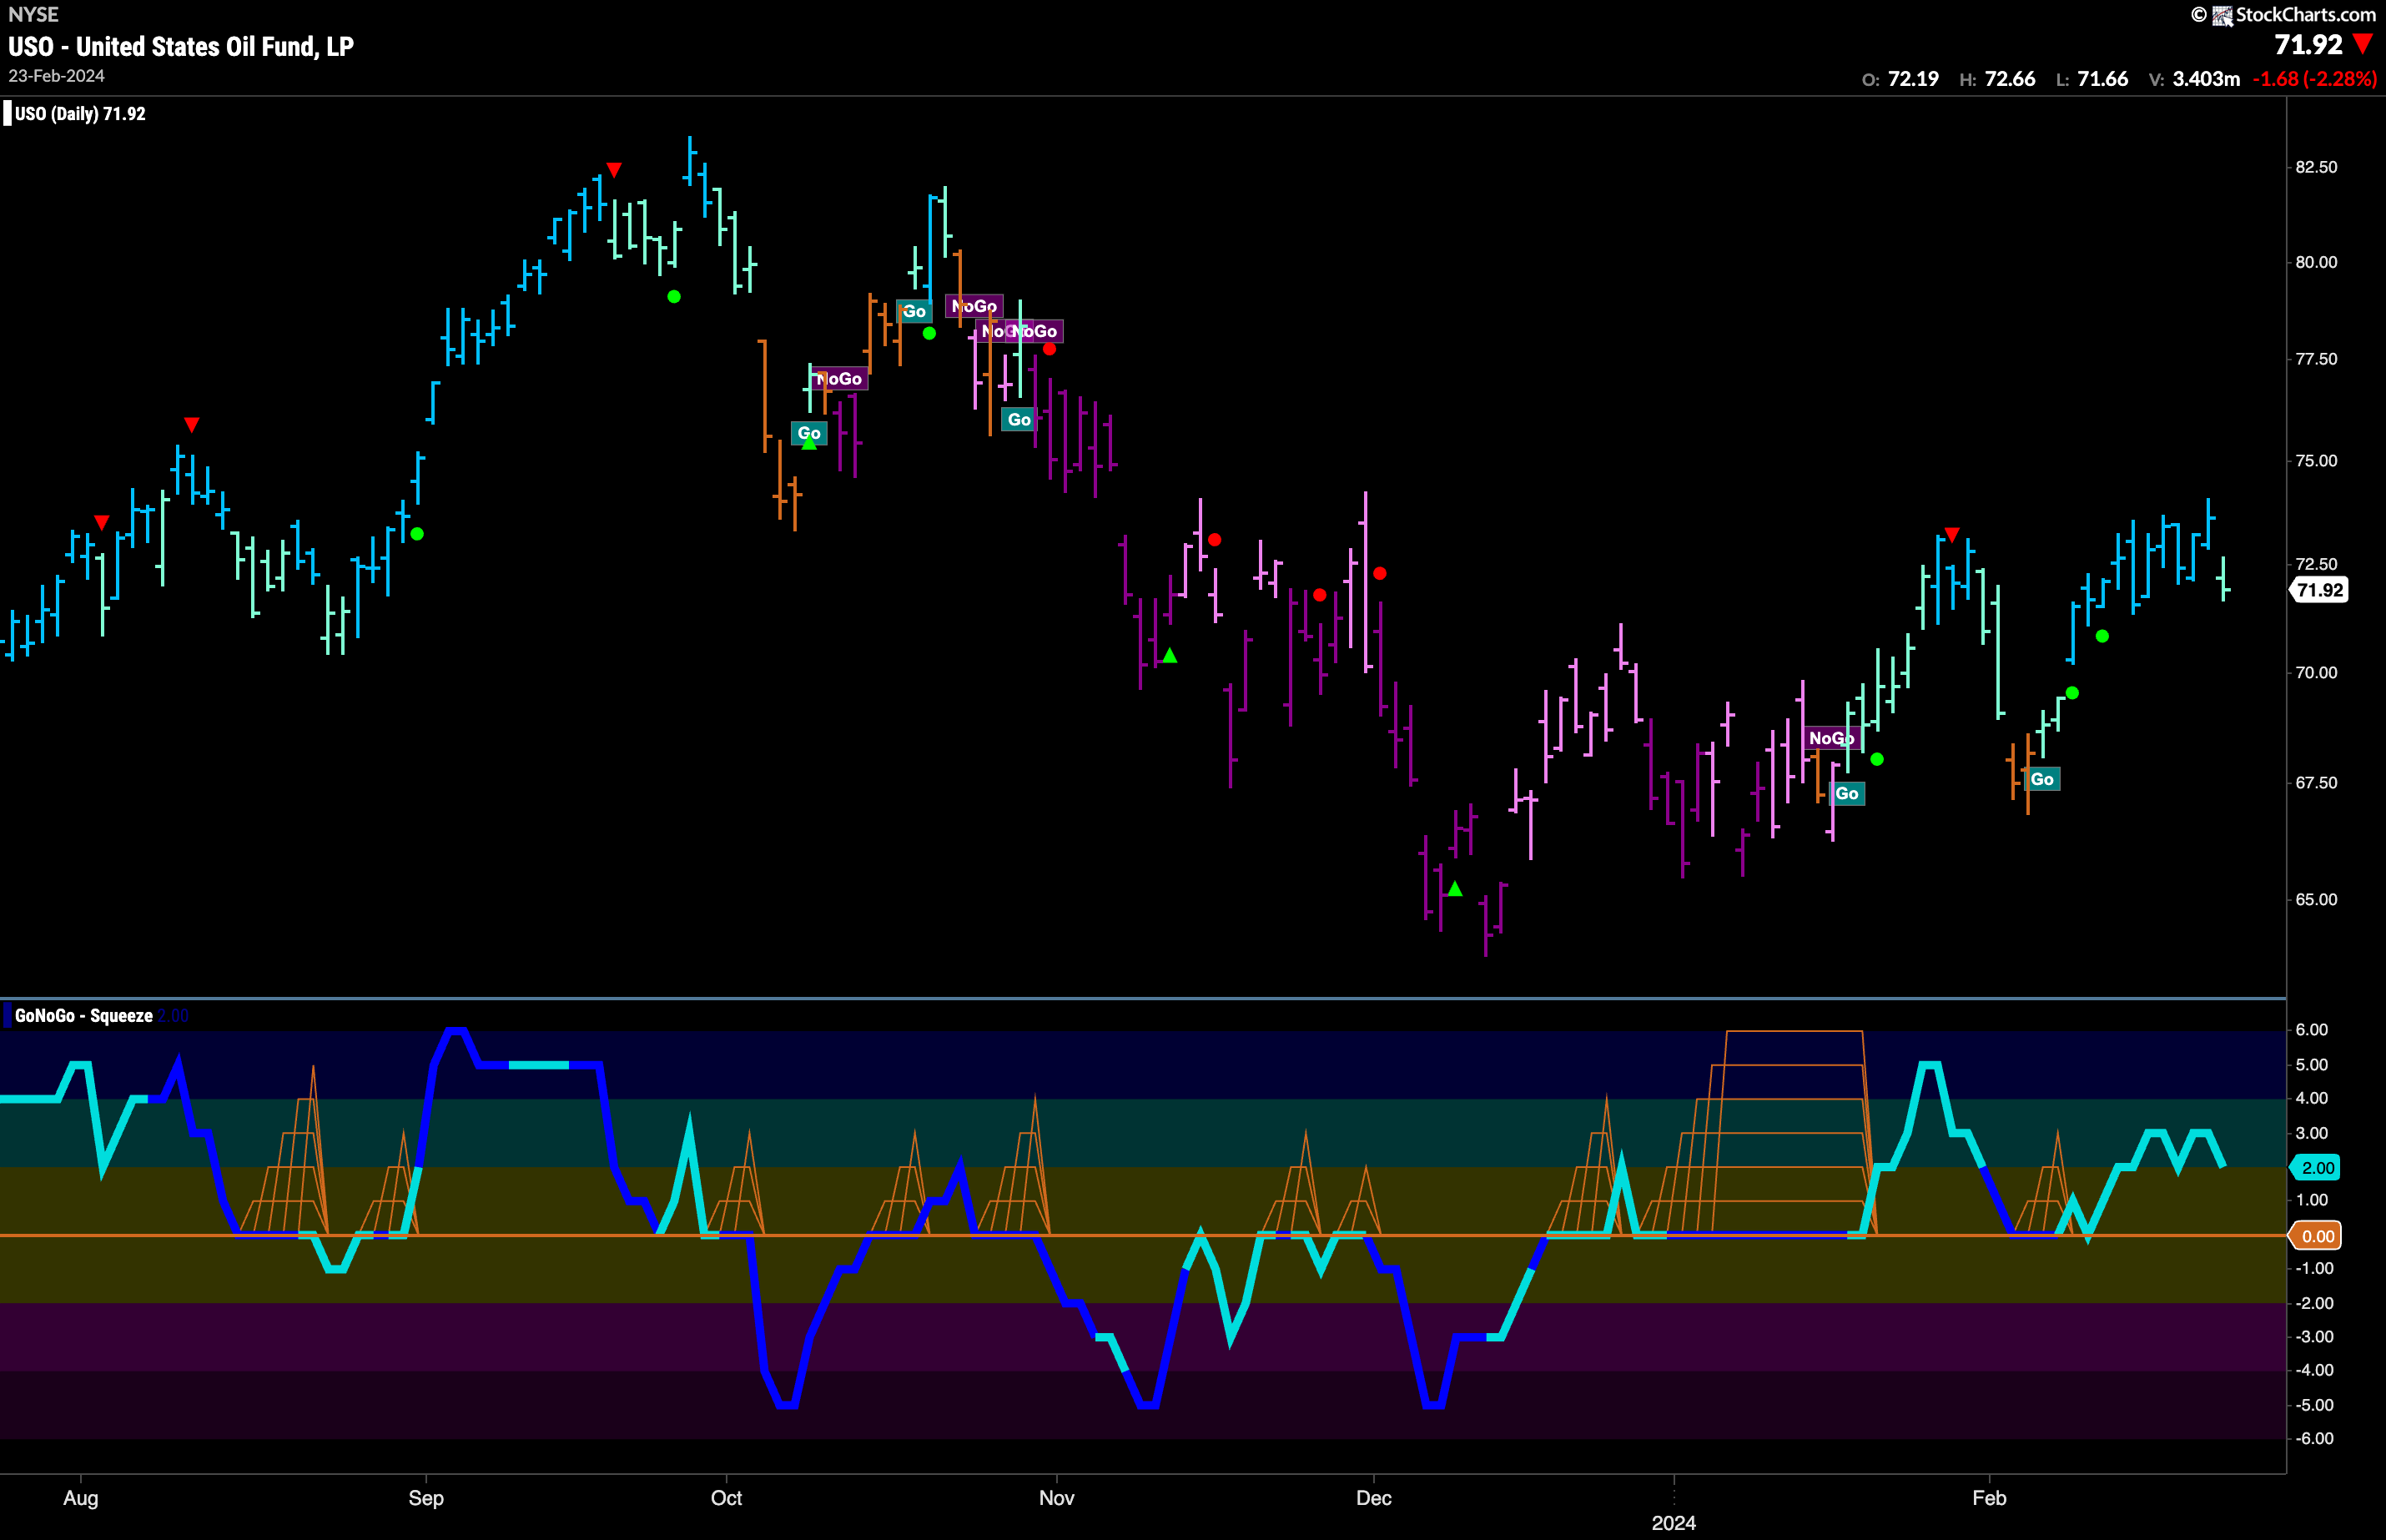
GoNoGo Trend painted an aqua “Go” bar at the end of last week. This comes after price appeared to fail to move past prior highs from January. Having said that, the “Go” trend is still in place and GoNoGo Oscillator is in positive territory but not overbought at a value of 2. We will watch to see if the oscillator finds support should it fall to the zero line. If it does, and remains in positive territory then we would expect price to make another attempt to move higher.
Gold Continues to Chop Around
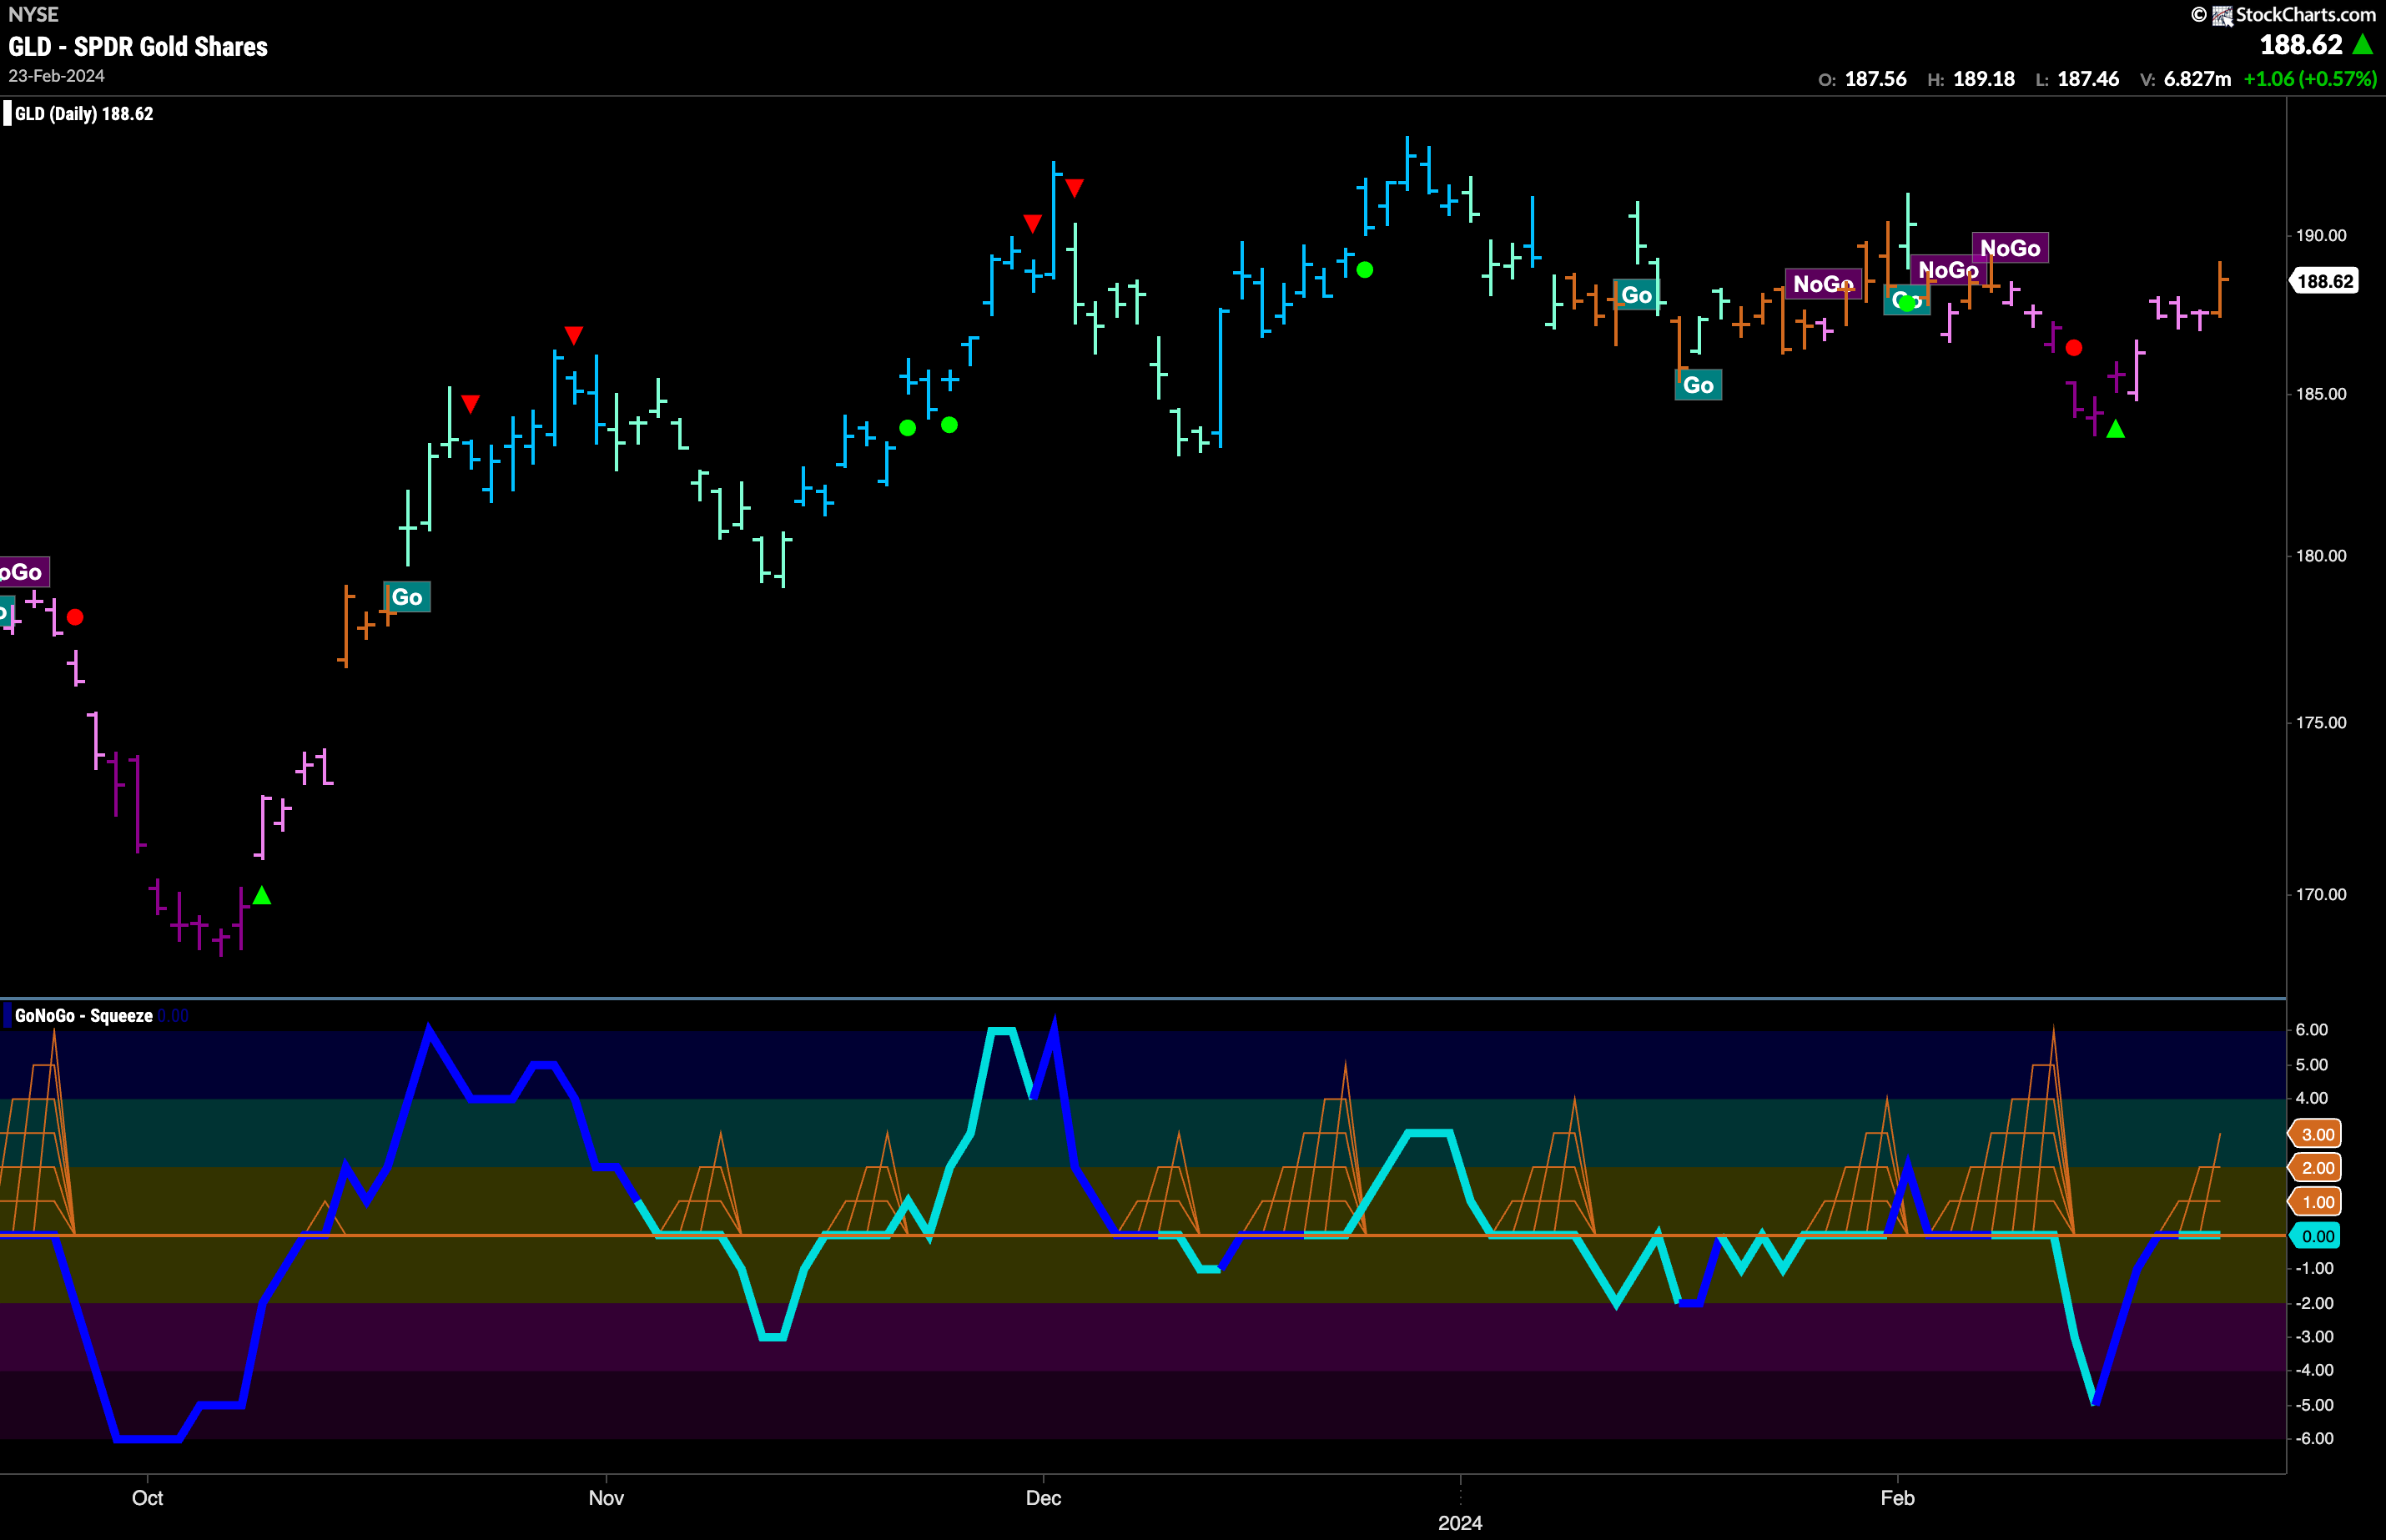
Gold is proving to be difficult to understand this year. GoNoGo Trend returns to paint an amber “Go Fish” bar. The precious metal has seemed comfortable with uncertainty this year and after a quick foray into “NoGo” territory ended last week with an amber “Go Fish” bar. GoNoGo Oscillator spend several bars at the zero line yet again and so we see the beginnings of a GoNoGo Squeeze building. It will be important to see in which direction the oscillator moves out of this GoNoGo Squeeze. A clear move away from the zero line will help determine price’s next direction.
Sector RelMap
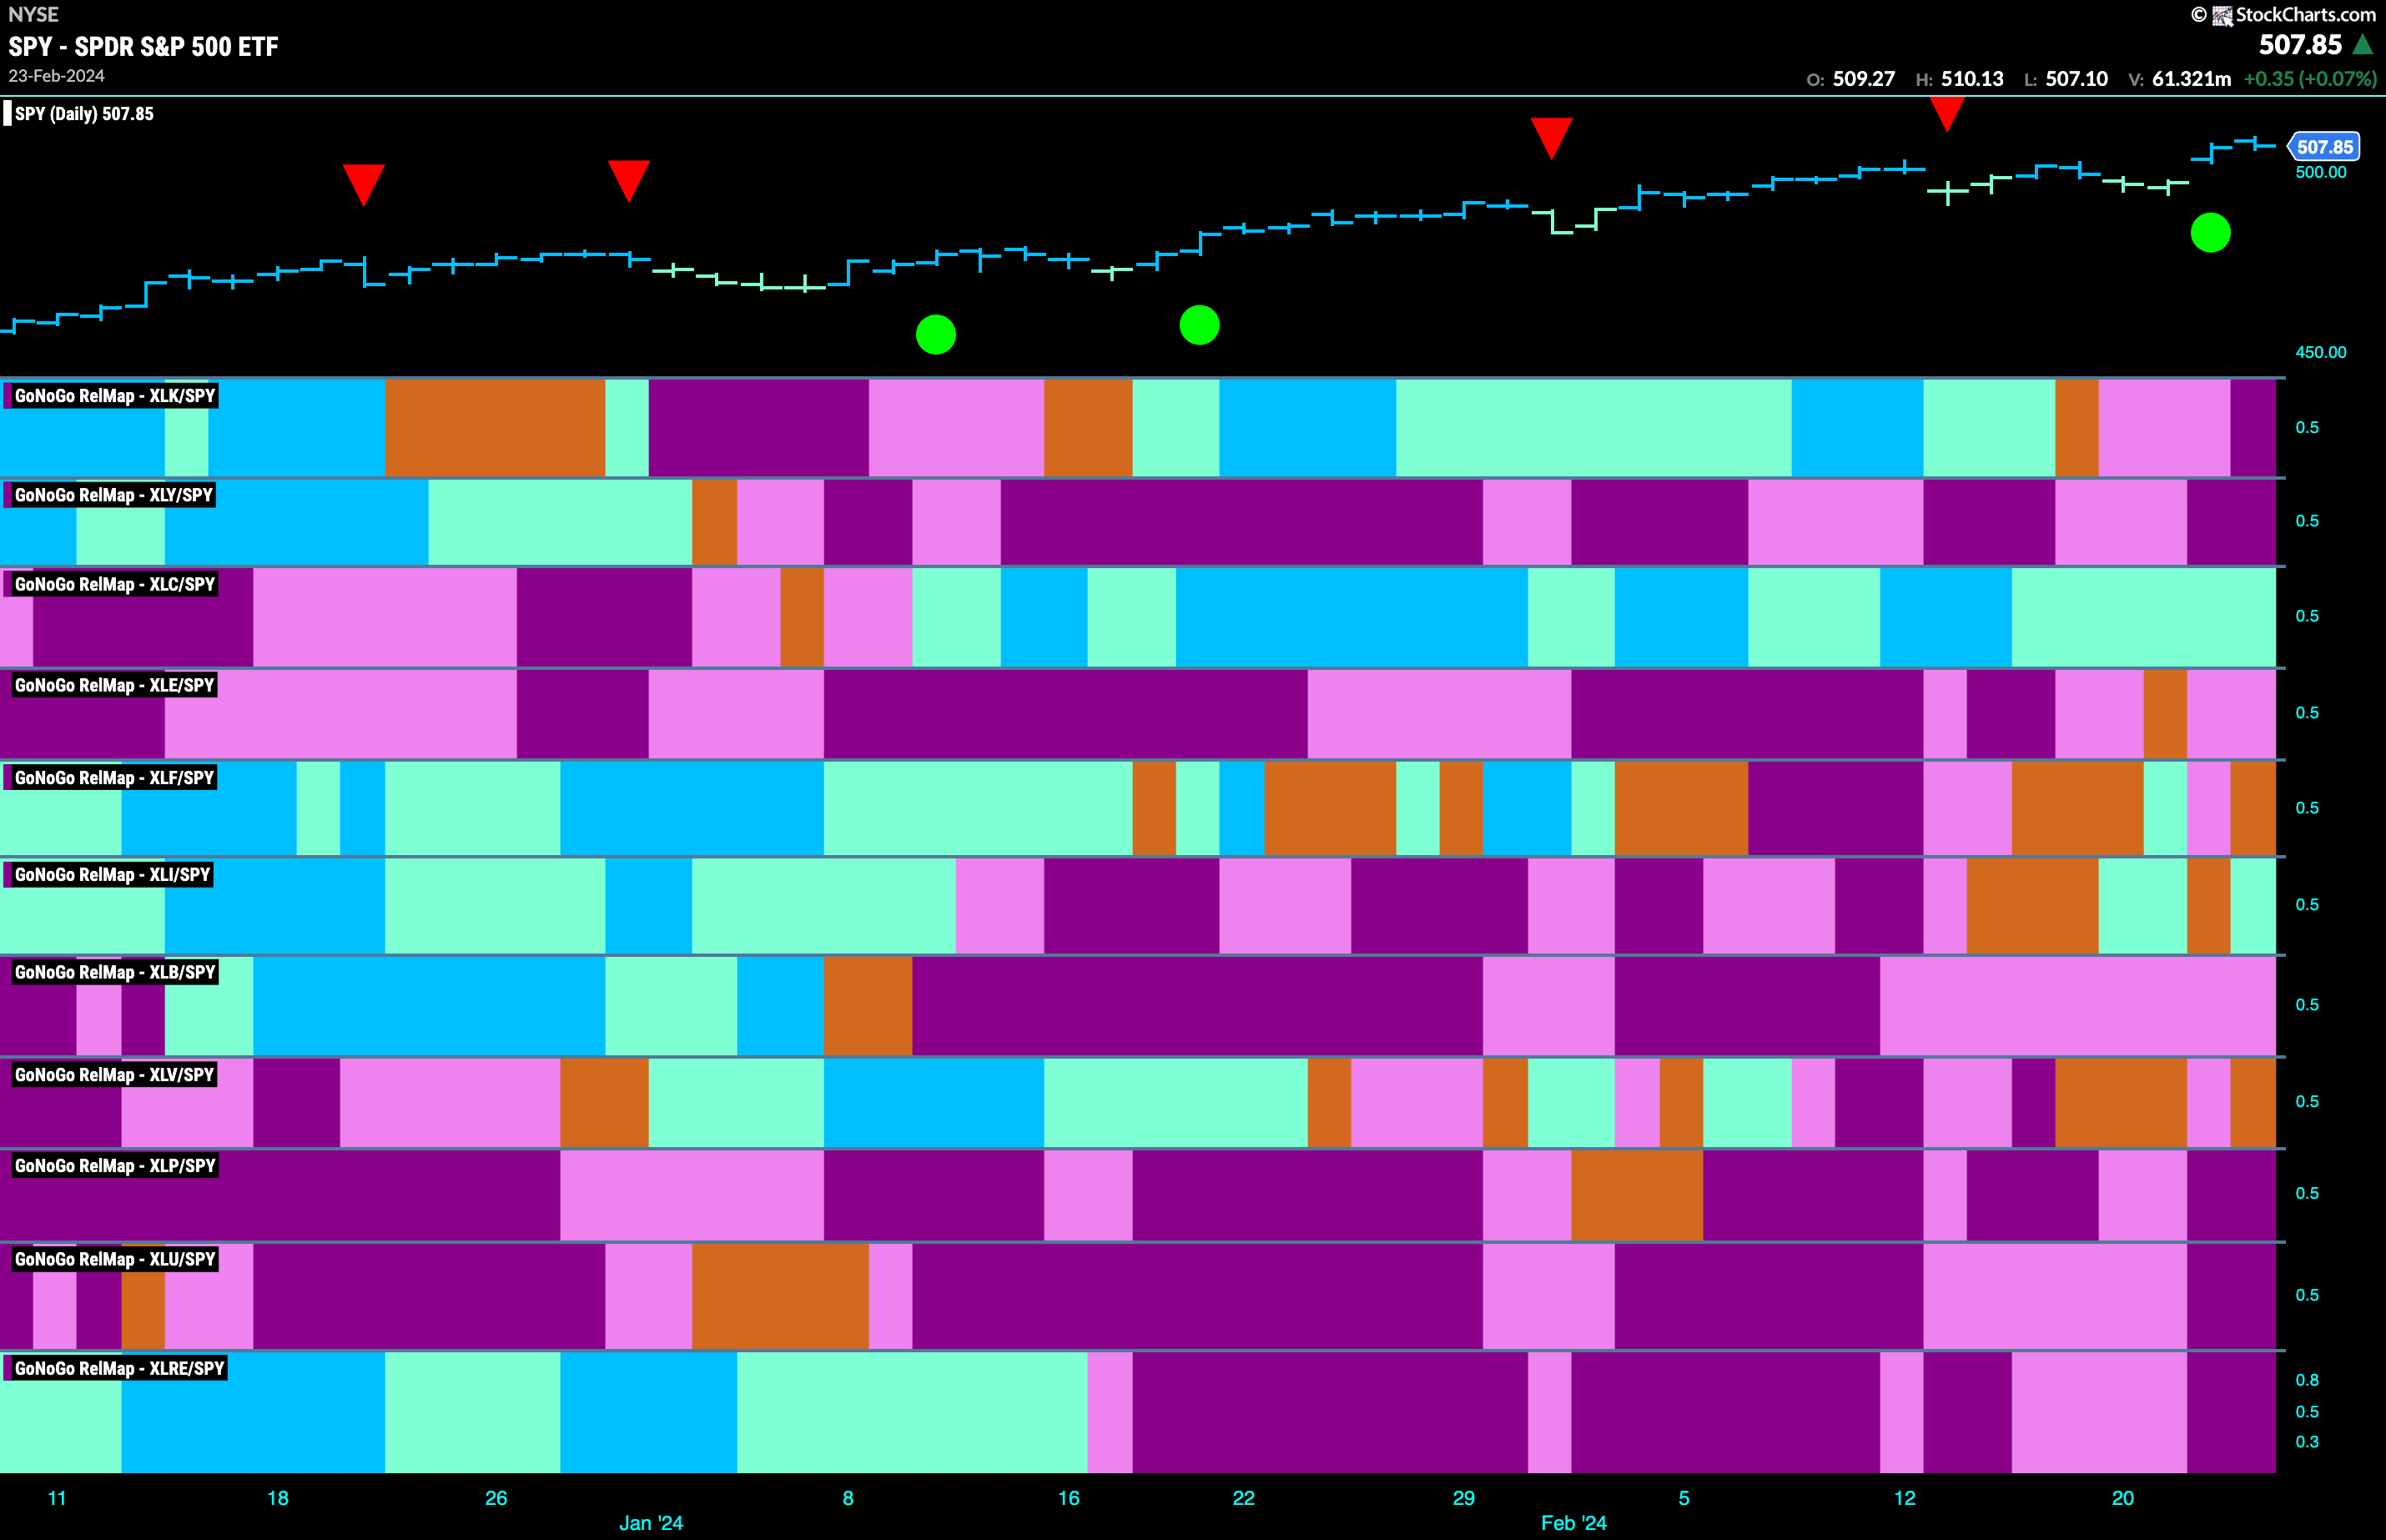
Below is the GoNoGo Sector RelMap. This GoNoGo RelMap applies the GoNoGo Trend to the relative strength ratios of the sectors to the base index. Looking at this map, we can quickly see where the relative outperformance is coming from as well as which sectors are lagging on a relative basis. Only 2 sectors are outperforming the base index this week. $XLC, and $XLI are painting relative “Go” bars.
$XLI Looking Strong in “Go” Tremd
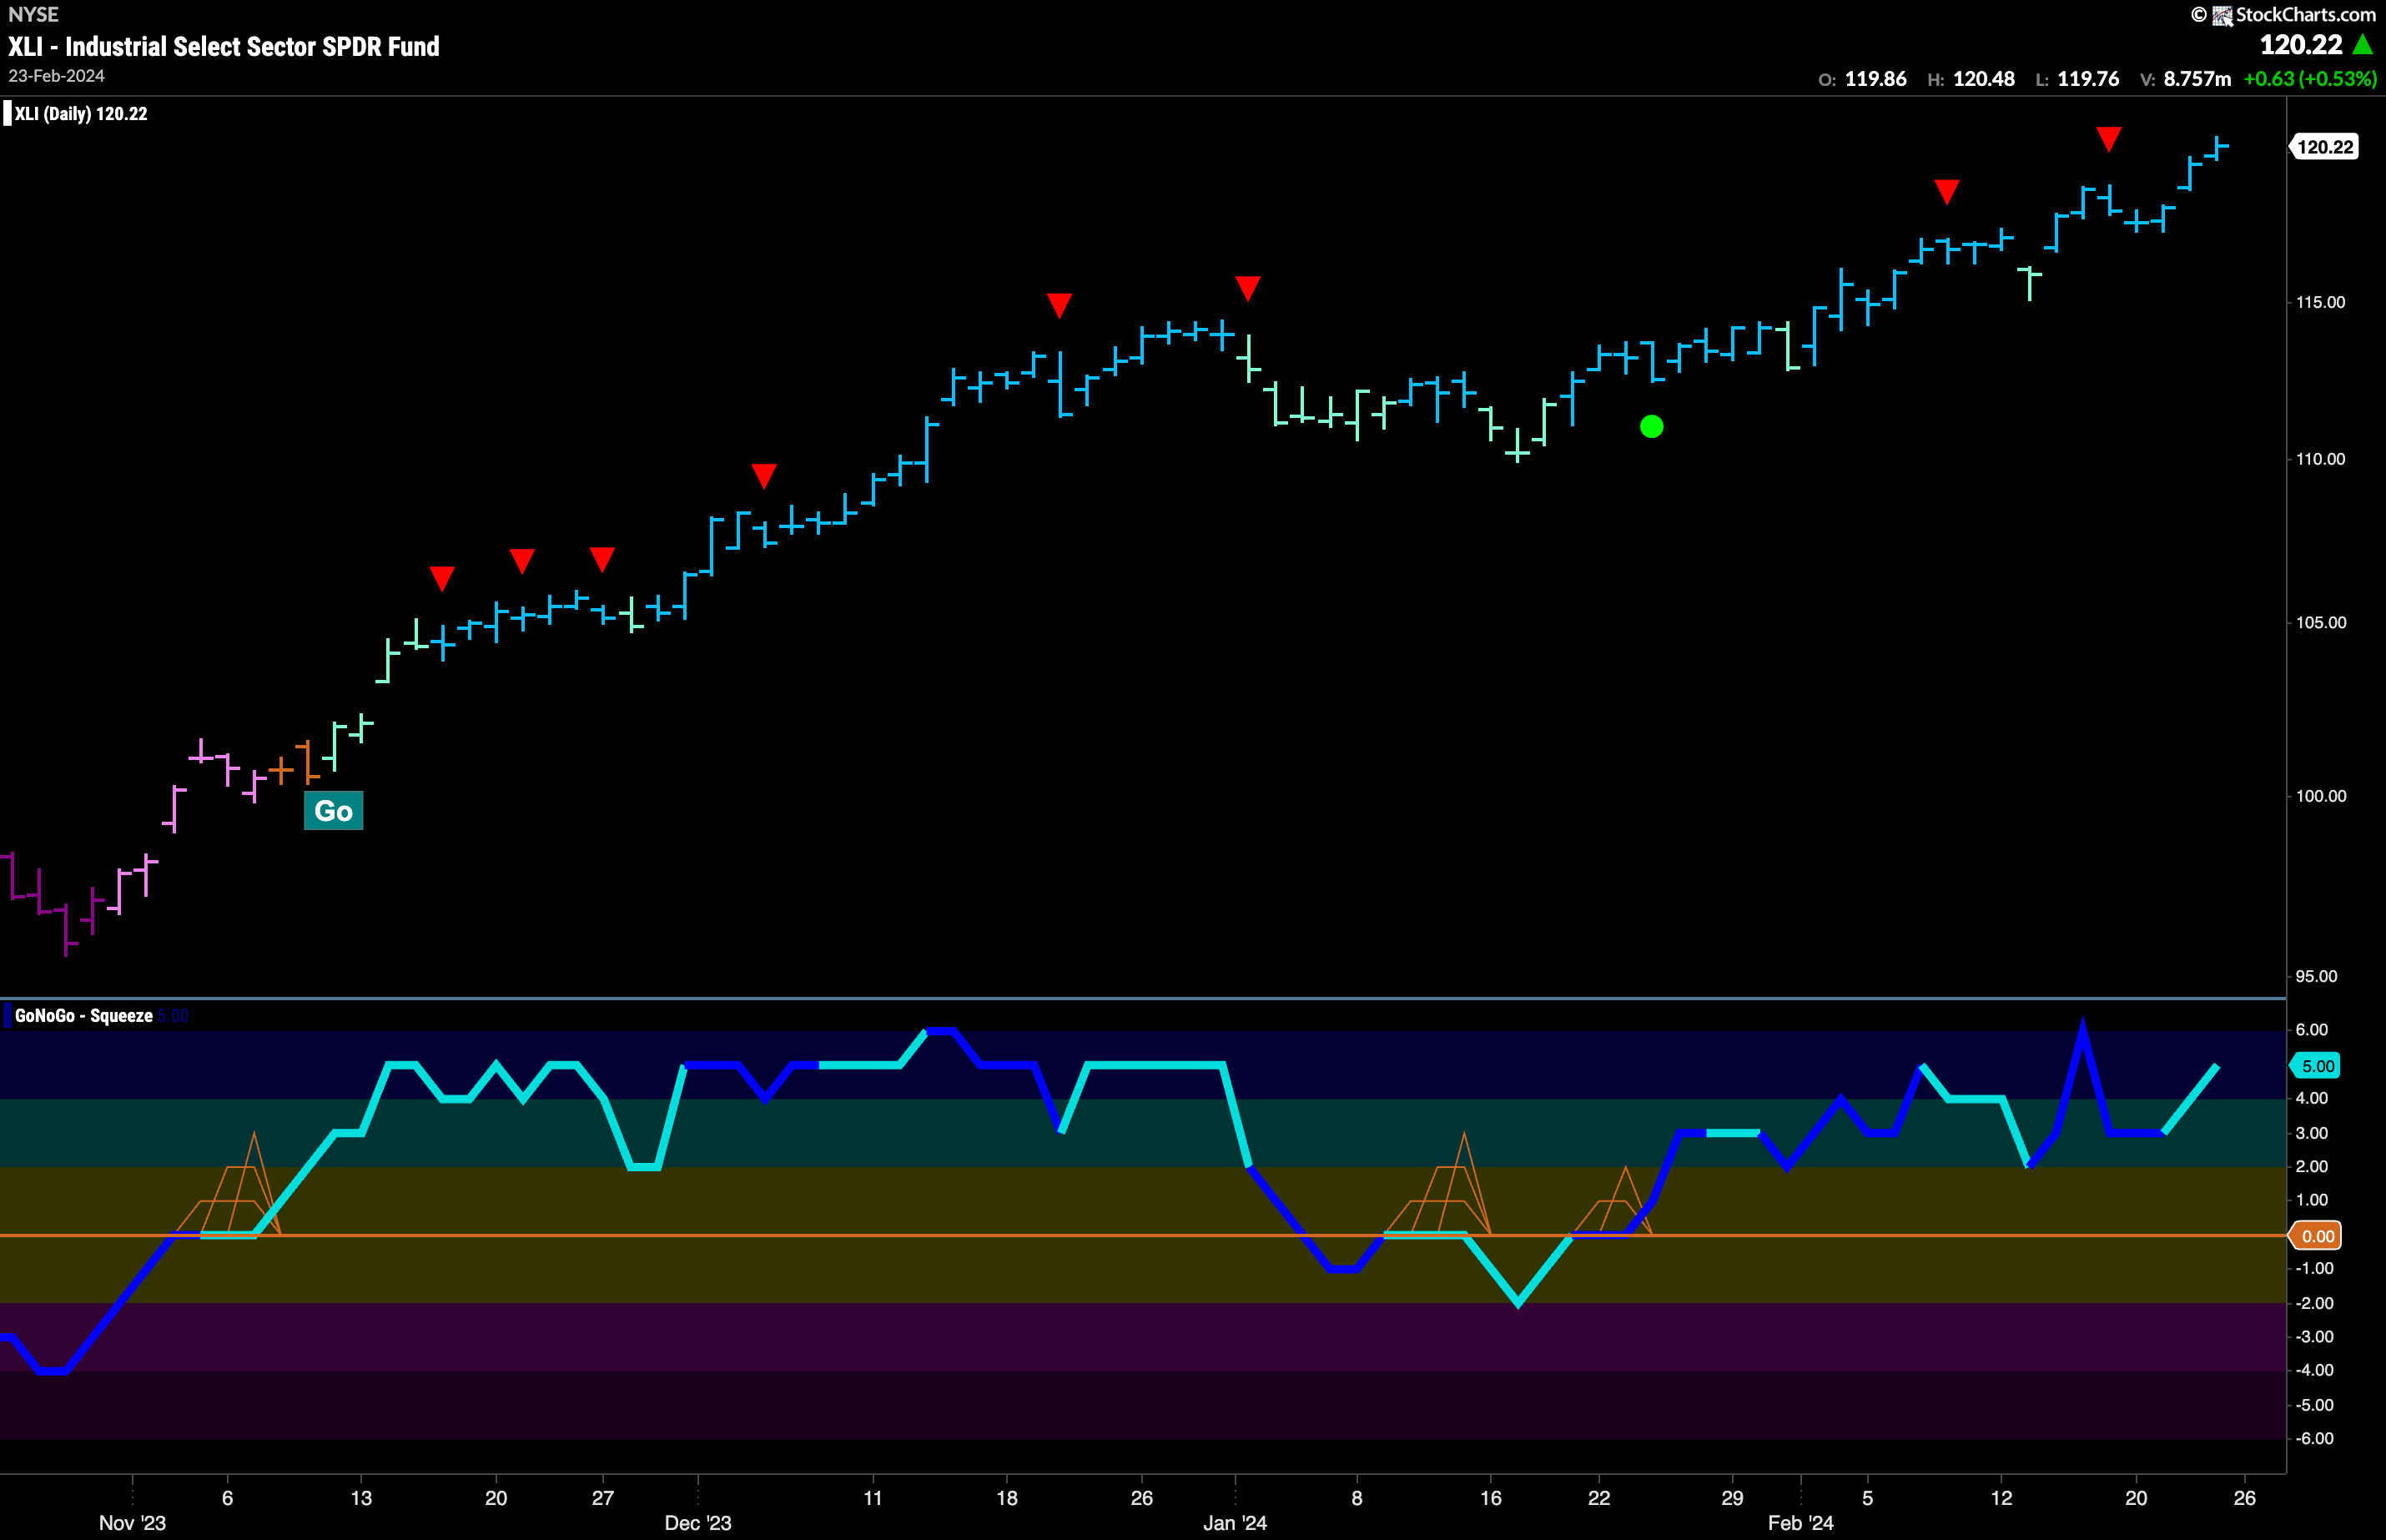
$XLC was lonely as the only relative out-performer last week. This week it welcomes the industrials sector as they try to keep the larger index moving higher. The chart below shows that $XLI has been in a strong trend for some time that has now started to out pace the base index. We can see a series of higher highs and higher lows since it entered the “Go” trend in November of last year. The middle portion of this move saw price correct against the “Go” trend as GoNoGo Trend painted a concentration of weaker aqua bars and GoNoGo Oscillator was pushed into negative territory. When the oscillator regained positive territory we saw a Go Trend Continuation Icon (green circle) and since then there has been no stopping price as it moves higher. GoNoGo Trend is painting strong blue bars and GoNoGo Oscillator has been in positive territory ever since. The oscillator is currently at a value of 5.
Communications Sub-Group RelMap
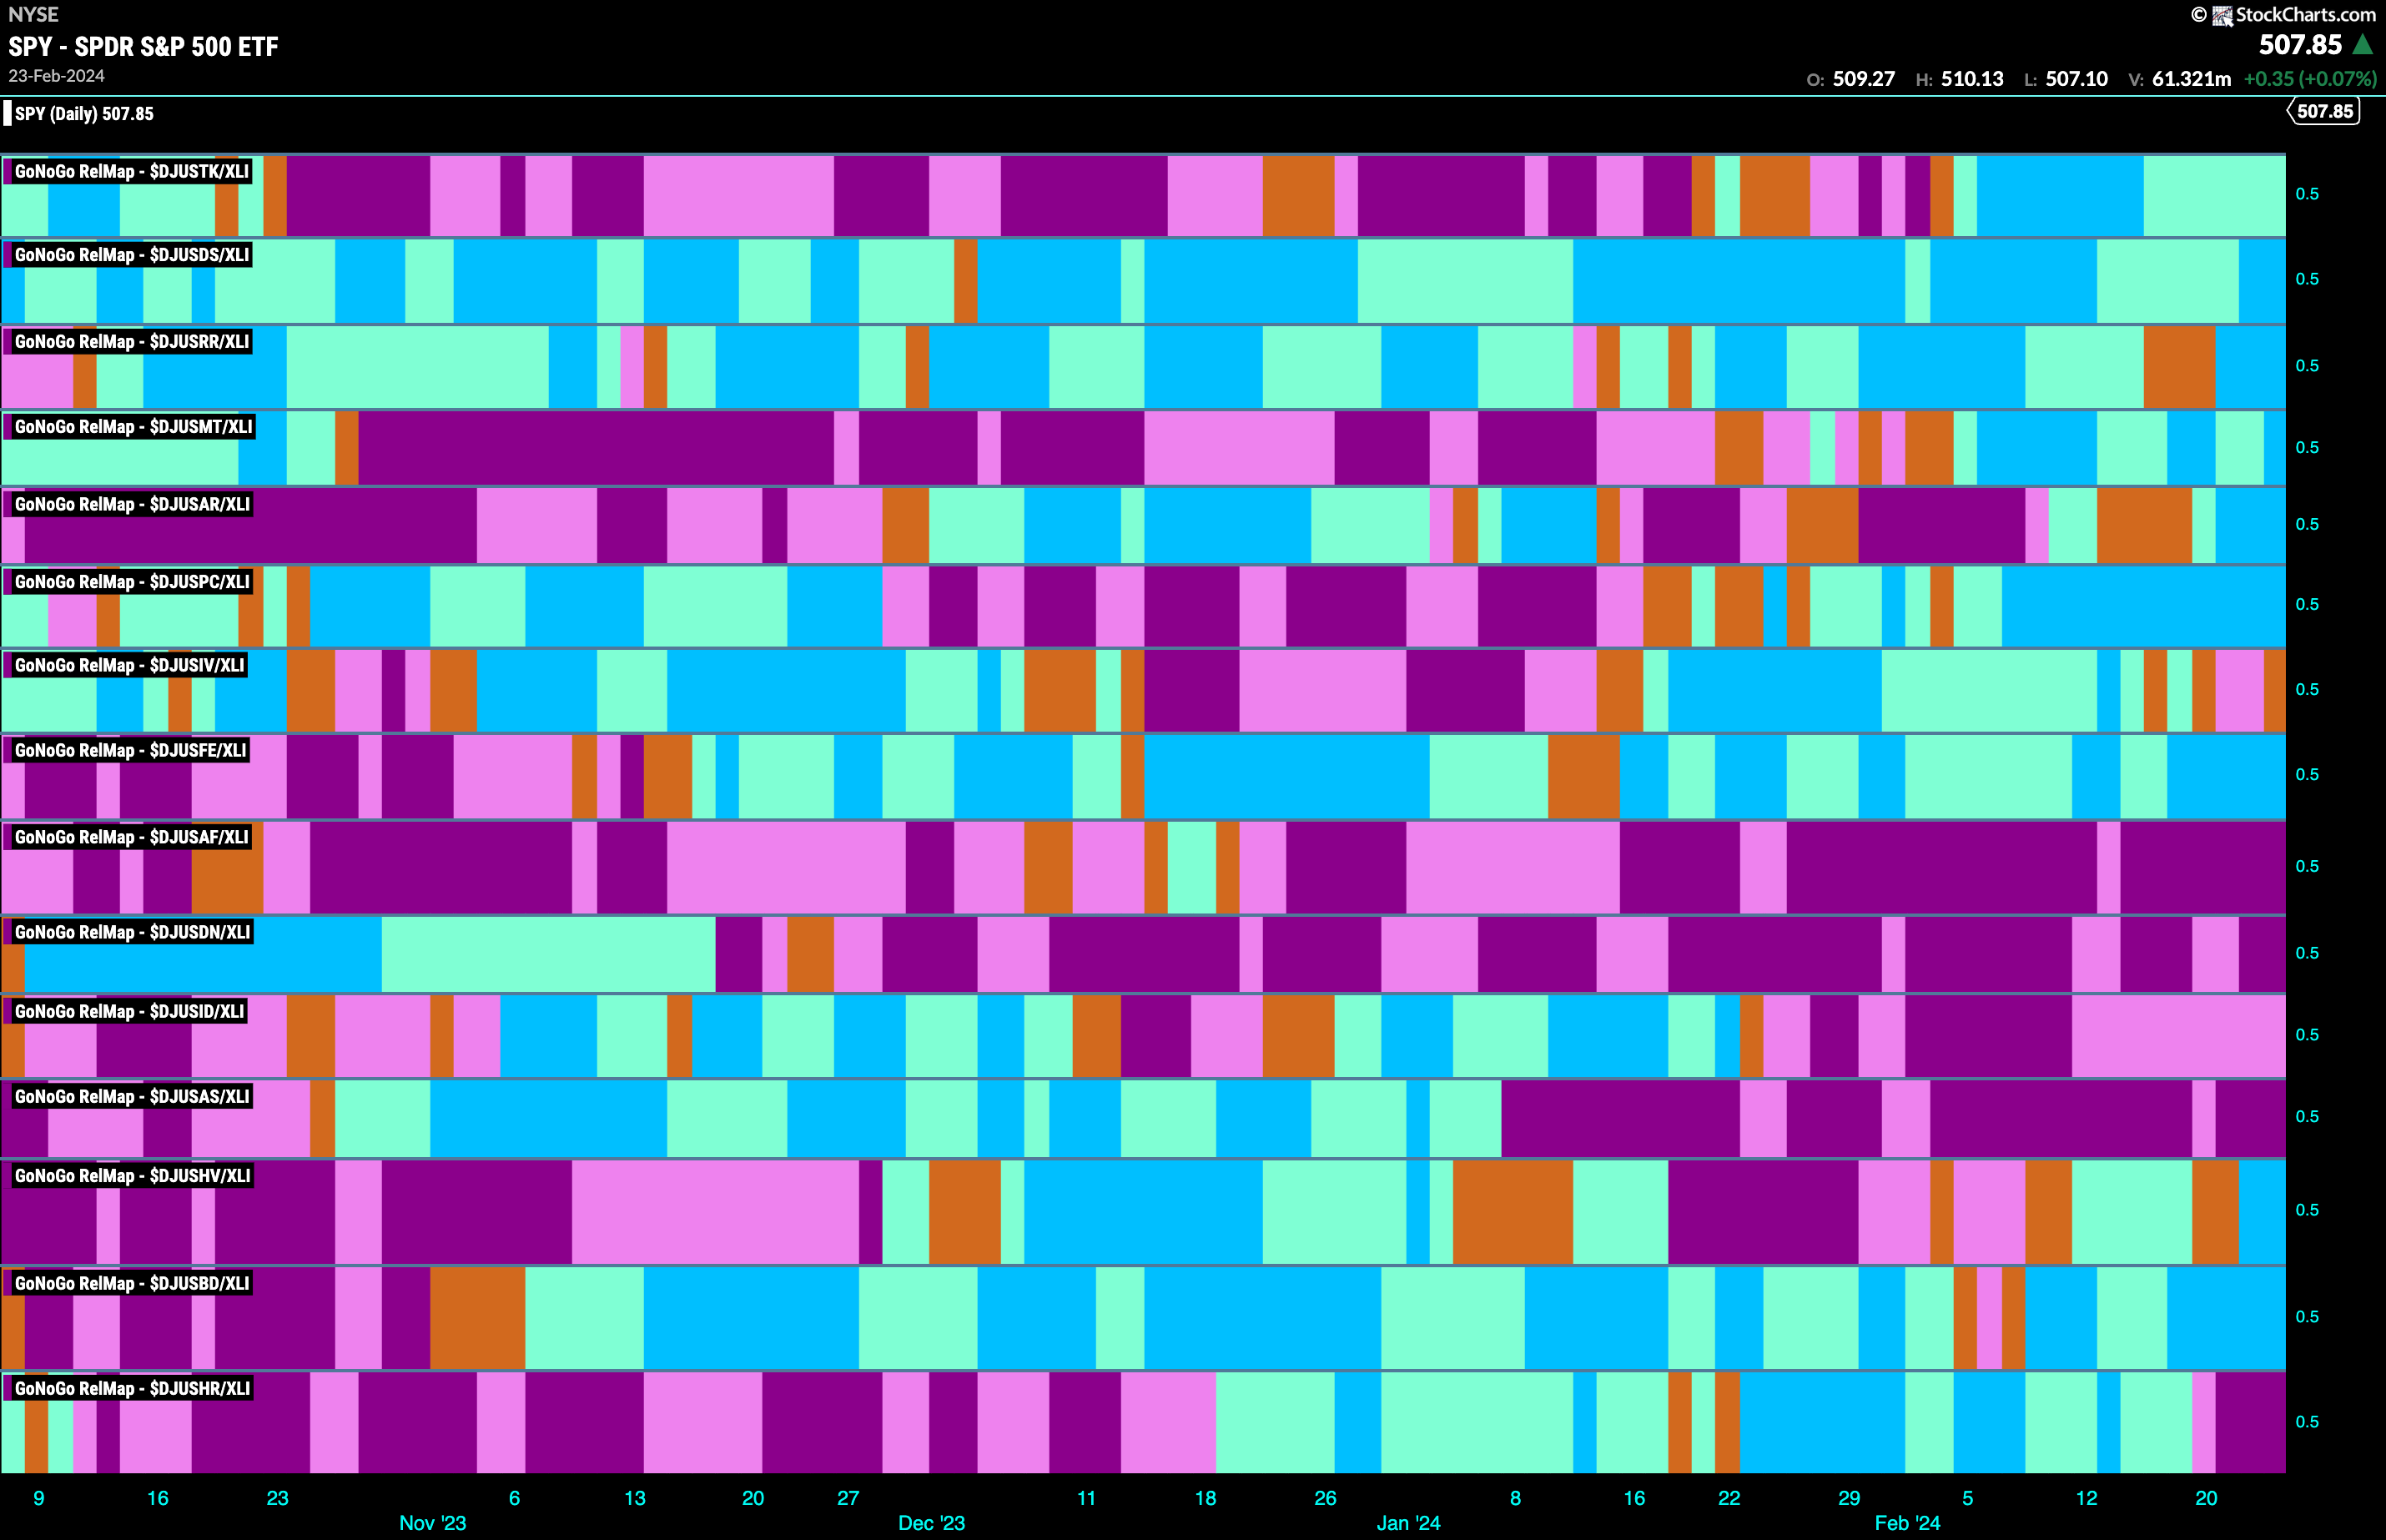
The GoNoGo Sector RelMap above shows that the communications sector continues to outperform on a relative basis for another week. Below, we see the individual groups of the sector relative to the sector itself. We apply the GoNoGo Trend to those ratios to understand where the relative outperformance is coming from within a sector. This is a healthy map as 9 out of the 15 sub groups are showing relative “Go” trends. In the second panel, the industrial suppliers index has been in a relative “Go” trend for the entire length of the chart.
Industrial Suppliers Ready to Break Higher
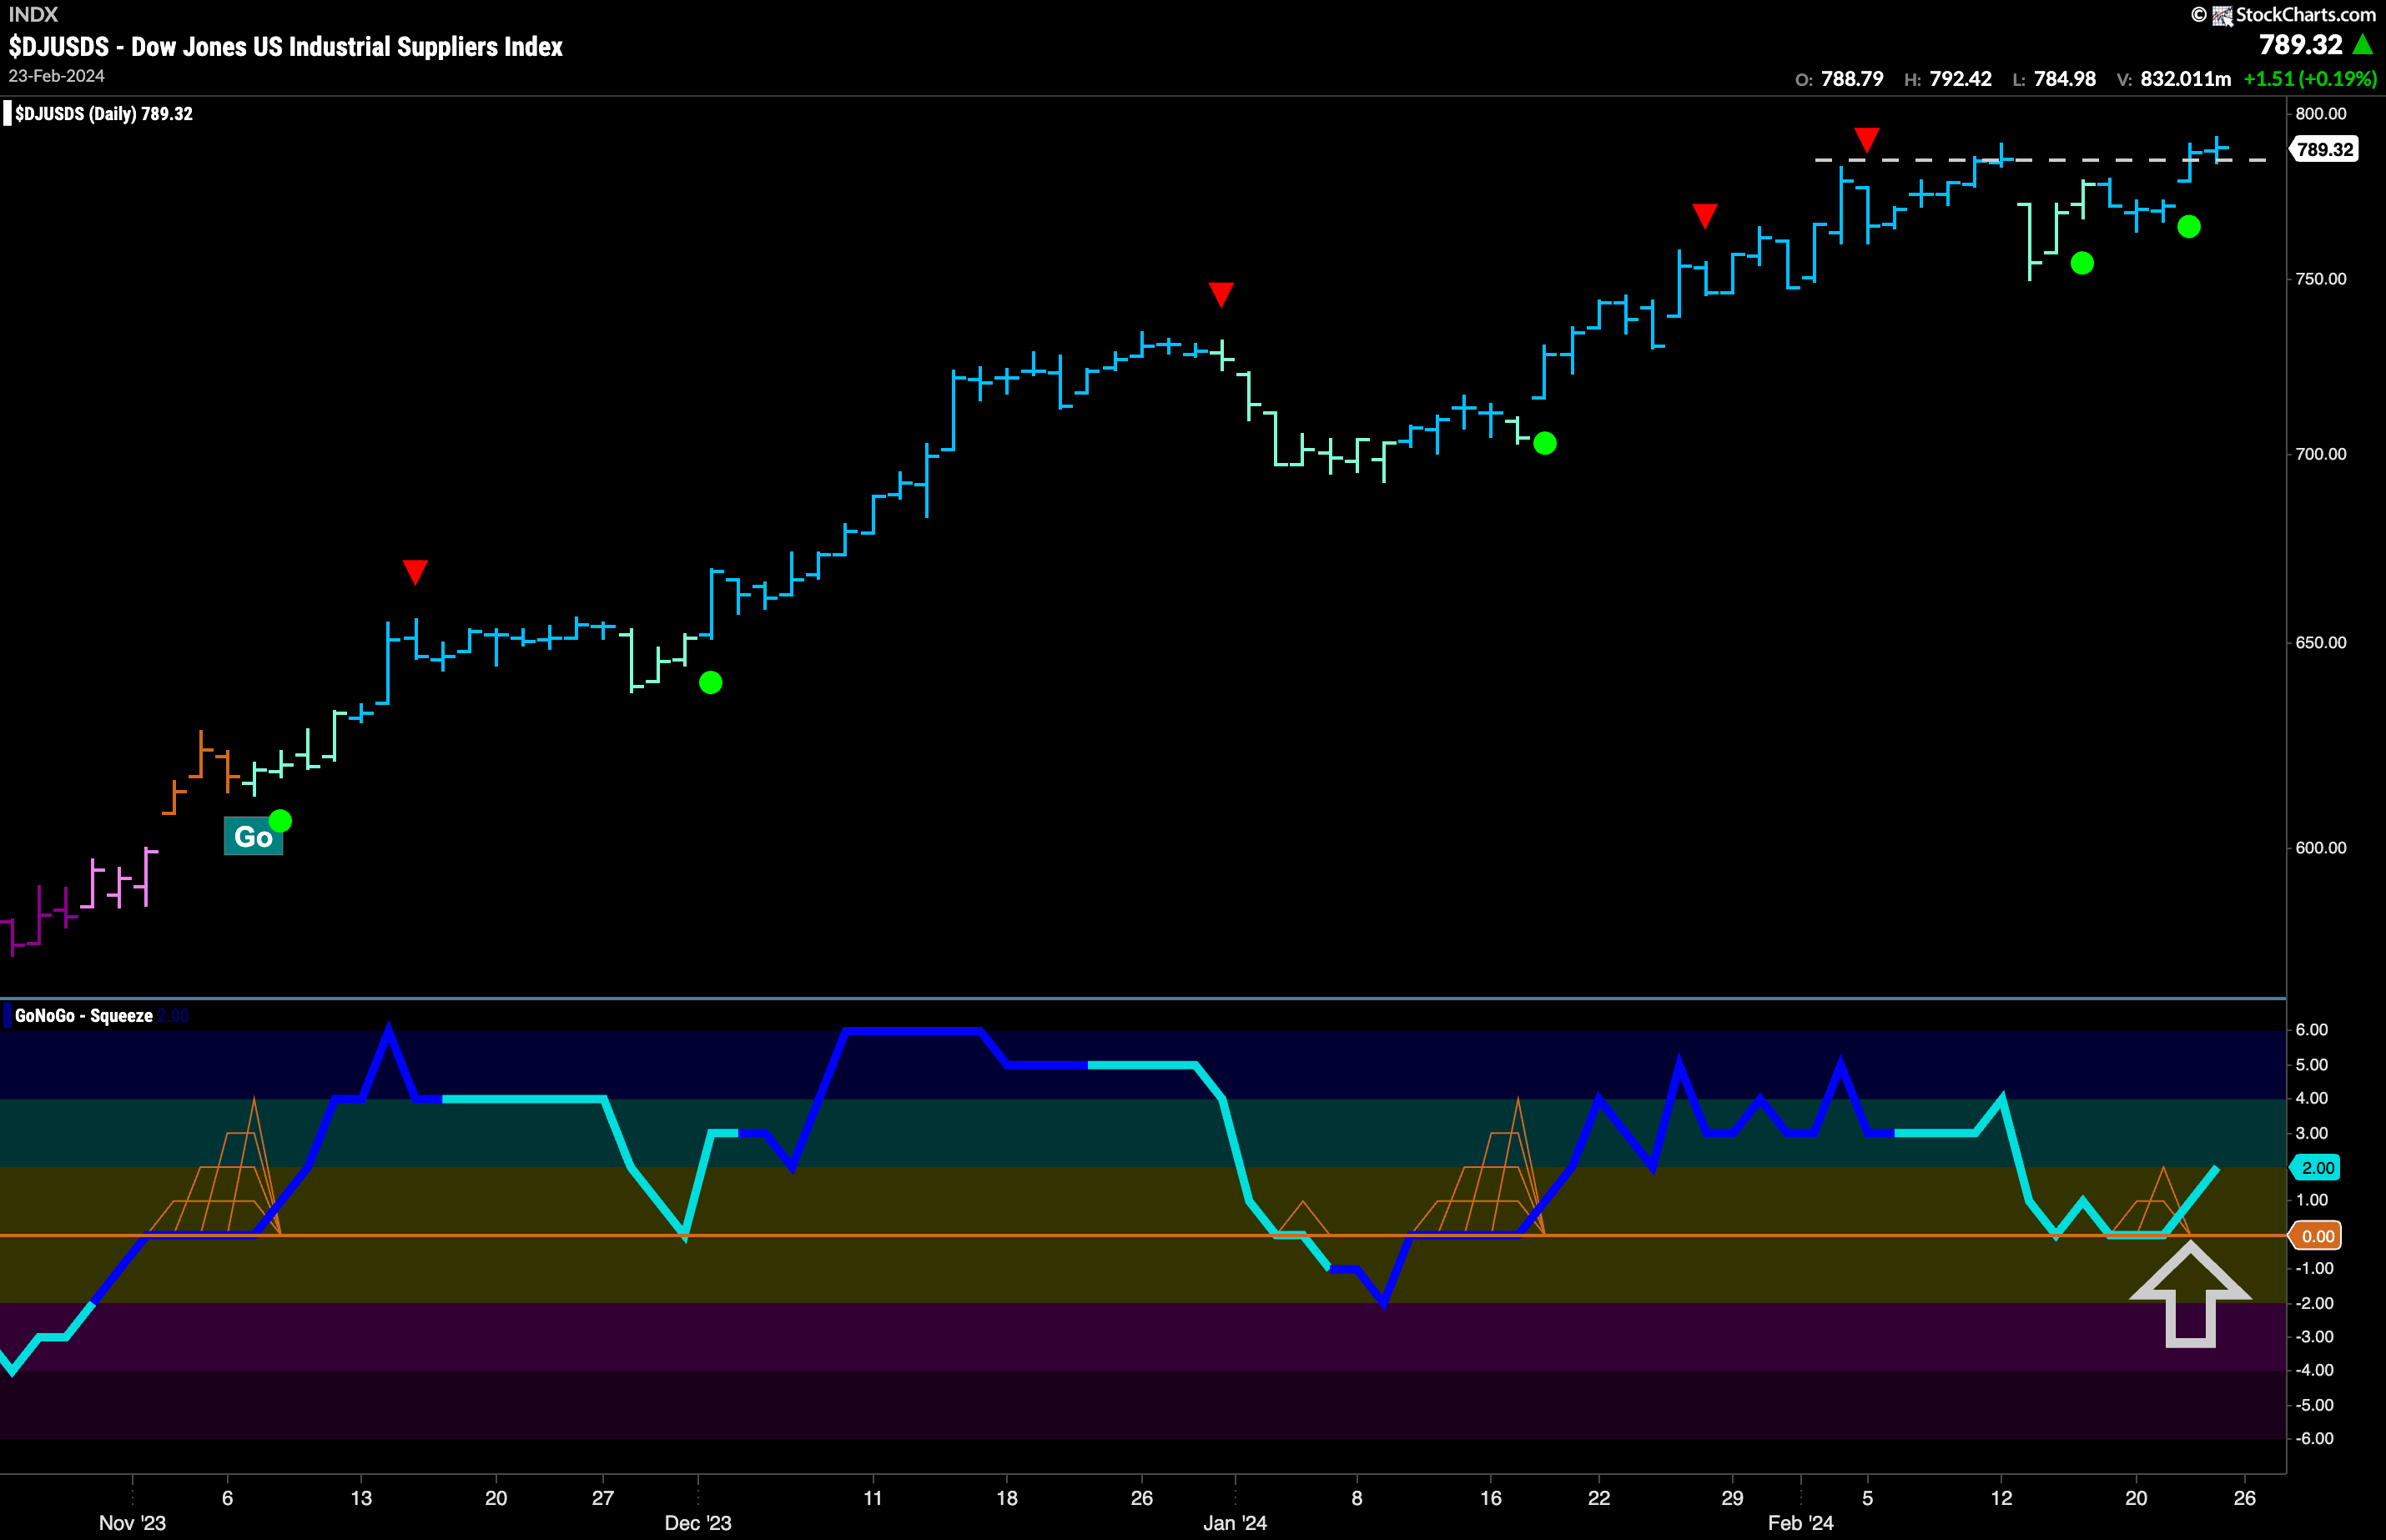
If we look at the chart below of $DJUSDS, we can see that there are strong signs of higher prices to come. We see GoNoGo Trend painting strong blue bars as price challenges prior highs. We also see that GoNoGo Oscillator has found support twice at the zero line and it is this clustering of support that may propel price to higher highs. We know that momentum is resurgent in the direction of the “Go” trend as the market shows enthusiasm for higher prices.
$HLMN Breaks Resistance
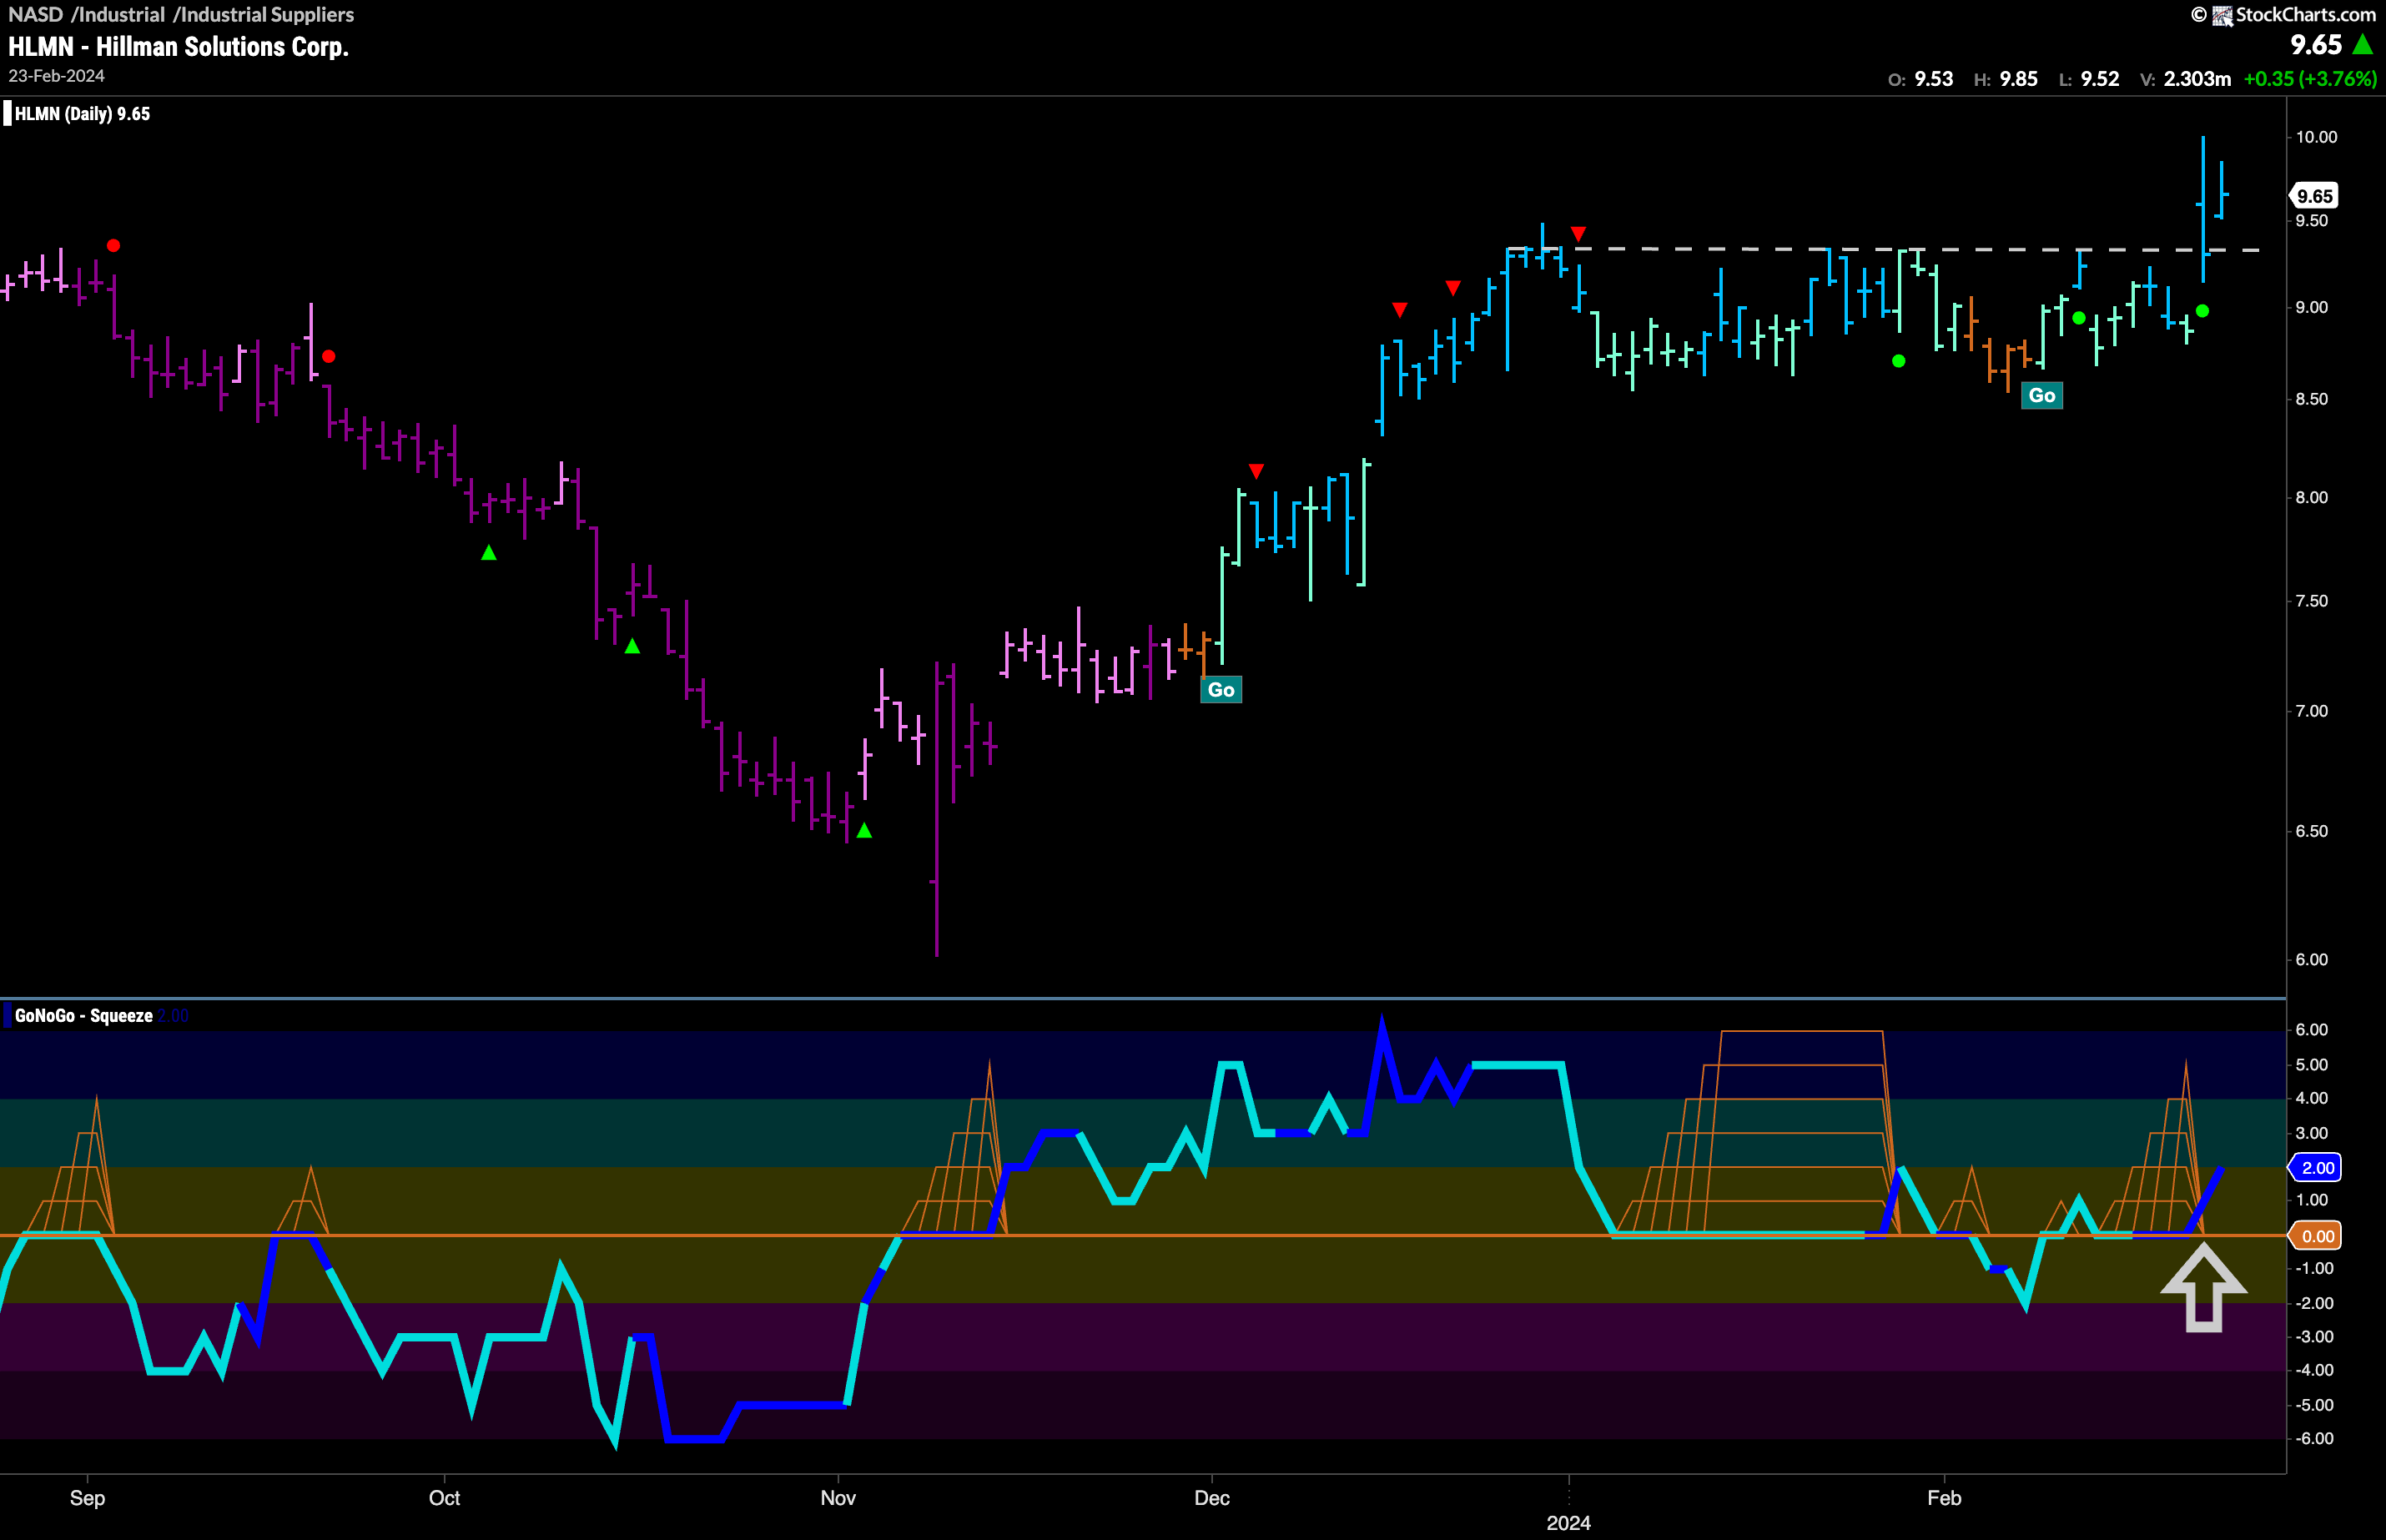
With the industrial suppliers sub group outperforming the industrials sector which is outperforming the larger index, we can look for opportunities in this space. This is fishing where the fish are! Hillman Solutions Corp is a security in the Industrial Suppliers space looking at the chart below we can see that it has been in and out of a “Go” trend since early December. After hitting a high at the end of that month, we saw Go Countertrend Correction Icons (red arrows) that suggested price may struggle to go higher in the short term. Price moved mostly sideways this year as GoNoGo Oscillator struggled to move far from the zero line. Most recently, the oscillator broke out of a small GoNoGo Squeeze into positive territory and on heavy volume. Price has rallied through horizontal resistance and we will look for it to consolidate at these levels before moving higher.
$GWW Ready for New Highs?
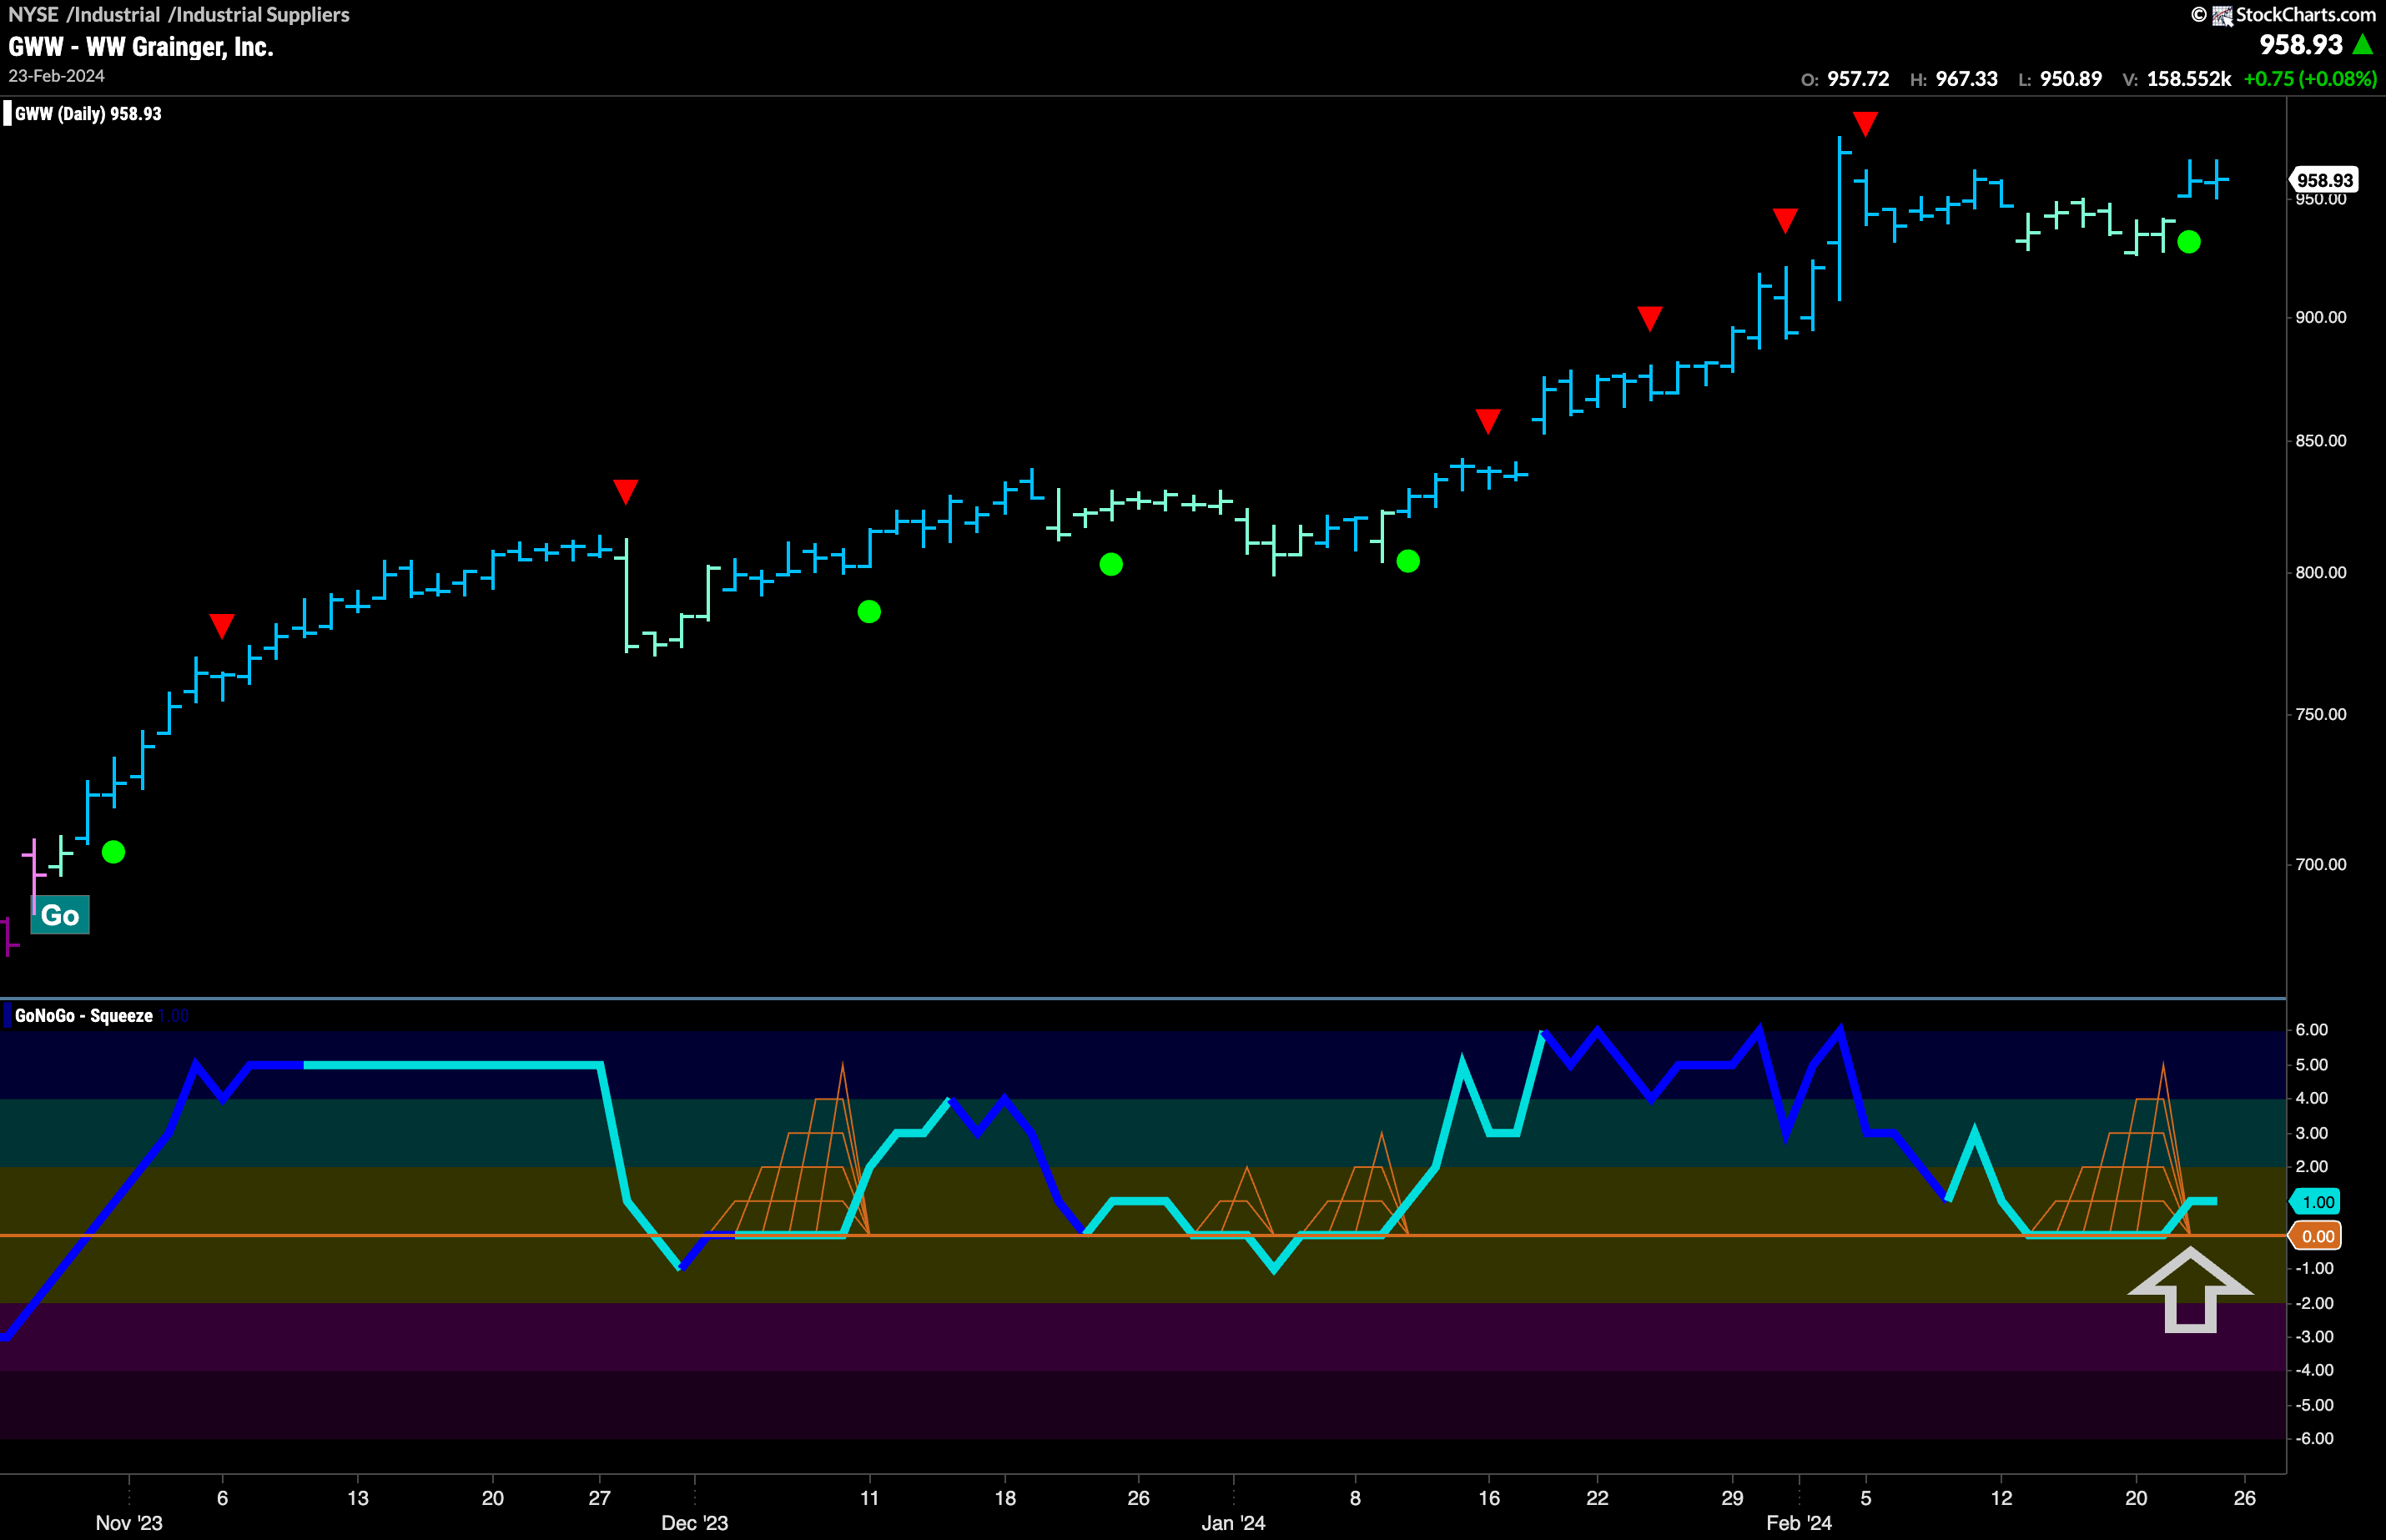
Another company in the industrial suppliers space, WW Grainger has been in a beautiful “Go” trend for several months. During that time, we have seen that GoNoGo Oscillator has primarily been finding support at the zero line. Recently, in early February, we saw price hit a high and this was followed by a Go Countertrend Correction Icon (red arrow). Price fell from this high and moved mostly sideway since as GoNoGo Trend weakened painting aqua “Go” bars. GoNoGo Oscillator fell to test the zero line from above and we saw a GoNoGo Squeeze build. Now, the oscillator has broken out of the Squeeze and is in positive territory. GoNoGo Trend has resumed painting strong blue “Go” bars and we will look for price to make an attack on a new high as momentum is now on the side of the trend.
 \`
\`


