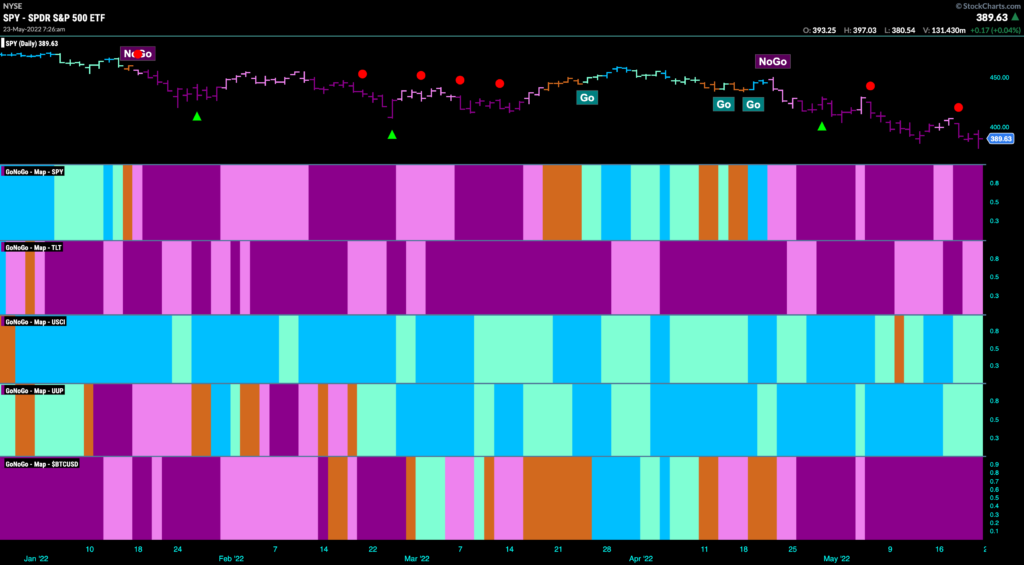
Good morning and welcome to this week’s Flight Path. Let’s take a look at the GoNoGo Asset map below. Here we are again. Equities “NoGo” trend remains strong as price made a new intraday low this week and finishes with strong purple bars. Treasury bond prices see the “NoGo” trend weaken and we have seen mostly pink bars for the last two weeks. Commodities and the dollar both are able to maintain “Go” trends albeit painting weaker aqua bars this week. Bitcoin, the world’s largest digital asset continues to struggle painting strong purple “NoGo” bars.
Sector Performance
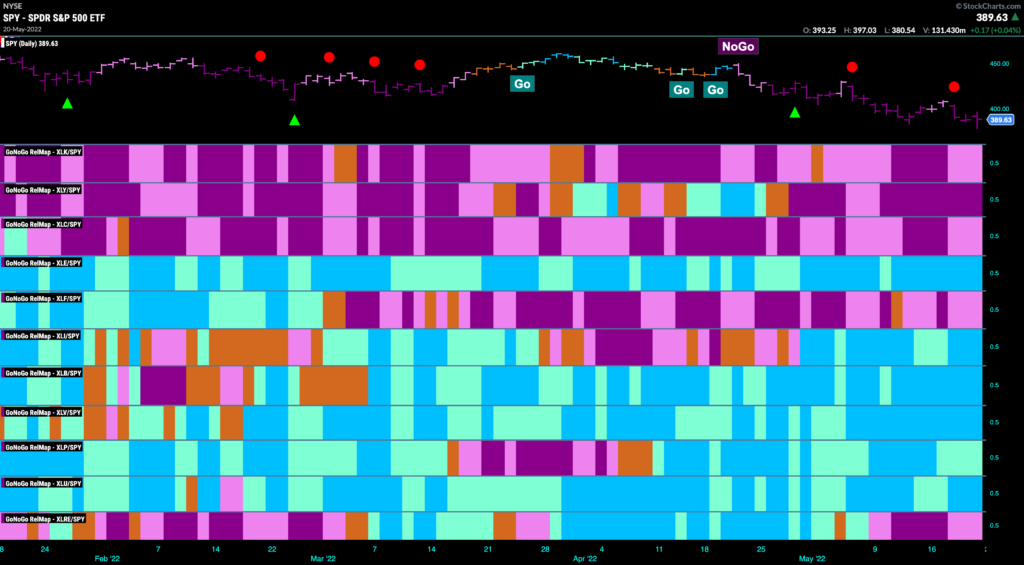
Below is the GoNoGo Sector Relmap. This GoNoGo Relmap applies the GoNoGo Trend to the relative strength ratios of the sectors to the base index. Looking at this map, we can quickly see where the relative outperformance is coming from as well as which sectors are lagging on a relative basis. It is a risk-off picture. The defensive sectors remain the relative out-performers. “Go” trends on a relative basis abound in the value sectors such as staples, utilities and of course energy, materials and industrials. Growth remains to be avoided although we are seeing some pink bars showing some weakness in the “NoGo” trends of technology and communications. Financials, also remains a “NoGo”.
$UUP, $UUP and Away?
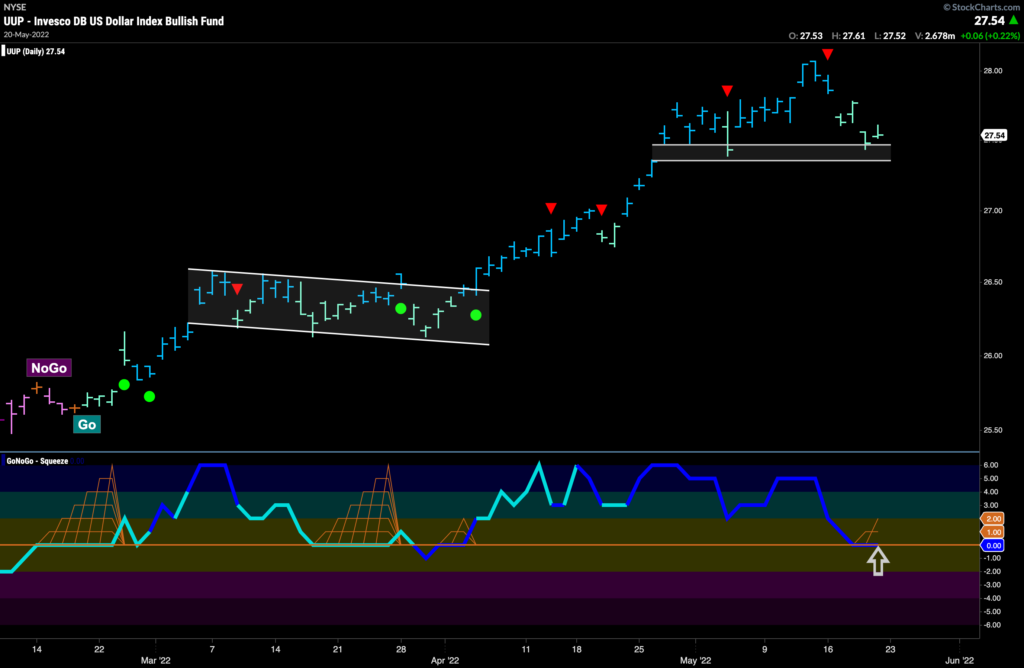
Below is the daily chart of $UUP, the Invesco US Dollar Index Fund, with the GoNoGo Suite of tools applied. The dollar has been on a strong run since February of this year, with the “Go” trend supported by GoNoGo Oscillator being primarily above the zero line. As GoNoGo Oscillator found support at the zero line early on and throughout the trend, we saw several Go Trend Continuation Icons (green circles) offering the investor a low risk opportunity to participate in the move higher. Now, we are at another important moment as we see weakness in the “Go” trend reflected in the paler aqua bars as price falls to a level that could act as support. GoNoGo Oscillator has fallen to the zero line on heavy volume. It is riding the zero line causing the beginnings of a GoNoGo Squeeze to build. We will look for support here again. If the oscillator rallies back into positive territory that would suggest momentum returning in the direction of the “Go” trend and we could expect a new leg higher.
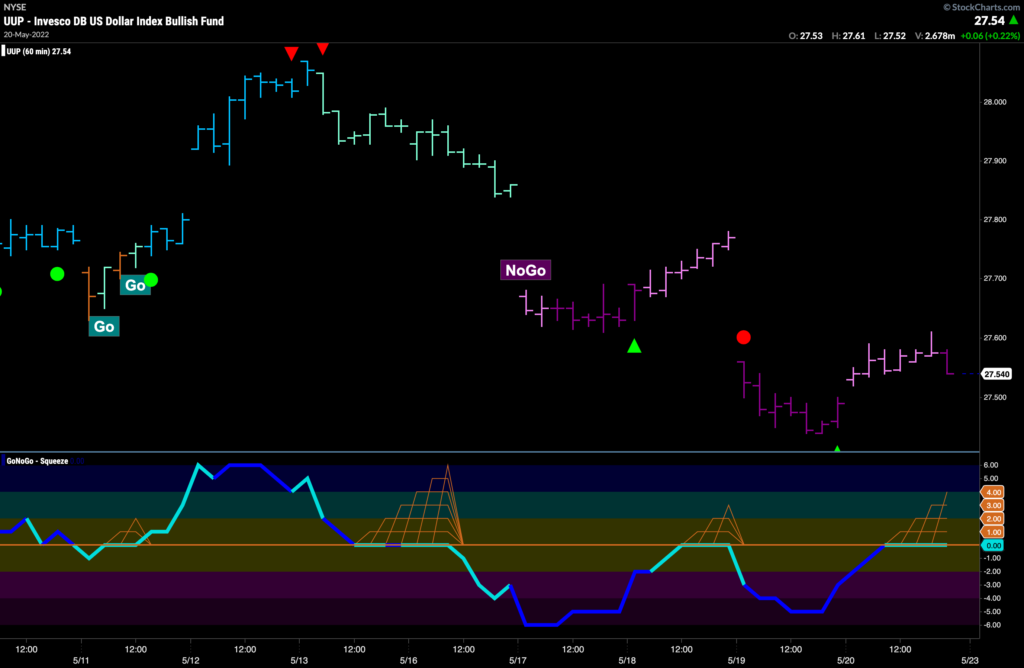
Looking for support on the daily chart, we can step down a timeframe to look for a good entry point to take advantage of the pullback that we have seen. Below is an hourly chart of $UUP and the short term trend is a “NoGo” with GoNoGo Oscillator at the zero line testing it from below as the grid of GoNoGo Squeeze builds. Look to build a long position based on the daily chart, we would wait until we see the short term environment change. We need to see GoNoGo Oscillator break out of the Squeeze into positive territory which would tell us that there is bullish momentum. Then we would look to see if GoNoGo Trend is unable to maintain the “NoGo” colors in the price panel above.
We will keep an eye on the dollar this week as its price trend can have far reaching implications across all assets.
S$P 500 Sees GoNoGo Oscillator Rejected at Zero
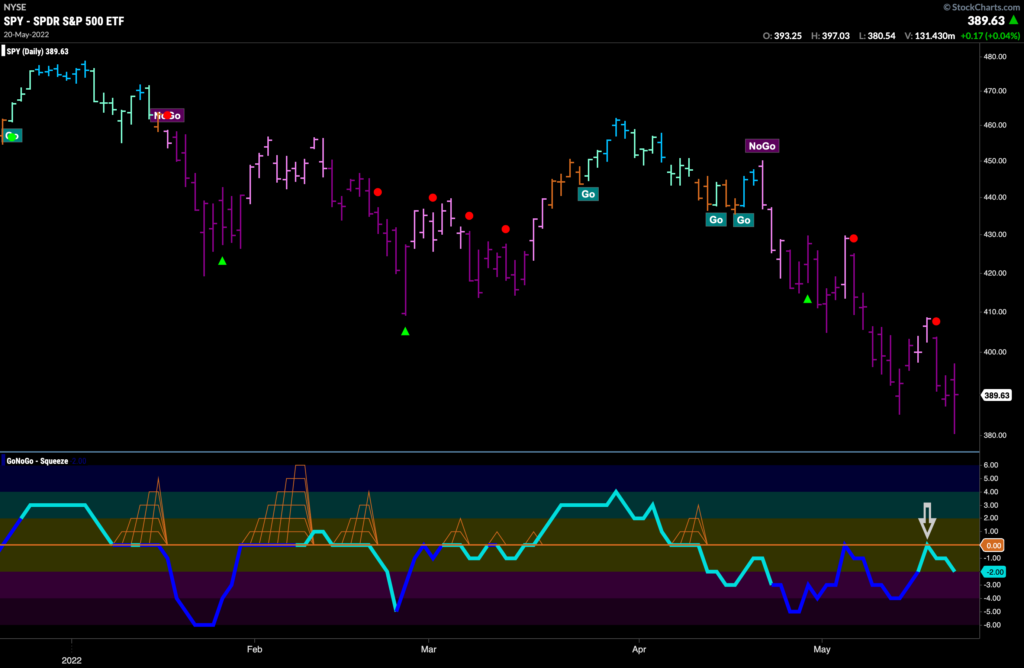
The GoNoGo Chart below shows the daily chart of $SPY. We saw a new intraday low this week as the price trend remains a strong “NoGo”. Each rally has caused GoNoGo Oscillator to test the zero line from below where it has promptly been turned away back into negative territory. While volume has weakened, we see no reason to be looking for trend reversal at this point. We don’t want to try to catch a falling knife when the weight of the evidence tells us the trend is still a “NoGo”.
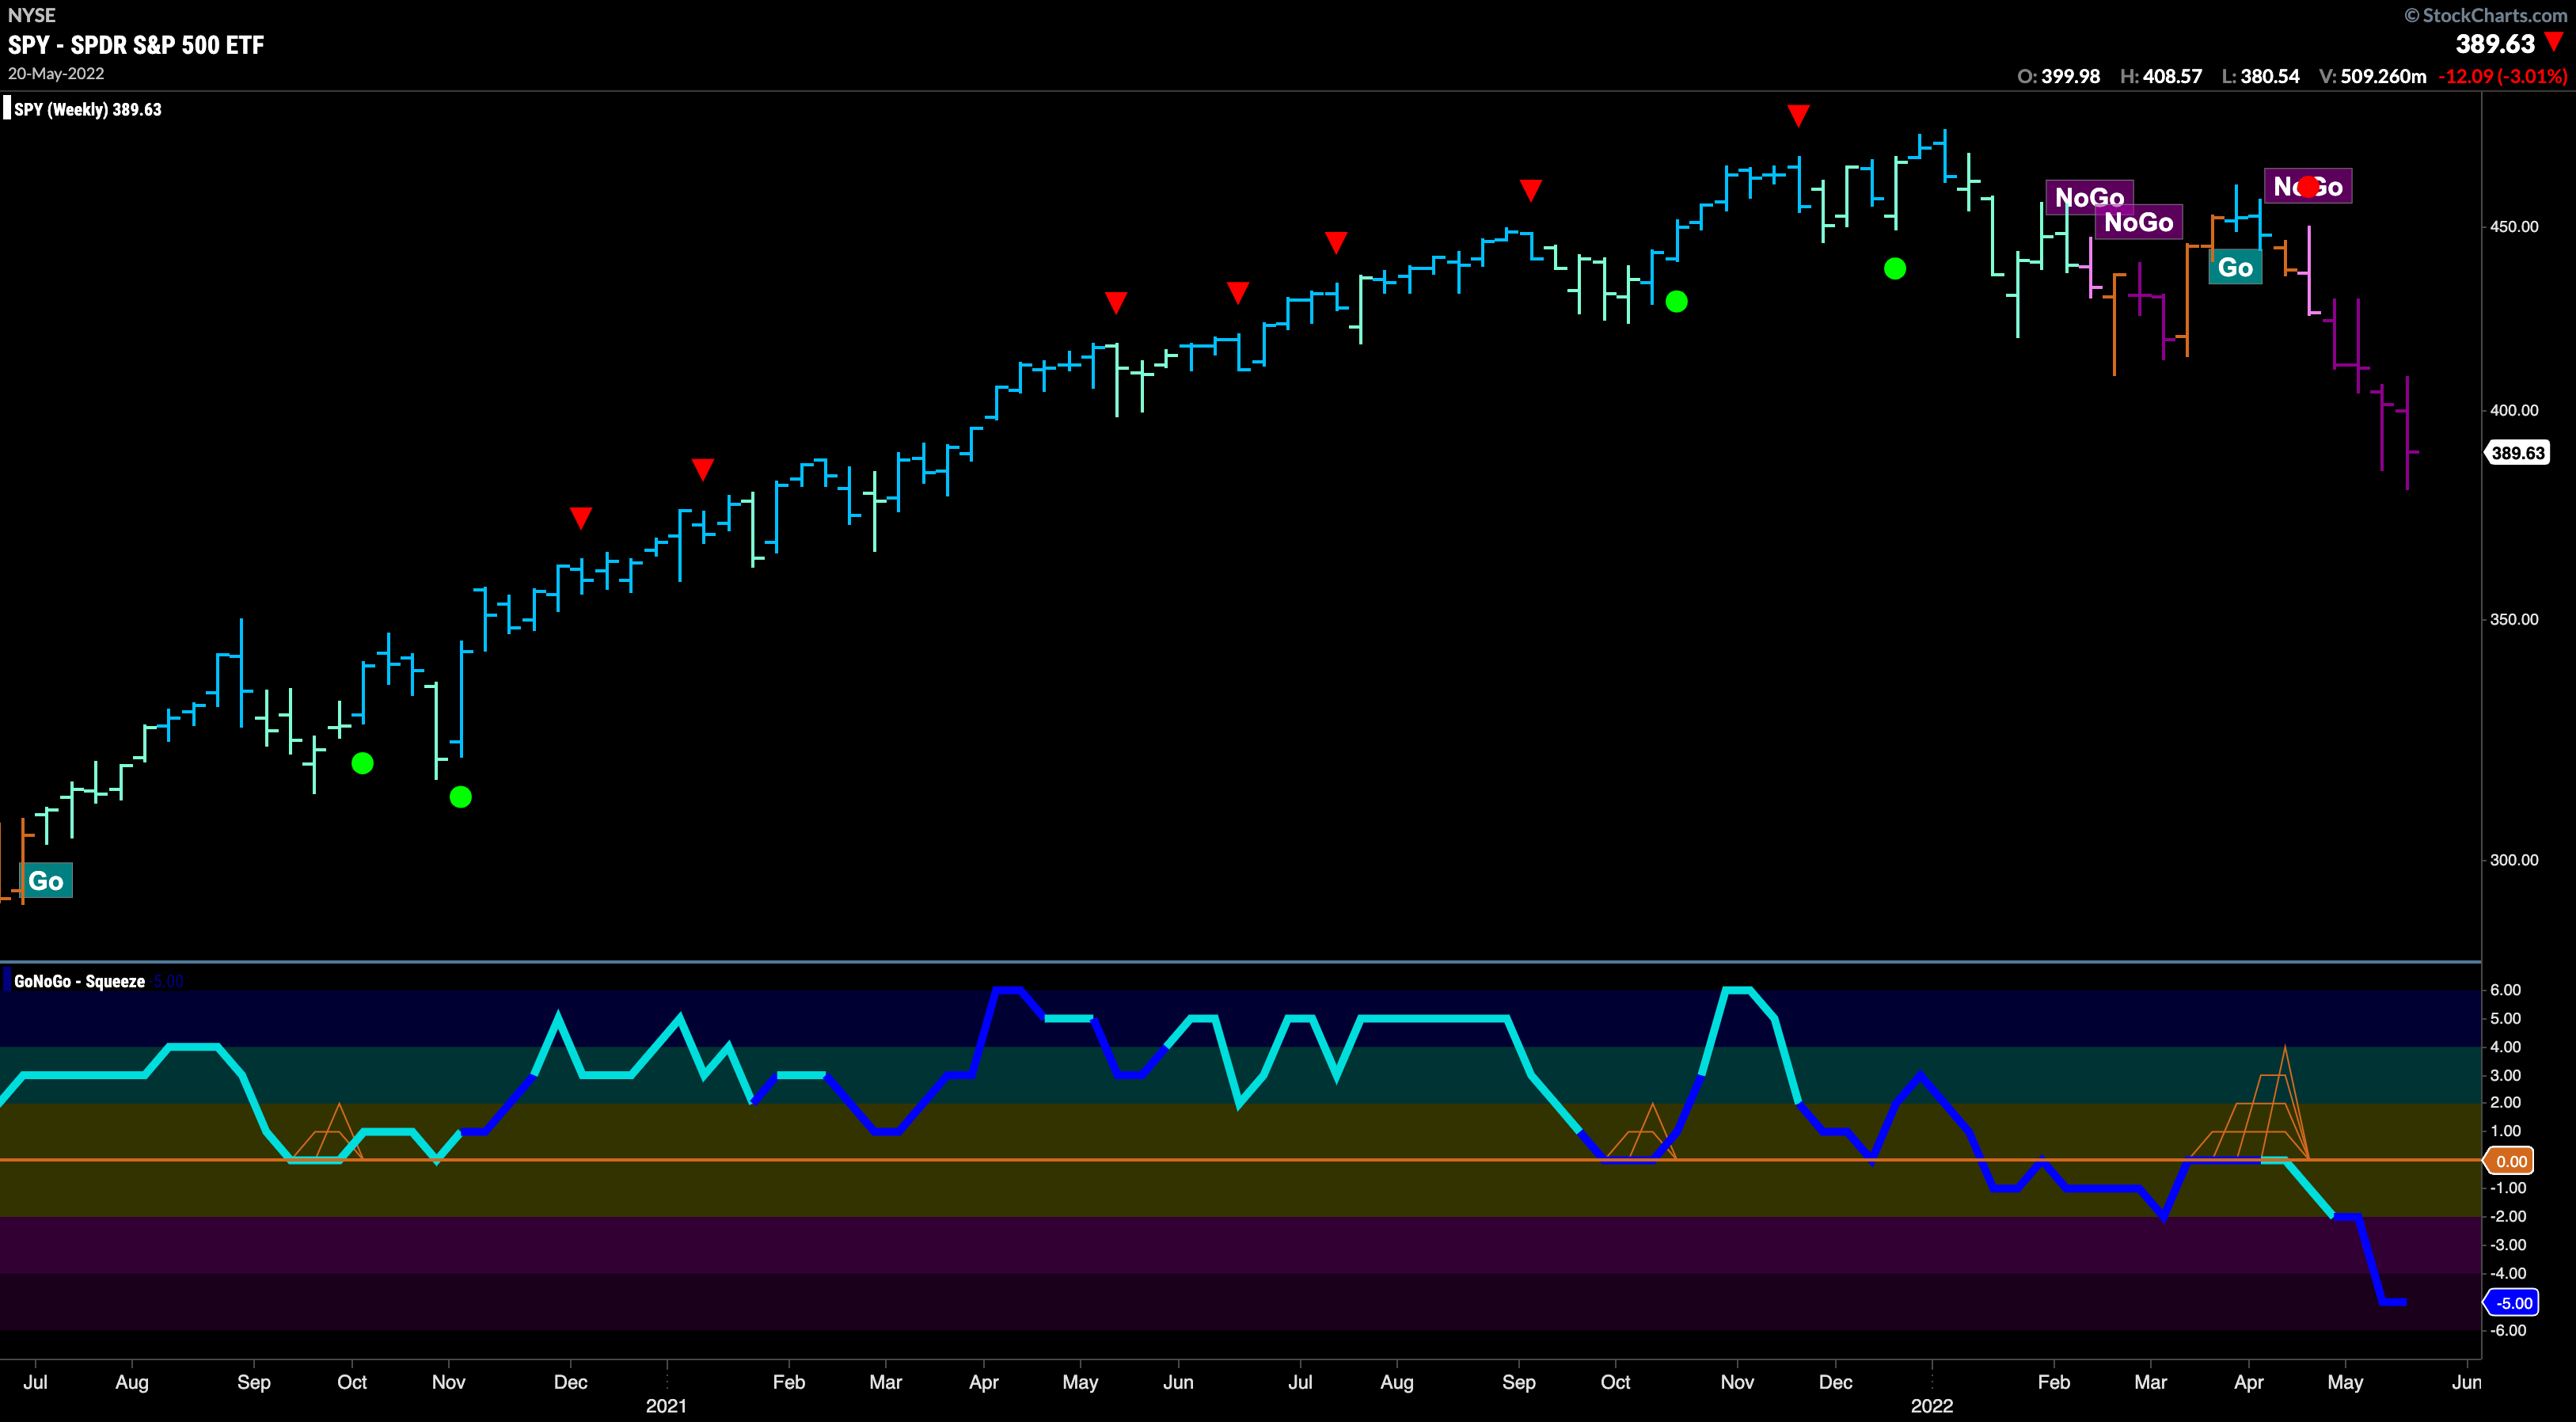
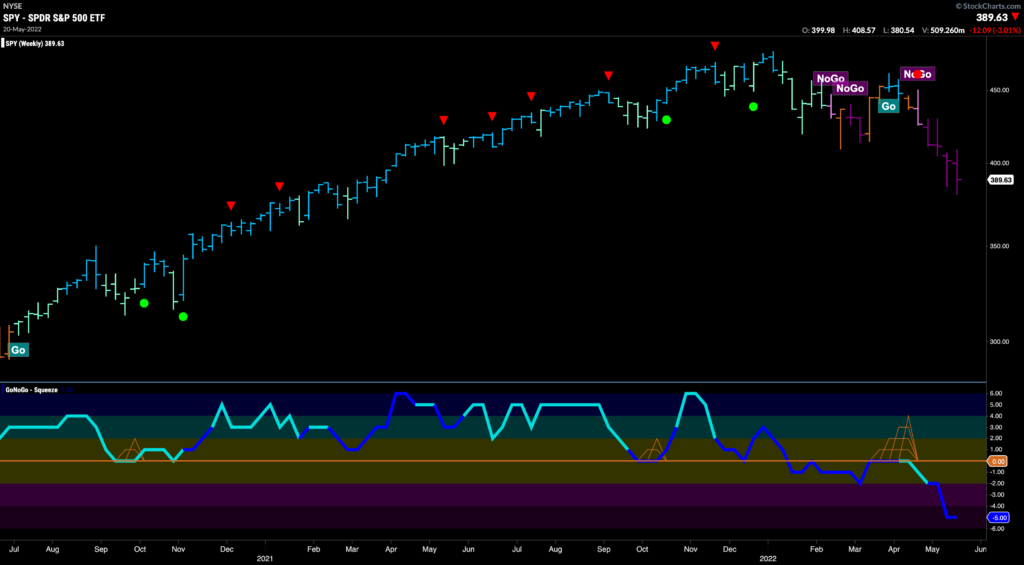
On the weekly chart the “NoGo” trend is clearly in place. A string of purple “NoGo” bars is pushing price to new lows each week on a closing basis. GoNoGo Oscillator is oversold on heavy volume which shows the heavy market participation in the falling price action. We will look to see if GoNoGo Oscillator can climb out of oversold territory but must remember that in strong trends the Oscillator can move from oversold to neutral but stay at zero or below.
Not the Time for Netflix
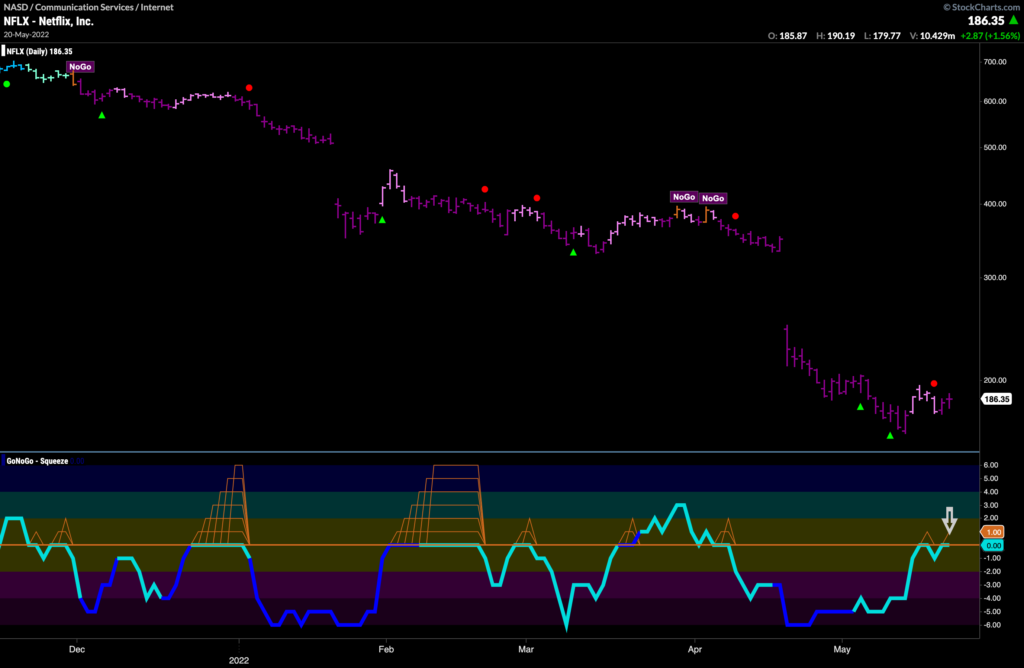
We saw from the GoNoGo Sector RelMap earlier in this note that the communications sector is underperforming the market as a whole. One of those companies contributing to the poor performance is $NFLX. Netflix is in free-fall. The “NoGo” trend has been in place since December of last year and price has tumbled. After the recent incredible gap down price has fallen further making new low after new low. Now, we see a pause in the “NoGo” trend as price action has caused GoNoGo Oscillator to rise to the zero line where it is finding resistance. We will look to see if it gets turned away again at this level. If it does, we can look for yet another leg down in price.
On the Boil!
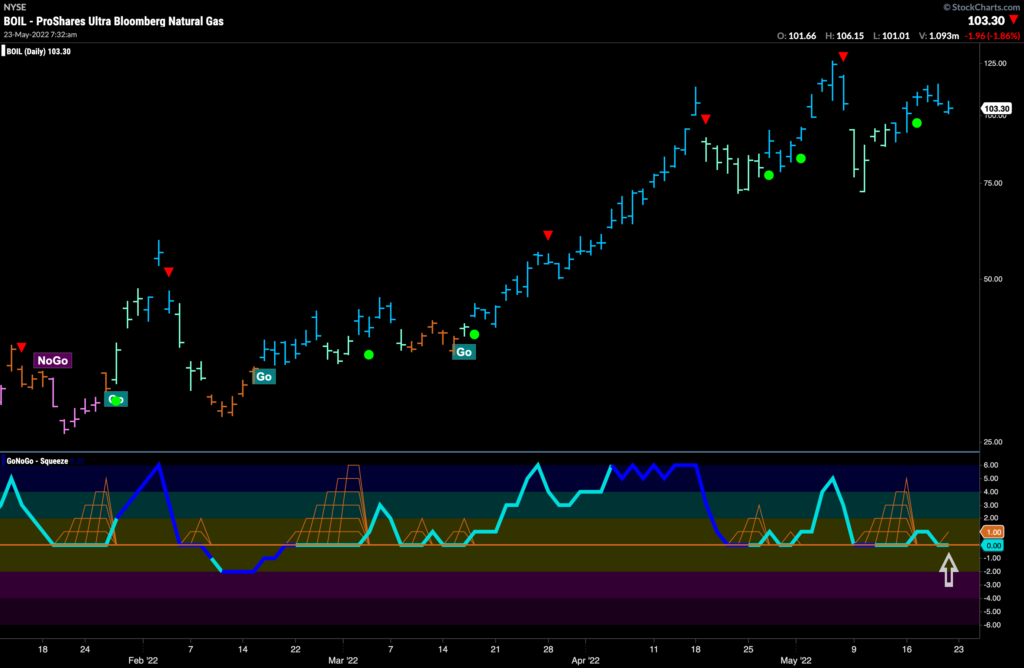
Again, it is important to note that it is not all bad. If we remember value in non correlated assets then we can be participating in “Go” trends while “NoGo” trend prevail elsewhere. We know that one of those “Go” trend has been in commodities for this entire year so far. Below is the chart of $BOIL, the ProShares Ultra Bloomberg Natural Gas fund. As you’d expect, price has seen a strong run for several months after surviving a few amber “Go Fish” periods earlier in the year. Now, after consolidating mostly sideways since the very consistent rally in April, we see GoNoGo Oscillator testing the zero line from above. Another inflection point then, where we will watch to see if the oscillator finds support. All else being equal, if the “Go” trend is healthy, we will expect the oscillator to rally off the zero line back into positive territory. If it does, we will see another Go Trend Continuation Icon (green circle) under the price bar. This would tell us that momentum has returned in the direction of the “Go” trend and we could expect an attack on prior highs.
Occidental Petroleum Corp Looks to Consolidate New Highs
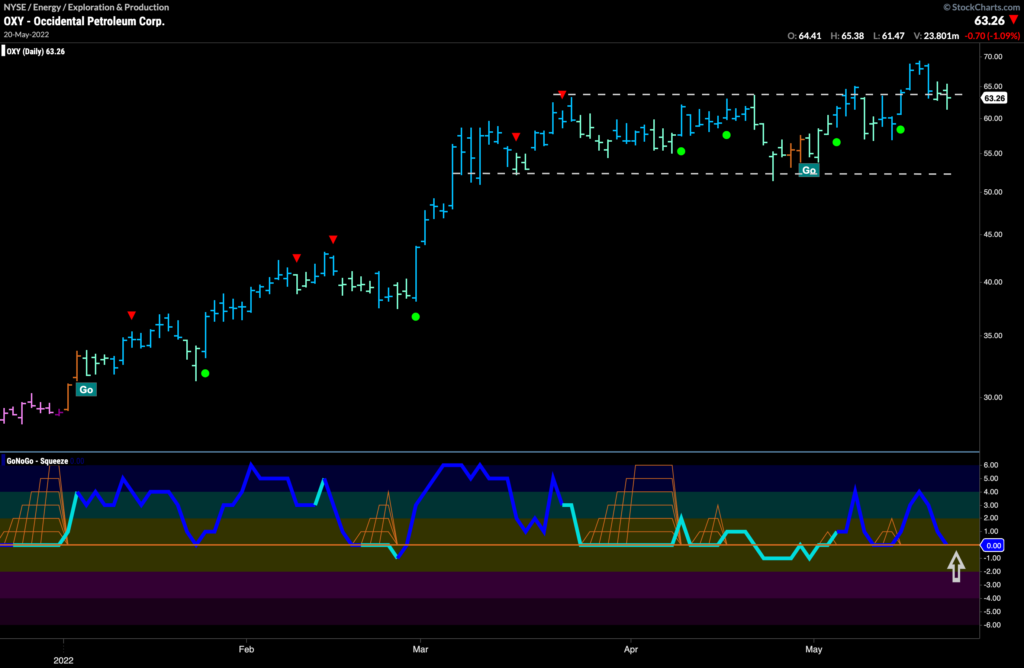
If the commodity trade as a whole has been strong, then the oil trade has been even stronger so far this year. A driver of portfolio alpha all year, oil companies have been popping up in our research week in week out since we saw the rotation away from growth and into value sectors at the start of the year. Here is another one. The below chart is daily prices for $OXY, with the full suite of GoNoGo Charts applied. We can see that price has consolidated mostly sideways since late March, but that support held and GoNoGo Oscillator stayed predominantly above zero. Now, GoNoGo Oscillator is testing the zero line from above on heavy volume. We will watch to see if it again finds support. If it does, we will see a Go Trend Continuation Icon under the price bar. This could be significant as it would be happening at a higher low, at the upper bound of the channel.
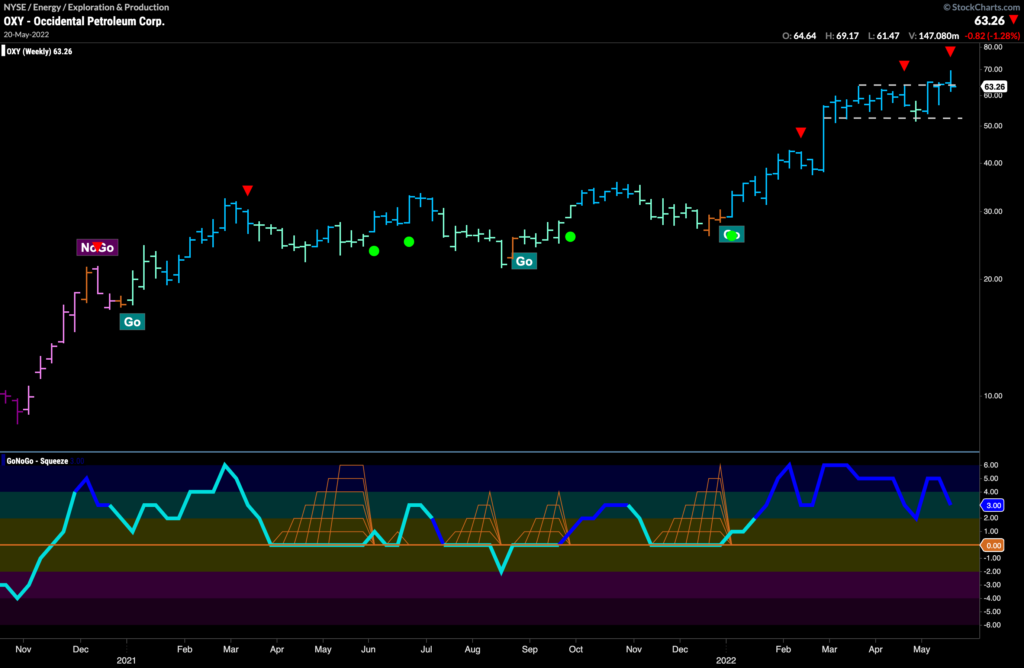
Zooming out on $OXY, we see that the “Go” trend is strong with mostly uninterrupted bright blue bars as price tries to free itself from the channel we just saw on the daily chart. GoNoGo Oscillator has been dark blue for several bars, showing that market participation is strong. GoNoGo Oscillator is also in positive territory but no long overbought. Look for $OXY to continue to thrive in the advantageous environment that we are seeing at the moment for oil stocks.
