After the S&P 500 ended the prior week at a closing record high, the benchmark index fell 1.9% last week. Investors took profits sending stocks lower, as the prospect of central bank tightening and fears over the impact of the omicron variant of the coronavirus weighed on equity markets.
As longer-term interest rate expectations increased, growth stocks and the technology-heavy Nasdaq Composite Index fared the worst, underperforming peers with a 3.0% decline. The Russell 2000 and Dow Jones Industrial Average outperformed; both declining only 1.7% over the week.
Consider the hourly chart below of the NASDAQ Composite ETF $ONEQ which shows the volatile intraday trading through last week. GoNoGo Trend® conditions fell from strong blue “Go” at Monday’s open through neutral to pink and purple bars, only to rally right back to the highs Wednesday afternoon and subsequently sell off heavily on Thursday and close Friday on strong purple “NoGo” conditions.
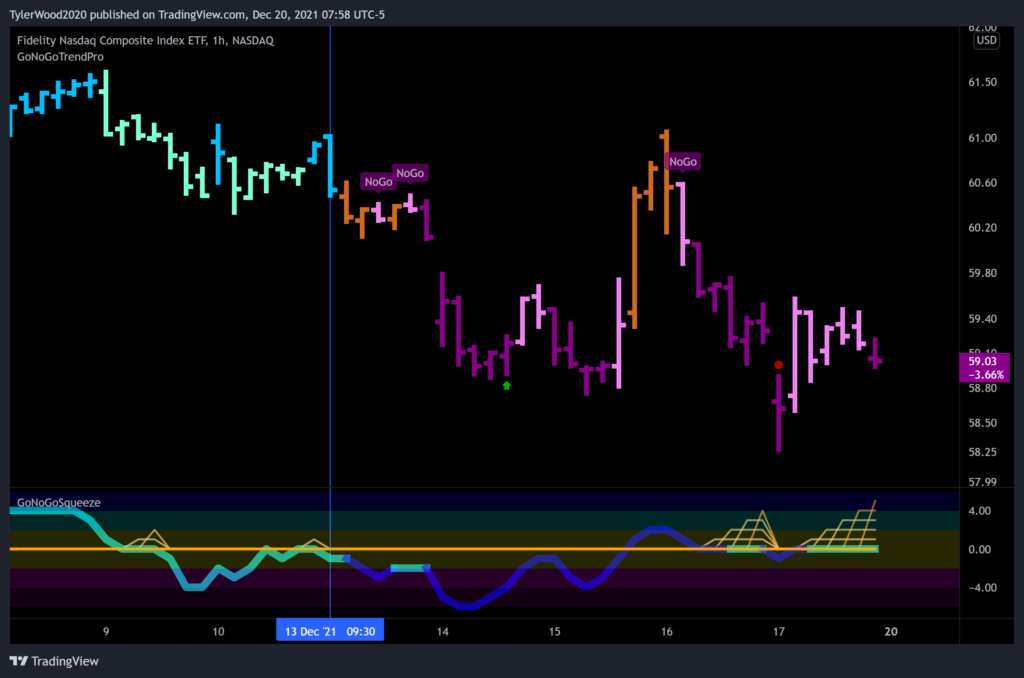
Despite the selling pressure for growth equities this week, GoNoGo Oscillator® spent most of Thursday and Friday at the zero line, building the grid of GoNoGo Squeeze® and signaling the tension between buyers and sellers at these levels. GoNoGo Oscillator will be the first indication of continued selling pressure if it breaks to the downside, or another “buy-the-dip” moment for growth equities if it breaks upward to positive territory and buyers gain momentum.
Multiple Timeframes Offer Perspective
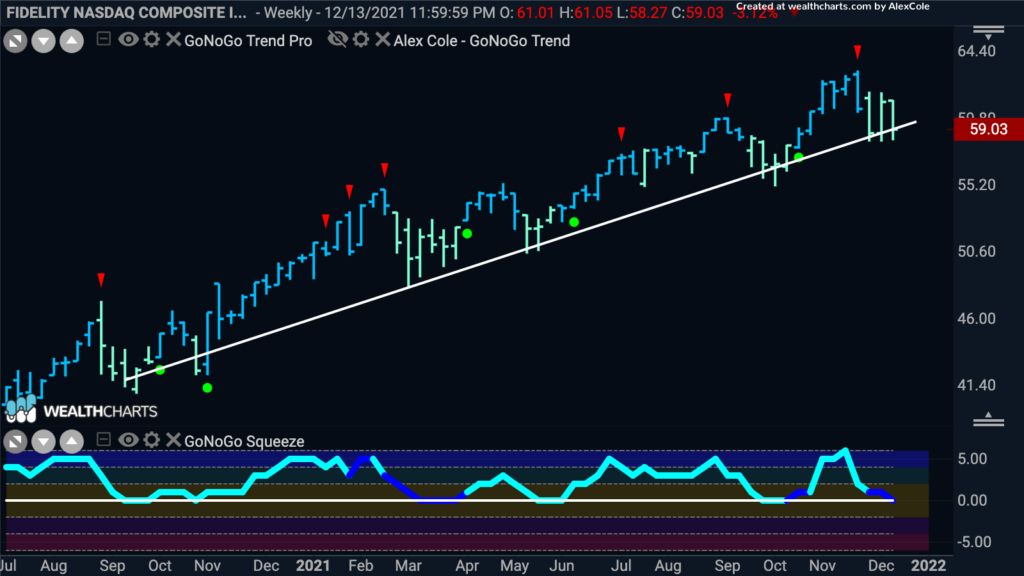
Zooming out from the hourly intraday trading investors can see that weekly closing prices have held the 2021 trendline for the very same NASDAQ Composite ETF. GoNoGo Trend conditions have not fallen out of the “Go” colors since the lows of the 2020 pandemic crash. Interestingly, GoNoGo Oscillator has continuously found support at zero throughout 2021. On a weekly basis, the NASDAQ composite has fallen sharply on heavy volume back to the zero line since the Thanksgiving week (Nov 22nd) countertrend correction arrow. This is a critical moment for the Oscillator to hold the zero line, and price to hold the trendline if the trend is going to continue higher.
Credit Market Signals “Risk-Off”
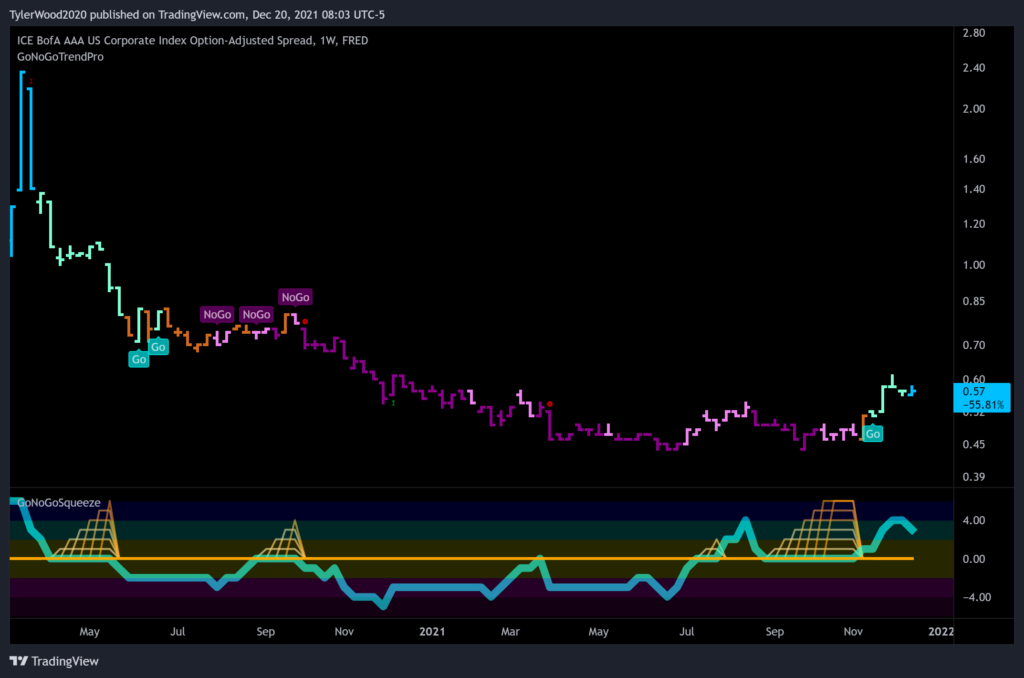
One chart illustrates the paradigm shift in risk assessment since the start of November. See the GoNoGo Trend of option-adjusted corporate bond credit spreads which have now completely reversed trend conditions since Nov 1st, 2021 – from purple & pink “NoGo” bars through amber neutral and now the strongest blue “Go” bars as GoNoGo Oscillator broke out of a max squeeze to reach overbought extremes and consolidating gains:
Credit spreads indicate the credit risk perceived by investors and are dynamic reflecting real-time market conditions, unlike credit ratings which are revised with some lag. They reflect the risk premia that market participants apply to the debt of the issuer, relative to government debt. Or more precisely, the difference in yield between any debt security and the relevant government benchmark of the same maturity. Credit spreads often widen during times of financial stress wherein the flight-to-safety occurs towards safe-haven assets such as U.S. treasuries and other government securities.
Throughout 2021, credit spreads have lingered around historic lows and remained within the tightest decile of the past 25 years. The chart shows they have clearly bottomed and are now rising.
All Eyes on the Fed
The Federal Reserve’s monetary policy meeting on Tuesday and Wednesday appeared to dominate sentiment for much of the week. The FOMC policy decision, as expected, left the target range for the fed funds rate unchanged at 0.00-0.25%. Chairman Powell said it will double the reduction of asset purchases to $30 billion per month ($20 billion for Treasuries and $10 billion for agency MBS); a faster tapering of its monthly asset purchases, which are now expected to stop by the end of March. And, the Fed’s quarterly survey of individual policymakers’ views, released Wednesday, signaled three rate hikes in 2022 (instead of two) amid expectations for continued inflation pressures. Expectations which were driven by a report released Tuesday morning that producer prices jumped 9.6% in November from a year earlier, (up 0.8% month-over-month) the biggest increase since data were first collected in 2010.
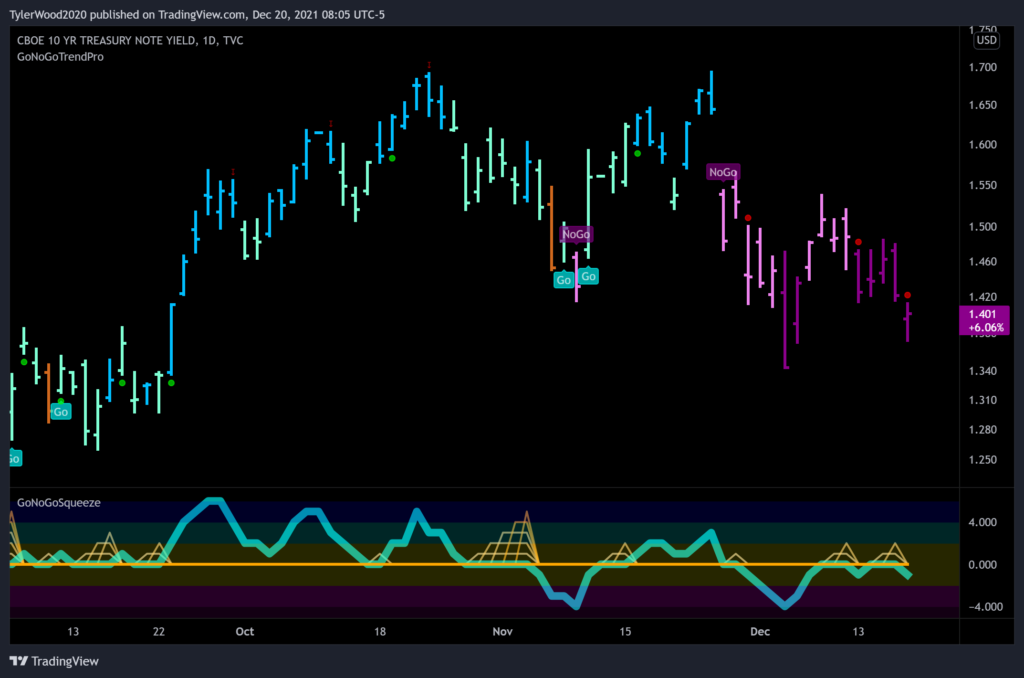
In a week when investors digested a shift in U.S. monetary policy, prices of government bonds rose, sending yields lower. The 10-yr yield fell nine basis points to 1.40% amid the increased demand for government treasuries. See the daily GoNoGo chart below of $TNX showing the oscillator rejected at the zero line twice this week as momentum continues to roll over back into negative territory:
The U.S. Federal Reserve wasn’t the only major central bank to announce a policy shift in response to inflation concerns. The Bank of England raised its key interest rate by 15 basis points to 0.25% on Thursday, becoming the first major central bank to do so during the pandemic. Some central banks in Eastern Europe and Latin America also lifted rates, but the European Central Bank and Bank of Japan left rates unchanged, as expected, and instead announced a further tapering of asset purchases.
Interestingly, the only day the S&P 500 closed higher was Wednesday, when the Fed announced their decisions, and that was largely due to short-covering activity on the view that Fed Chair Powell didn’t sound as hawkish as feared. The market obviously fumbled that rally over the next two days, with fears over the impact of the omicron variant appearing to grow later in the week. Some Wall Street firms put new office restrictions in place in response to a surge in cases. Stocks sold off on Friday morning, but the declines may have been cushioned by growing evidence that omicron, while much more contagious, causes less severe symptoms than prior variants. Consider the daily GoNoGo Trend of the S&p500 below:
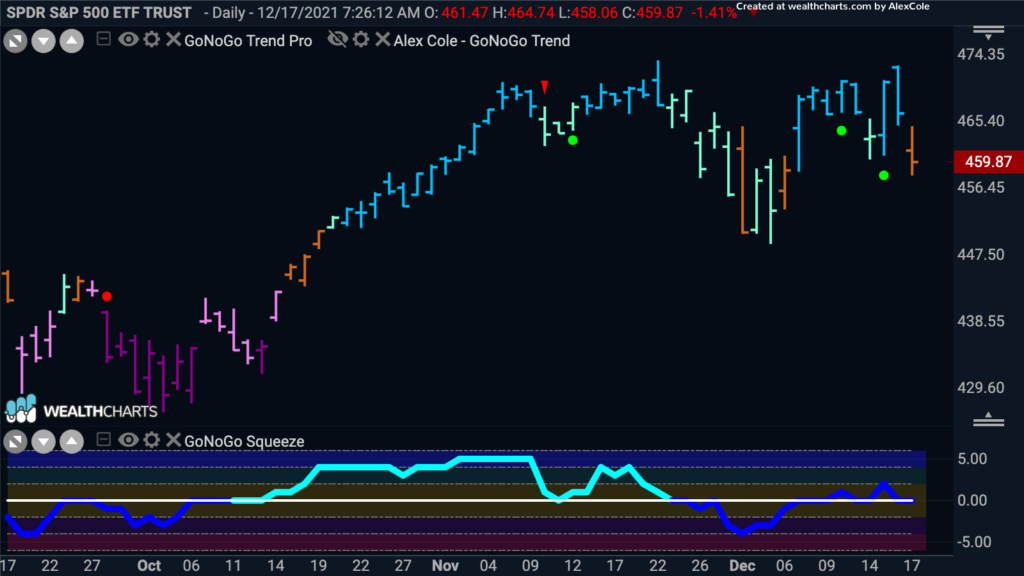
The dark blue line signifies heavy volume accompanied both of GoNoGo Oscillator’s retests of the zero line. The double retest on heavy volume indicates both buyers and sellers jockeying for control as momentum struggles to break out of neutral.
Whiplash Waltz as Sector Leadership Continues the Rotation Dance
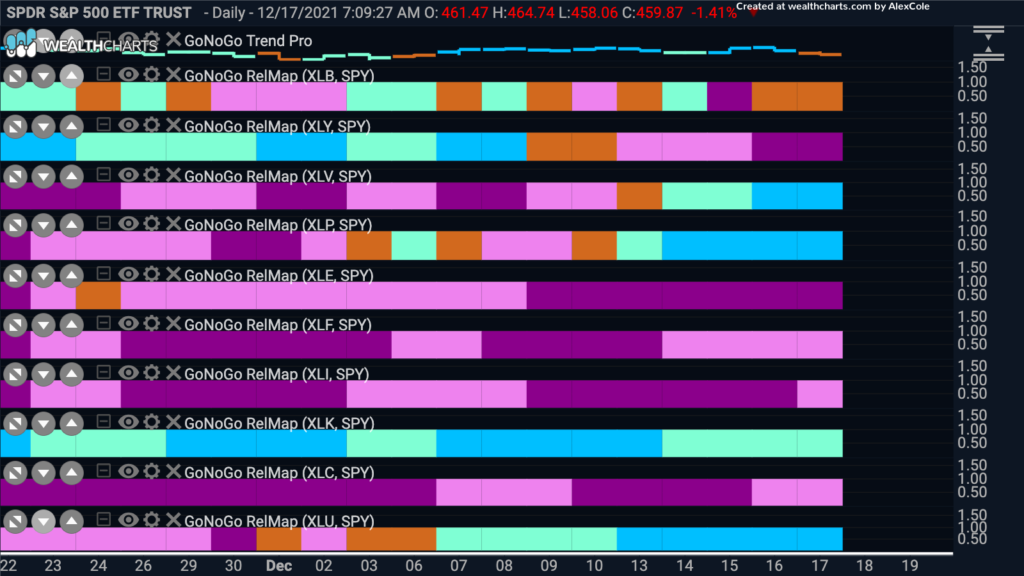
Under the surface of the index performance, we saw sharp rotation away from growth sectors into defensive areas of the market. The information technology $XLK (-5.1%), consumer discretionary $XLY (-4.3%), and energy $XLE (-5.0%) sectors were the weakest performers last week with losses over 4.0%. The defensive-oriented health care (+2.5%), real estate (+1.6%), consumer staples (+1.2%), and utilities (+1.2%) sectors led the market. See the GoNoGo Sector HeatMap below:
Healthy Sector Trends
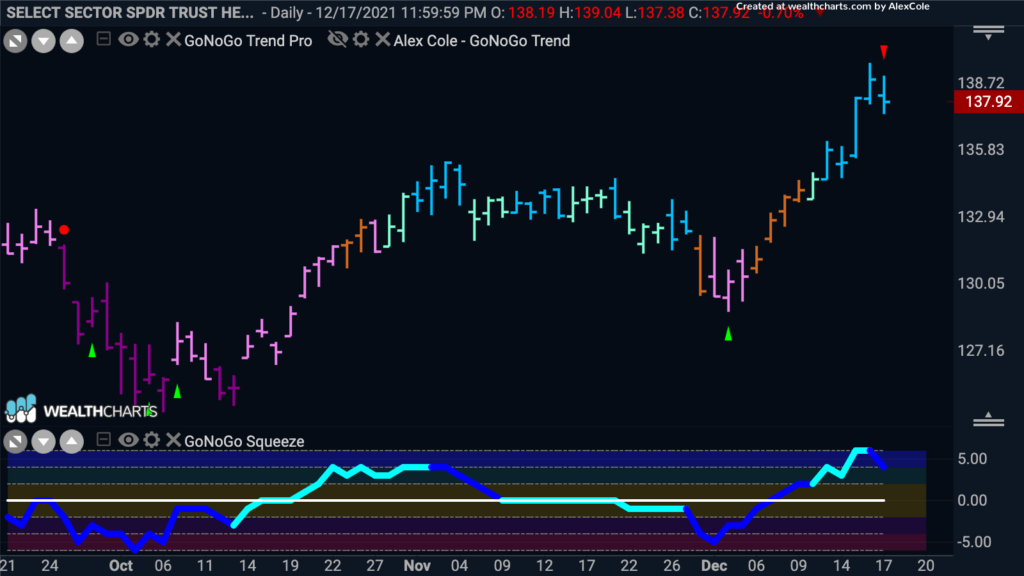
This week we want to focus our analytical lens on the healthcare sector $XLV as it broke out to new all-time highs this week and outperformed every sector of the S&P 500. See the daily GoNoGo Chart below which rallied on strong blue bars all week after the “Go” trend was flagged last Friday:
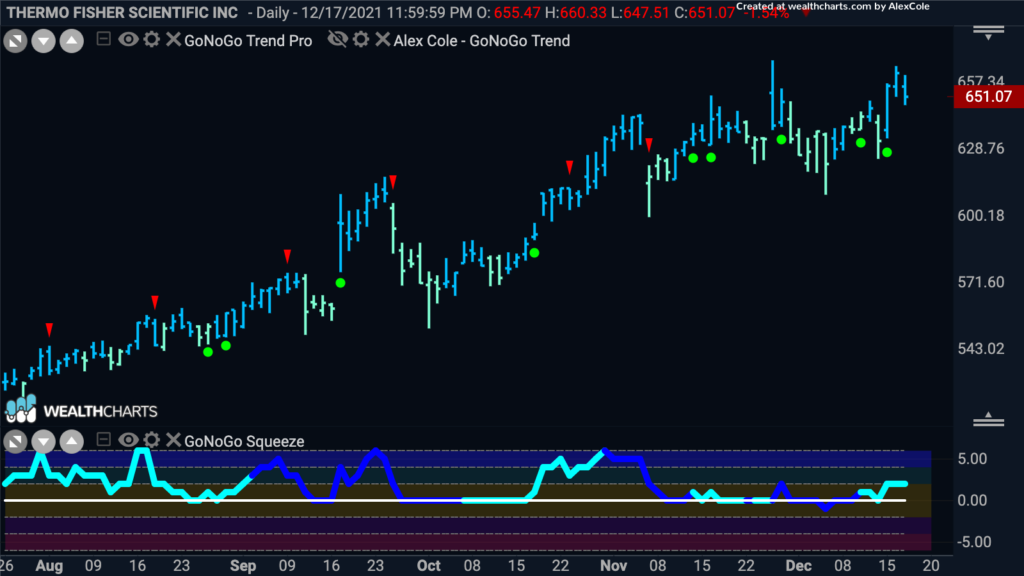
Within Healthcare’s top holdings, Thermo Fisher Scientific Inc $TMO has provided steady leadership for months, outperforming the sector on a relative basis since June 17th and an uninterrupted “Go” trend on an absolute basis. Thermo Fisher Scientific is an American supplier of scientific instrumentation, reagents, and software services with a market cap of $256 Billion. See the daily GoNoGo Trend chart below finishing at all-time highs on a weekly closing basis:
BioTech Under the Microscope
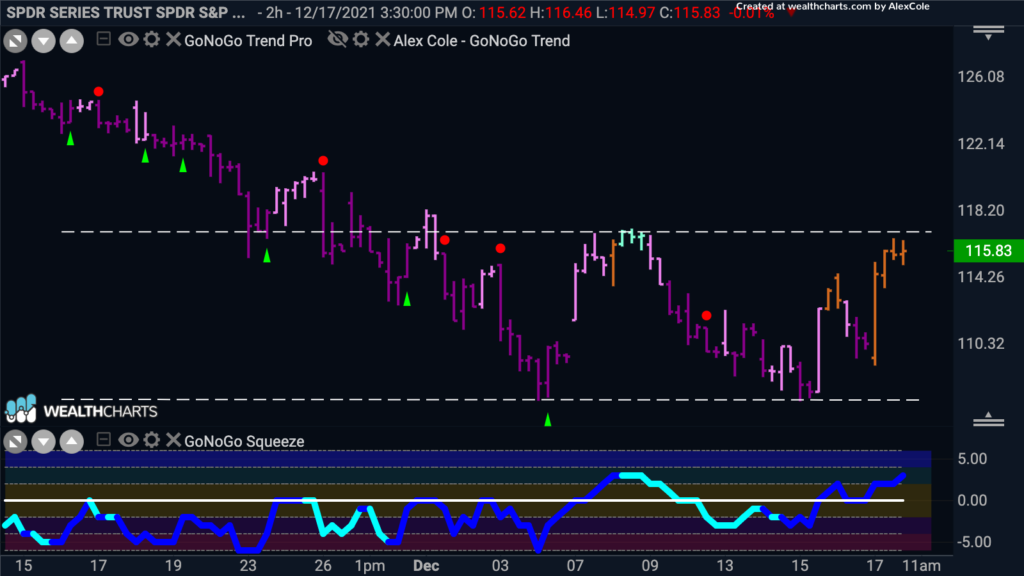
The shift in the outlook for U.S. interest-rate increases weighed on some big and fast-growing technology stocks last week, but within the healthcare sector, Biotech $XBI traded up over 5% and may be showing signs of a bottom. The GoNoGo Chart below shows 2hr bars for trading of the Biotech ETF $XBI which may have completed a double bottom and has returned to prior levels of overhead supply. The trend conditions are neutral, but GoNoGo Oscillator is positive, rising toward overbought on heavy volume. Will this be the week for a breakout or another fake-out?
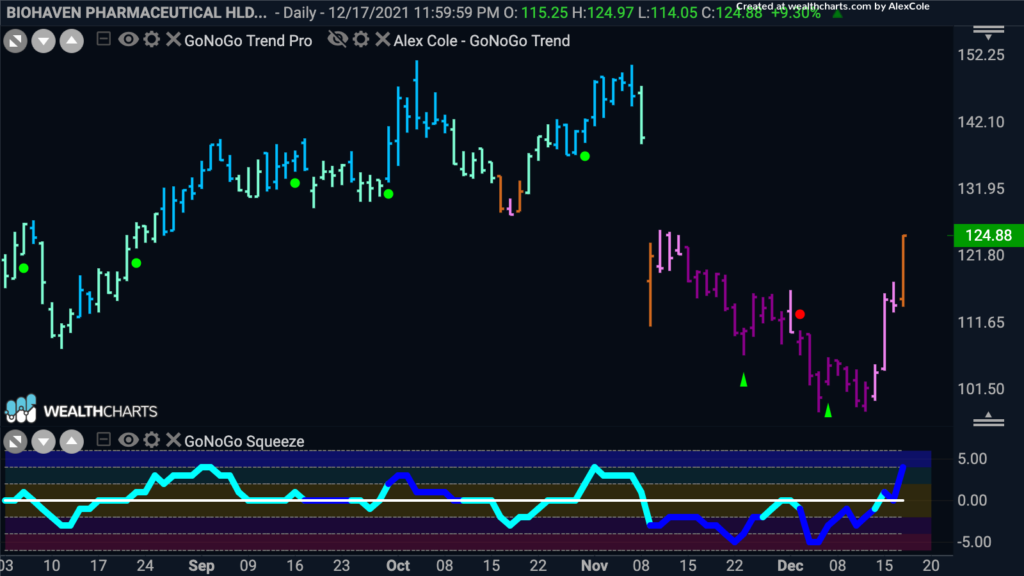
Compared to other Industry Groups such as Health Care Services $XHS, Health Care Equipment $XHE, and Pharmaceuticals $XPH, biotech offers some companies worth considering. See the chart below of Biohaven Pharmaceutical Holding Co $BHVN:
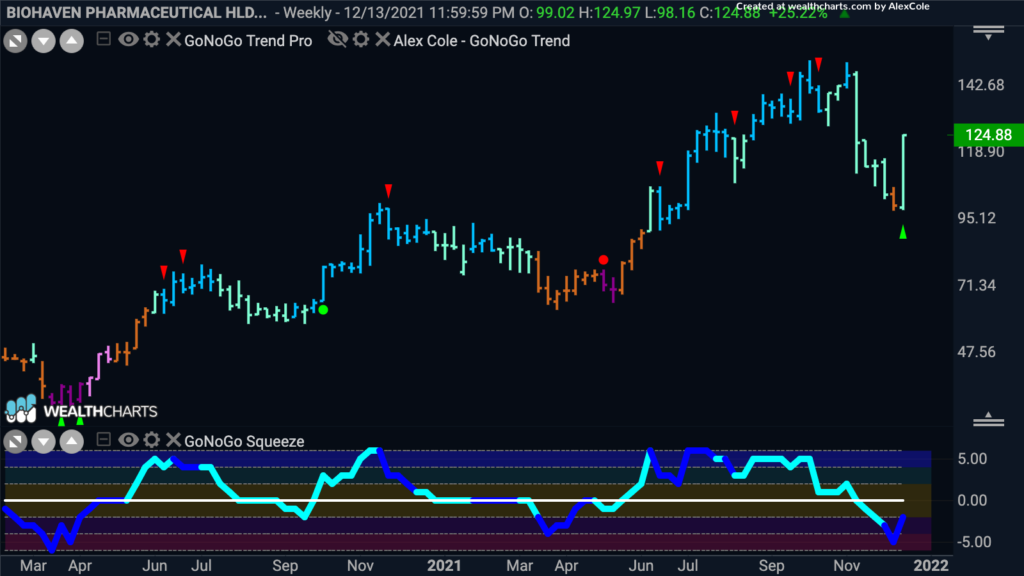
On a Weekly chart of Biohaven below, we can see the primary trend has an established upward bias, despite periods of correction in March and April of 2021. Last week returned GoNoGo Trend to an aqua bar on large positive gains. Momentum is still climbing back from oversold on heavy volume. A rally of GoNoGo Oscillator through the zero line into positive momentum would provide $BHVN the potential to reclaim former highs and beyond.
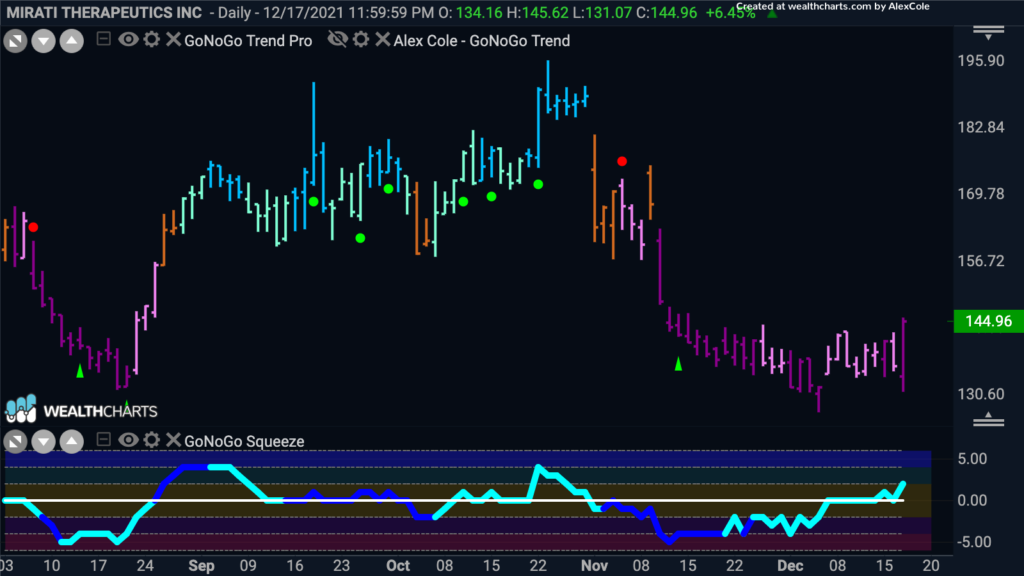
And finally, Mirati Therapeutics, Inc. appears to be a company at a pivotal point. Friday’s bullish engulfing price action on the daily chart below pairs well with a breakout from a retest of the zero line in the GoNoGo Oscillator to suggest a potential trend reversal for $MRTX this week. It is highly speculative at this point but has a very clearly defined risk at $134 and the potential for a quick rally back up to the $189 level.
Please note, US markets will be closed this Friday in observance of the Christmas holiday. Alex and Tyler will be HoHoHo-ing with their families but will be back to GoNoGo-ing next Thursday, Dec 30th with a special edition of Flight Path providing a year-end review.


