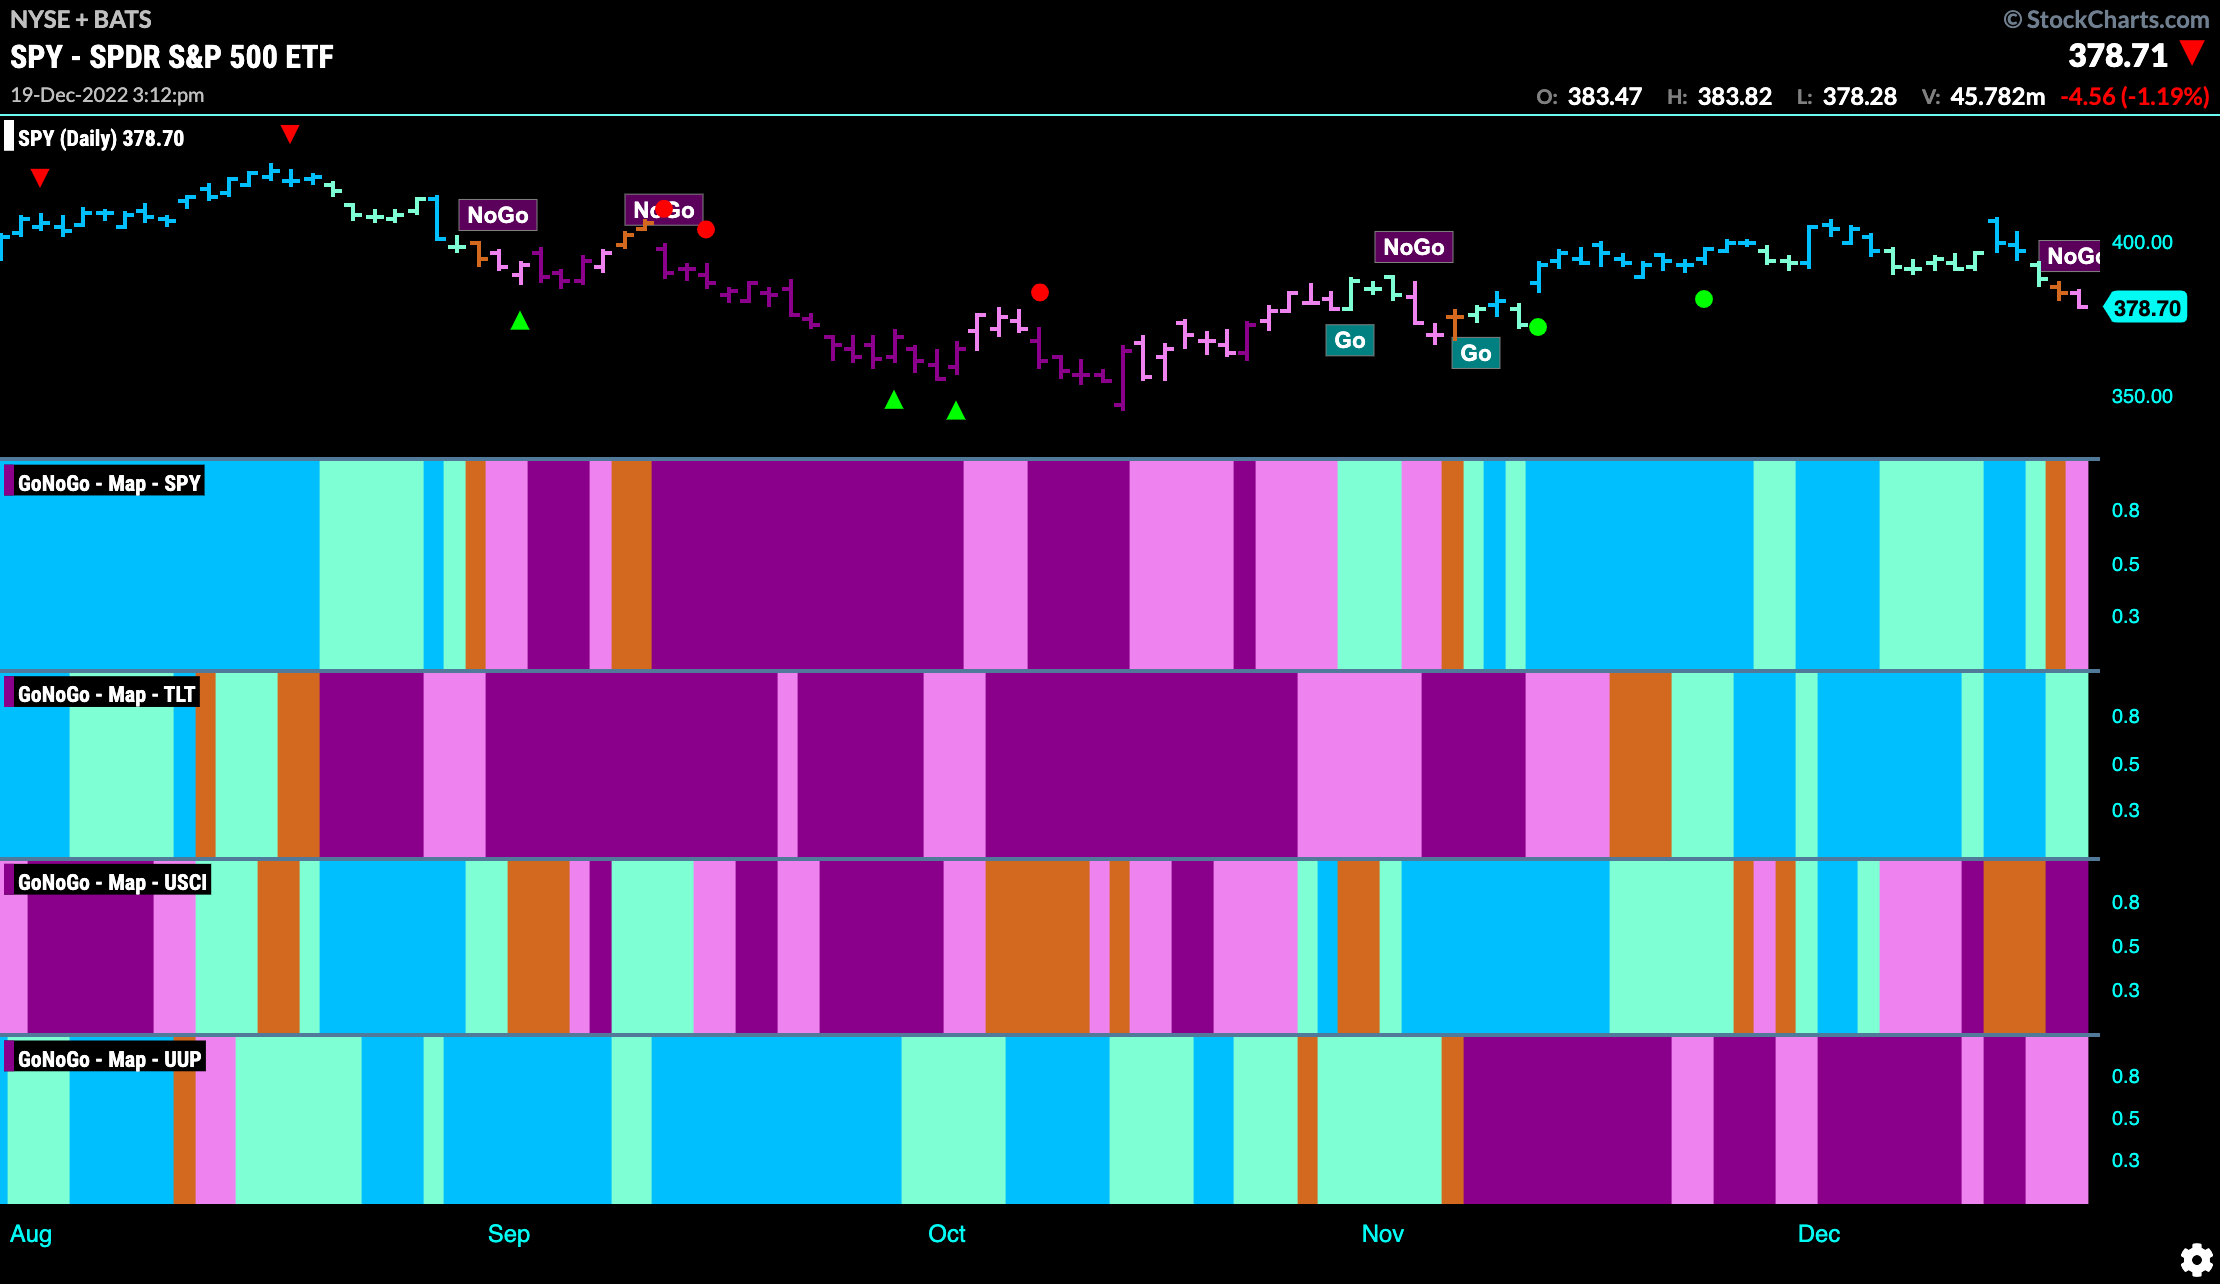
Good morning and welcome to this week’s Flight Path. Let’s take a look at the GoNoGo Asset map below. Don’t look now… U.S. equities have entered a “NoGo” trend as we see a pink bar to start the week. Treasury bond prices are holding on to the “NoGo” trend and there has been a strong return to “NoGo” bars for commodities. The U.S. dollar maintains its “NoGo” trend as well but paints weaker pink bars to end the week.
“NoGo” Emerges in U.S. Equities
After looking for support at the horizontal support level it failed and dropped below on an amber “Go Fish” and then pink “NoGo” bar. This was after the GoNoGo Oscillator broke below the zero line and was turned away on the retest with heavy volume. 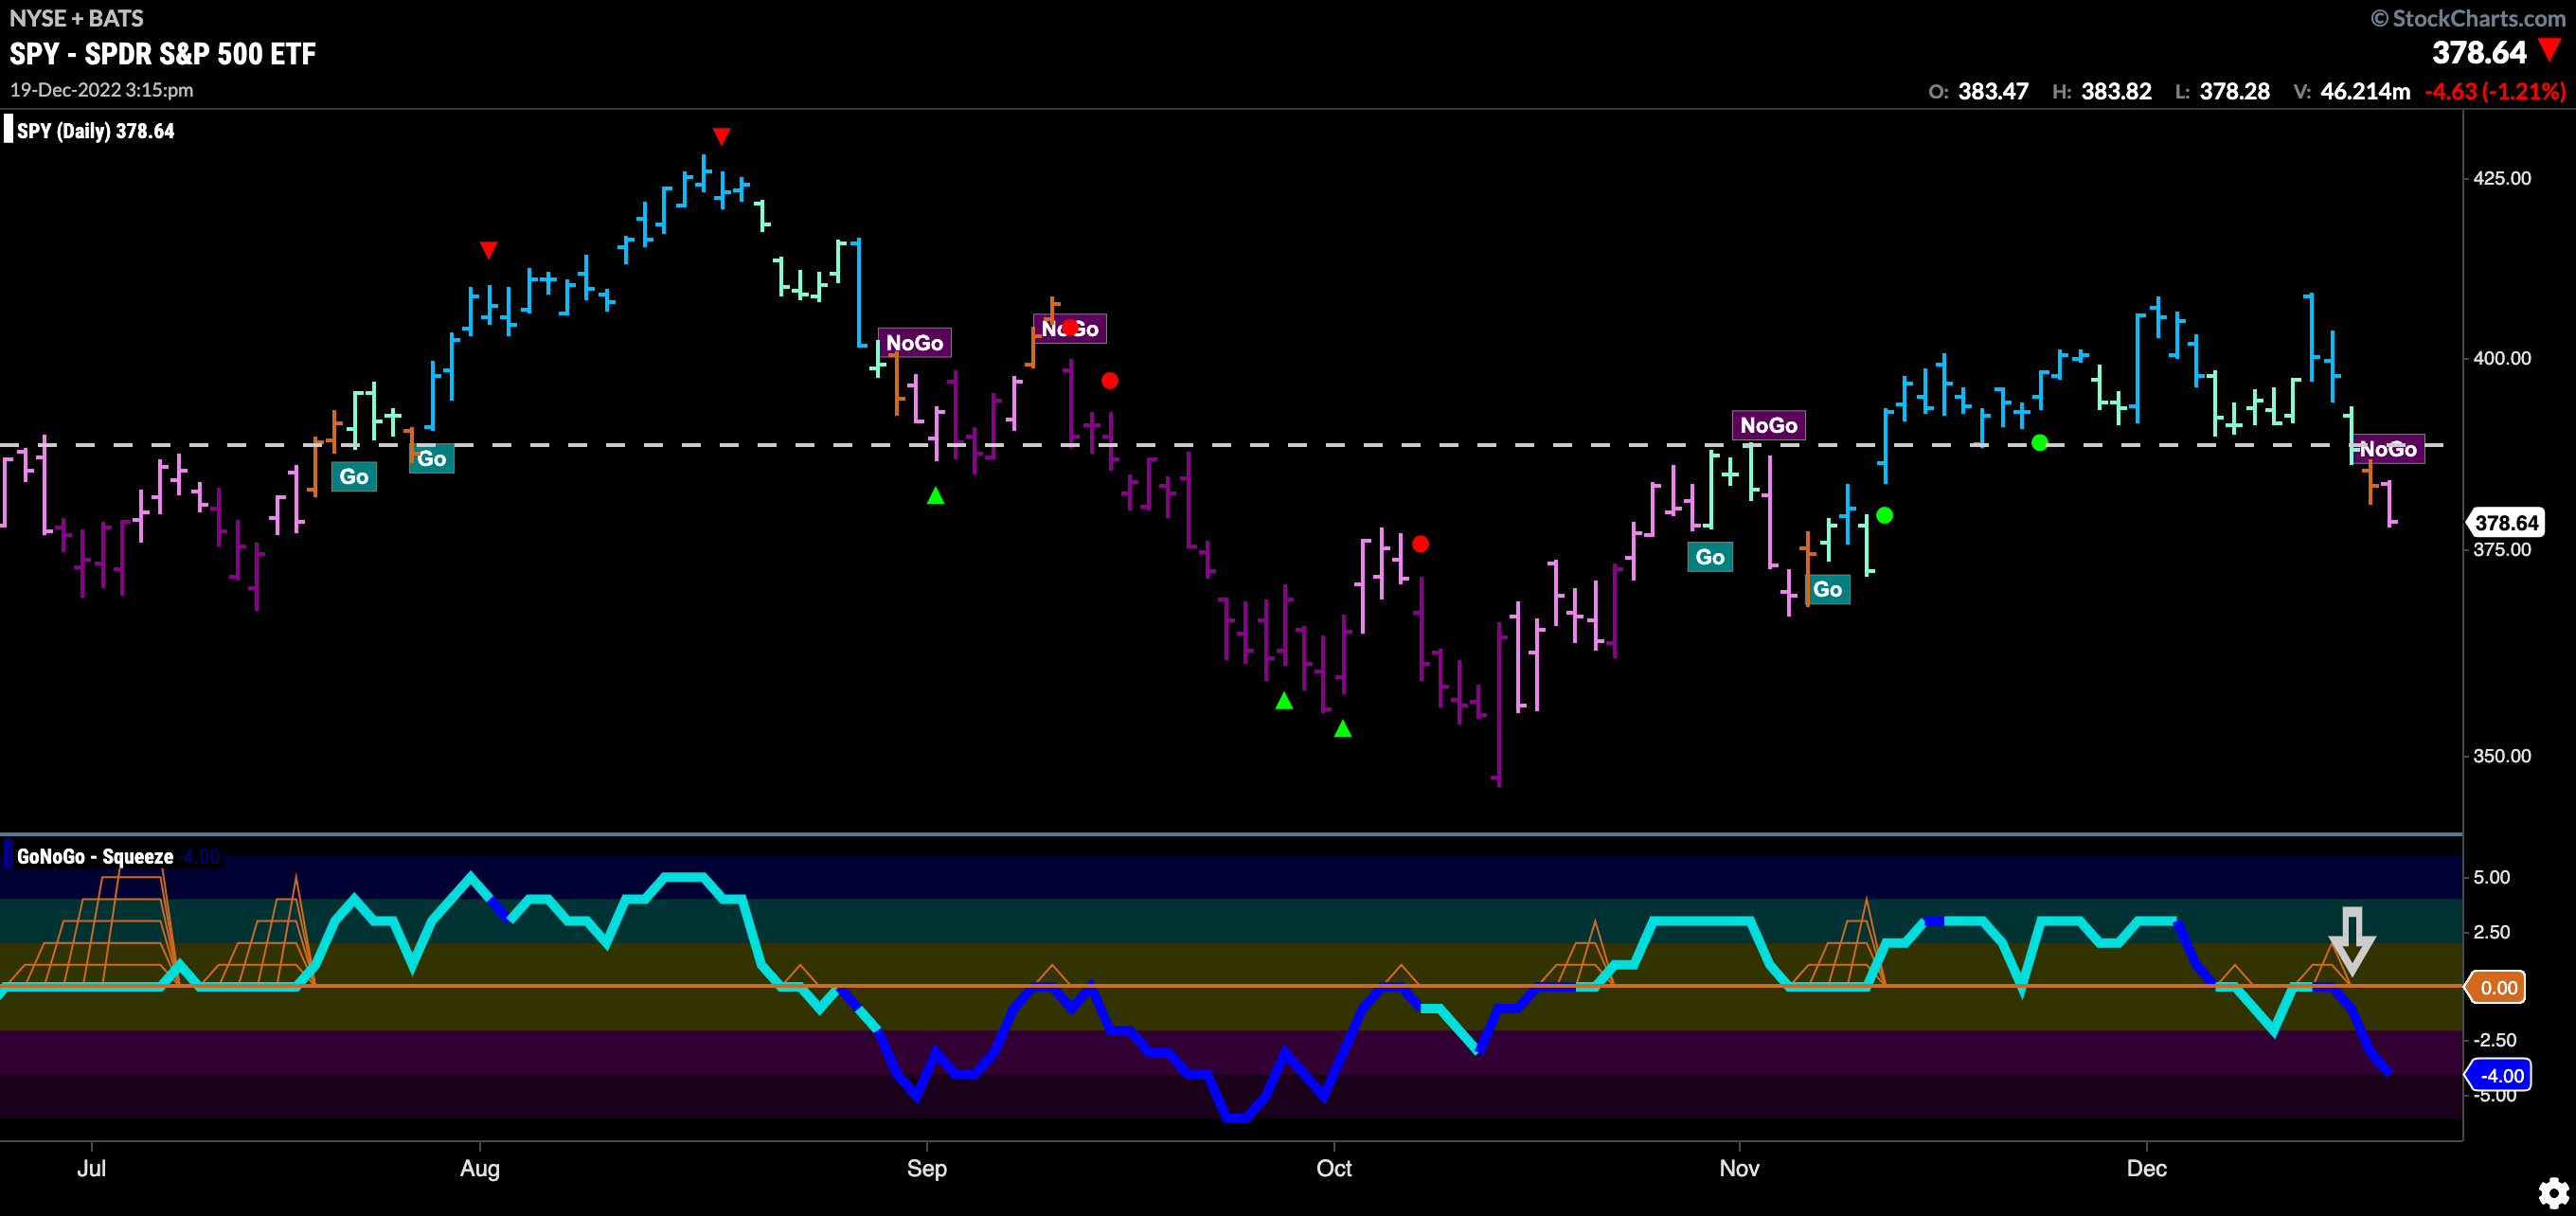
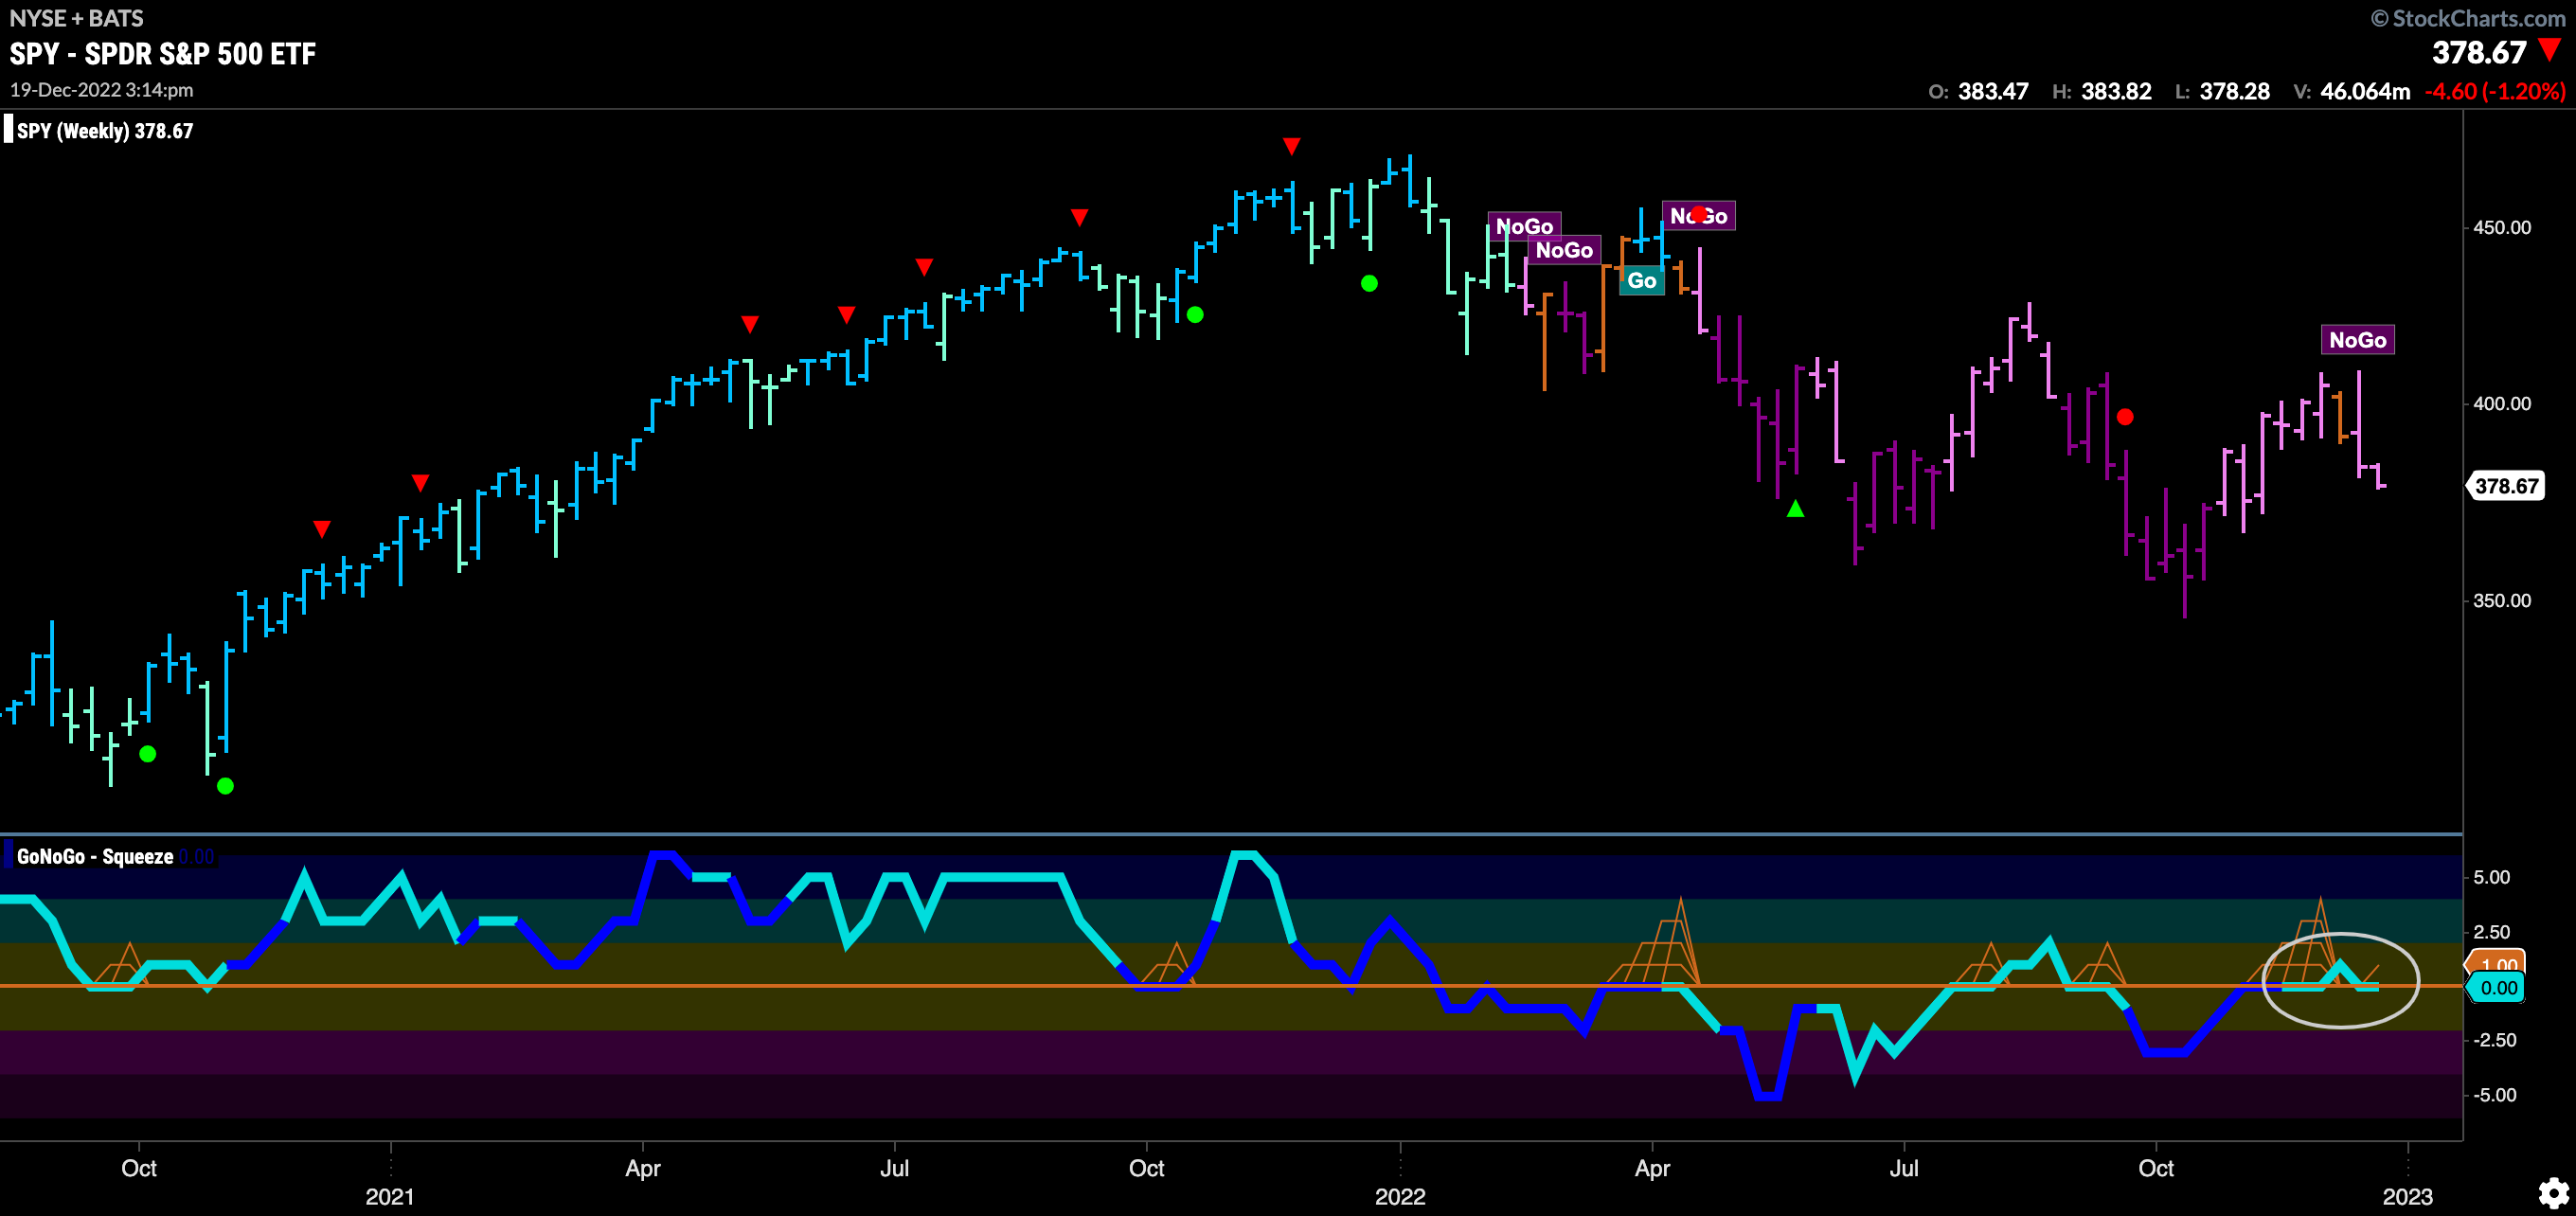
The longer term weekly chart shows that the “NoGo” remains in tact and we appear to have set another lower high. GoNoGo Oscillator is back at the zero line. It will be important to see in which direction the oscillator moves from here forward. If it moves back lower into negative territory then we can say that momentum is once again resurgent. in the direction of the “NoGo” trend.
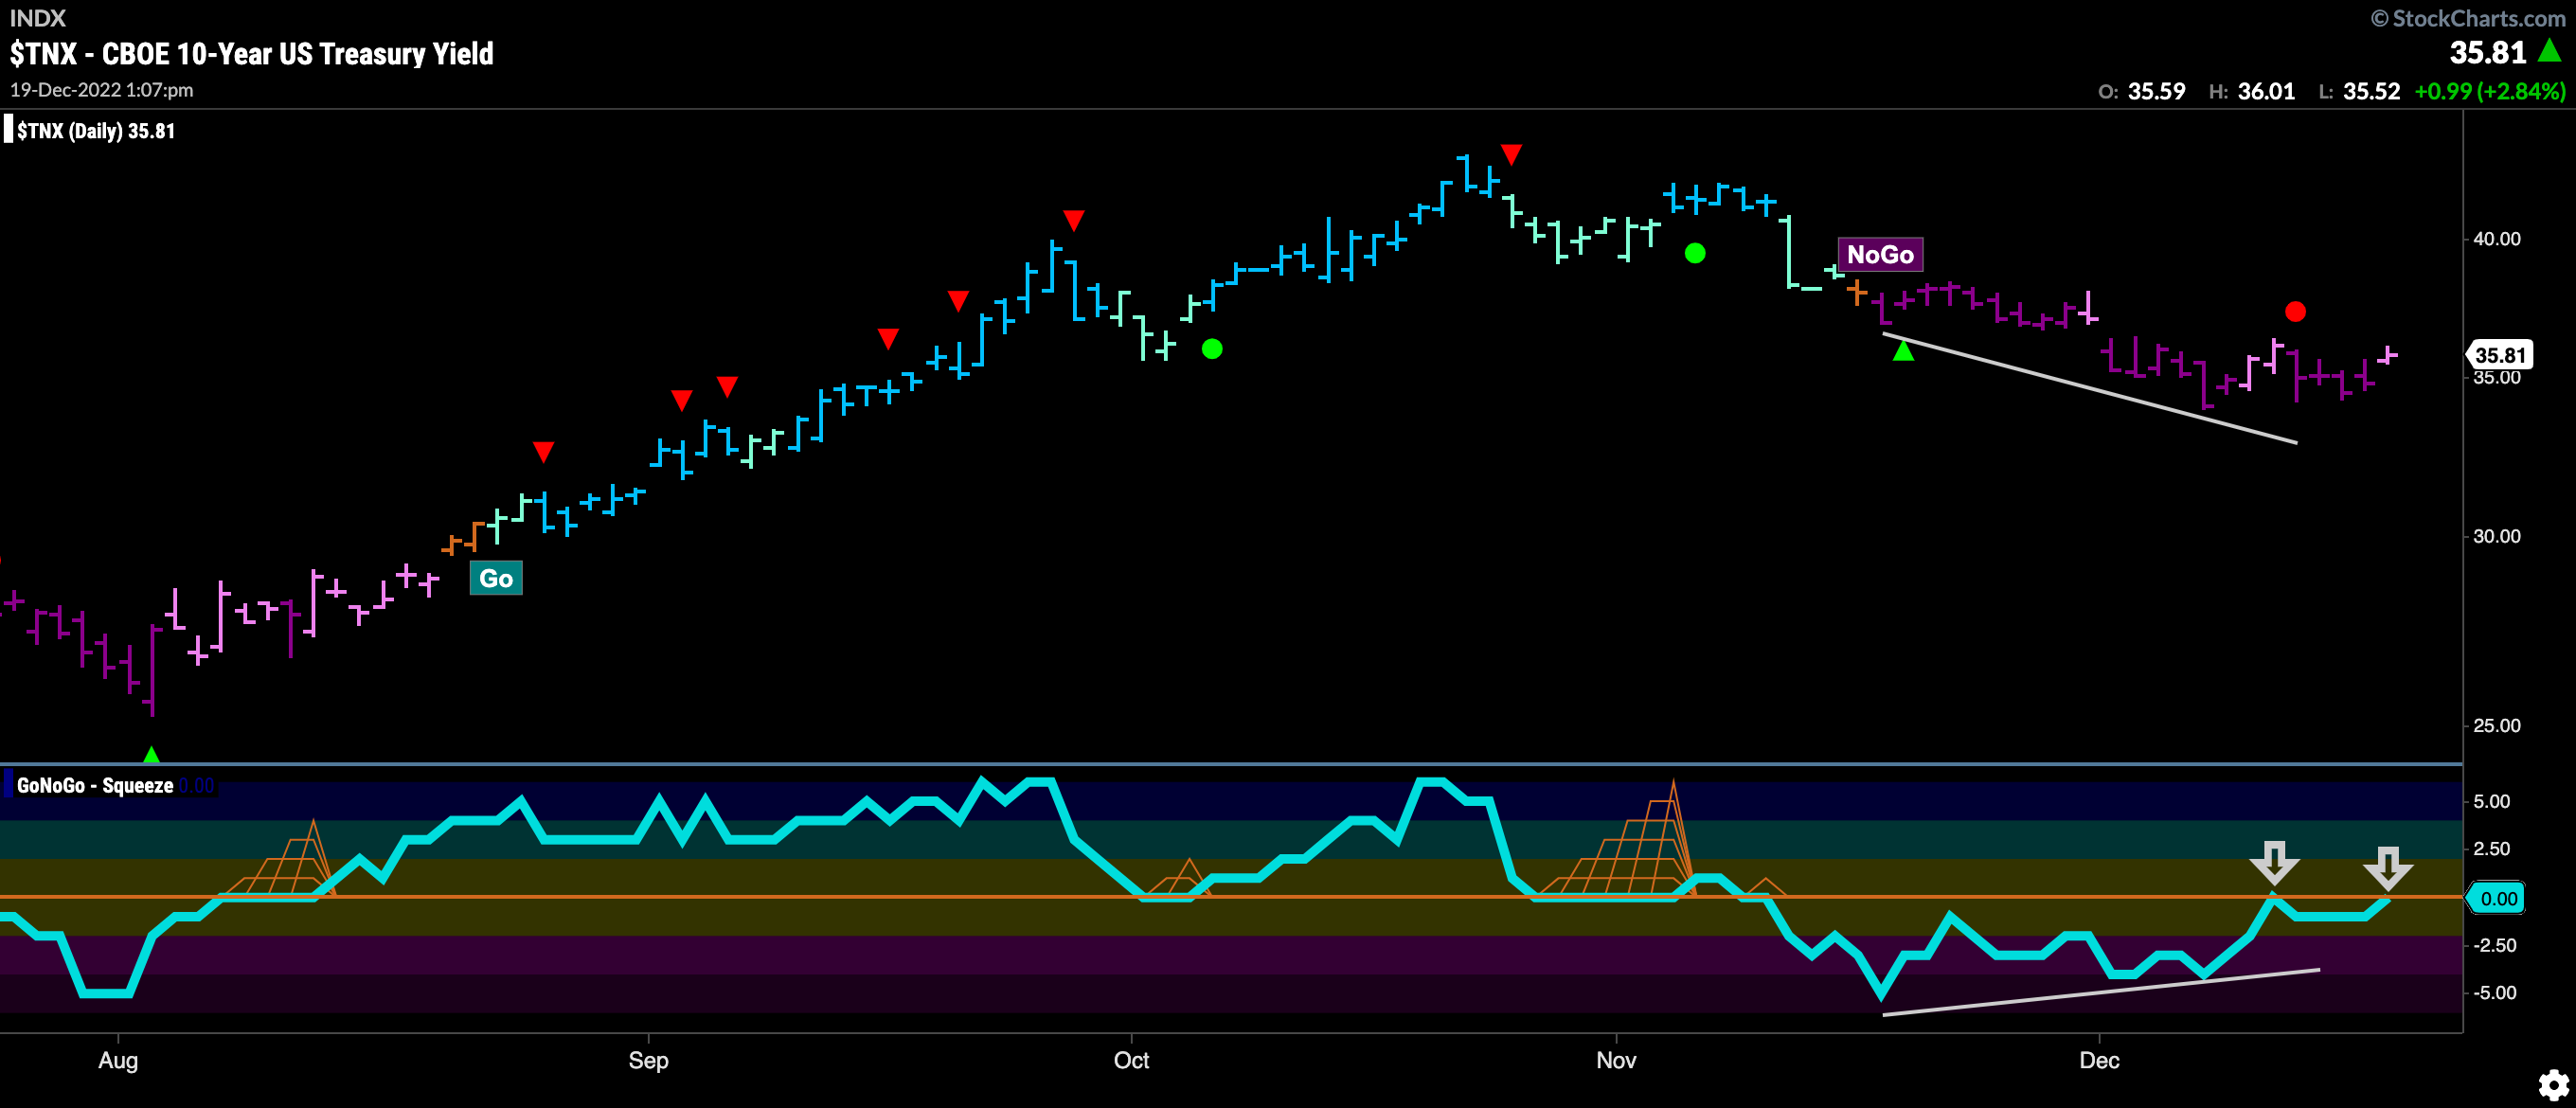
Treasury Rates in “NoGo” and Testing Resistance
The “NoGo” trend continues in rates although we are seeing some signs of weakness in the trend. Price is edging higher and paints a pink bar and there is bullish divergence between the lower lows in price and the higher lows in the oscillator. We see how the oscillator is testing the zero level for the second time. We will look to see if it gets rejected here again or if it is able to break into positive territory.
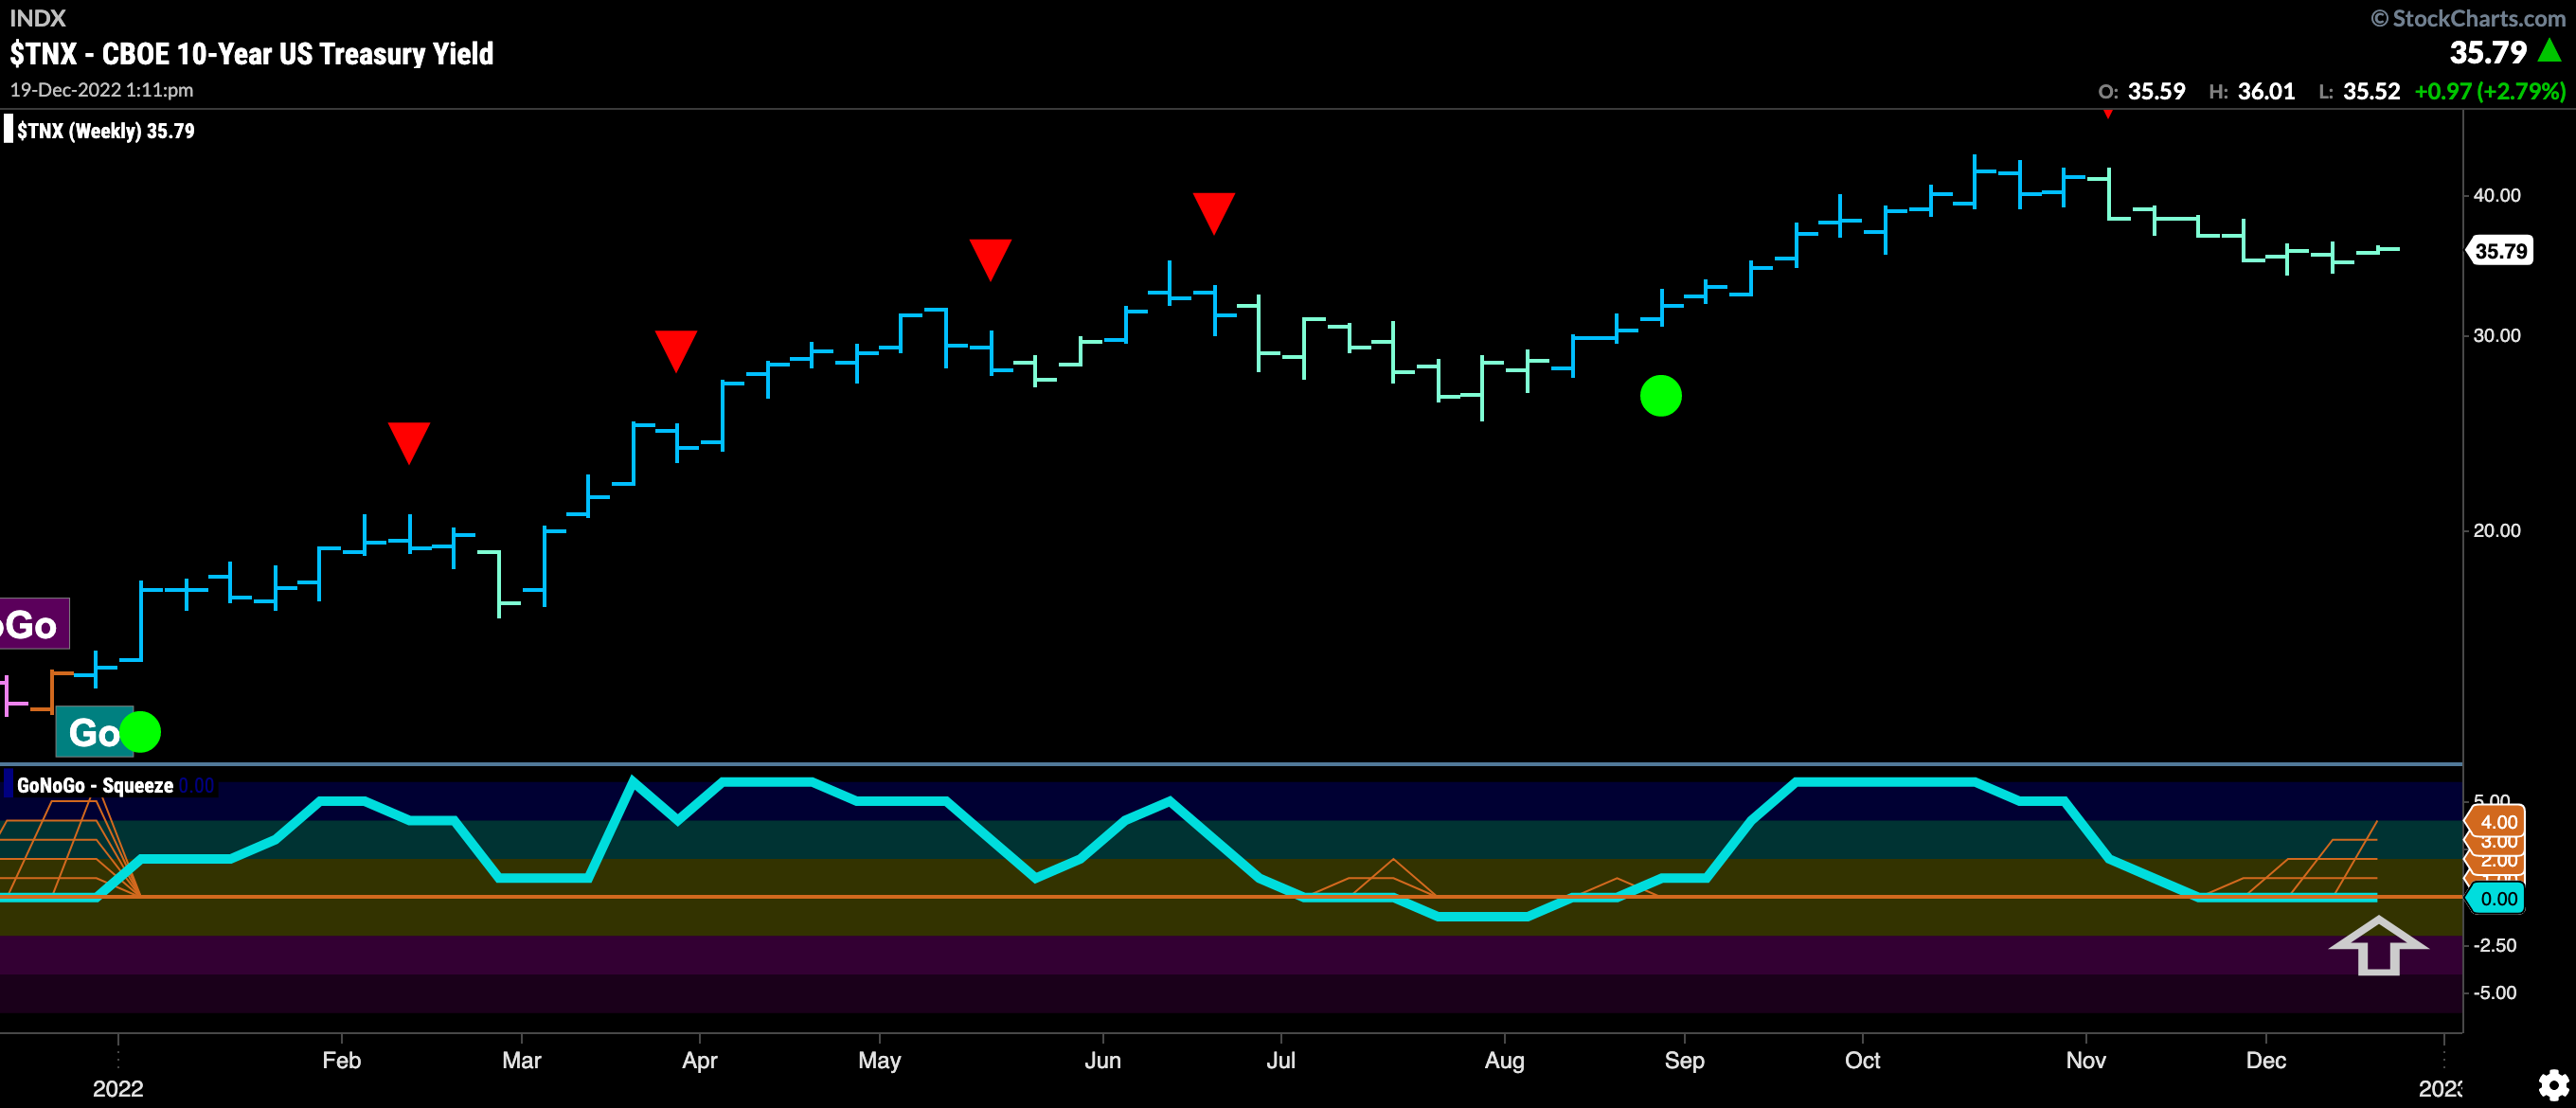
On the longer term chart we see GoNoGo Oscillator at the zero line and staying there as price volatility has shrunk. Because of this we see the beginnings of a GoNoGo Squeeze as the amber grid builds. If this longer “Go” trend is to persist, we would expect the oscillator to break out of the Squeeze into positive territory.
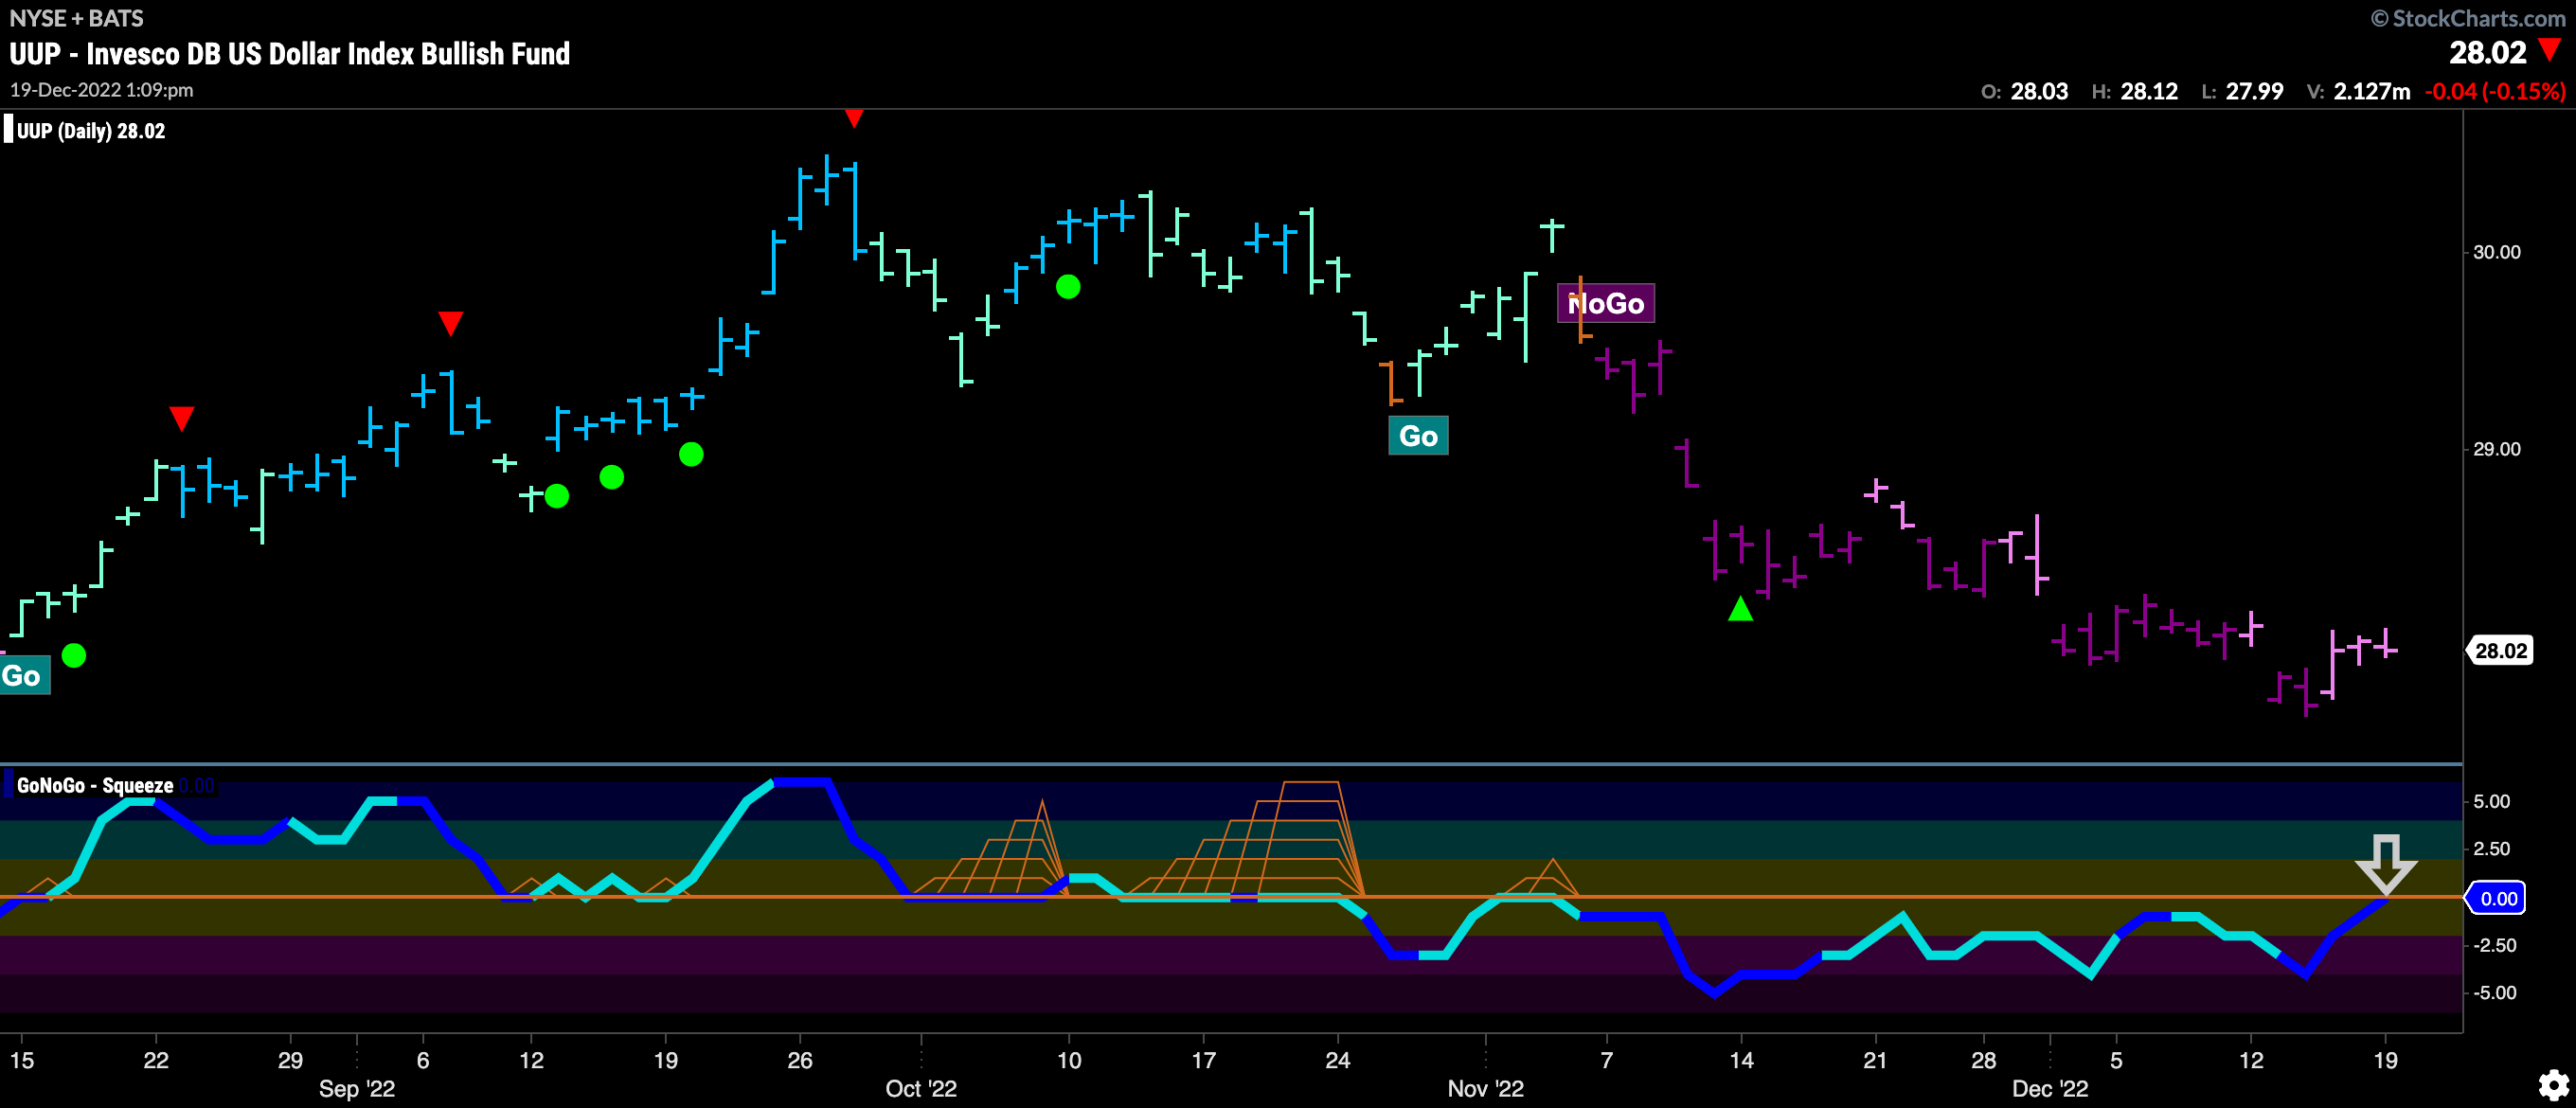
The Dollar Sees GoNoGo Oscillator Test Zero
Price continues to fall and we saw a new low earlier last week. As the week ended though we saw a return to weaker pink “NoGo” bars. GoNoGo Oscillator at the same time has risen to test the zero line from below on heavy volume. We will look to see if the “NoGo” trend persists with fresh momentum in the direction of the trend.
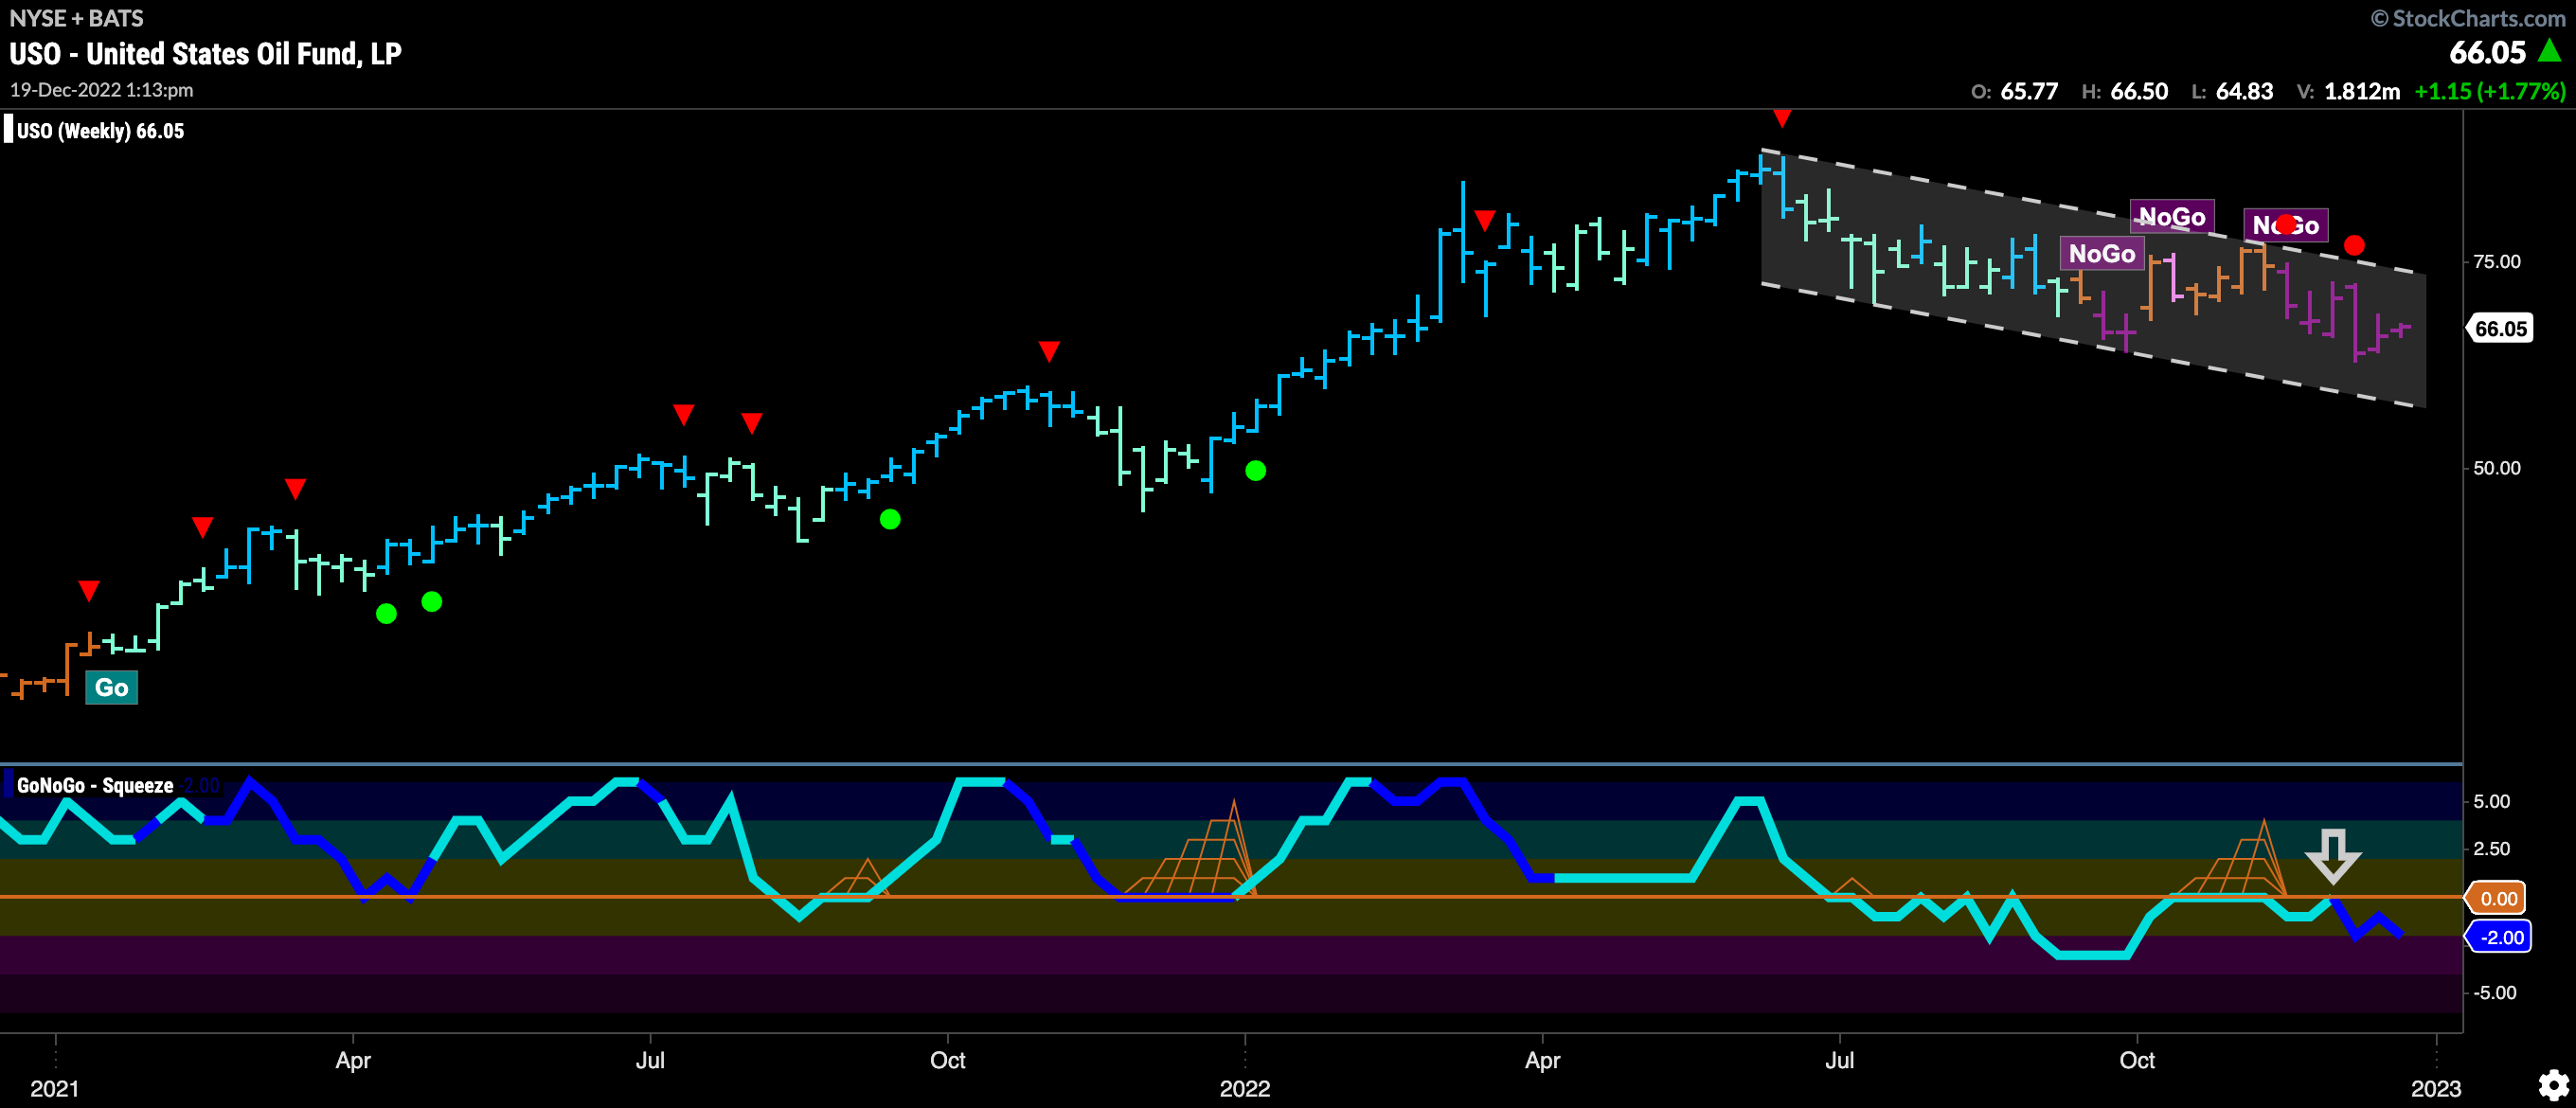
“NoGo” in Oil Seems Locked In
Price is firmly entrenched in a downward sloping channel with GoNoGo Oscillator staying below zero confirming the “NoGo” trend. We have seen the oscillator turned away from the zero line on heavy volume as price sees GoNoGo Trend paint strong purple “NoGo” bars as it moves toward the lower half of the channel.
Sector RelMap
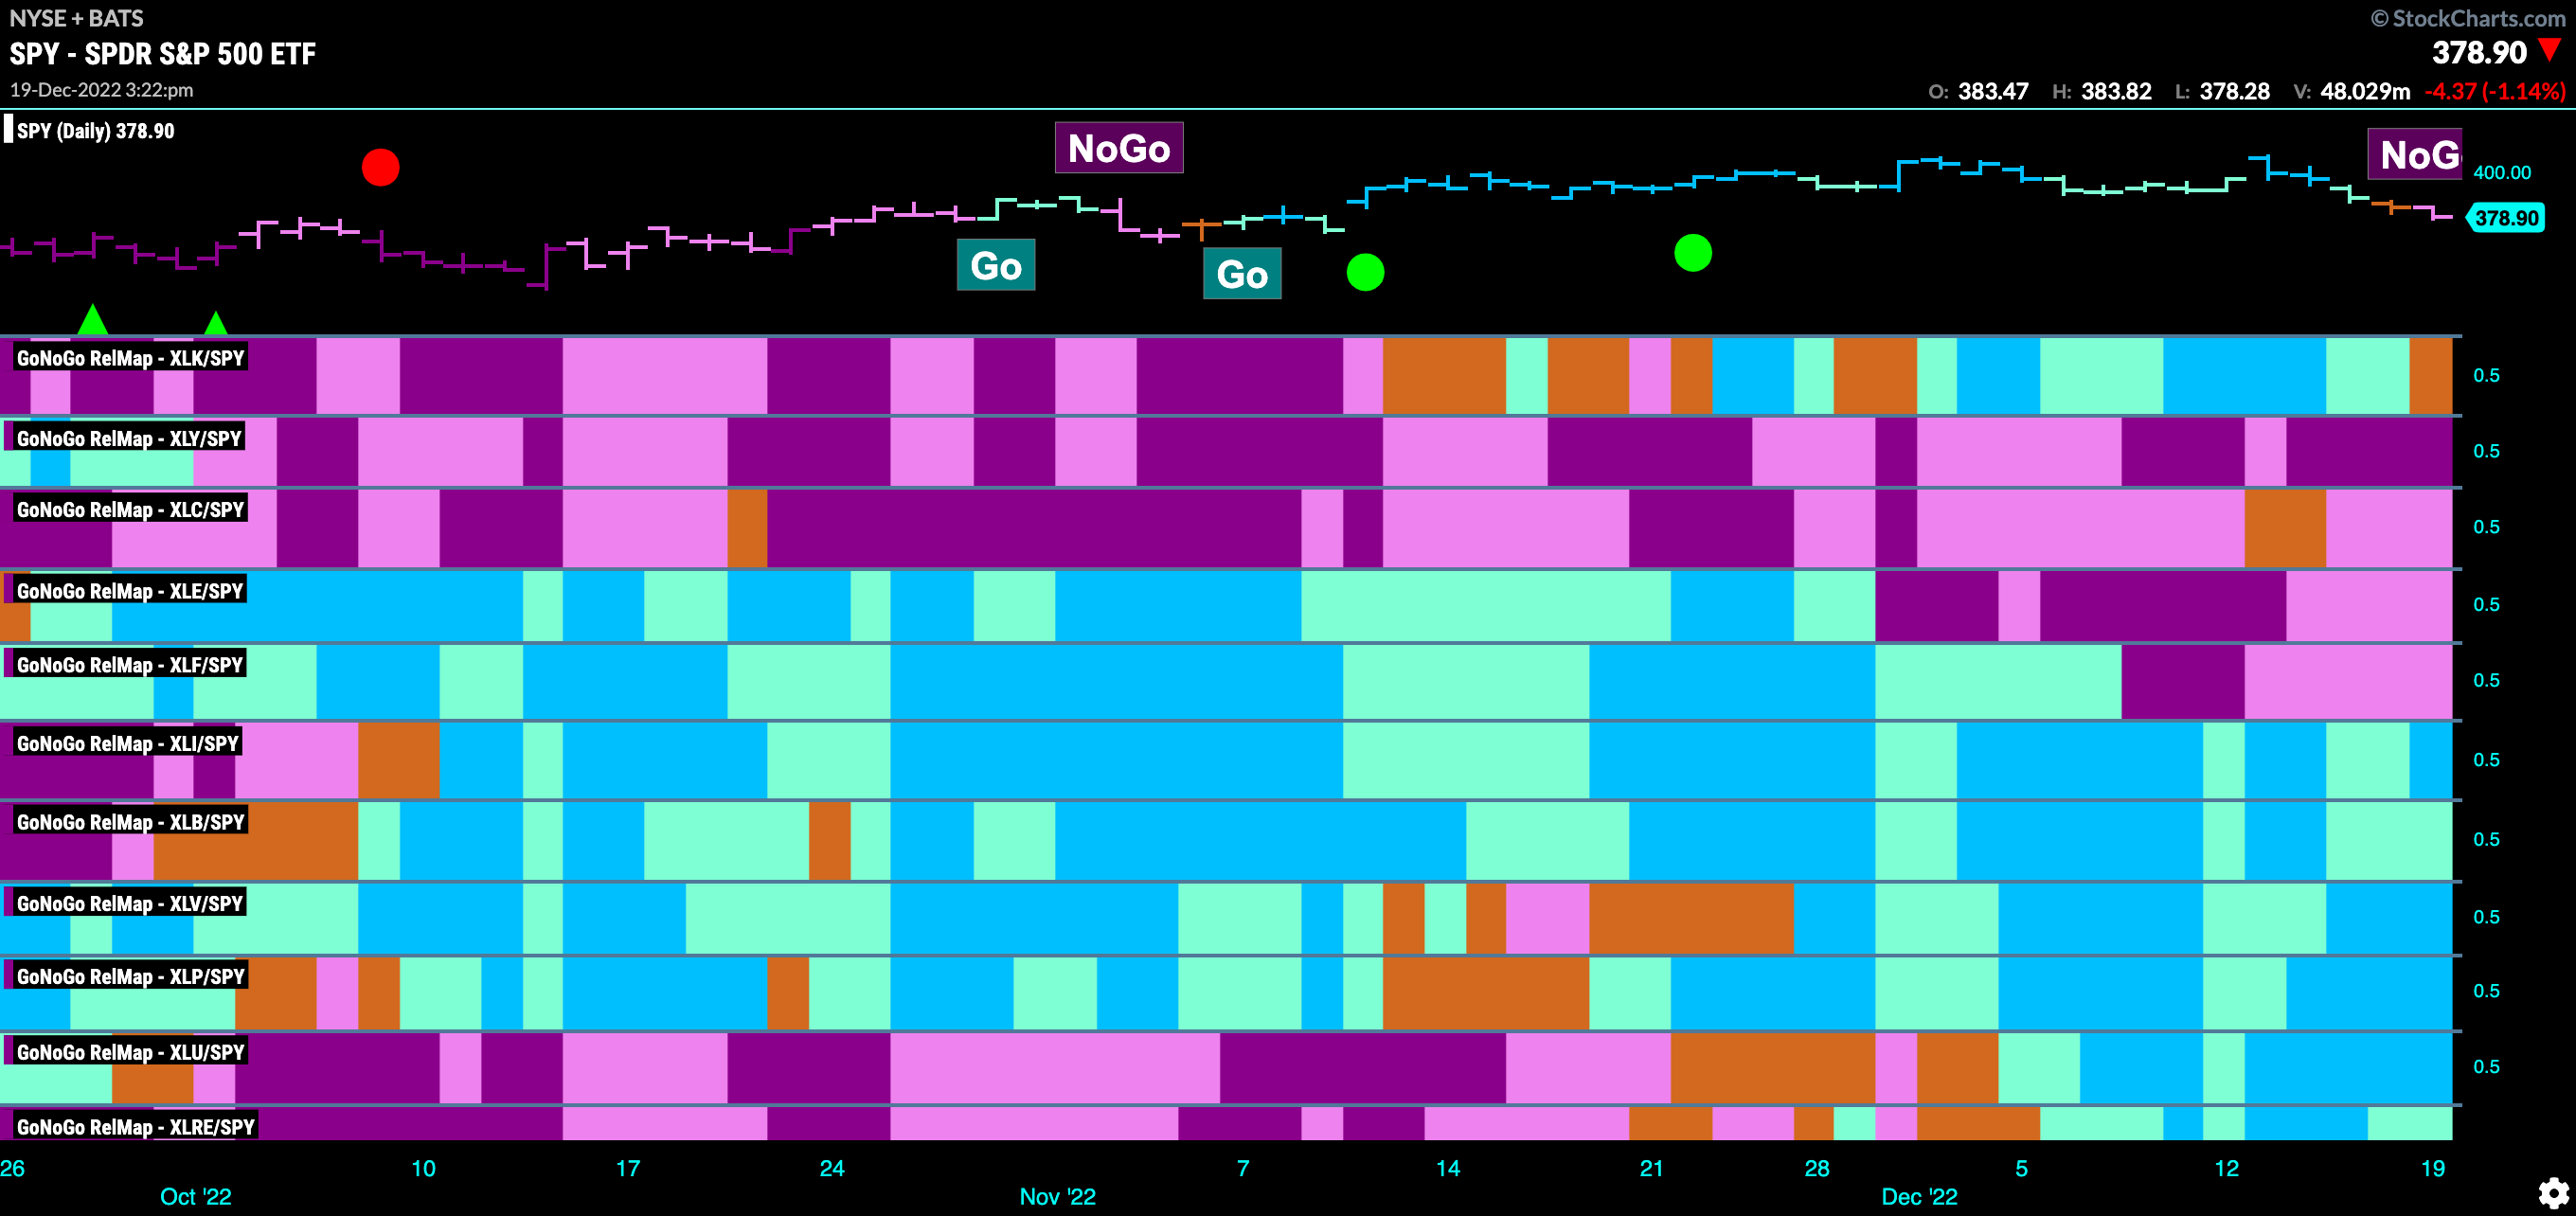
Below is the GoNoGo Sector RelMap. This GoNoGo RelMap applies the GoNoGo Trend to the relative strength ratios of the sectors to the base index. Looking at this map, we can quickly see where the relative outperformance is coming from as well as which sectors are lagging on a relative basis. 6 sectors are outperforming the base this week. $XLI, $XLB, $XLV, $XLP, $XLU, and $XLRE, are painting “Go” bars.
$XLI Fails to Find Support at Zero
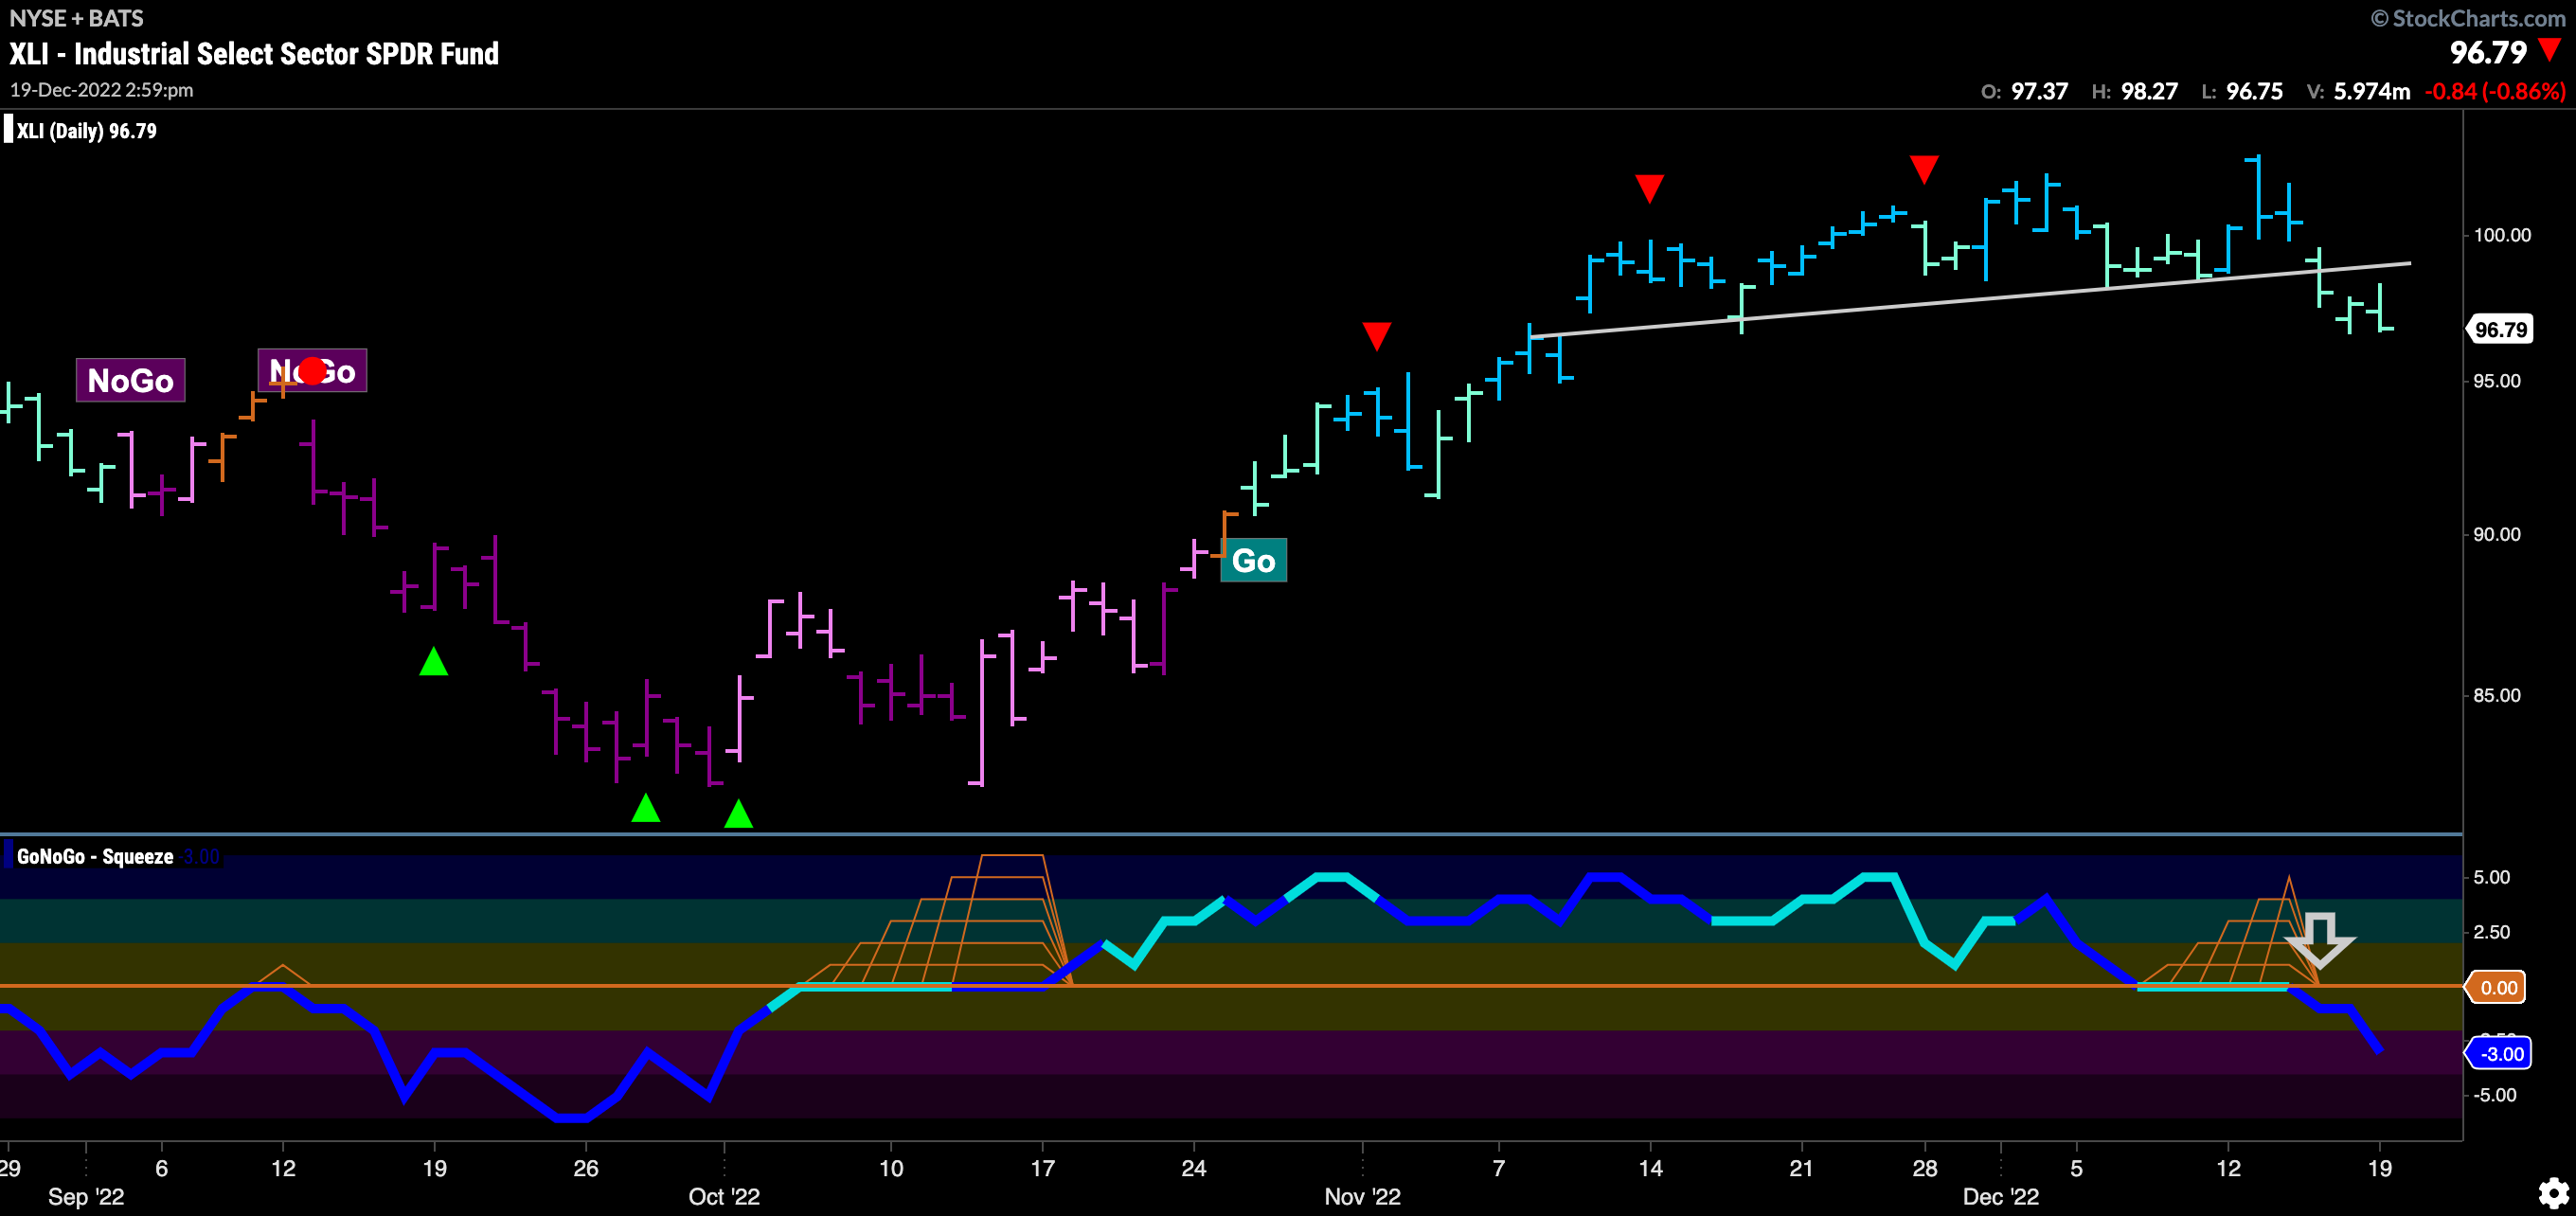
After falling below rising support, price continues to paint weaker aqua bars. GoNoGo Oscillator was riding the zero line while price looked for support and we saw a GoNoGo Squeeze build. GoNoGo Oscillator broke out of the GoNoGo Squeeze into negative territory on heavy volume. We will look for further price deterioration.
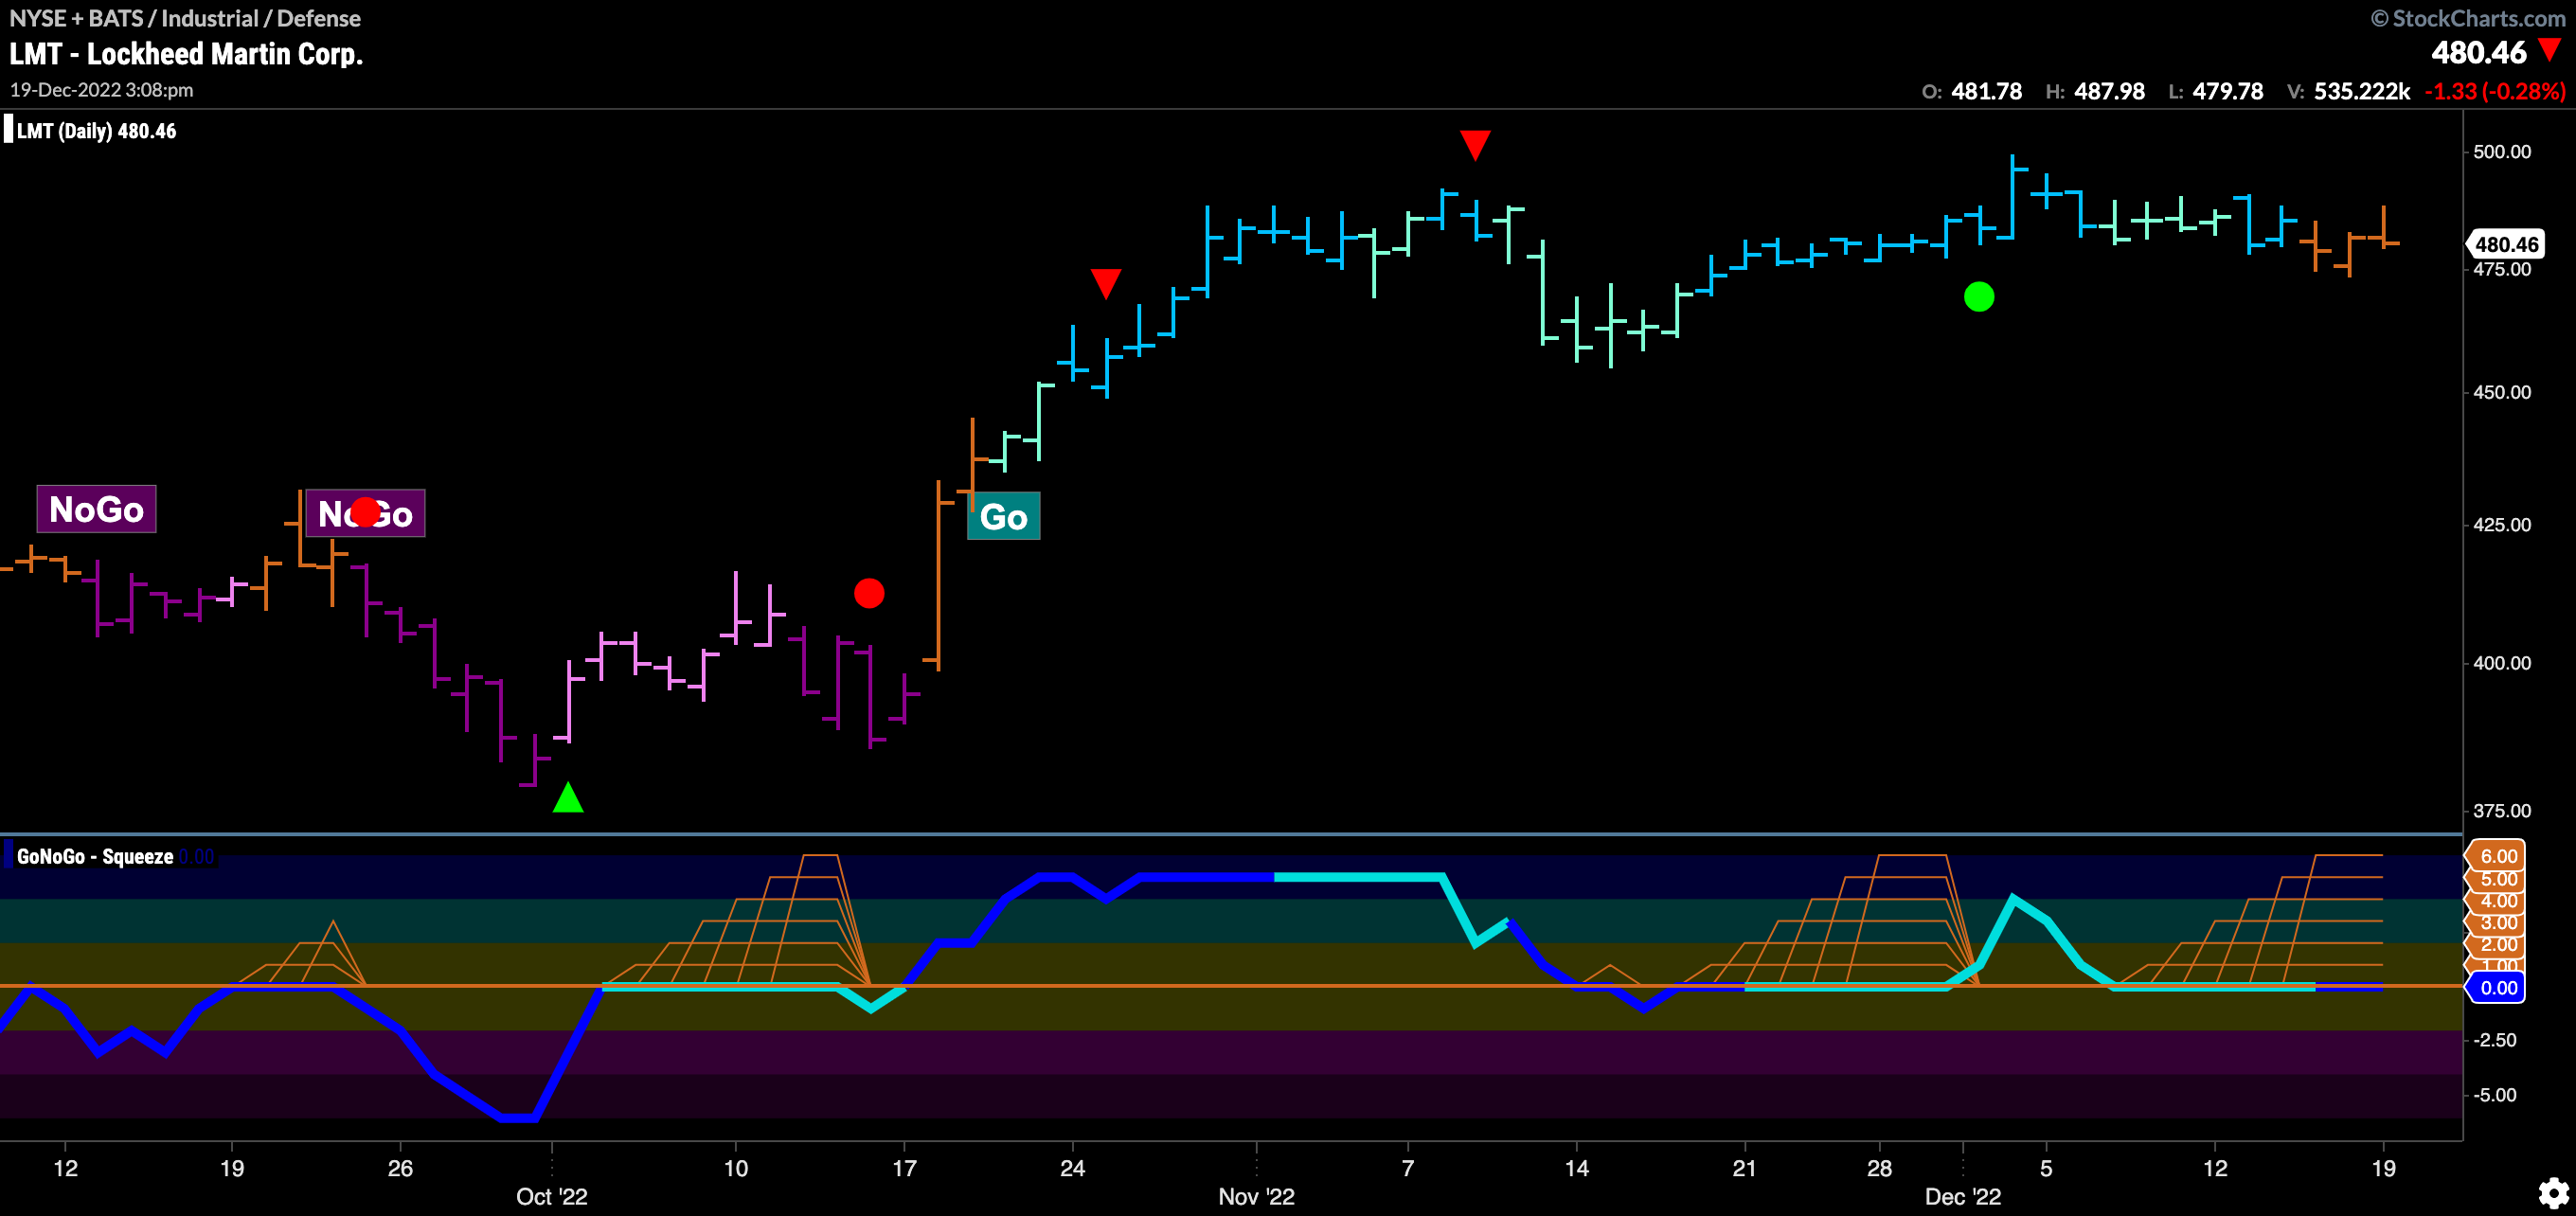
$LMT to Reverse and Paint “NoGo” bars?
$LMT has been moving sideways in an extended period of consolidation since entering the “Go” trend late October. Go Countertrend Correction Icons (red arrows) signaled that price would struggle to make new highs. Since, we have seen two Max GoNoGo Squeeze grids outlining the fact that price has been in an extended period of reduced volatility. Now, as we wait for a break out of the GoNoGo Squeeze, GoNoGo Trend has painted successive amber “Go Fish” bars. We will watch to see if the squeeze is broken to the downside which could lead to “NoGo” bars.
