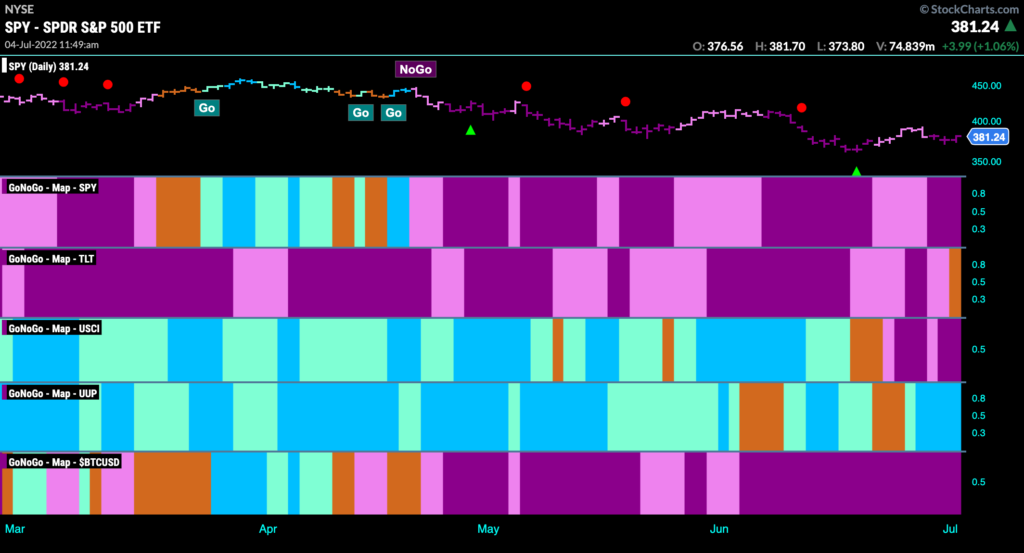
Good morning and welcome to this week’s Flight Path. Let’s take a look at the GoNoGo Asset map below. We don’t see much changing this week. The GoNoGo Asset Map remains very defensive with equities in a strong “NoGo”, bitcoin in a strong “NoGo” as is commodities. Treasury bond prices see some strength this week as an amber bar appears in the last session and the dollar is the lone holdout in a “Go” trend.
Sector Performance
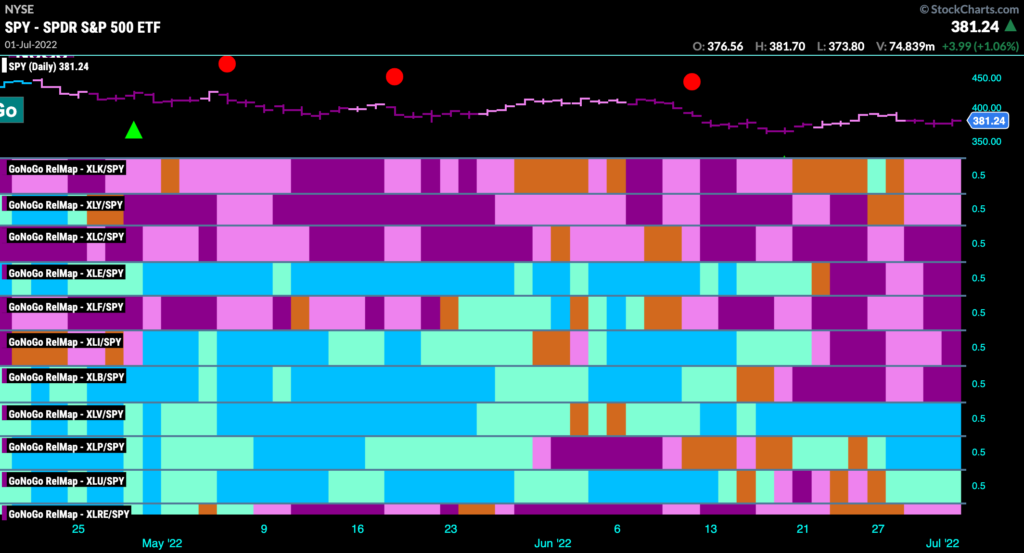
Below is the GoNoGo Sector Relmap. This GoNoGo Relmap applies the GoNoGo Trend to the relative strength ratios of the sectors to the base index. Looking at this map, we can quickly see where the relative outperformance is coming from as well as which sectors are lagging on a relative basis. The GoNoGo Sector Relmap continues to paint a defensive picture. Only healthcare, consumer staples and utilities are in relative “Go” trends to the base index.
S&P 500 Stays in Strong “NoGo”
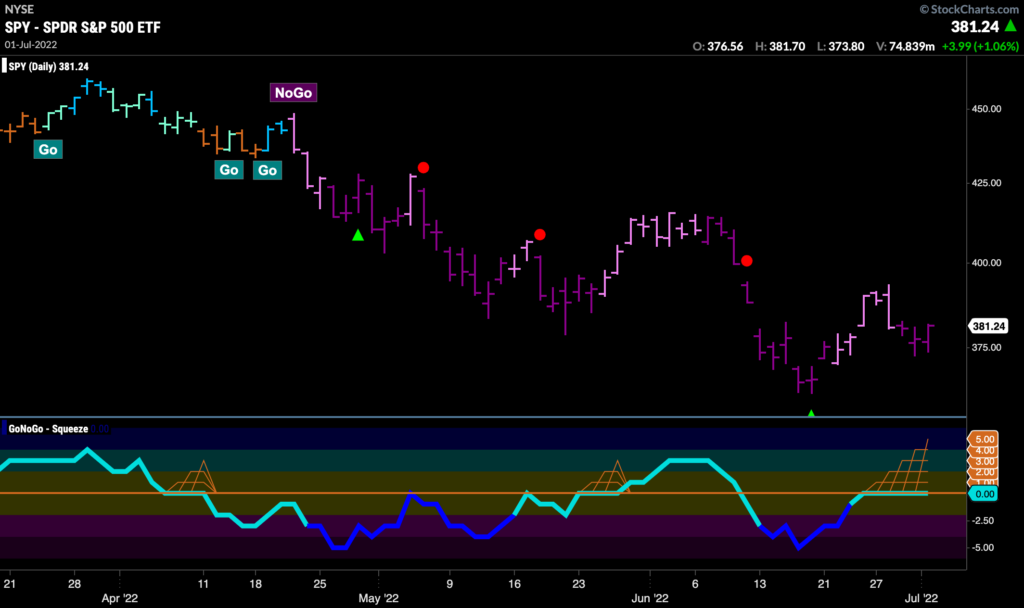
We have seen the “NoGo” set a series of lower highs and lower lows over the last few months as investors have come to terms with the macro factors that have created a headwind for stocks. This hasn’t changed of late, as the market’s attempt to move higher failed last week. Strong “NoGo” bars returned and GoNoGo Oscillator is riding the zero line as a GoNoGo Squeeze builds. If resistance is found at the zero level and the oscillator moves back into negative territory we can expect price to make an attempt to set a lower low.
Staples Set for Gains?
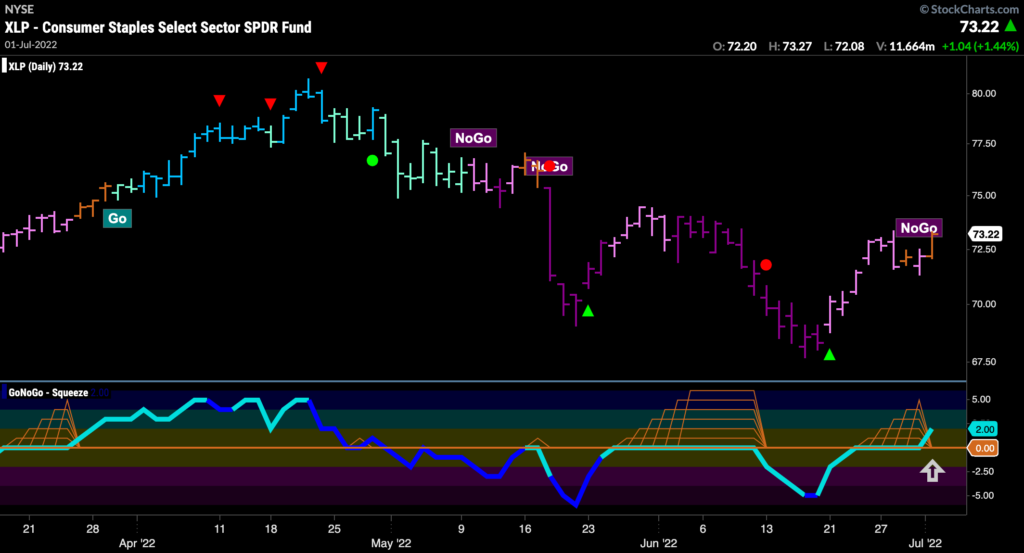
If there is outperformance to be had it is in the defensive sectors as we have seen in the GoNoGo Sector RelMap above. The chart below shows the GoNoGo Chart for consumer staples on daily prices. We see some encouraging signs as GoNoGo Trend has been unable to paint continuous “NoGo” bars and a couple of amber “Go Fish” bars have crept in. Also, in the oscillator panel, we see that GoNoGo Oscillator is breaking out of a GoNoGo Squeeze into positive territory indicating that there is positive momentum.
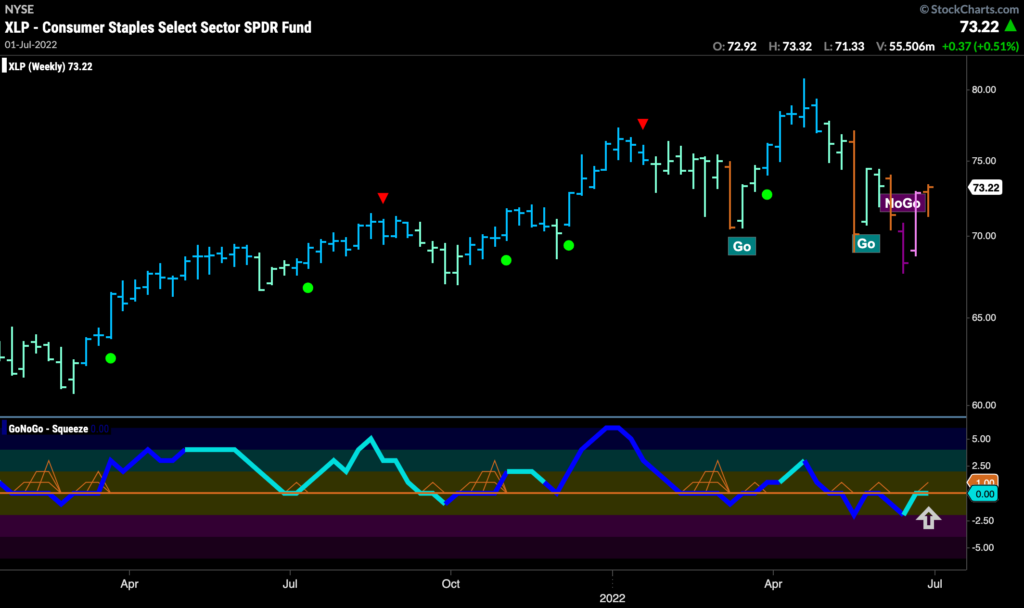
Zooming out to the long term weekly chart of $XLP, we can see that last week saw GoNoGo Trend paint an amber “Go Fish” bar and that the “NoGo” was short lived. GoNoGo Oscillator is also back at zero having been unable to stay in negative territory. We will need to see the oscillator back in positive territory in order for us to expect a “Go” trend above.
Tech vs Toilet Paper – Cisco or Sysco?
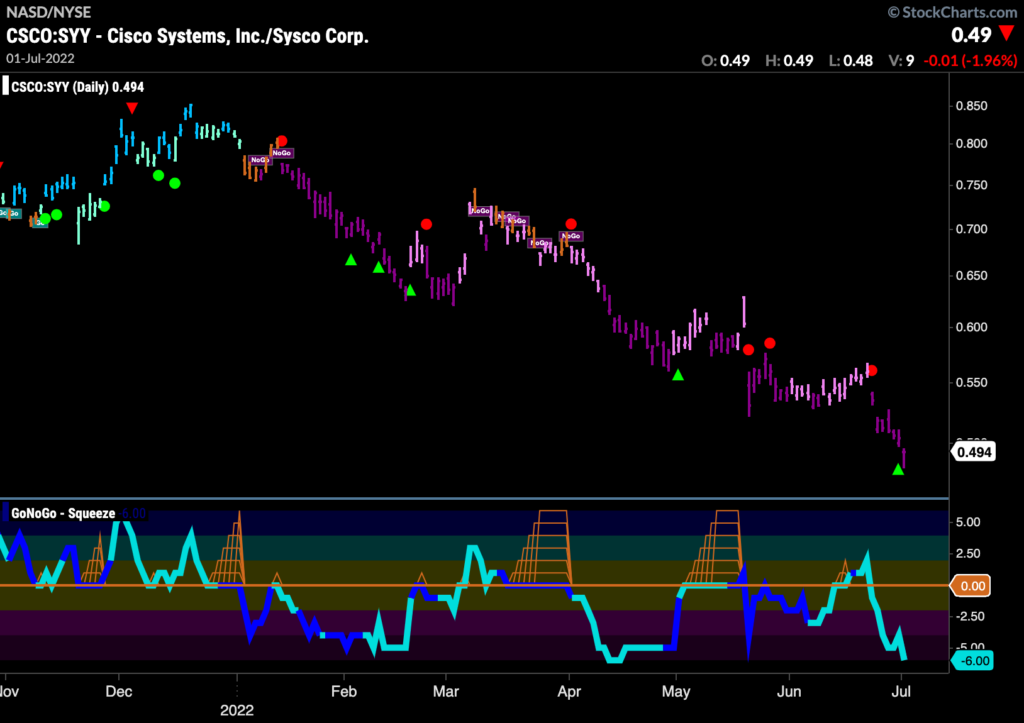
Every now and then we like to look at the relative strength of $CSCO vs $SYY as a proxy for growth vs value. If we look at this ratio below on a daily chart we can see that we are well and truly in toilet paper territory. The ratio has been moving against Cisco since the beginning of the year as the relative “NoGo” trend has been obvious. The end of last week saw a new lower low on strong purple bars.
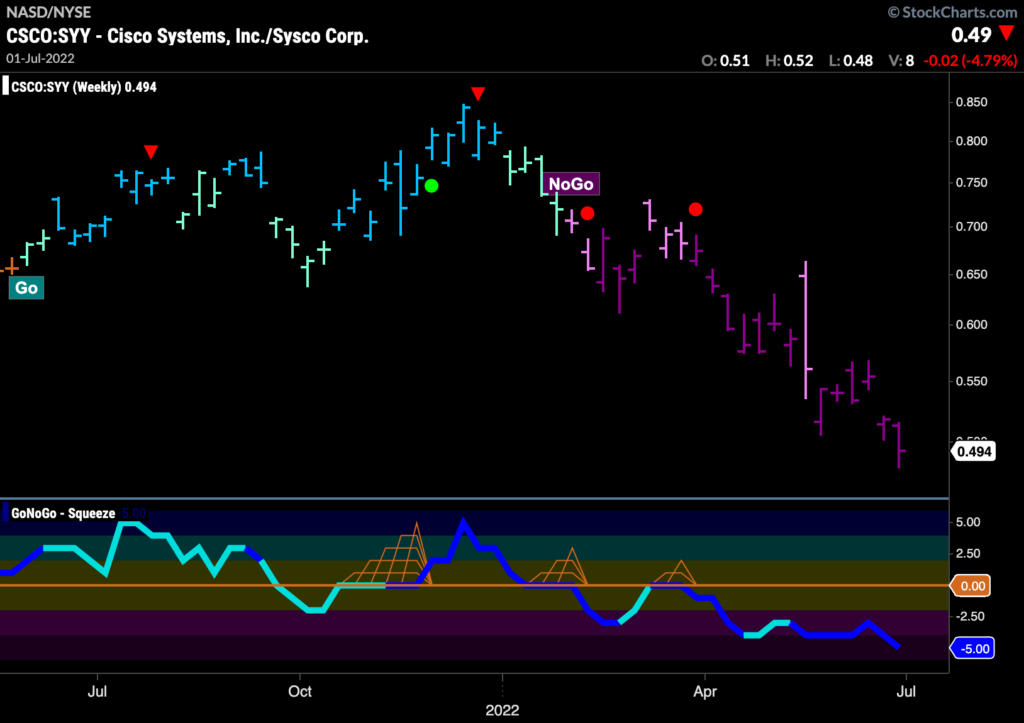
The weekly chart shows that this “NoGo” trend is in no trouble with GoNoGo Oscillator in oversold territory on heavy volume as price makes a new low on strong purple bars. We are not looking for a rotation back into growth equities on the basis of this just yet!
$SYY as an Opportunity?
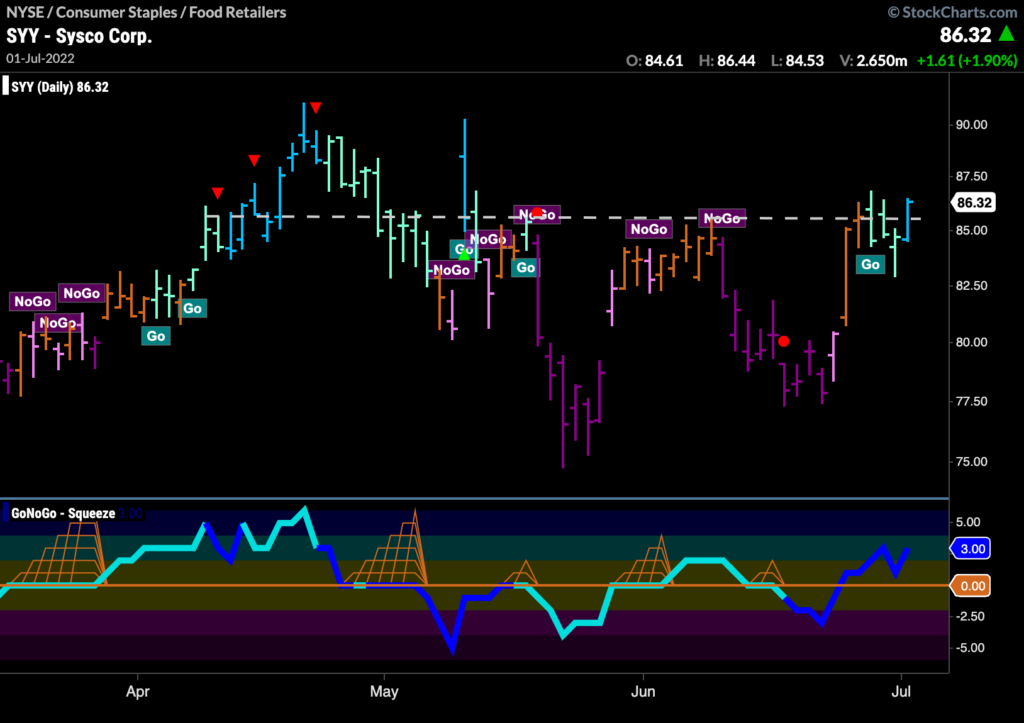
Let’s take a look at the pure performance of Sysco. Below is the daily GoNoGo Chart and we can see that a new “Go” trend is in place and attempting to get above horizontal resistance from pattern highs. As this recent “Go” trend formed, GoNoGo Oscillator has confirmed by bursting back above the zero line on heavy volume. Look for price to attempt a new high near $90.
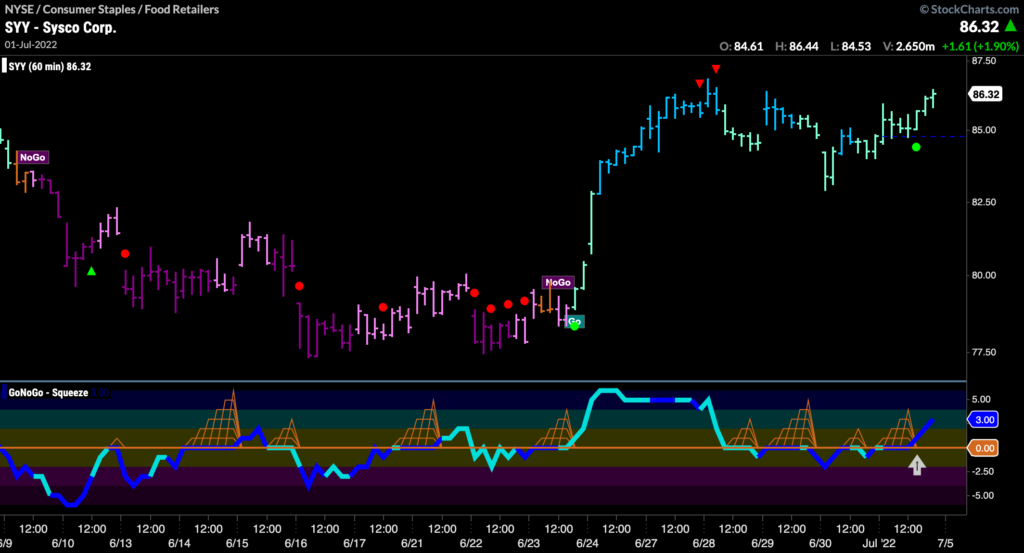
Moving down in time frames to secure sensible entry, we can take a look at a 60 minute chart of $SYY. We can see that the “Go” has been in place now for a few days and after hitting highs that were highlighted by Go CounterTrend correction red arrows we have consolidated mostly sideways. GoNoGo Oscillator has been able to break back above the zero line into positive territory on heavy volume and this has triggered a Go Trend Continuation green circle to appear under the price bar as we look to set a new short term high.
At What $Cost Costco?
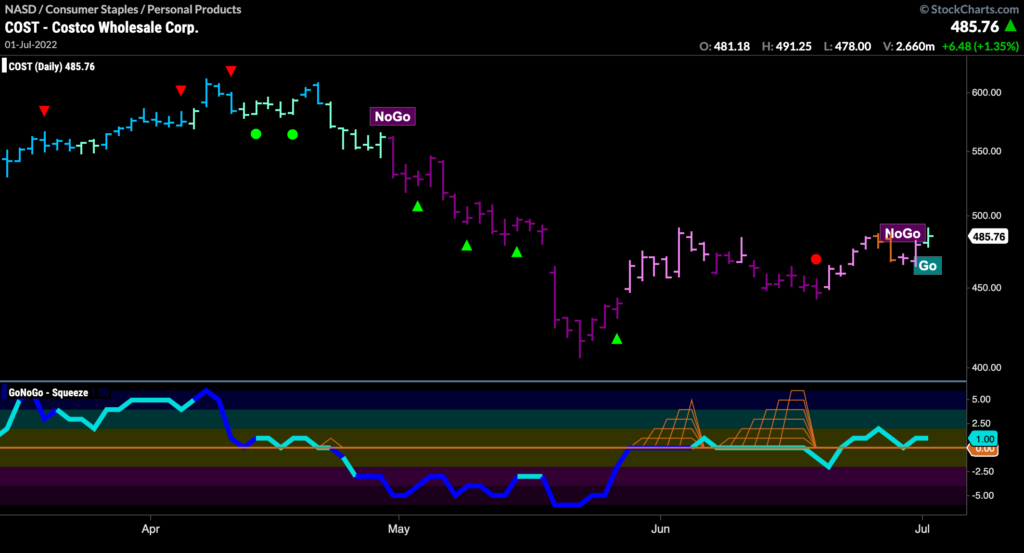
Costco is defensive, providing consumers with low cost goods. It could be argued that with the stock market still struggling, and growth stocks under performing, companies like Costco will outperform. Ignoring the narrative, let’s look at a GoNoGo chart of $COST. We see a fresh “GO” identified on the last bar of the week. This comes after GoNoGo Oscillator has broken into positive territory and now found support at that level. Look for $COST to make new highs above $490.
