Market Rebounds on the Performance of Cyclicals
The Dow Jones Industrial Average outperformed other US equity indices with a 1.2% gain last week as investors rotate holdings back to the cyclical sectors which rallied in Q1 and have lagged through the remainder of this year. In another week of choppy trading, the major U.S. stock indexes recovered from a sharp decline on Monday to finish positive overall for the week. See the hourly GoNoGo Chart® of the S&P 500 below:
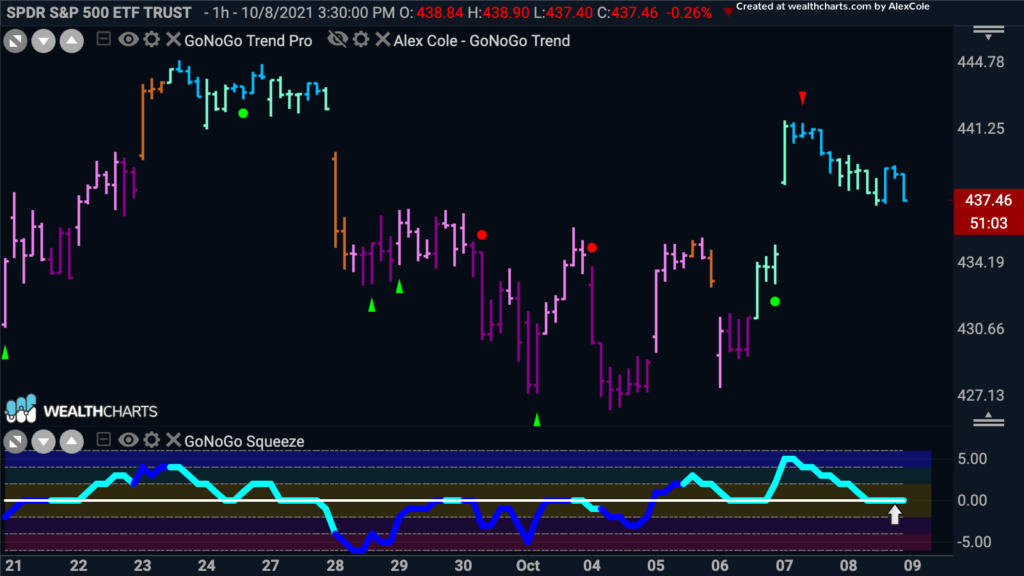
As you can see above, GoNoGo Oscillator® is resting back at the zero line (white arrow) after a powerful surge in momentum. We will look to see if the neutral zero line offers support and the “Go” trend can continue.
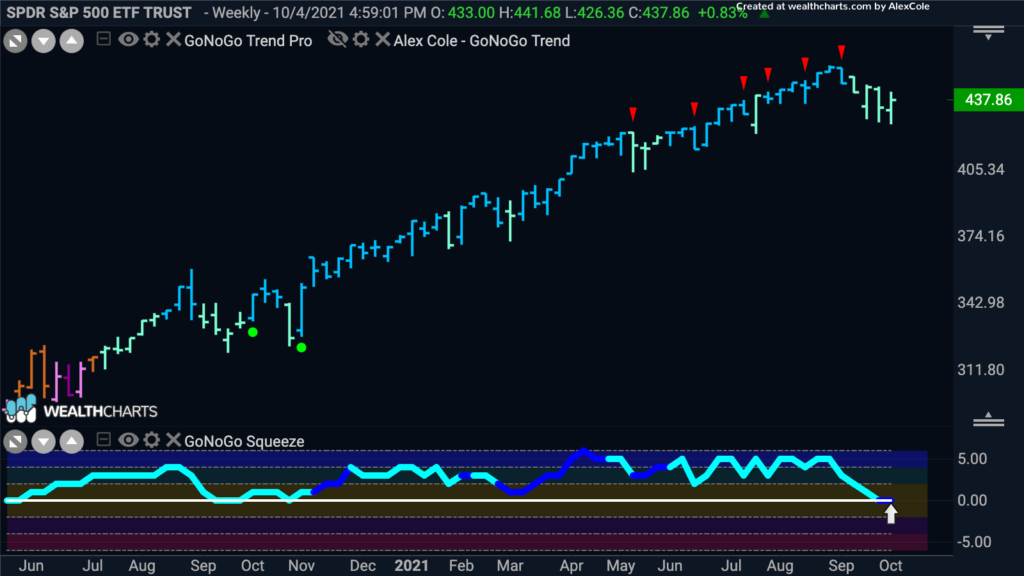
For perspective, the weekly GoNoGo Chart of the $SPY below shows that the recent choppiness has continued to present buying opportunities within the prevailing “Go” trend on a longer-term basis. GoNoGo Oscillator is back at the zero line, yet volume has picked up through the final bar of this past week’s rally.
Yields Rise and Curves Steepen
Prices of U.S. government bonds fell again, sending the yield of the 10-year U.S. Treasury bond above 1.60% on Friday (prices of bonds move inversely to the rates). That’s the highest yield in more than four months, and it marks a sharp increase from mid-September when the yield slipped below 1.30%. See the Daily GoNoGo Trend® chart of $TLT below for a look at the selloff which continued and strengthened its “NoGo” trend last week: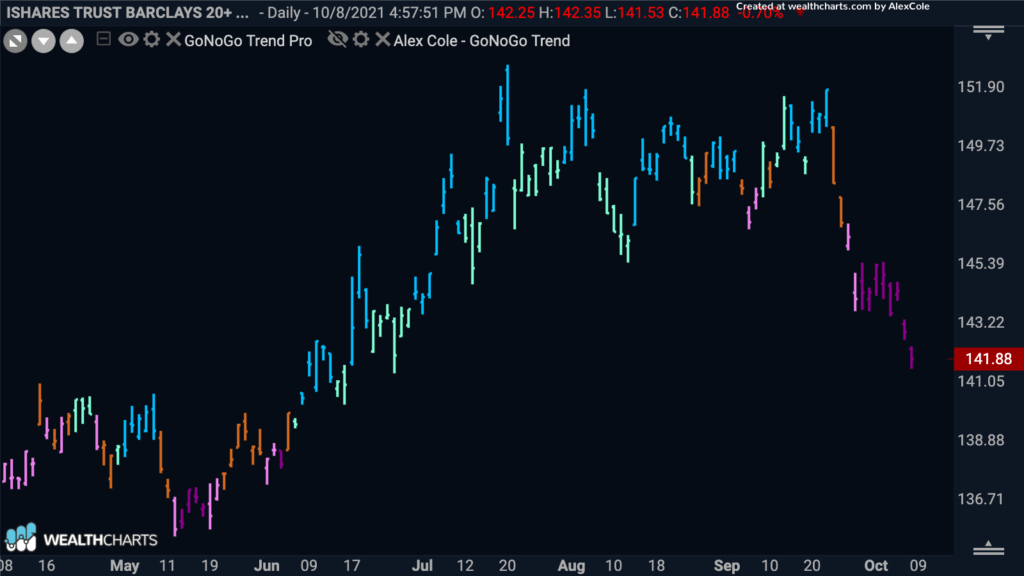
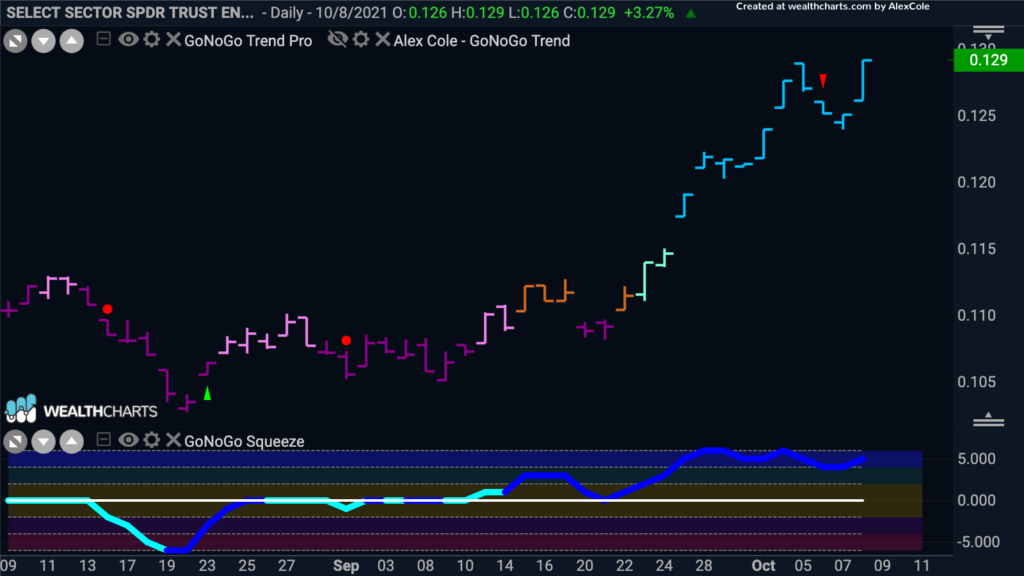
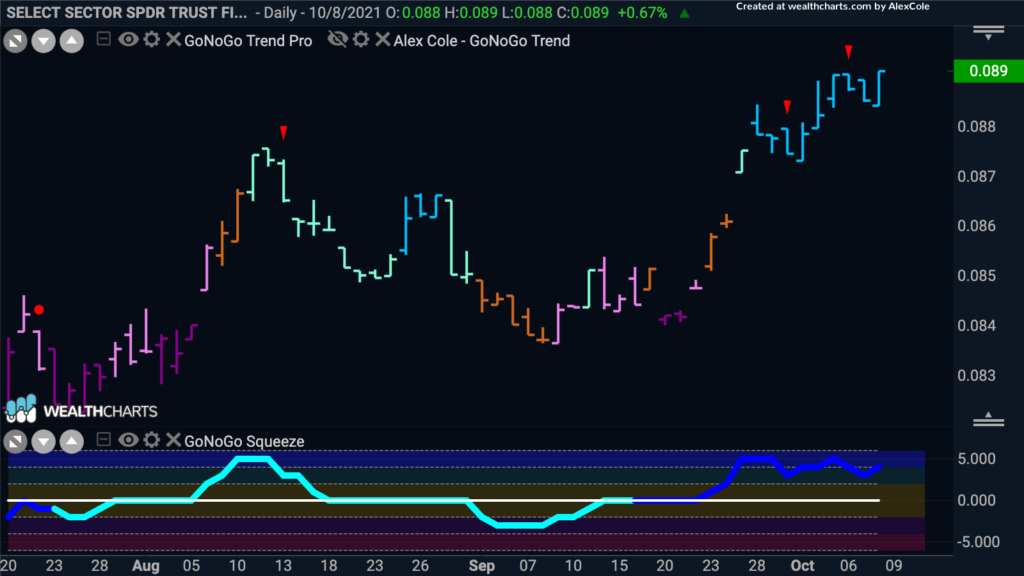
In this environment (rising rates, steepening yield curve) we see favorable conditions for the profitability of lending institutions (a.k.a. BANKS). US Financial Services companies are getting ready for quarterly earnings reporting this week. We can see the sector as a whole $XLF has performed well in the chart below:
Cross Asset Comparison
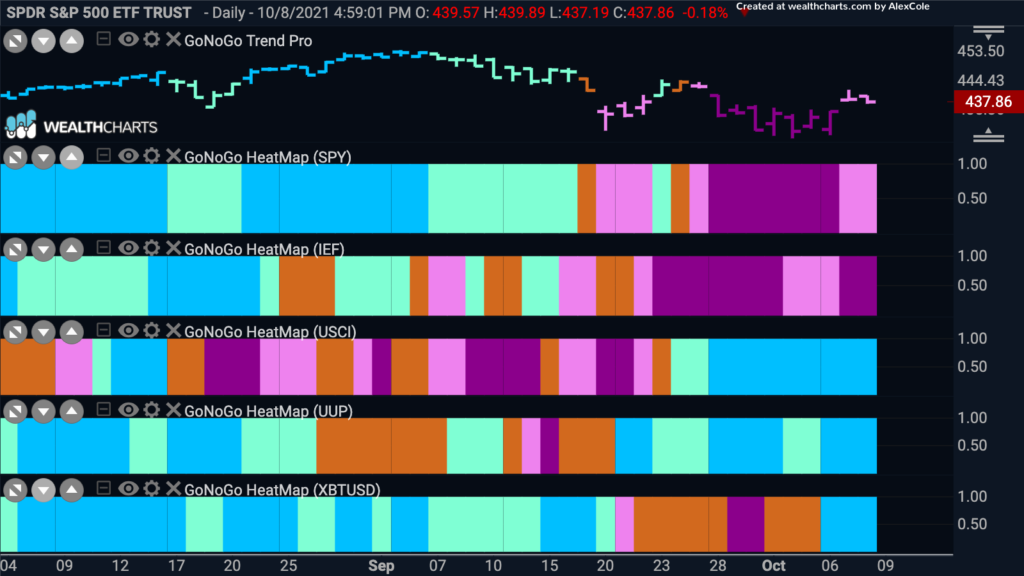
The GoNoGo HeatMap® below shows how Commodities, US Dollars, and Bitcoin are in strong “Go” trends, while equities and bonds have lagged by comparison.
Commodities in Focus
Inflation pressures may be stemming from supply-related constraints, but as the economy reopens on the waning effects of Covid and the Delta variant, we see a resurgent “Go” trend for commodities.
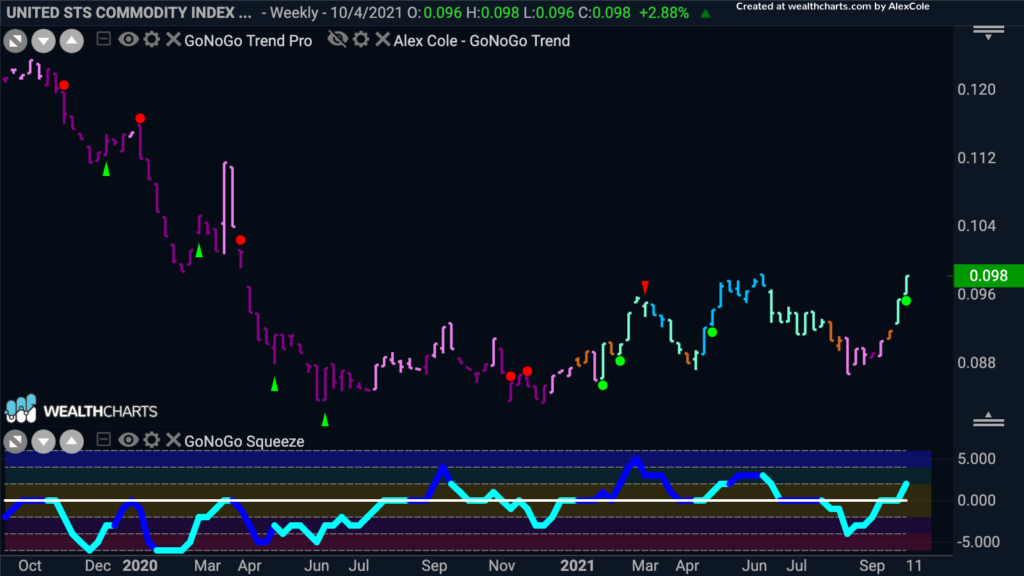
You’ll hear many talking heads on financial news networks talking about a new “Commodities Supercycle.” While the phrase is overused, the absolute and relative performance of commodities in the energy, agricultural, and industrial chemicals and minerals groups have been staggering. See the weekly GoNoGo Chart below of the United States Commodity Index $USCI showing aqua “Go” trend conditions, a breakout to positive territory on the GoNoGo Oscillator, and an unmistakable broad basing formation on the chart:
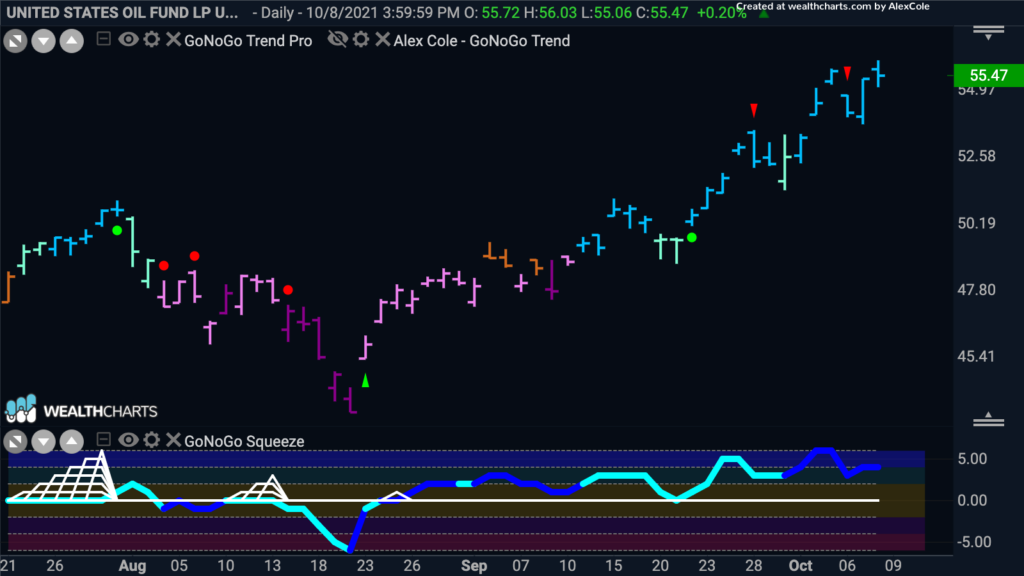
This past week, however, it was not the soybeans, or cattle, or minerals that stole the show. WTI crude briefly topped $80 per barrel for the first time since 2014. U.S. crude oil prices climbed for the seventh week in a row. See the GoNoGo Chart below of $USO an ETF capturing broad exposure to the US Oil industry:
For equity-only investors, we don’t have to trade crude futures – we can get exposure through simple ETFs – look at the GoNoGo Chart below of $XLE, the Energy Sector of the S&P 500 in a strong “Go” trend with positive momentum on heavy volume:
Drilling Deeper
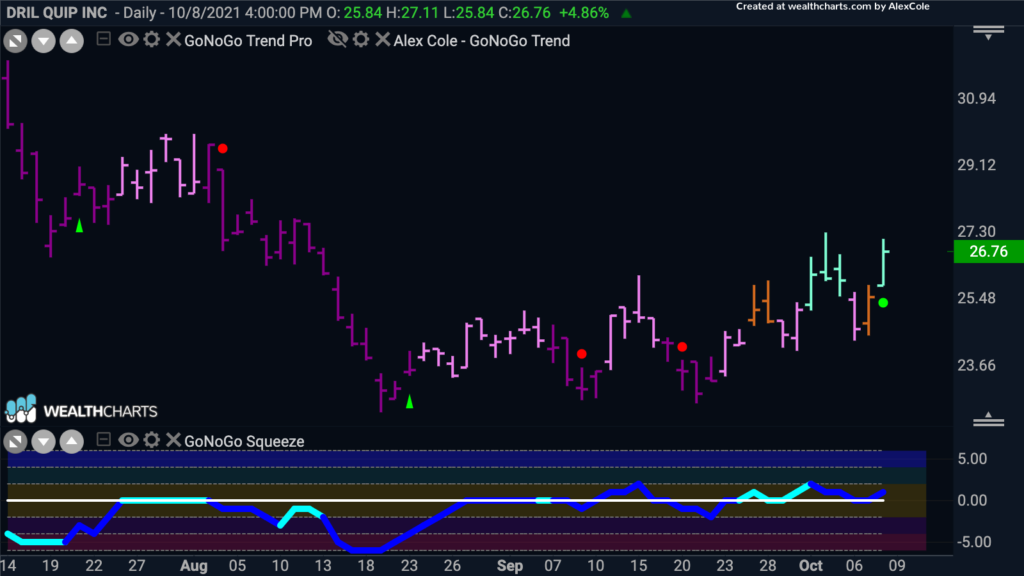
As the price of oil rises, the entire vertical participates from upstream exploration and extraction to downstream refining and distribution. Dril-Quip, Inc. manufactures offshore drilling and production equipment, which is well-suited for use in deepwater, harsh environments, and severe service applications. See the GoNoGo Chart below of $DRQ which is just beginning a fresh “Go” trend:
