
For those who were getting bored, what’s not to love about markets like these? Happy Valentine’s Day and welcome to your latest edition of Flight Path from GoNoGo Research for the week starting February 14, 2022.
An early rally last week gave way to selling pressure which resulted in large-cap US equity indices ending the week negative. The S&P 500 and Nasdaq composite both lost around 2%. Stocks climbed on Tuesday and Wednesday following restorative commentary from Dr. Anthony Fauci of the CDC, only to fall the next two days amid renewed concerns about inflation, the pace of monetary tightening, and geopolitical conflict in Ukraine.
Asset Class Trends
Narratives aside, a GoNoGo HeatMap® highlights that commodities remain the asset class leader. Interestingly, Bitcoin is finally striking “Go” conditions on the daily timeframe as well. See trend conditions across asset classes below:

Equities ($SPY) paint a strong “NoGo” bar to end the week
Treasury prices ($TLT) are still in strong “NoGo” painting purple bars
Commodities ($USCI) continue to solidify the “GO” trend with strong blue bars
The US dollar’s ($UUP) recent “Go” trend failed to materialize
Bitcoin’s “NoGo ” trend has weakened toward reversal
US Equities Still at Decision Point
The S&P 500 is still hovering at a critical inflection point. Overall “NoGo” conditions for the daily period trend of the S&P500, but GoNoGo Oscillator breaking through the zero line after a max squeeze was an encouraging sign for the bulls. Warnings from U.S. officials that a Russian invasion of Ukraine might be imminent may have also contributed to a late-week sell-off. See the daily $SPY chart below:

From the weekly perspective, the S&P 500’s rally this week was not lost in the late Friday afternoon selloff. GoNoGo Trend shifted into the stronger “Go” trend conditions – shown in the final aqua bar representing last week’s trading session ending 2/11/2022: (*Note, premarket data appearing in pink)

Considering this longer-term trend, the weight of the evidence shows several key threats to the “Go” conditions:
1. BEARISH DIVERGENCE between Price and GoNoGo Oscillator in Nov-Dec 2021. A higher high in price was met with a lower high in the momentum oscillator of the lower panel.
2. BREAK OF THE ZERO-LINE in the lower panel shows that momentum fell from neutral to oversold four weeks ago
3. POLARITY – the zero-line of GoNoGo Oscillator acted as SUPPORT throughout the “Go” trend of $SPY off the covid lows in 2020 but became RESISTANCE for momentum this week as the oscillator was rejected at zero and returned to negative territory
3. HIGH RELATIVE VOLUME – GoNoGo Oscillator changes from aqua to dark blue when markets experience higher relative volume. What was lighter volume at the swing highs in late November became heavier volume through this correction in 2022
Leading & Lagging Style Factors
Within the US Equity space, we saw S&P MidCap 400 and small-cap Russell 2000 indexes record modest gains last week, and for clients who consider style-box allocation strategies, it’s helpful to compare GoNoGo Conditions up and down the cap scale and between value and growth shares. See the HeatMap below of absolute trends across the 9 style boxes:

As you can see in the heat map above, correlations move to one in a crisis and all styles struck a “NoGo” on Friday to varying degrees. However, $VTV the Vanguard ETF for Large- Cap Value shares held up the best last week.
Relative Strength Sector Map
Eight of the 11 S&P 500 sectors closed lower last week, led by the communication services (-3.9%), information technology (-2.9%), real estate (-2.8%), and consumer discretionary (-2.3%) sectors. The materials (+1.1%) and energy (+1.8%) sectors ended the week with decent gains, but the relative performance of $XLV, $XLP, $XLE, $XLF, $XLI, and $XLU were all in “Go” trends against the benchmark S&P 500 index. See the GoNoGo RelMap below:

The energy sector was the highest performing area of the US Equity markets last year and has simply accelerated its gains so far in 2022. The question on everyone’s mind is whether that song is already overplayed?
Extended or Extending?
Our favorite tweet over the weekend came from @Jimmyjude13 citing the wisdom of NYMEX floor traders who understood the tenets of trend following well:
“If you’re taking the train to California, you don’t get off in Chicago!”
As it relates to oil, it is not surprising that critics are calling for the top. As it was for full-year 2021, energy has been the top-performing S&P 500 sector of early 2022—and by a wide margin, with a nearly 24% year-to-date price gain as of Friday. Rising oil prices have been a key reason for energy’s recent market leadership. GoNoGo Research has cited many opportunities in the exploration, refining, and distribution infrastructure upstream and down, but let’s examine a long-term chart for a minute to understand what we would need to see for the trend to end.
The chart below shows the weekly GoNoGo Chart of front-month WTI oil futures. You can see that a new high has been made and the GoNoGo Oscillator is overbought. It hasn’t happened yet, but we may see a short-term counter trend correction against the “Go” trend (red arrow) if and when the oscillator goes back below 5. We would then look to the zero line on the oscillator for support. It is, however, a very bullish picture.

When is it time to shine?
Gold has been a losing trade for well over a year, frustrating many investors who anticipated a sharp rally in the face of an inflationary economy. There is logic to the story that gold is an inflation hedge and a store of value as central banks devalue their currencies, but it is costly to be early. Last week’s trading provided some evidence of a renewed investor interest in gold. The weekly bars show a strong Go trend and momentum confirmation in the form of the green circle under price:

From a classical technical analysis perspective, there is still work to be done to gain velocity out of the choppiness of this chart, but the conditions will be visible on a GoNoGo Chart as $IAU breaks through overhead resistance at 37 and 39.
Barrick Gold Corp
If now is the time, we can look at a stock that is positioned to profit from a rise in gold. $GOLD, Barrick Gold Corp is the stock in the weekly GoNoGo Chart below. On this long-term chart, we can see that the “NoGo” trend is in trouble for several reasons. The GoNoGo Oscillator has been making higher lows since the beginning of 2022 while price has fallen lower. Currently, after spending some time on and around the zero line it has broken into positive territory on heavy volume. In conjunction, GoNoGo Trend is painting an amber “Go Fish” bar, telling us that the trend conditions have slipped out of “NoGo” into neutral.

If Gold is about to have its time in the sun, let’s move down to a daily chart of $GOLD for an opportunity to enter. We can see that the “Go” trend has been in place for a few weeks and we have seen encouraging signs of support from GoNoGo Oscillator bouncing off the zero line. This has happened again, as the strong price bar on Friday also has broken above the channel resistance.

Reopening Trade Opportunities
The so-called reopening trade helped stocks regain their footing at midweek. Shares in restaurants, hotels, casinos, air and cruise lines, and online travel agency stocks all rallied. With rapid COVID-19 vaccinations, a larger number of Americans are expected to travel this spring. They are also expected to simply get out and about. The bouts of the latest data coupled with positive news from TSA indicate that travel demand is picking up.
Living it up with Live Nation
On a weekly basis, the GoNoGo Chart of $LYV shows very strong trend conditions as GoNoGo Trend paints strong blue “Go” bars as price creeps back close to prior highs. As this is happening we see GoNoGo Oscillator riding the zero line, causing the climbing grid of the GoNoGo Squeeze to build. We will watch to see if the Squeeze is broken to the upside indicating trend continuation.

On a daily basis, we can see that we have been stuck in a channel for a few months. As prices rallied this last week, GoNoGo Trend moved to paint a string of amber “Go Fish” bars. If this price action persists, we will likely see a new “Go” trend identified and we will want to see that hold and move above resistance.

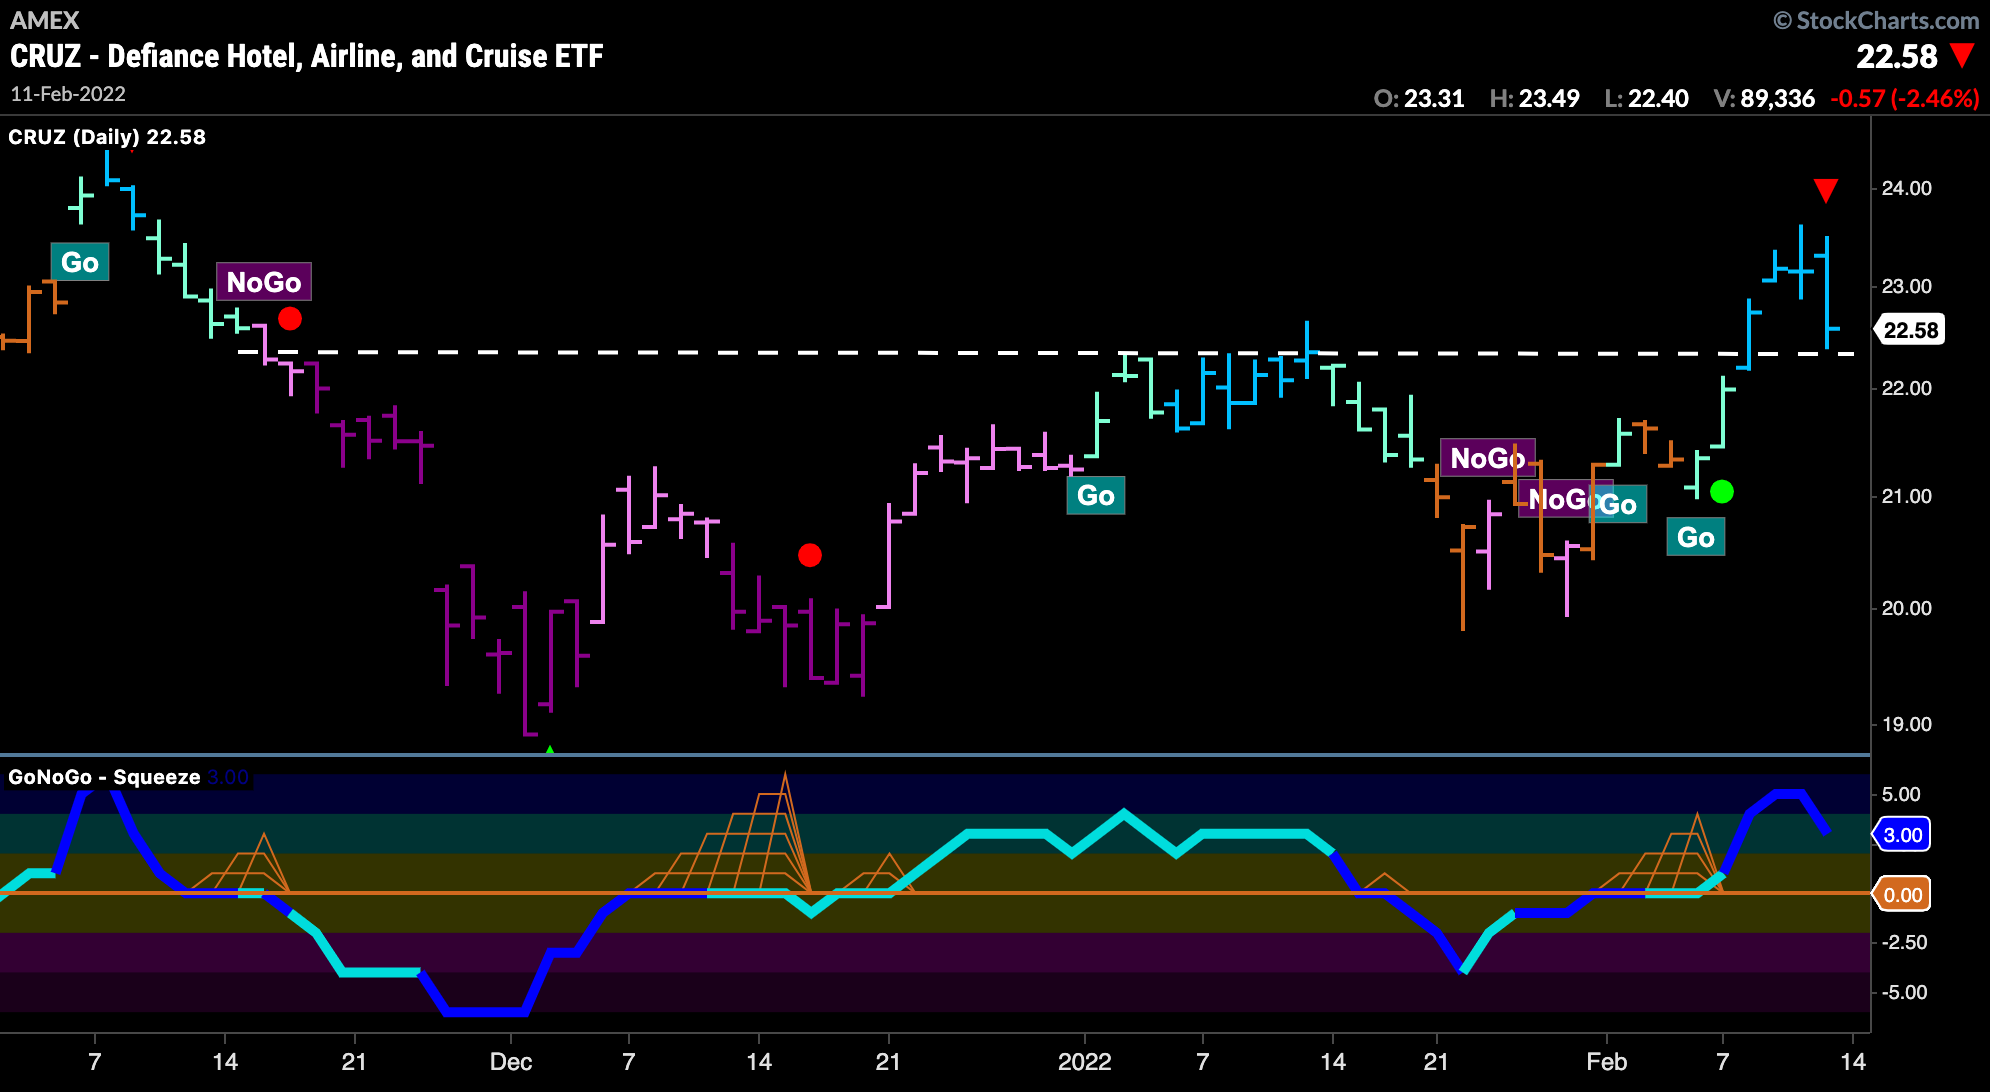
$CRUZ-ing Higher
In terms of travel stocks, let’s take a look at the $CRUZ ETF. Having broken above resistance in this latest attempt at a “Go” trend, we saw the price fall on Friday. Now, we will look to see if support is found at these levels and if the GoNoGo Oscillator finds support at the zero line. If it does, look for a trend continuation icon (green circle) to appear under the price bar.

BETTER CHARTS, BETTER DECISIONS.


