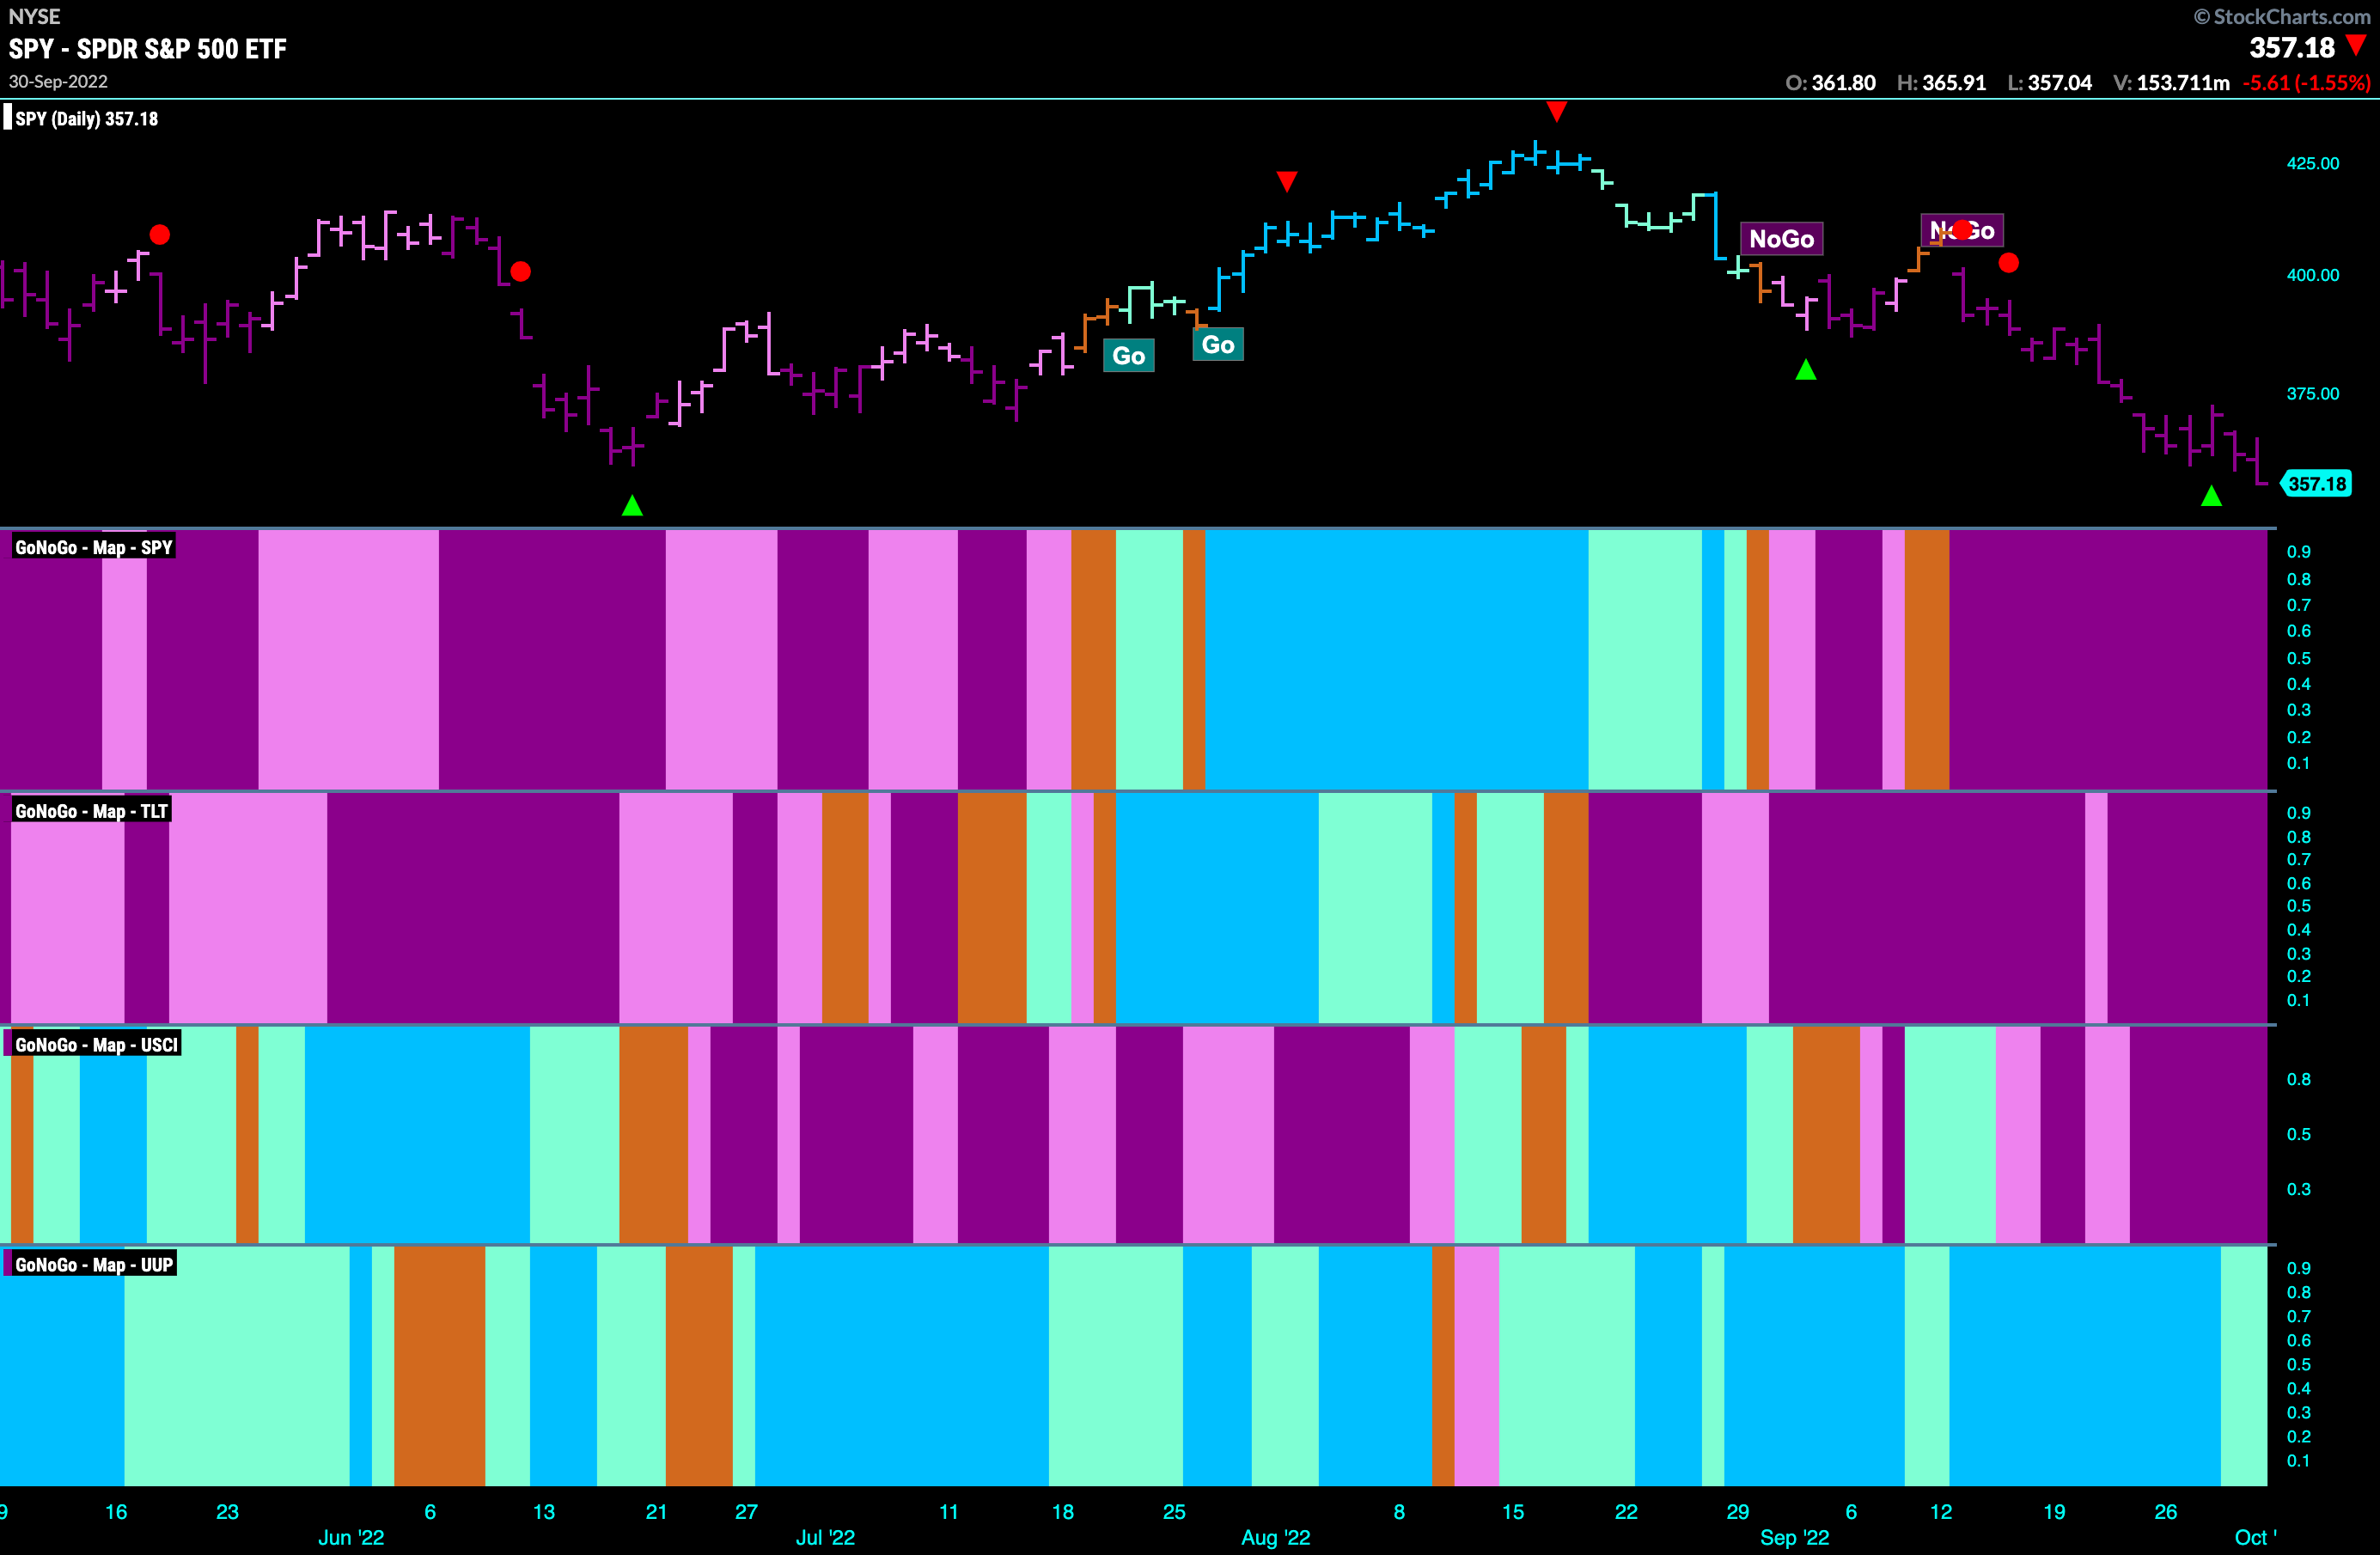
Good morning and welcome to this week’s Flight Path. Let’s take a look at the GoNoGo Asset map below. There seems to be no where to run except cash as the “NoGo” trends continue in equities, bonds and commodities. Equities were looking for support at the June lows and we’ll take a look at the S&P charts shortly. The dollar holds on to its “Go” trend although it came off a high and painted weaker aqua bars to end the week.
S&P 500 Looks to be Edging Below Support
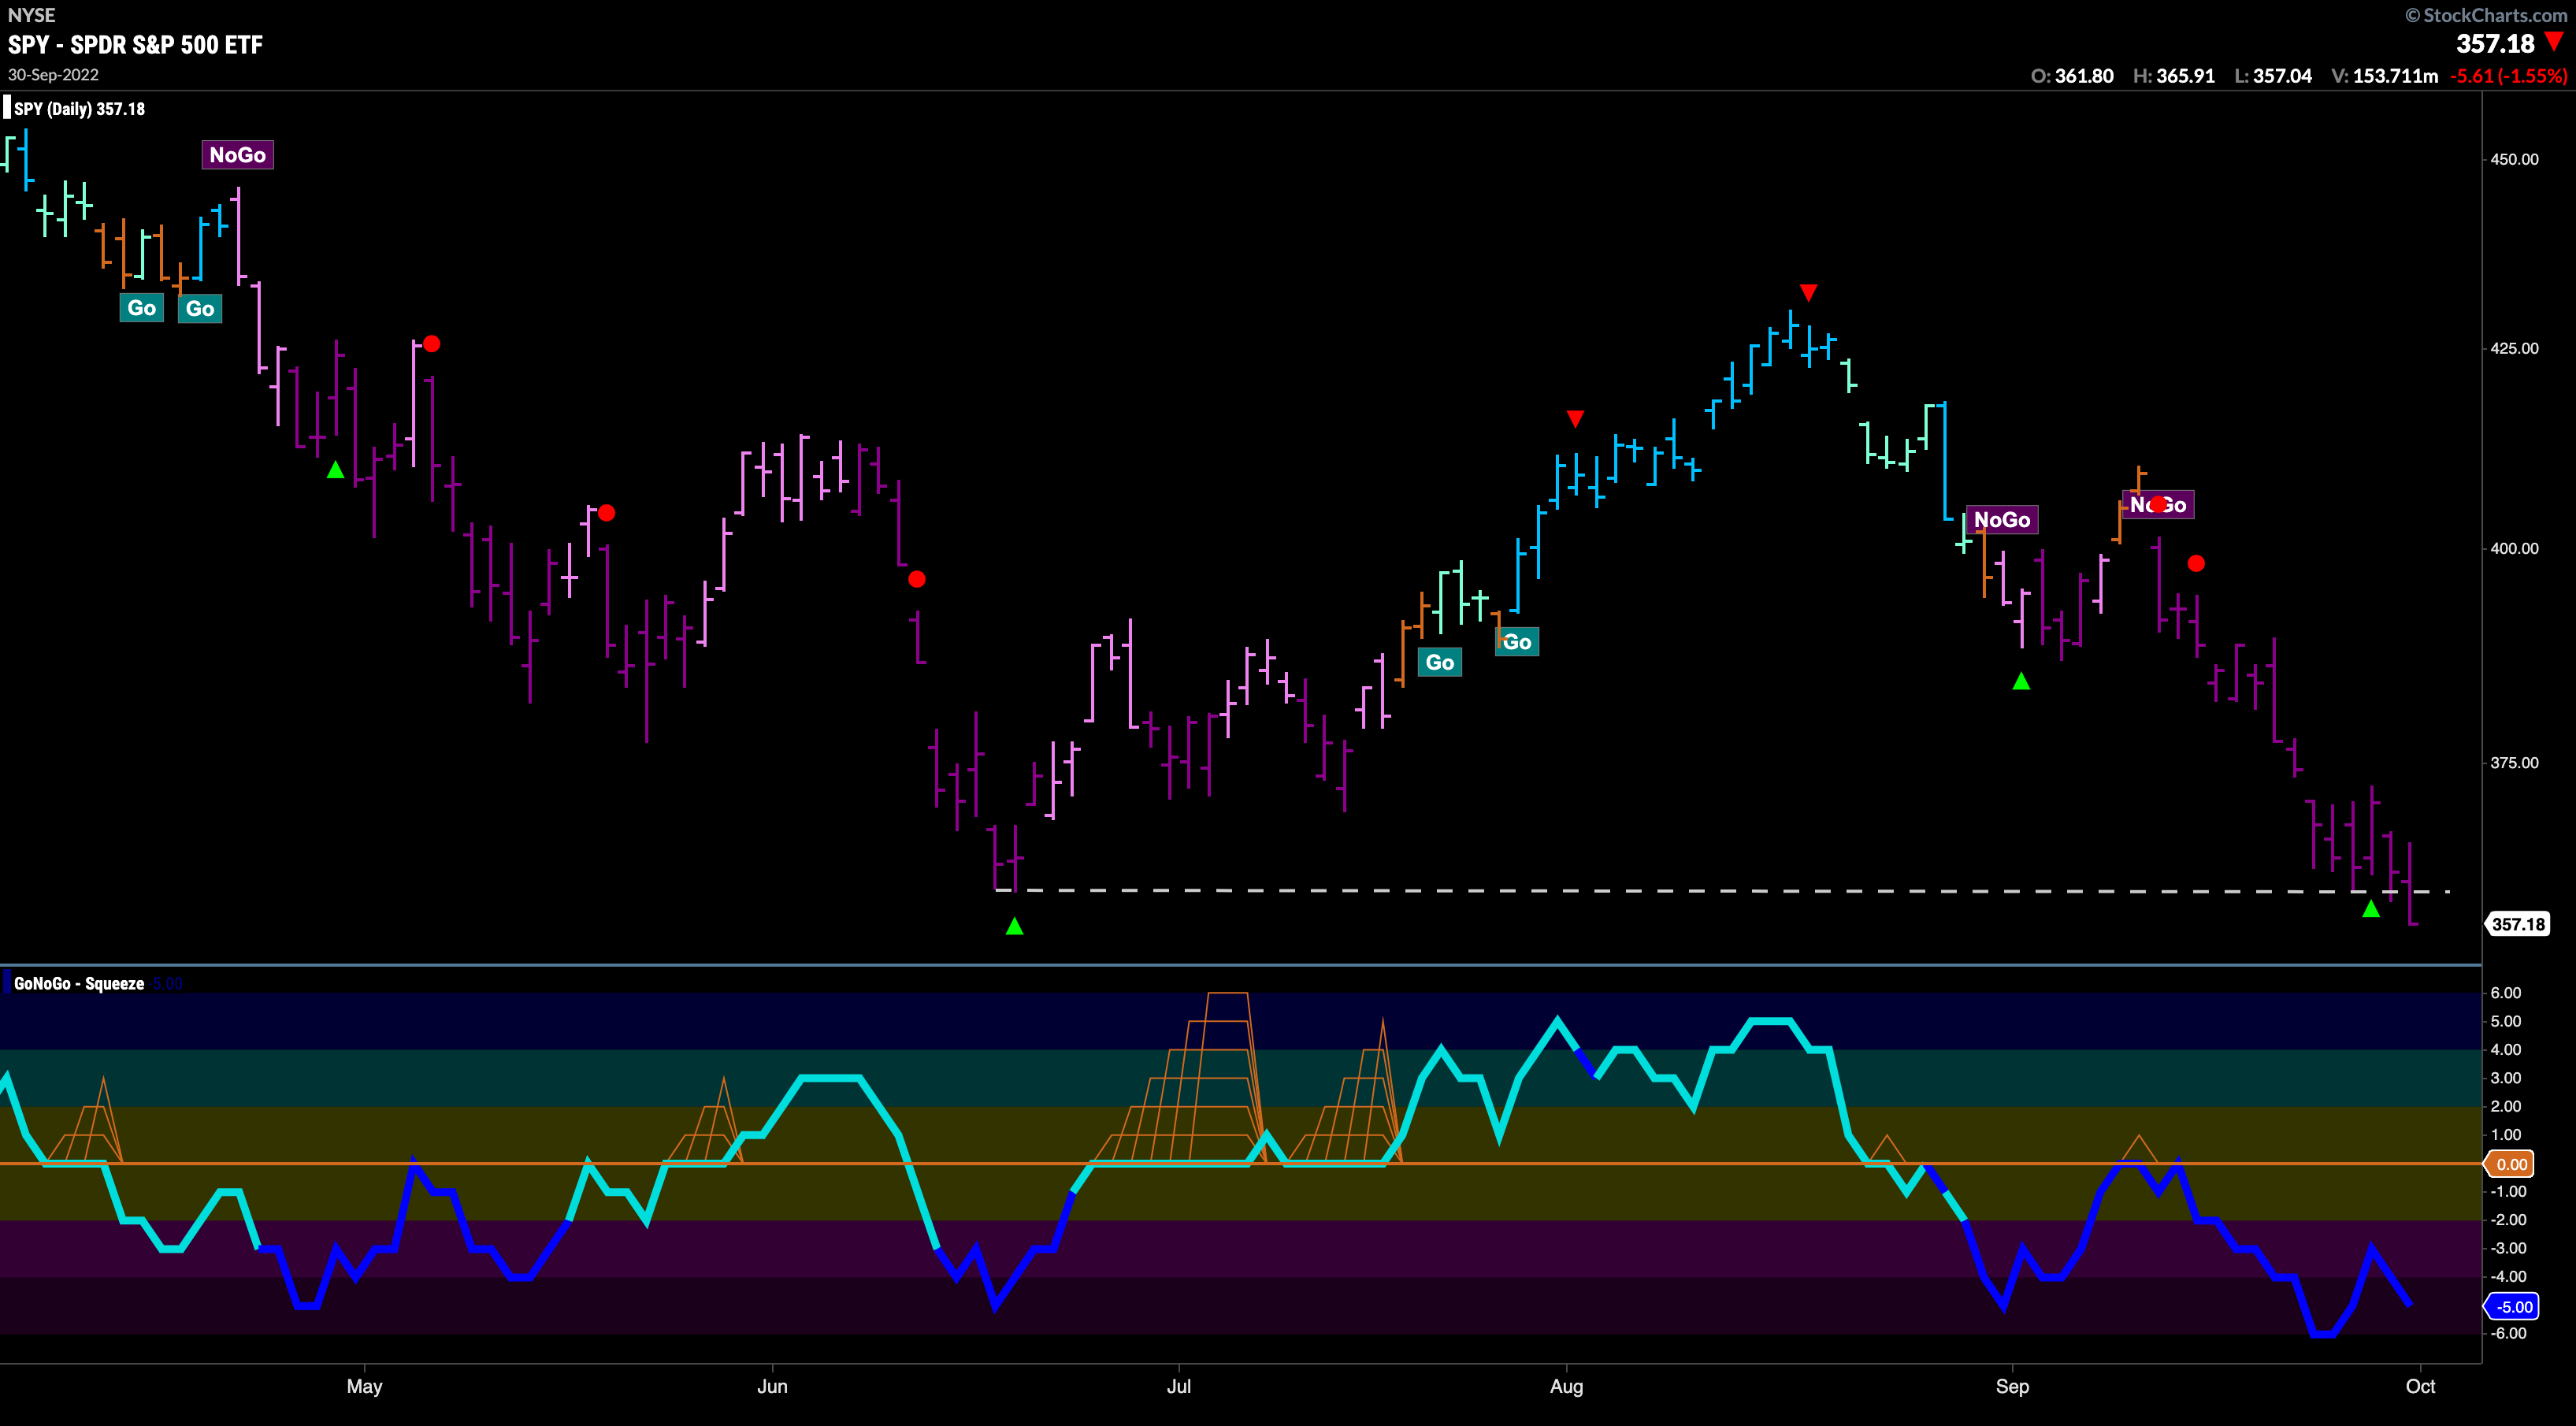
The June levels we talked about last week provided some support for most of the week but Friday’s trading saw a close below. With heavy volume, and GoNoGo Oscillator confirming with its own lower low, price looks in real trouble here. We will watch to see if price can recapture the June lows or if there will be further downside this week.
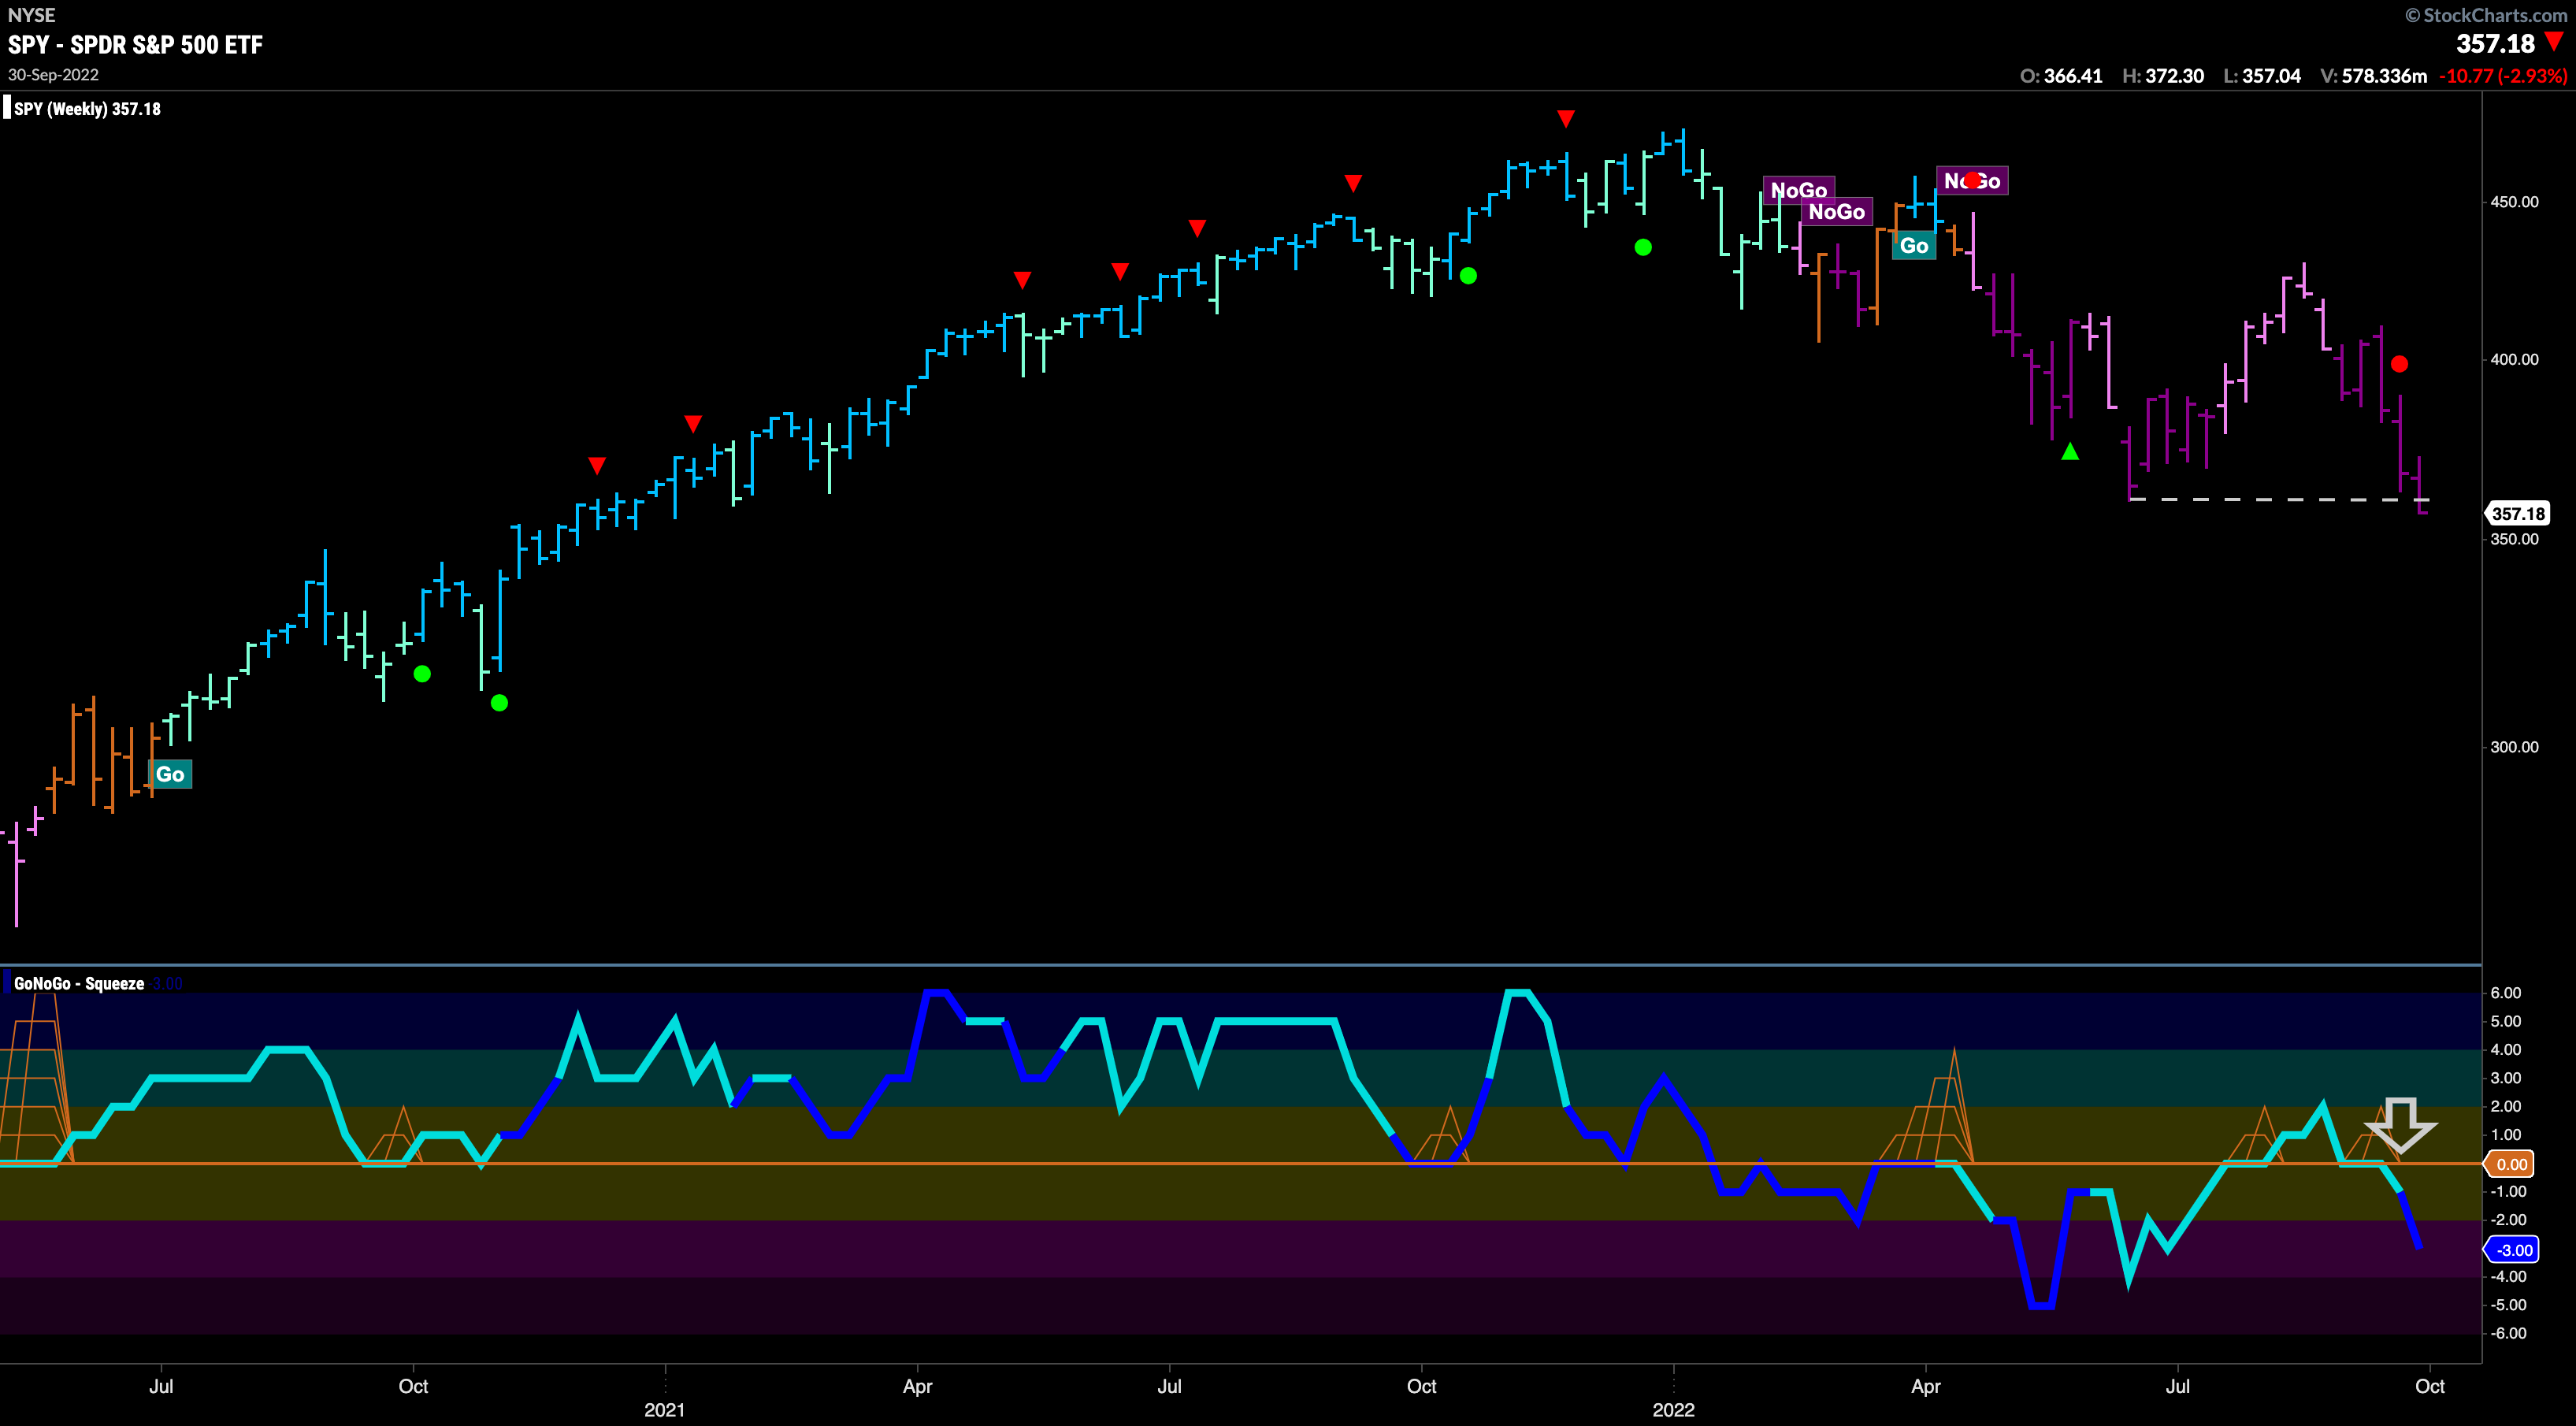
The weekly chart shows us the same story. A strong “NoGo” in place and price testing and edging lower than the prior low in June. Looking at the lower panel, we see that GoNoGo Oscillator has fallen further into negative territory which of course confirms the move we see in price. Furthermore, volume has picked up reflected by the oscillator turning from aqua to darker blue, indicating strong market participation.
“Go” Trend in Rates Shows No Signs of Slowing
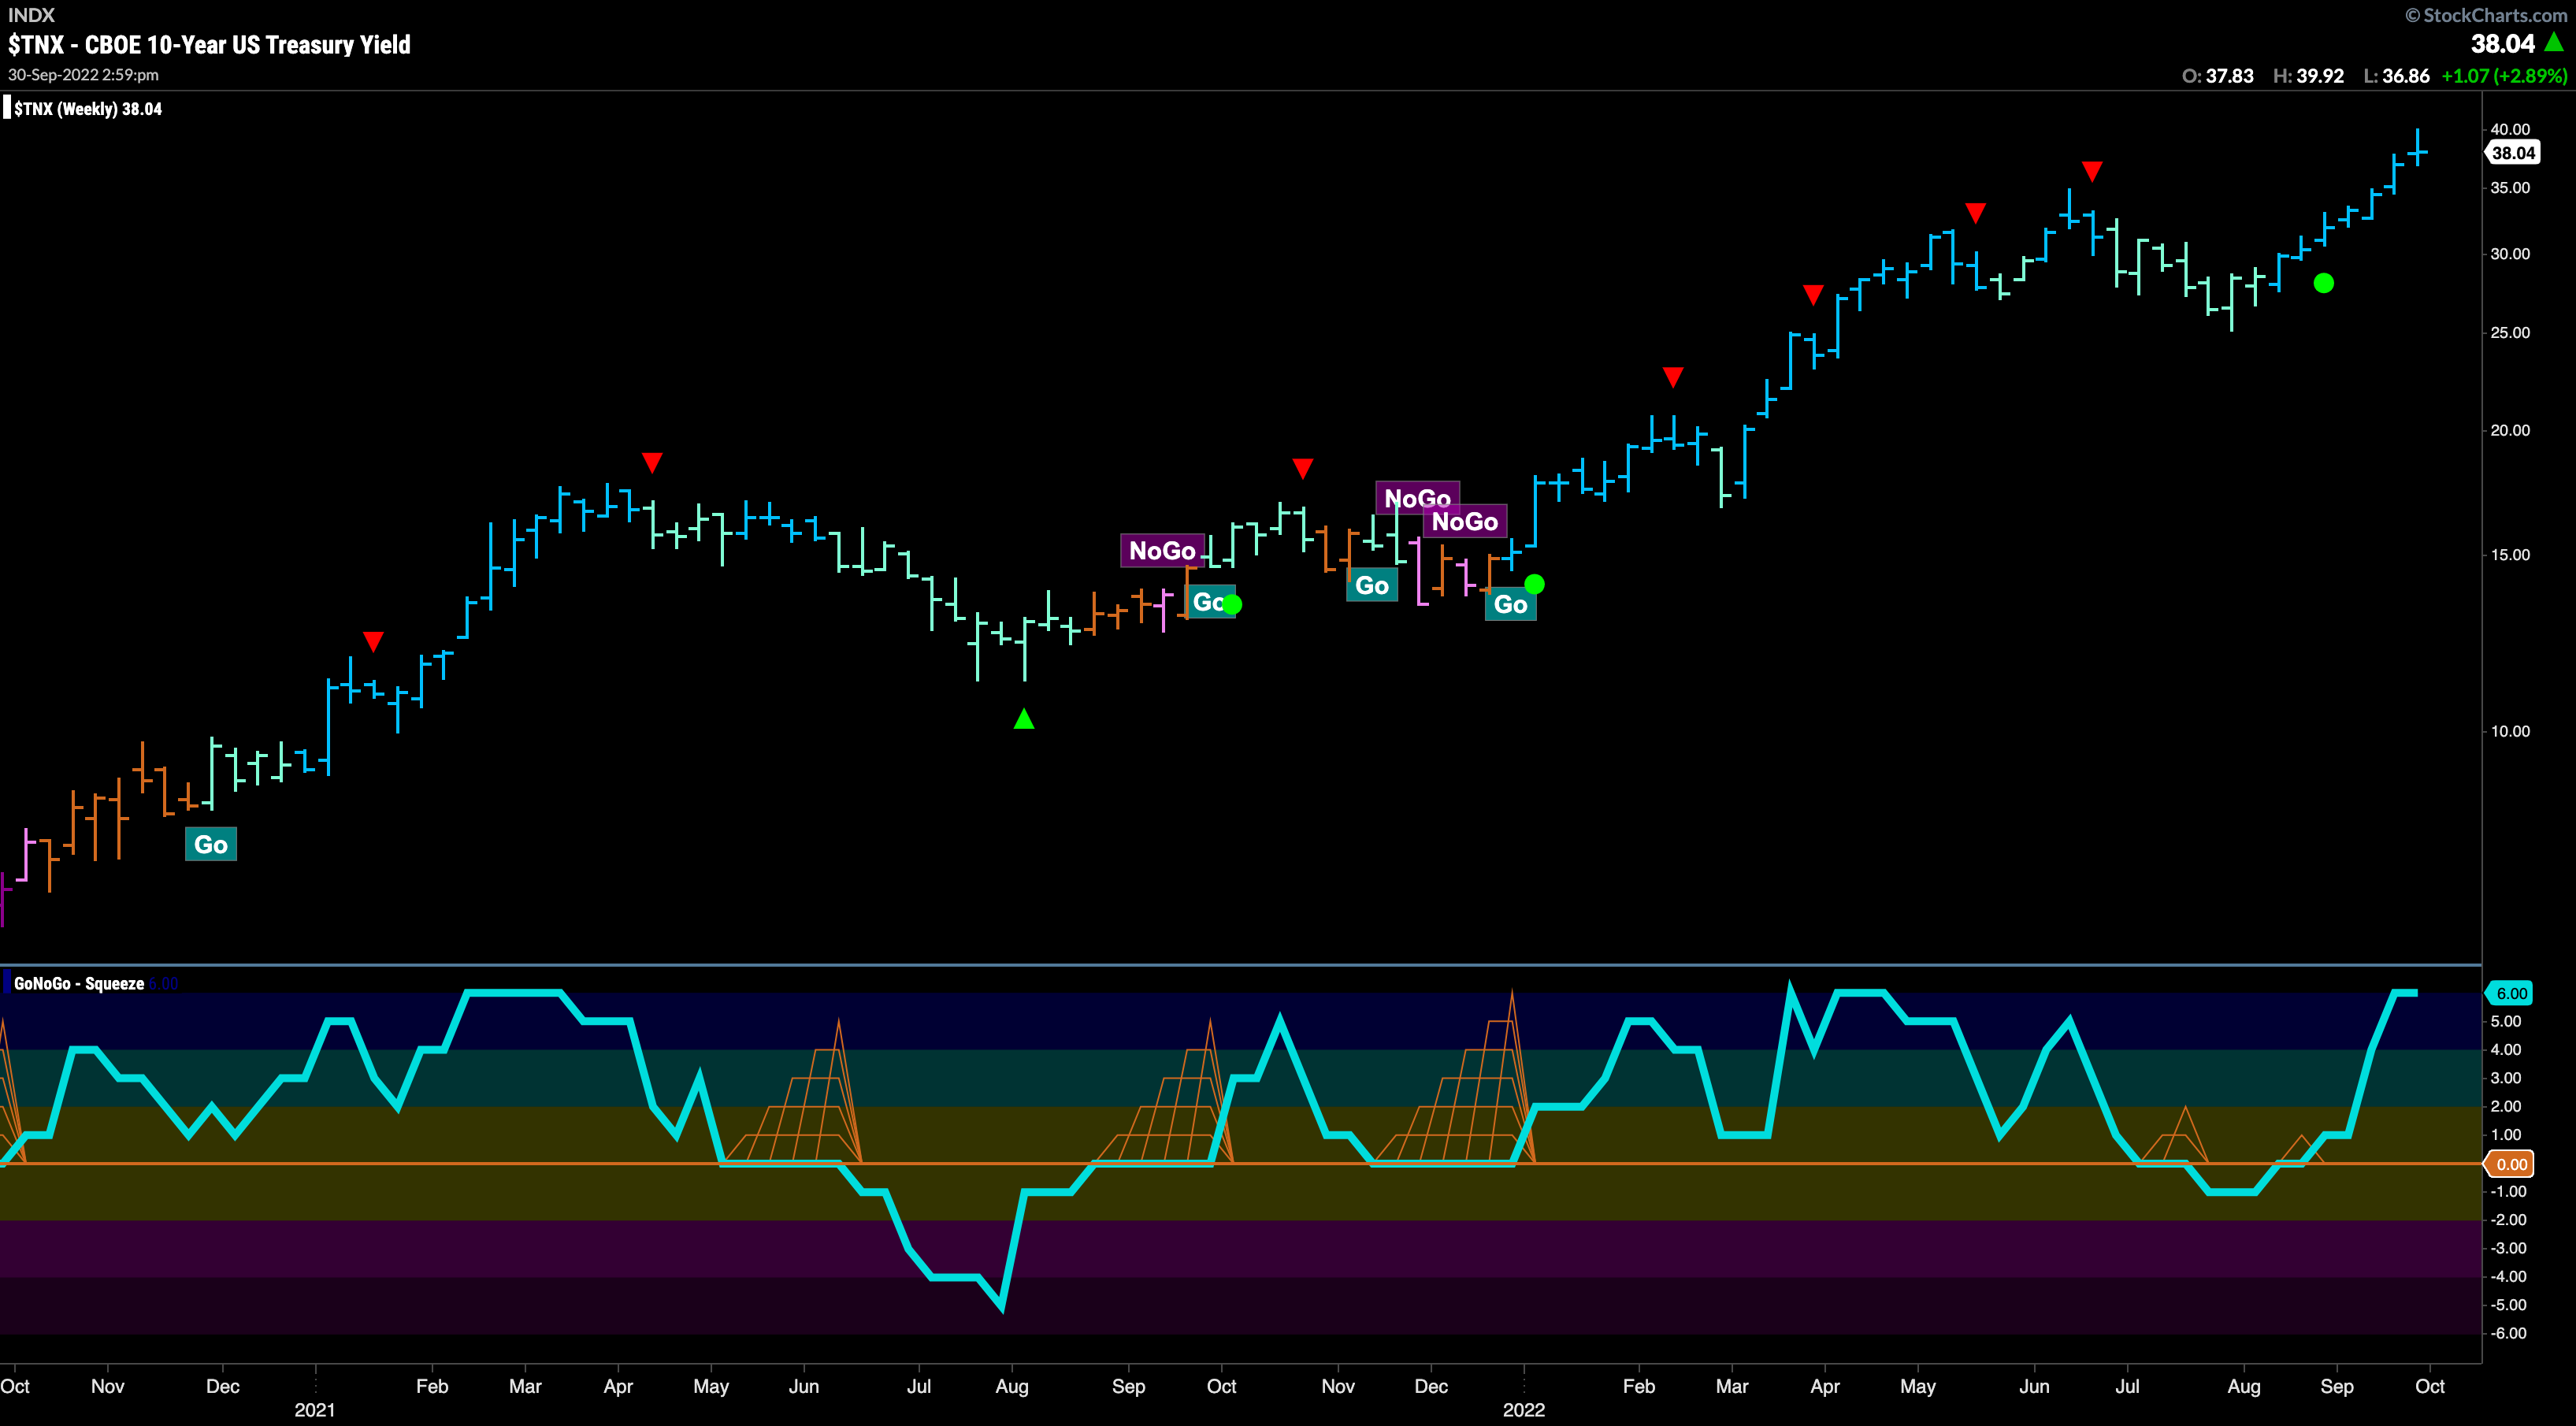
The end of last week saw a Go Trend Continuation Icon (green circle) as GoNoGo Oscillator regained positive territory. That give price all the encouragement it needed to burst through the prior high and it continued higher every day this week. GoNoGo Oscillator is in overbought territory currently as price paints a string of uninterrupted strong “Go” bars.
Dollar Retreats from Highs
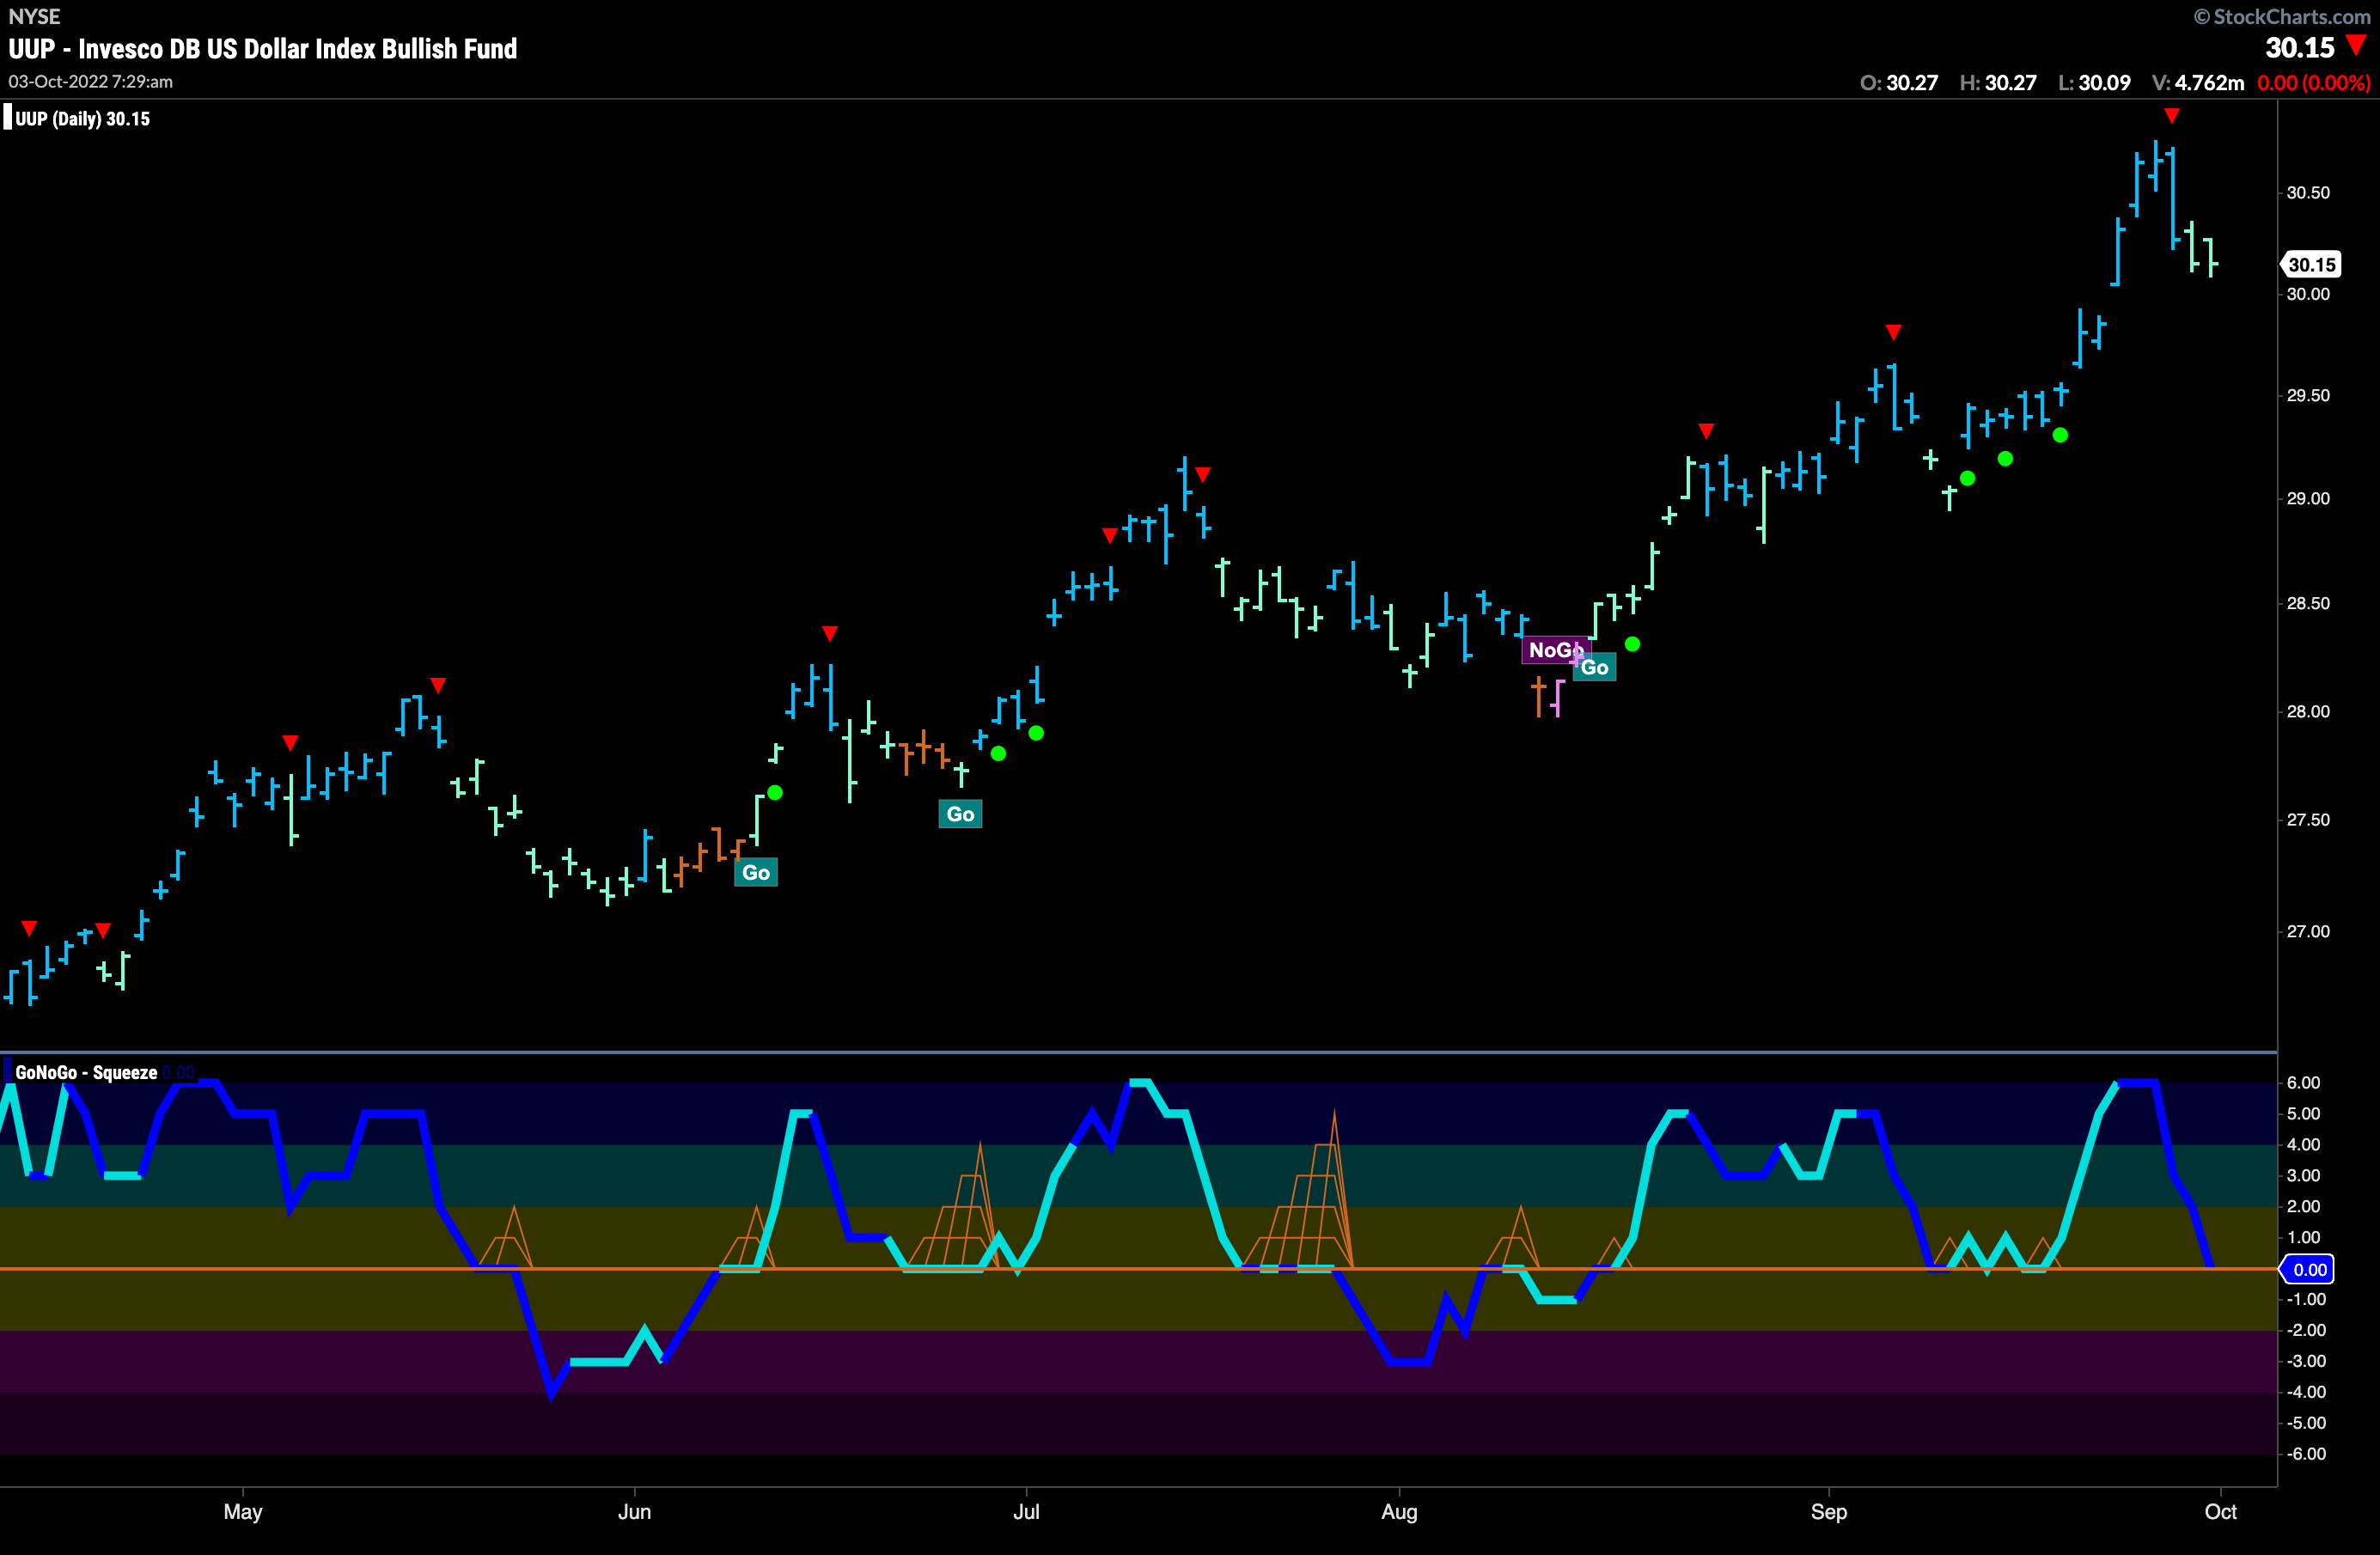
The U.S. dollar fell away from its most recent high mid week. The Go Countertrend Correction Icon (red arrow) signaled stalling momentum and suggested that price in short term could struggle to move higher. We have seen a couple of weaker aqua “Go” bars since. This price action has caused GoNoGo Oscillator to fall to the zero line on heavy volume where we will look to see if it finds support as we know it should if the “Go” trend is to persist.
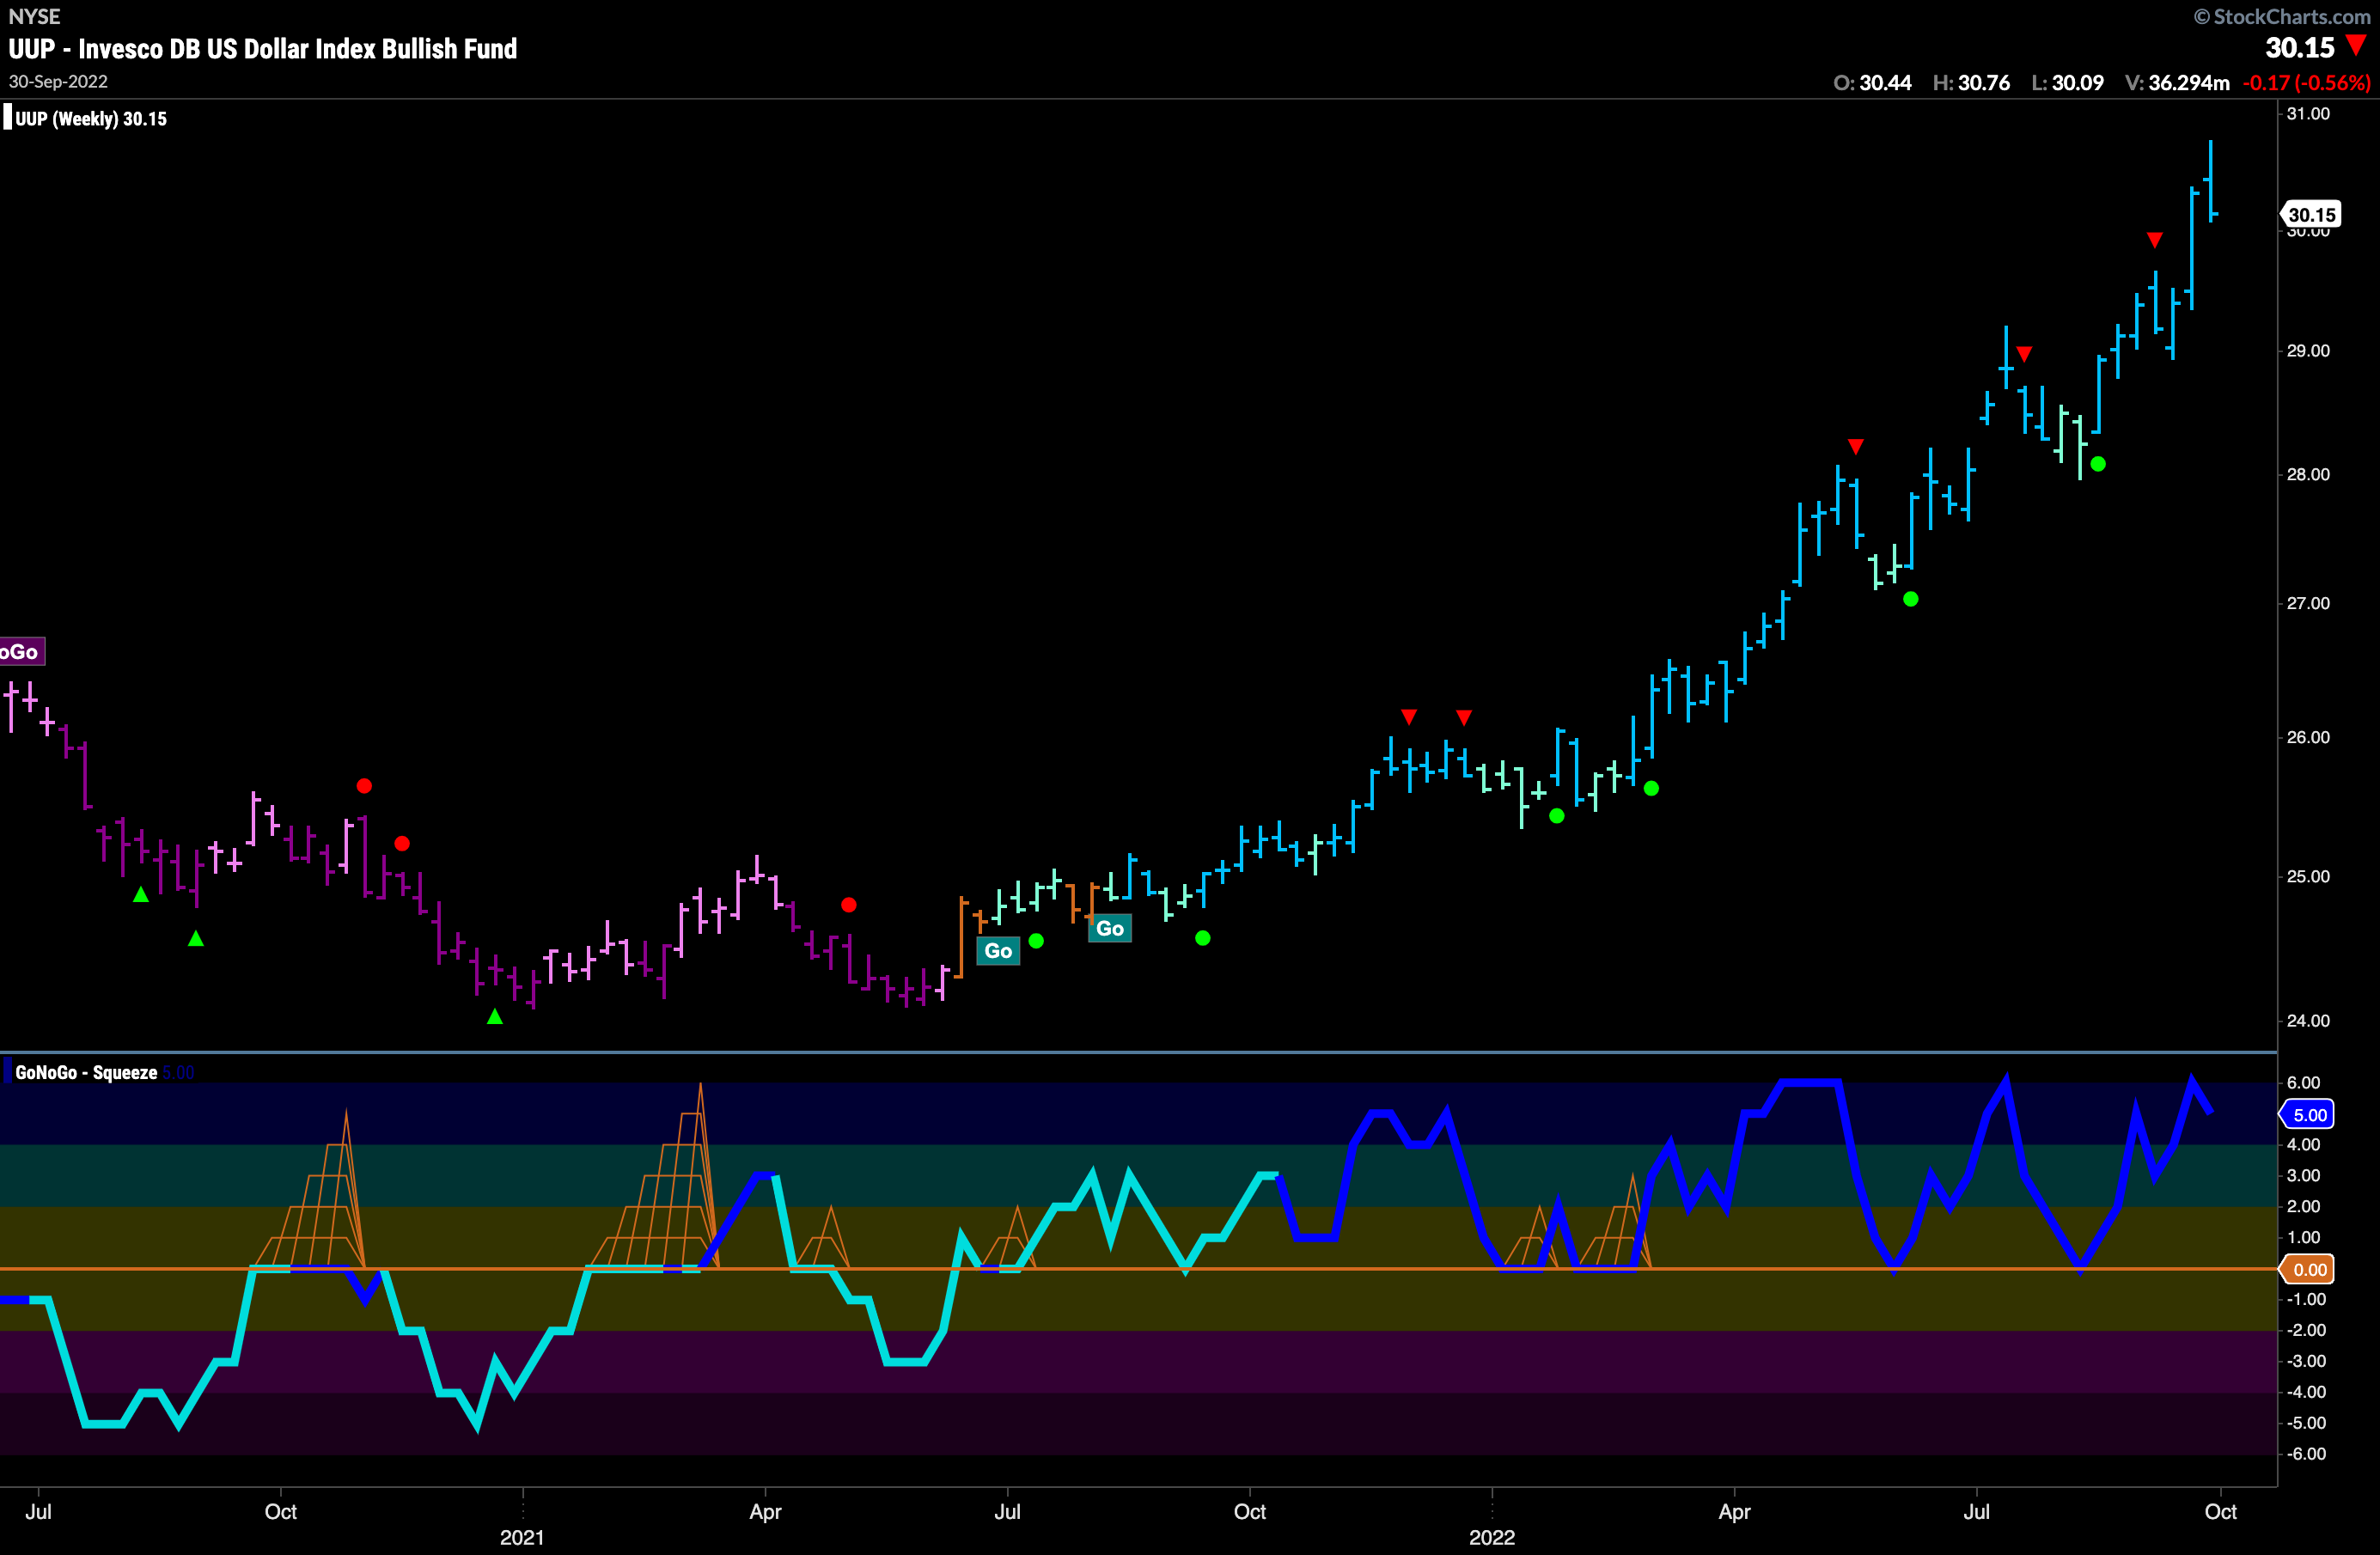
Longer Term Dollar Chart looks Blatantly Parabolic
Below is the weekly chart for $USO. We hit a new intra bar high this week as prices surged but fell away to end the week lower than the last. GoNoGo Oscillator is in overbought territory and we will look to see if it continues to fall towards the zero line. In that we would see a Go Countertrend Correction Icon (red arrow) appear above the price bar indicating that in the short term we may struggle to move higher.
Oil Looks Settled in its NoGo Trend
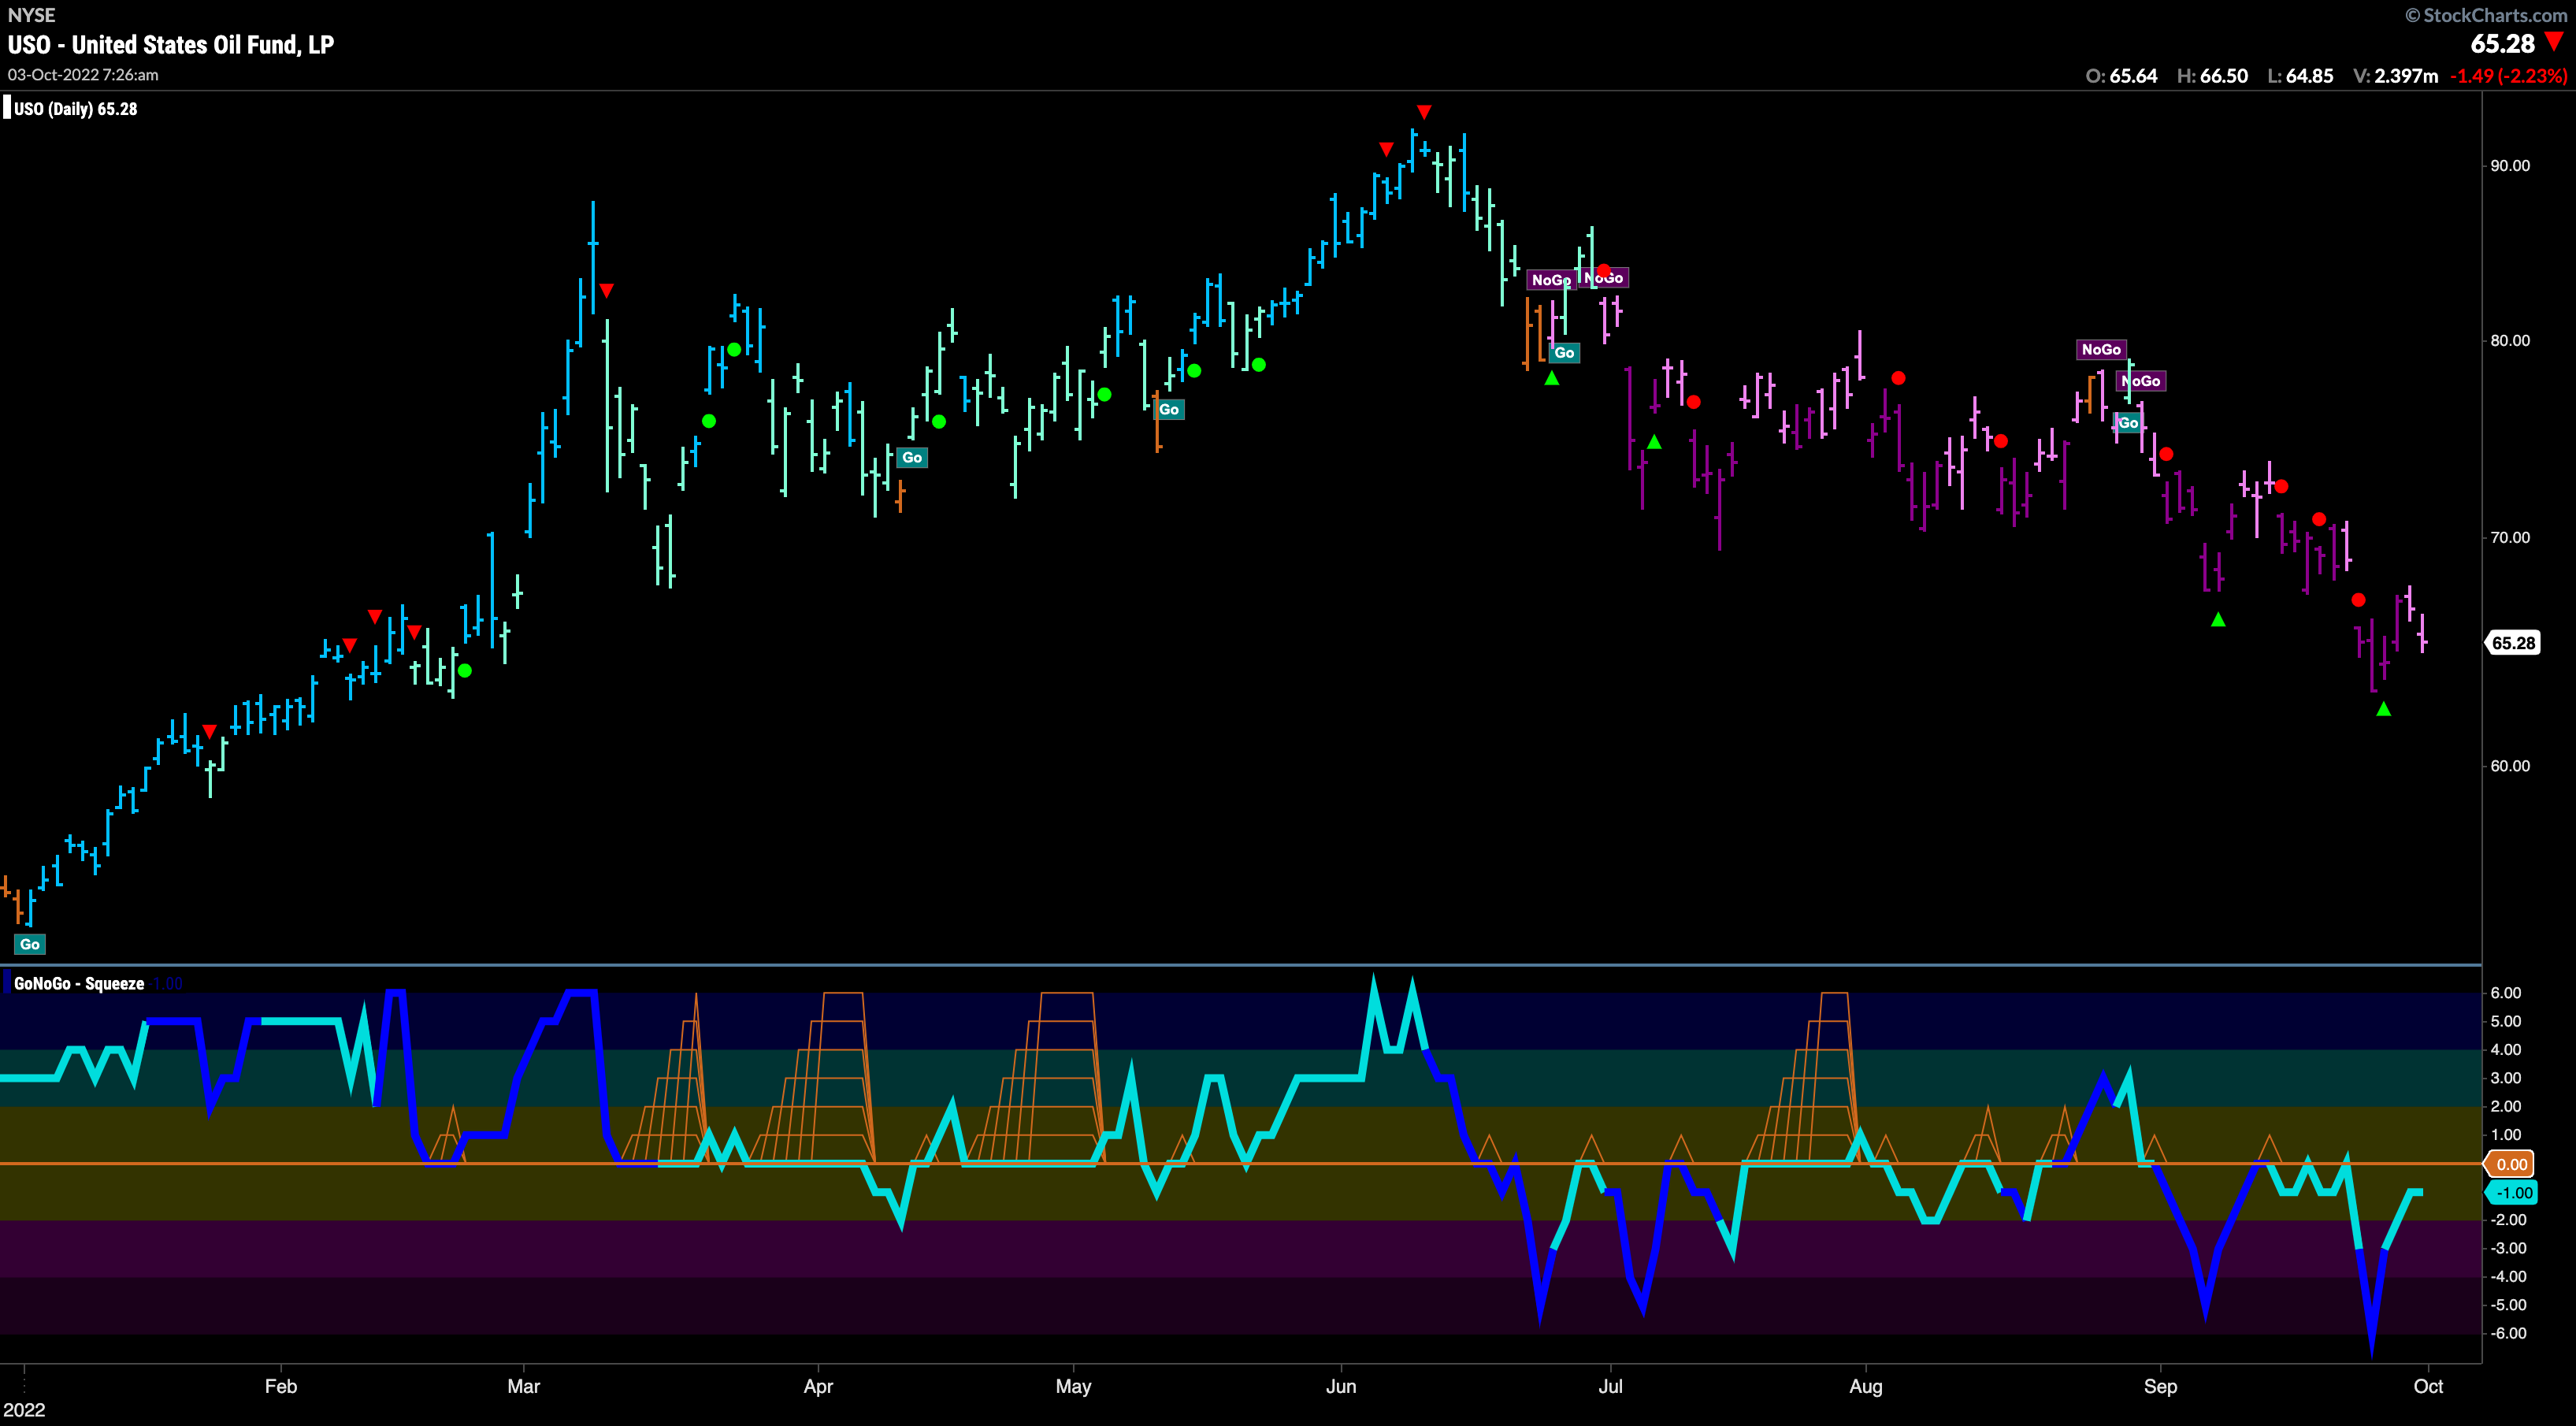
Below is the daily GoNoGo Chart for $USO. Price made a new lower low to start the week and although rallied for a few days struggled again on Friday. This therefore looks like a new lower high with GoNoGo Oscillator still in negative territory. We will see if the oscillator gets turned away by the zero line whether price will make another attack at a new low.
Weekly Oil Chart shows Strong NoGo
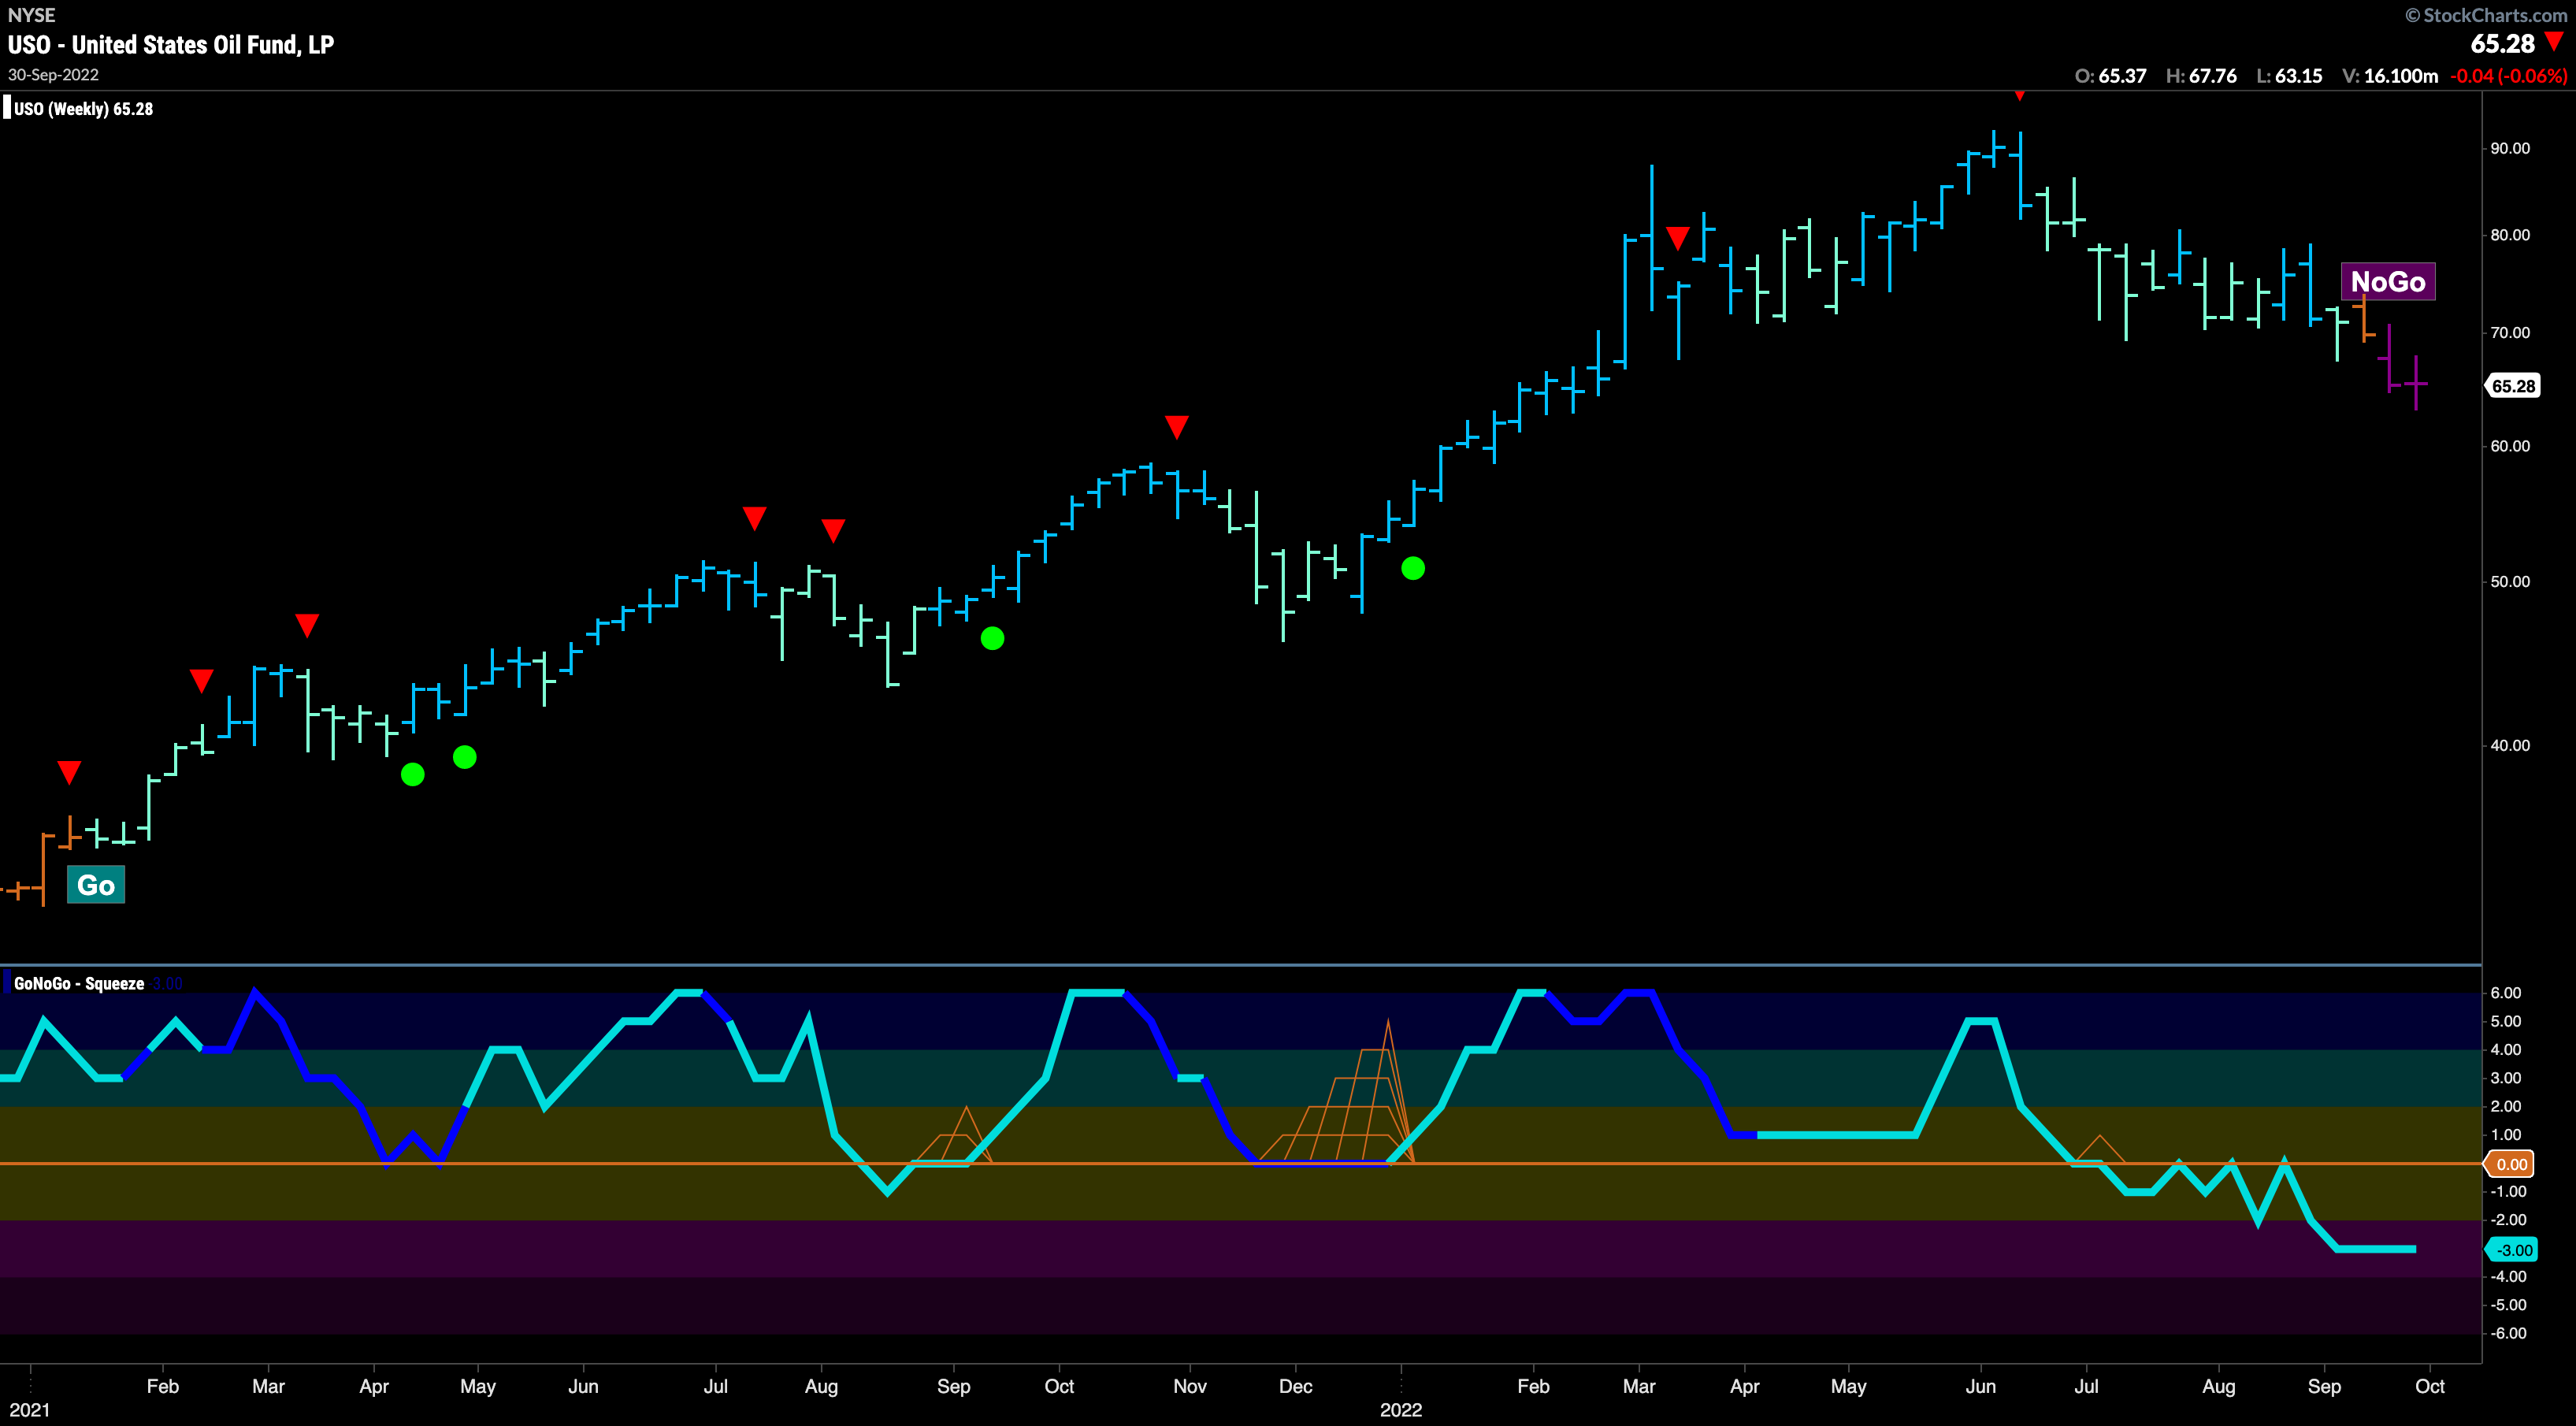
The weekly Oil chart shows a second strong purple “NoGo” bar as price moves further below horizontal support. GoNoGo Oscillator is now firmly in negative territory which doesn’t suggest any reason to look for a rally in the short term.
Sector RelMap
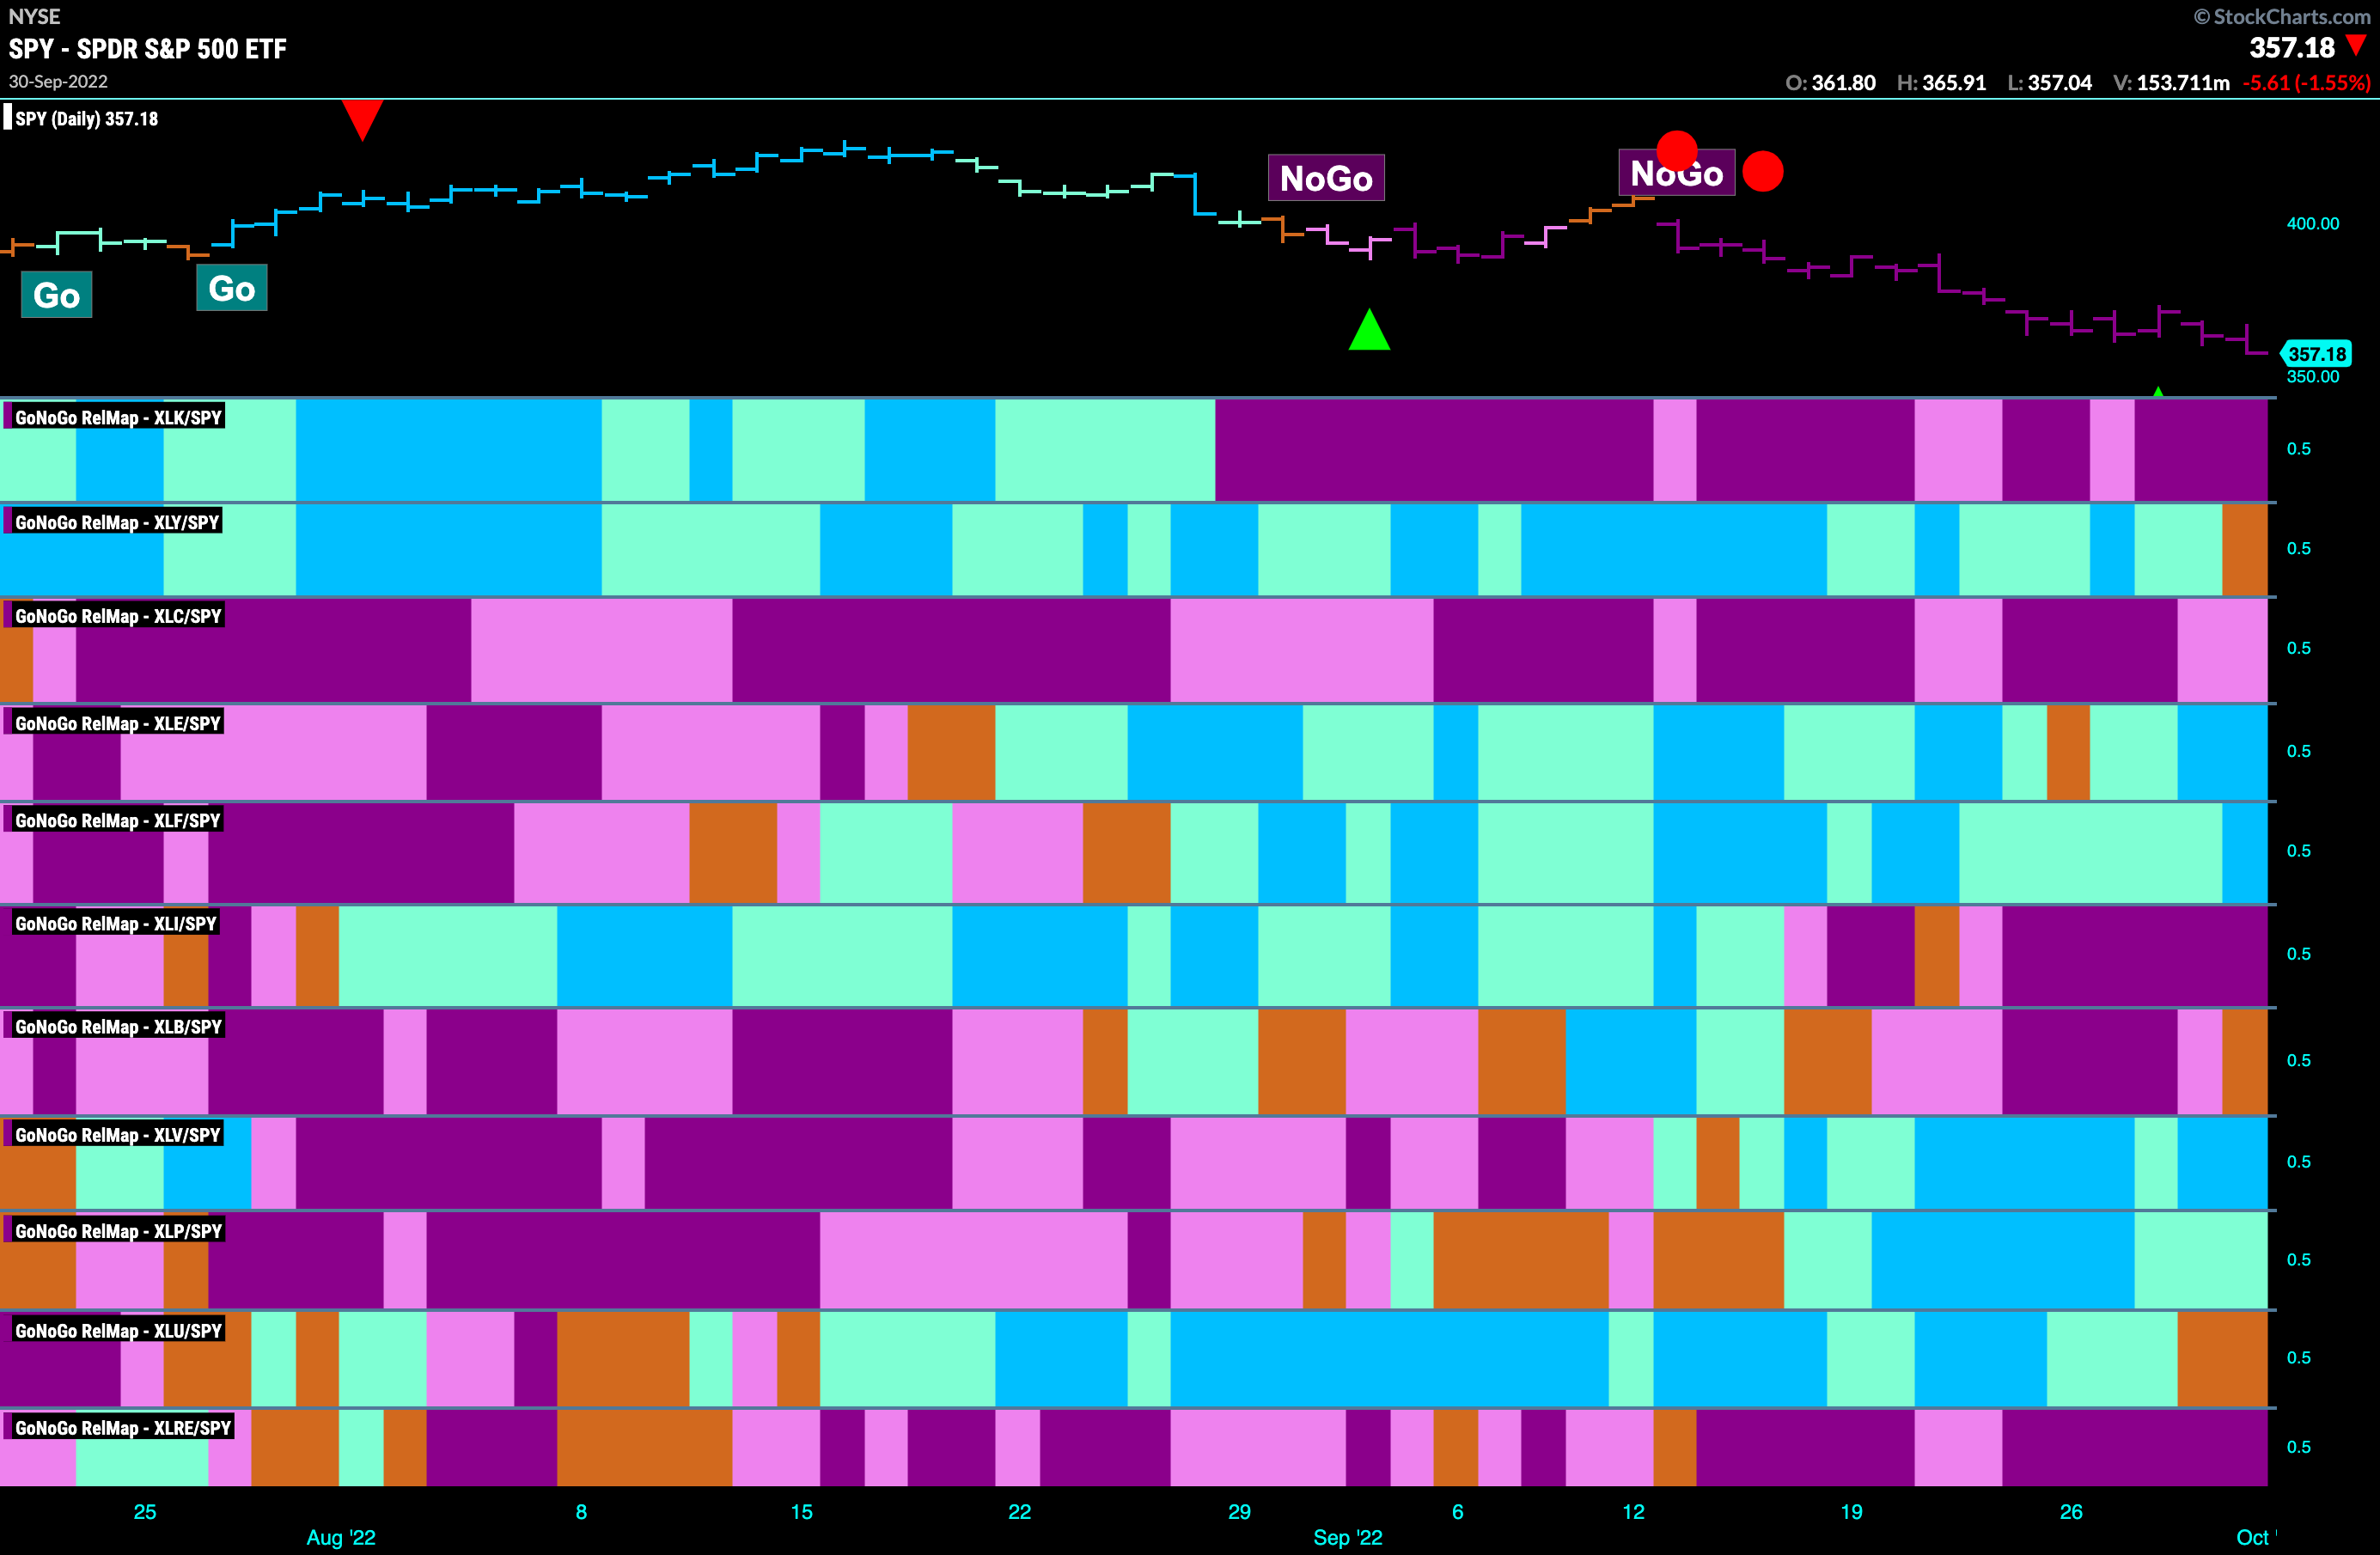
Below is the GoNoGo Sector RelMap. This GoNoGo RelMap applies the GoNoGo Trend to the relative strength ratios of the sectors to the base index. Looking at this map, we can quickly see where the relative outperformance is coming from as well as which sectors are lagging on a relative basis. The “Go” trends continue to fade away. This week we see discretionary end the week with an amber “Go Fish” bar and the same is true for utilities. That leaves only healthcare, staples, energy and financials in relative “Go” trends this week. The RelMap remains a defensive one.
$HUBB Showing Strength Against All Odds
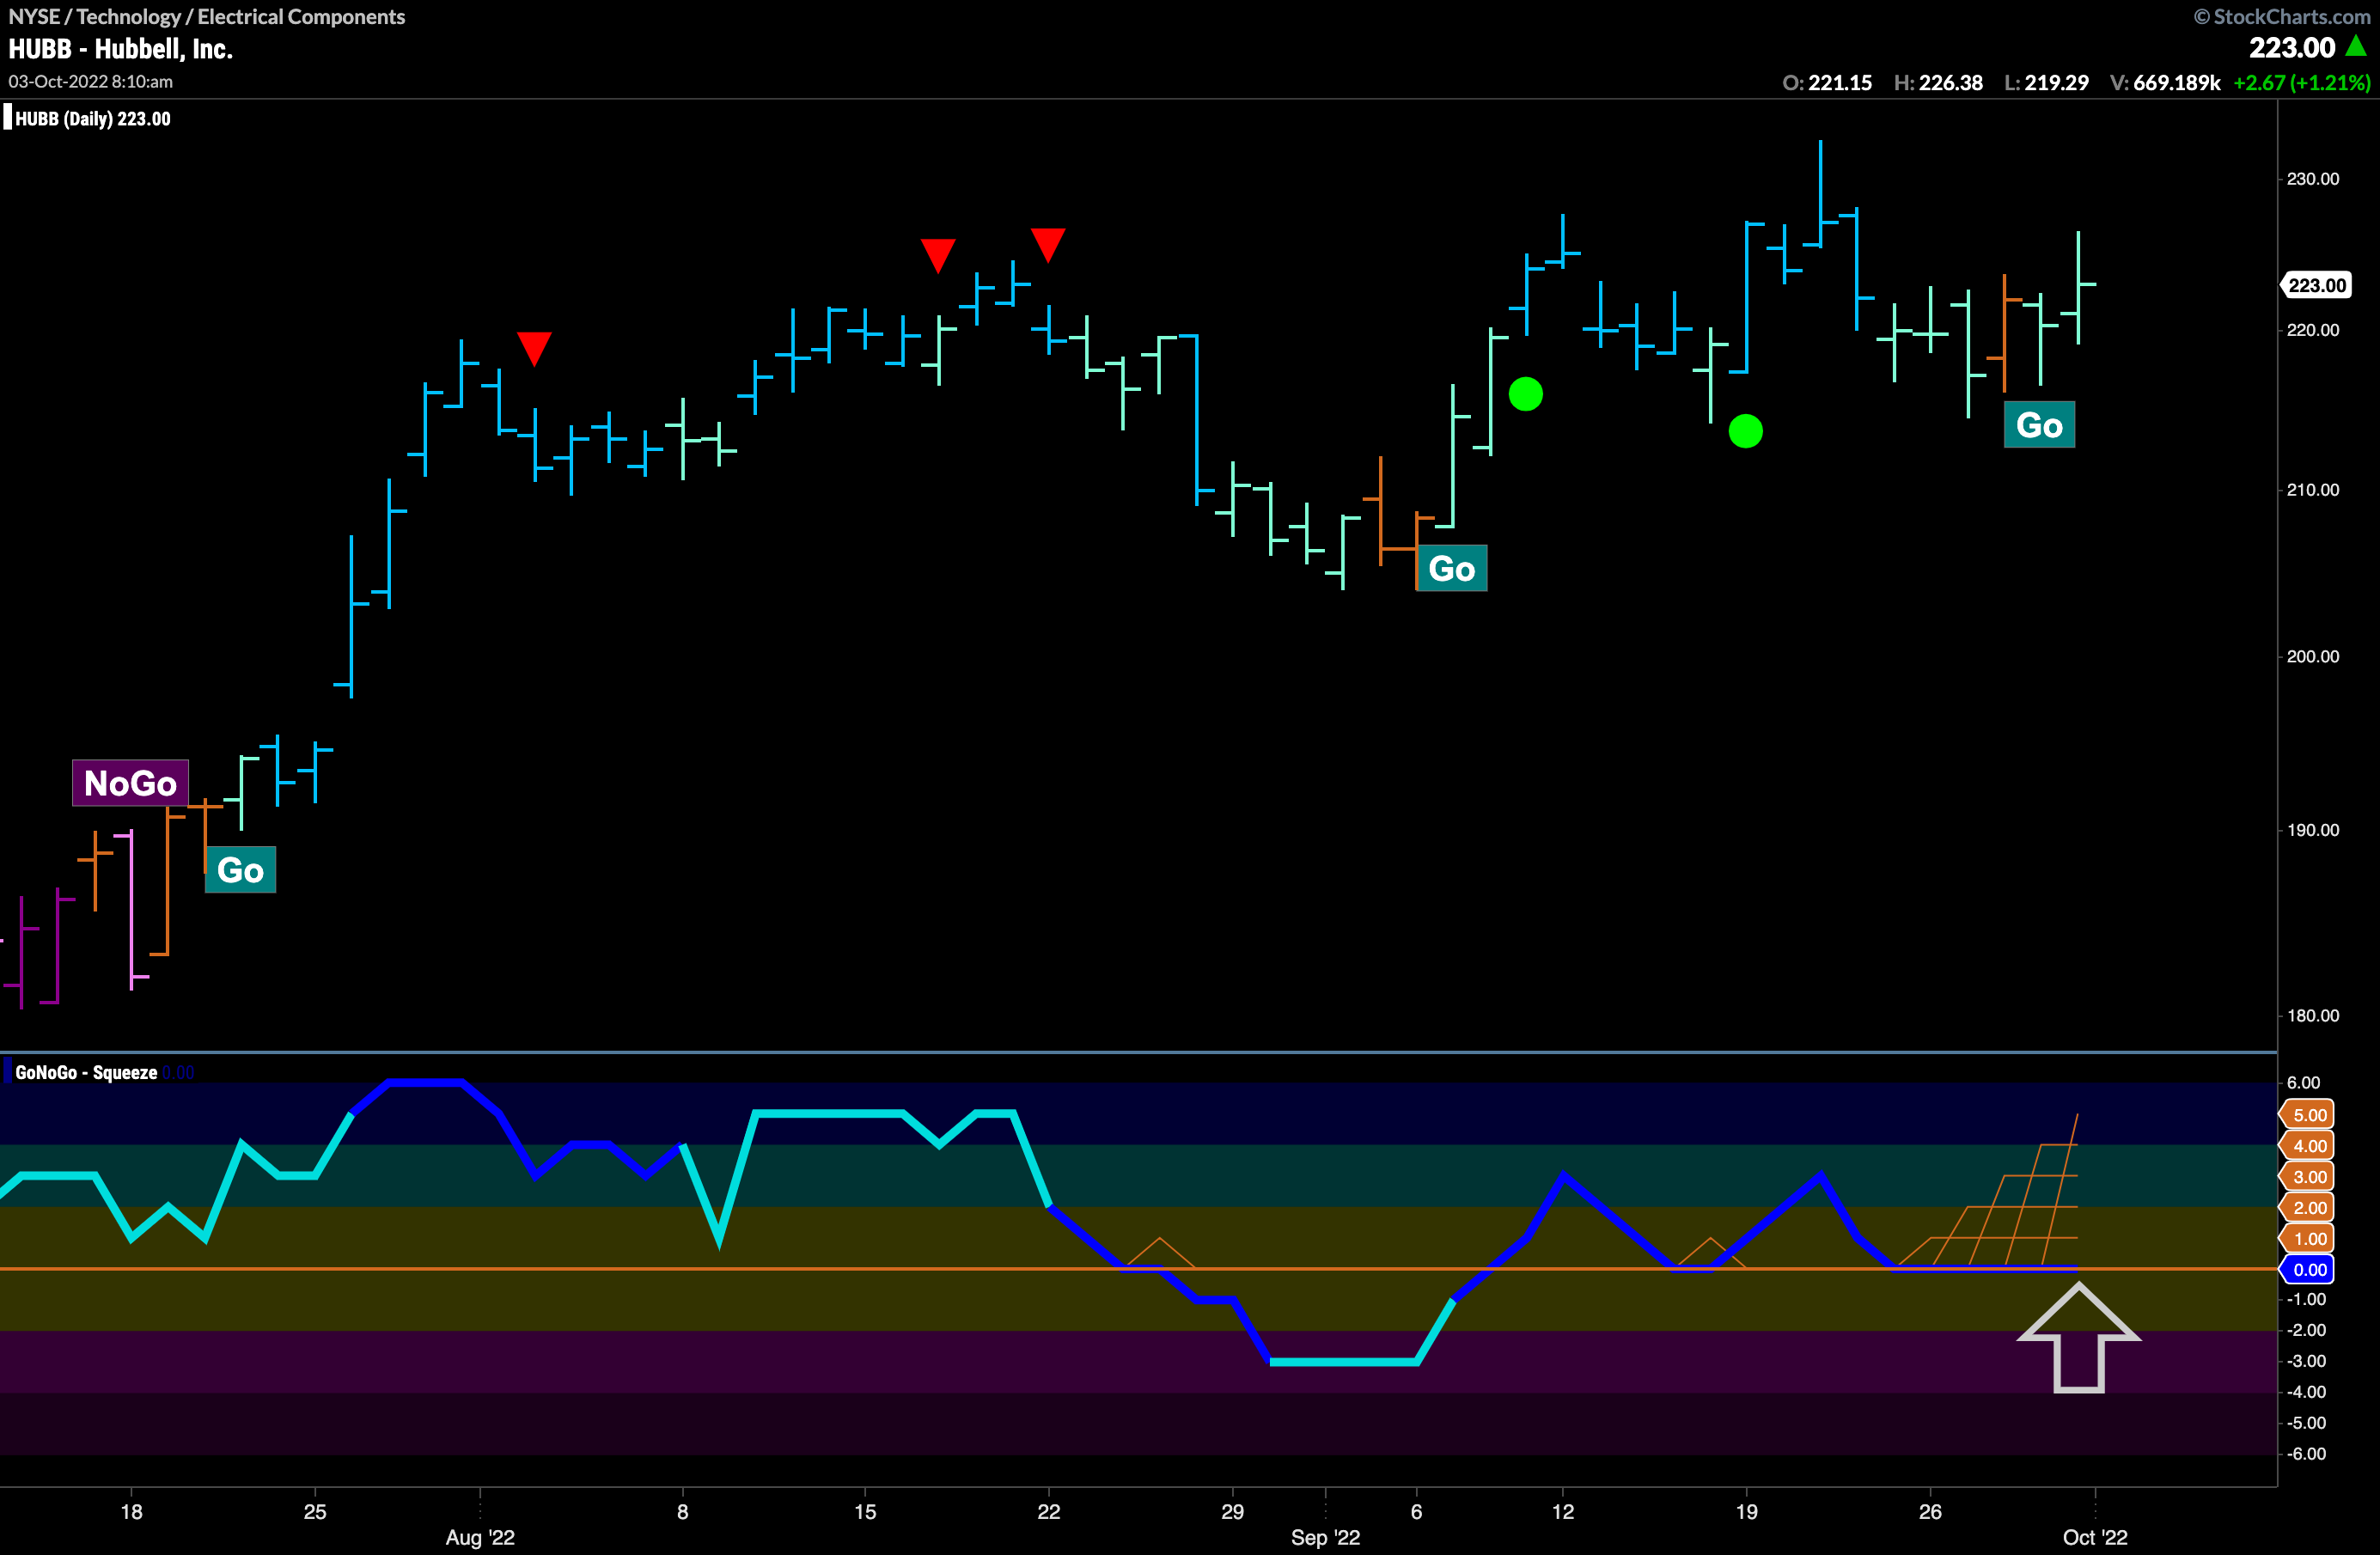
Throwing caution to the wind this week, I looked for a stock that has re-entered a “Go” trend in the face of bearish equity and sector movement. $HUBB is in the technology sector but has moved higher in a “Go” trend since July. Price looks to have set a higher low, and after a single amber “Go Fish” bar the “Go” trend resumed. During this time, GoNoGo Oscillator has been riding the zero line as directional momentum is not clear. A GoNoGo Squeeze builds. If the oscillator can break out of the Squeeze into positive territory we will see a Go Trend Continuation Icon (green circle) under price indicating that momentum is resurgent in the direction of the “Go” trend.
$HUBB 60 Minute Chart
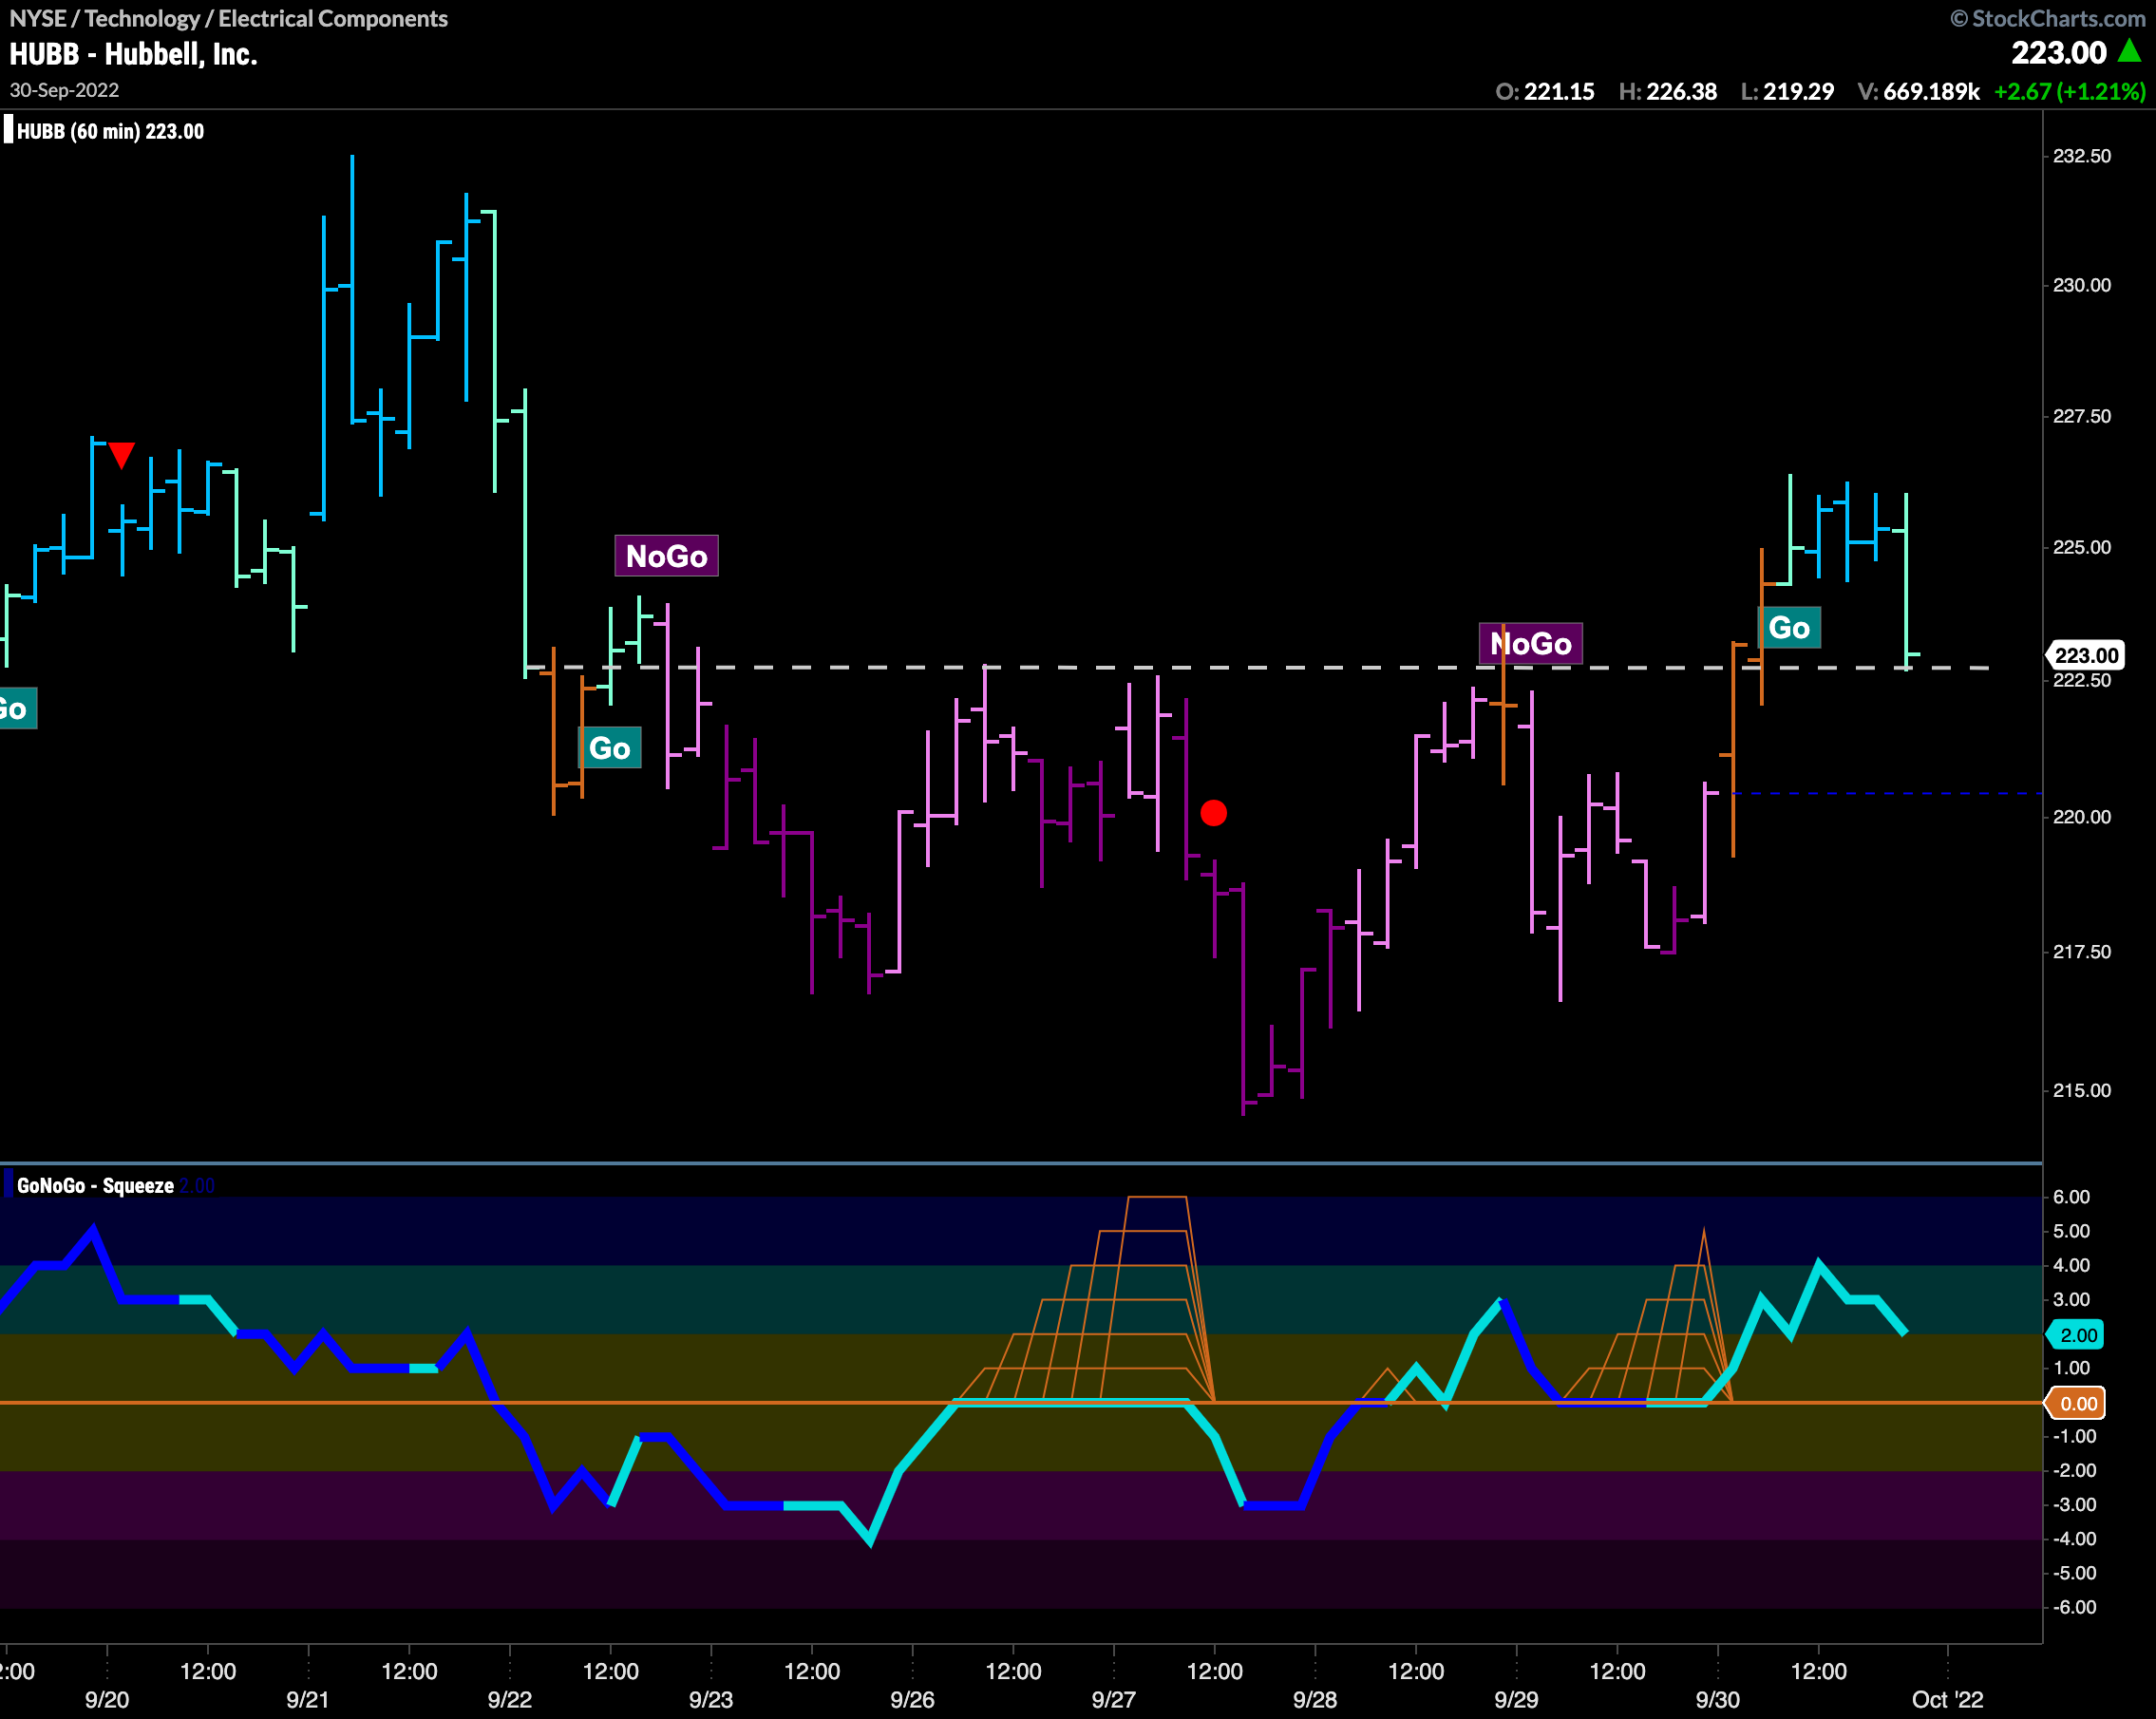
If an investor wanted to take an early position given the possibilities discussed above, a shorter time frame chart could be analyzed. The 1 hr chart below shows that price has broken above strong horizontal resistance and entered a “Go” trend of its own. The last hour of trading on Friday saw price fall back to this level. A successful retest here could be a sensible opportunity to enter in the direction of this and the longer term “Go”.
