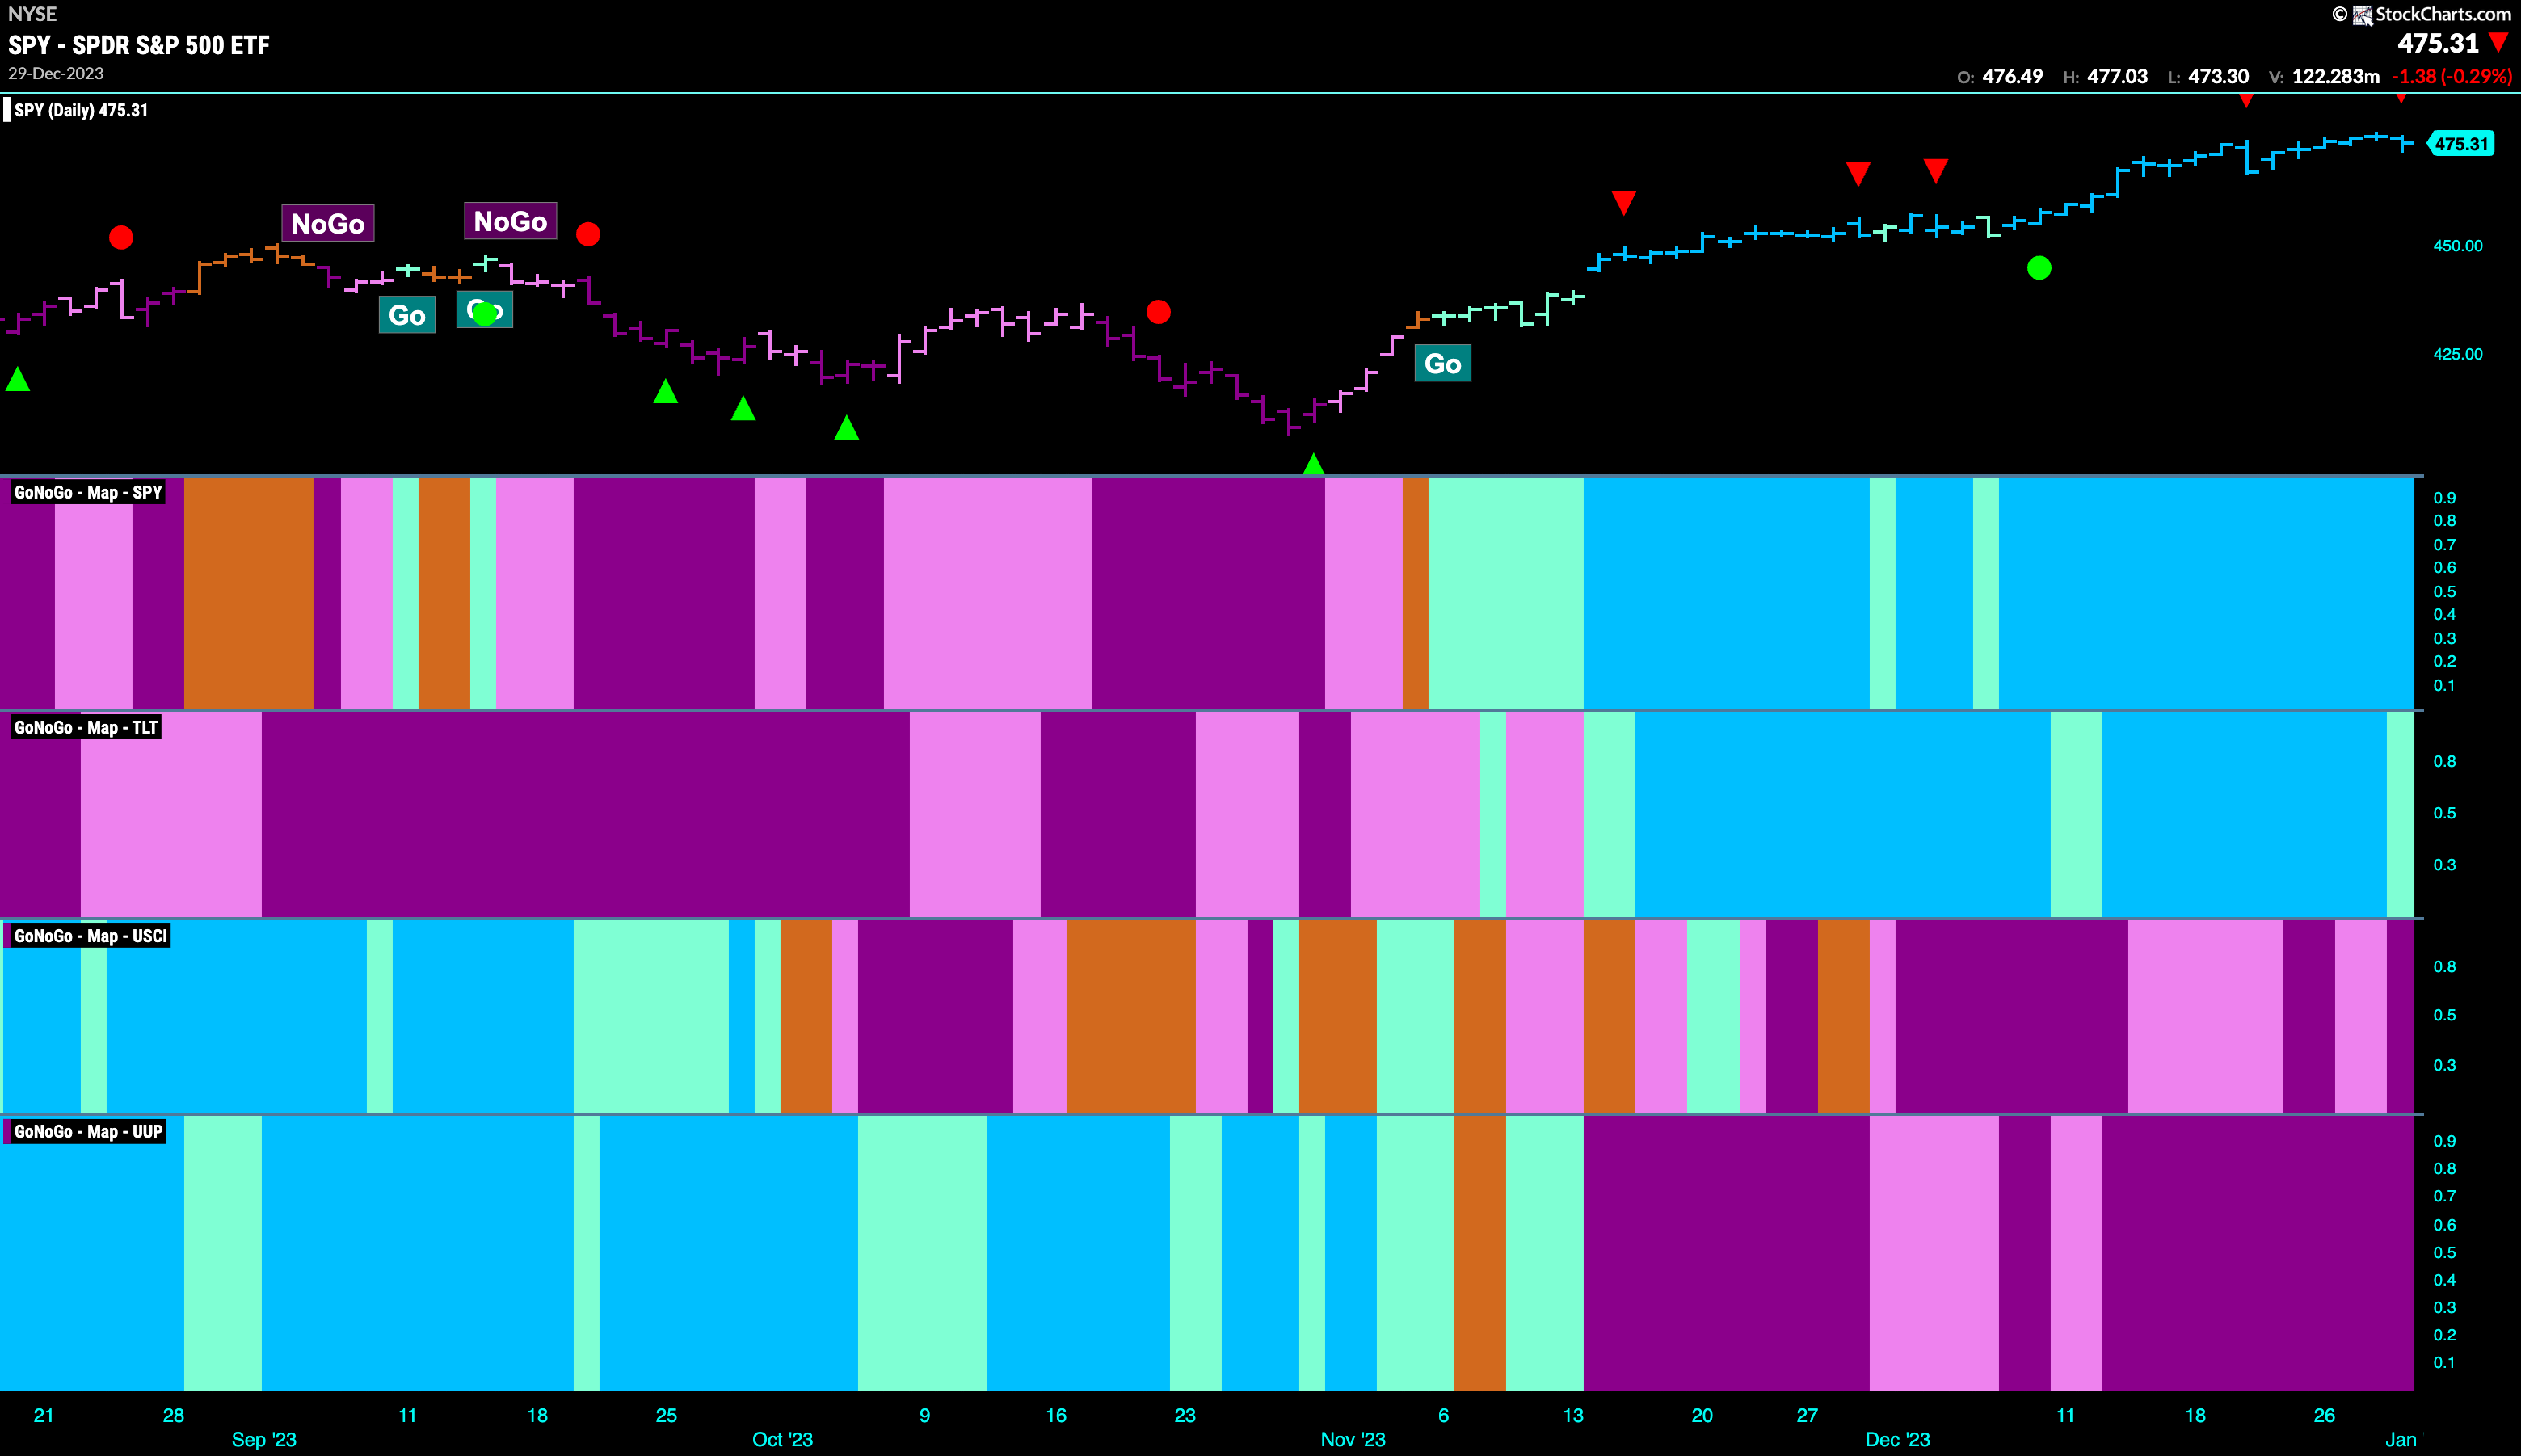
Good morning and welcome to this week’s Flight Path. Equities saw another complete week of strong blue “Go” bars as prices edged higher again this past week. Treasury bond prices maintained the “Go” trend but they did see an aqua bar painted at the end of the week. Commodities remain embroiled in a “NoGo” trend that strengthened again at the end of the week. The dollar of course remained painting strong purple bars as it endured another difficult week.
Equities Continue to Show Strength
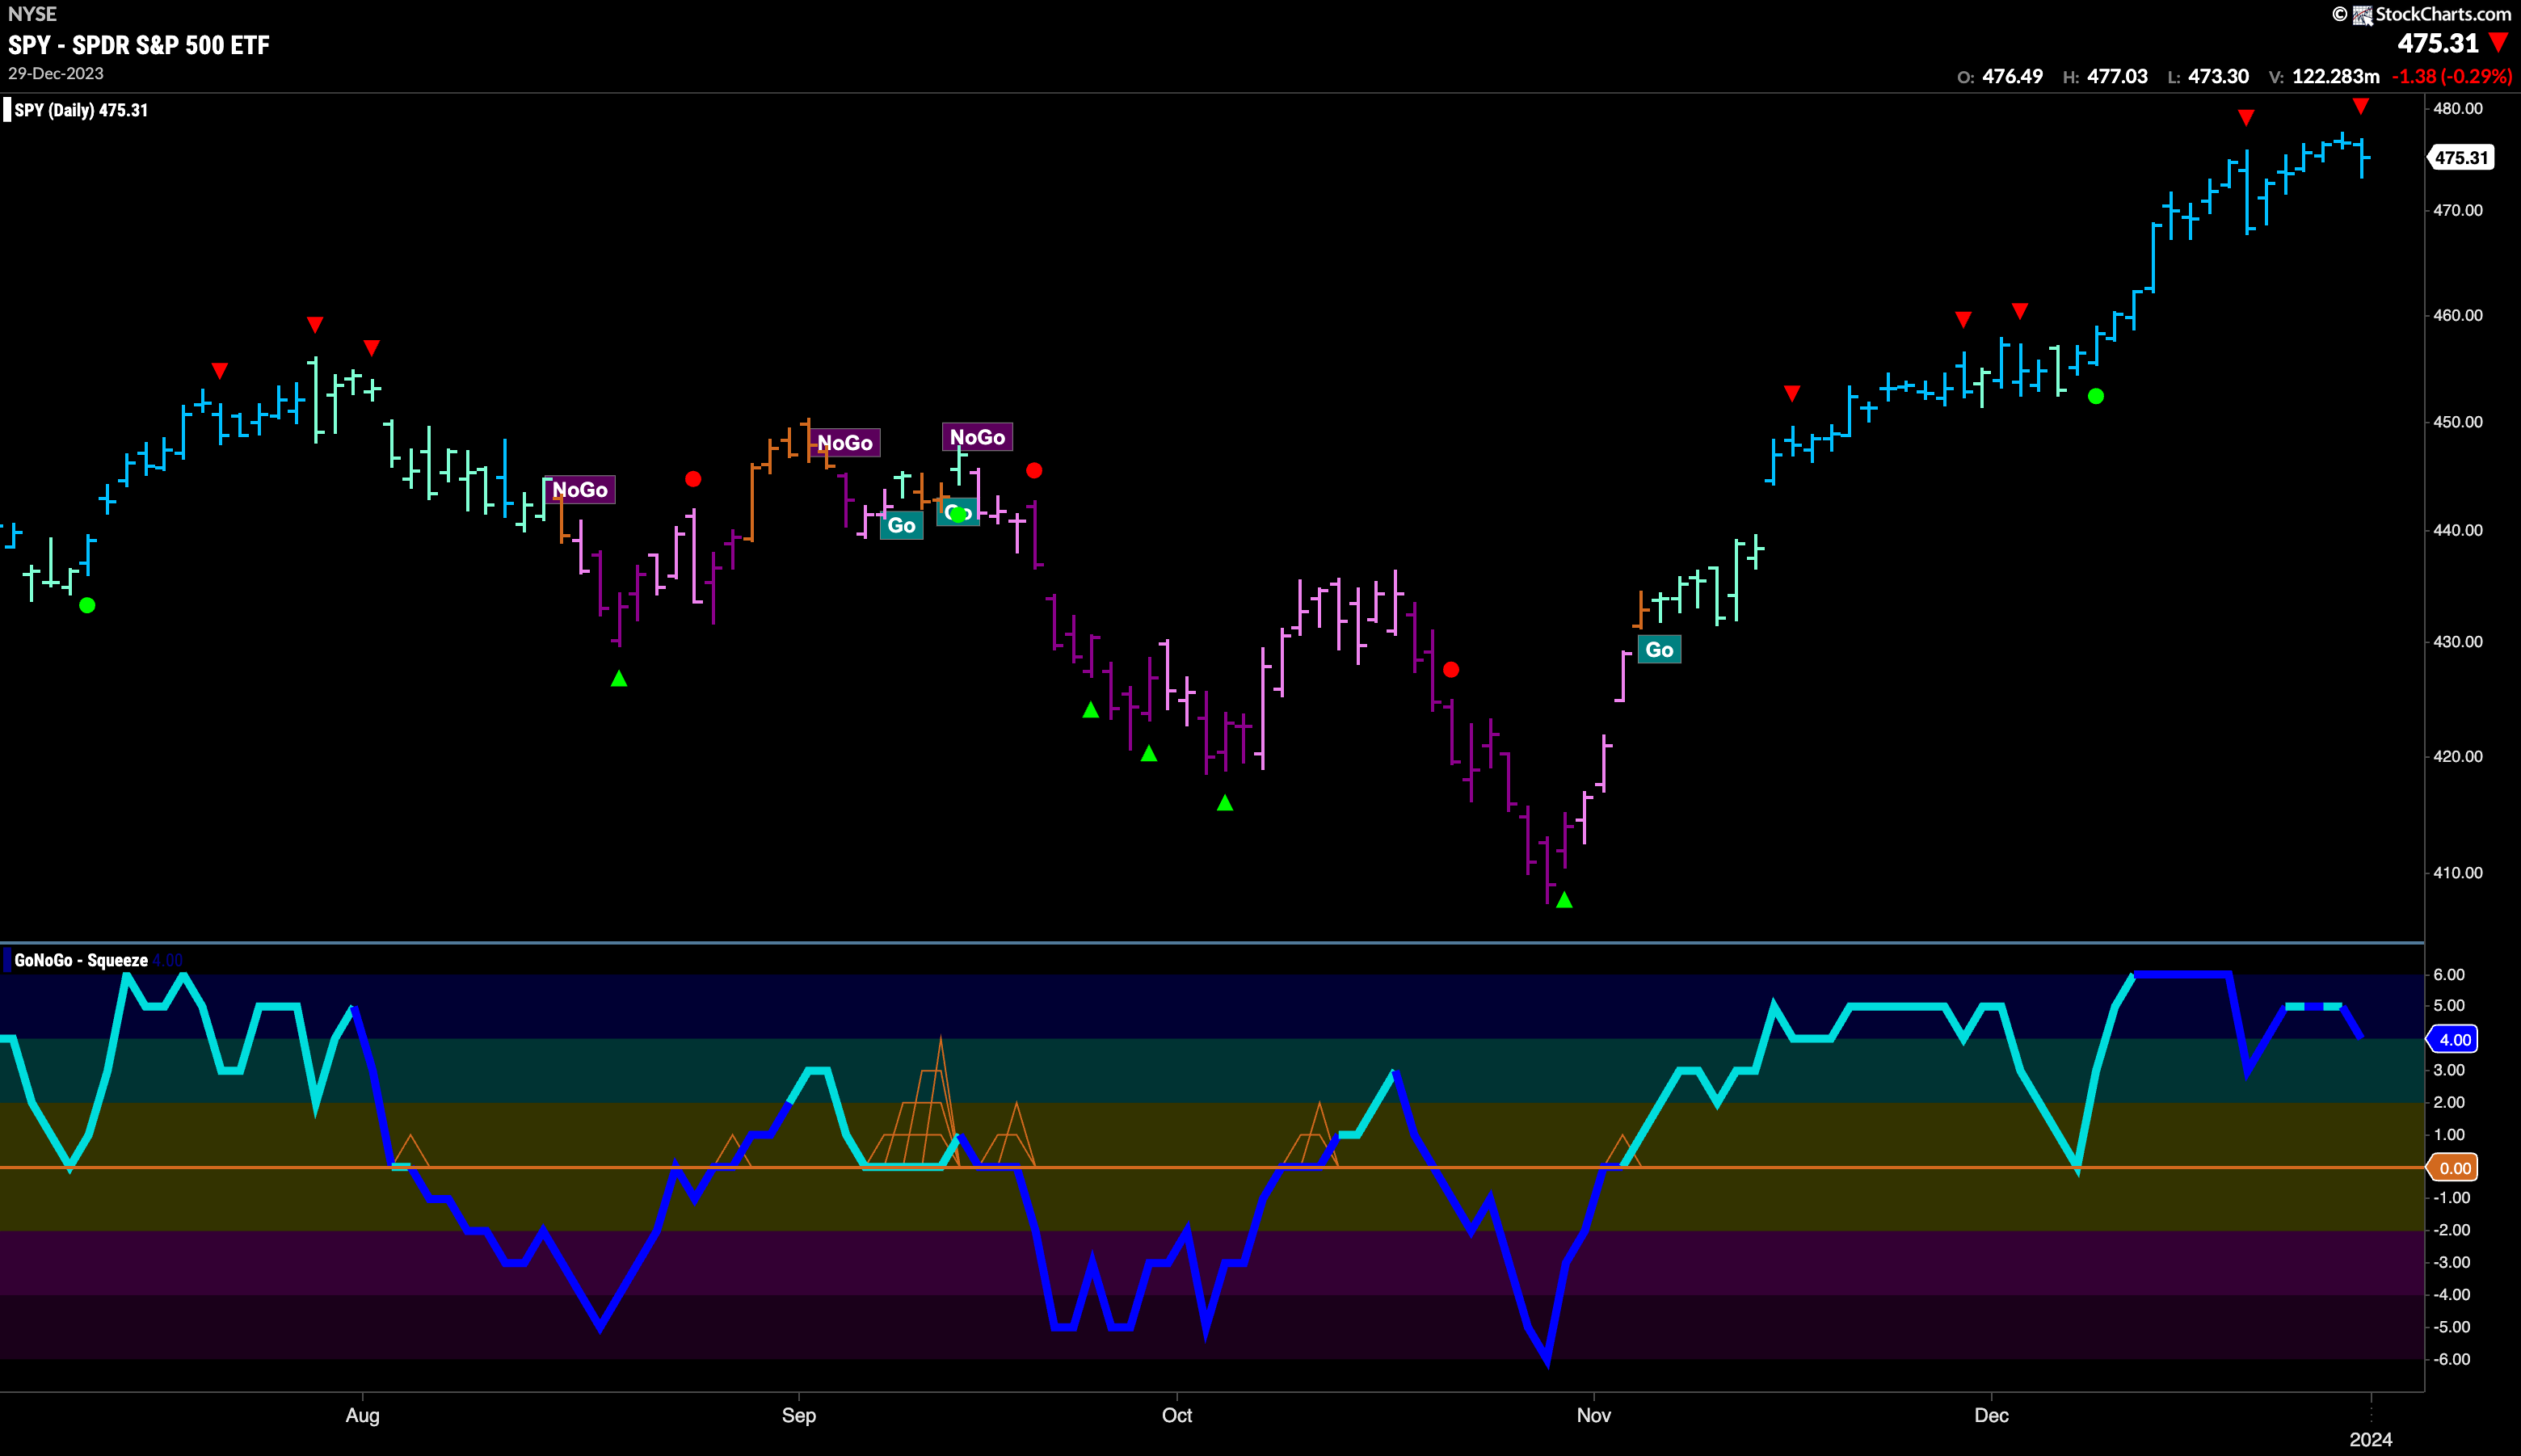
Another week another (slightly) higher high. We saw prices climb and a continuation of the uninterrupted strong blue “Go” bars that have been in place now for several weeks. We have another Go Countertrend Correction Icon (red arrow) that tells us price may struggle to go higher in the short term and so we will watch for a pullback from here. GoNoGo Oscillator has come off overbought territory and we do see some slight bearish divergence as it makes a slightly lower high. We will watch as the oscillator approaches the zero line to see if it finds support at that level.
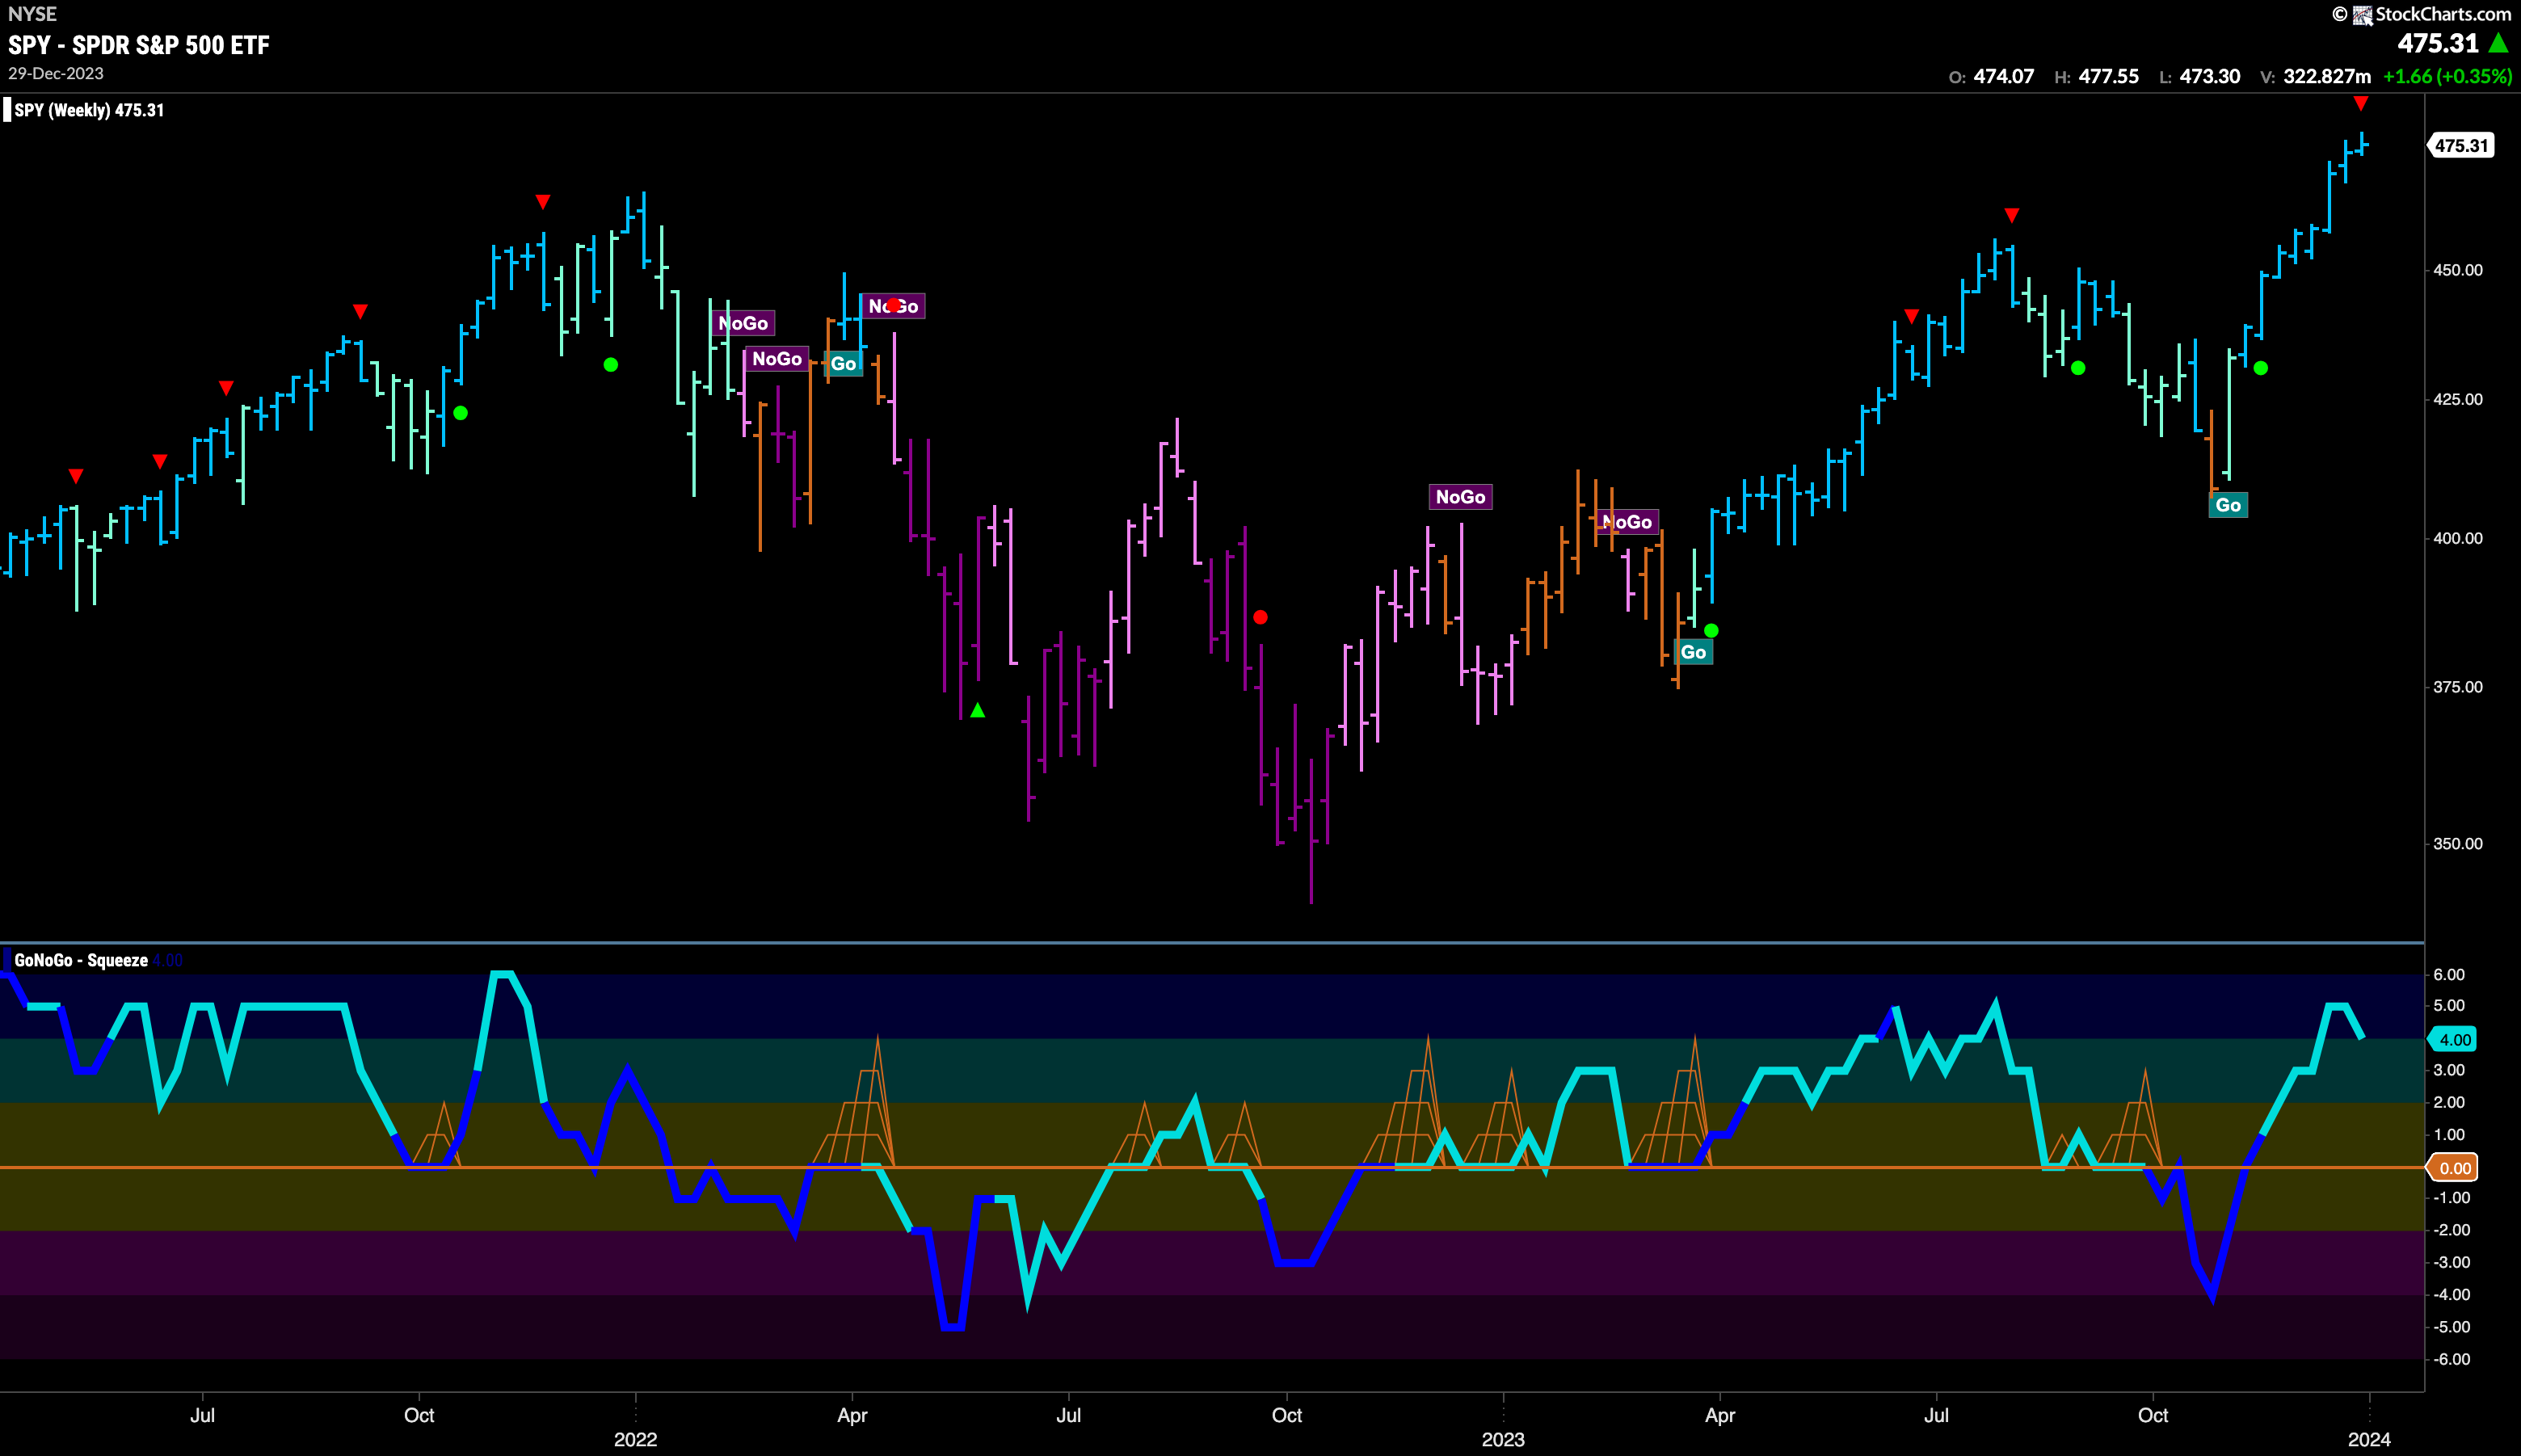
The weekly chart shows another higher weekly close. The 9th higher weekly close in a row. This has been a strong run to all time highs. We do see a Go Countertrend Correction Icon (red arrow) on the weekly chart as well. We will watch to see if price can maintain this strength or if there will be a pull back of sorts as momentum cools.
Treasury Rates Set new Lower Low
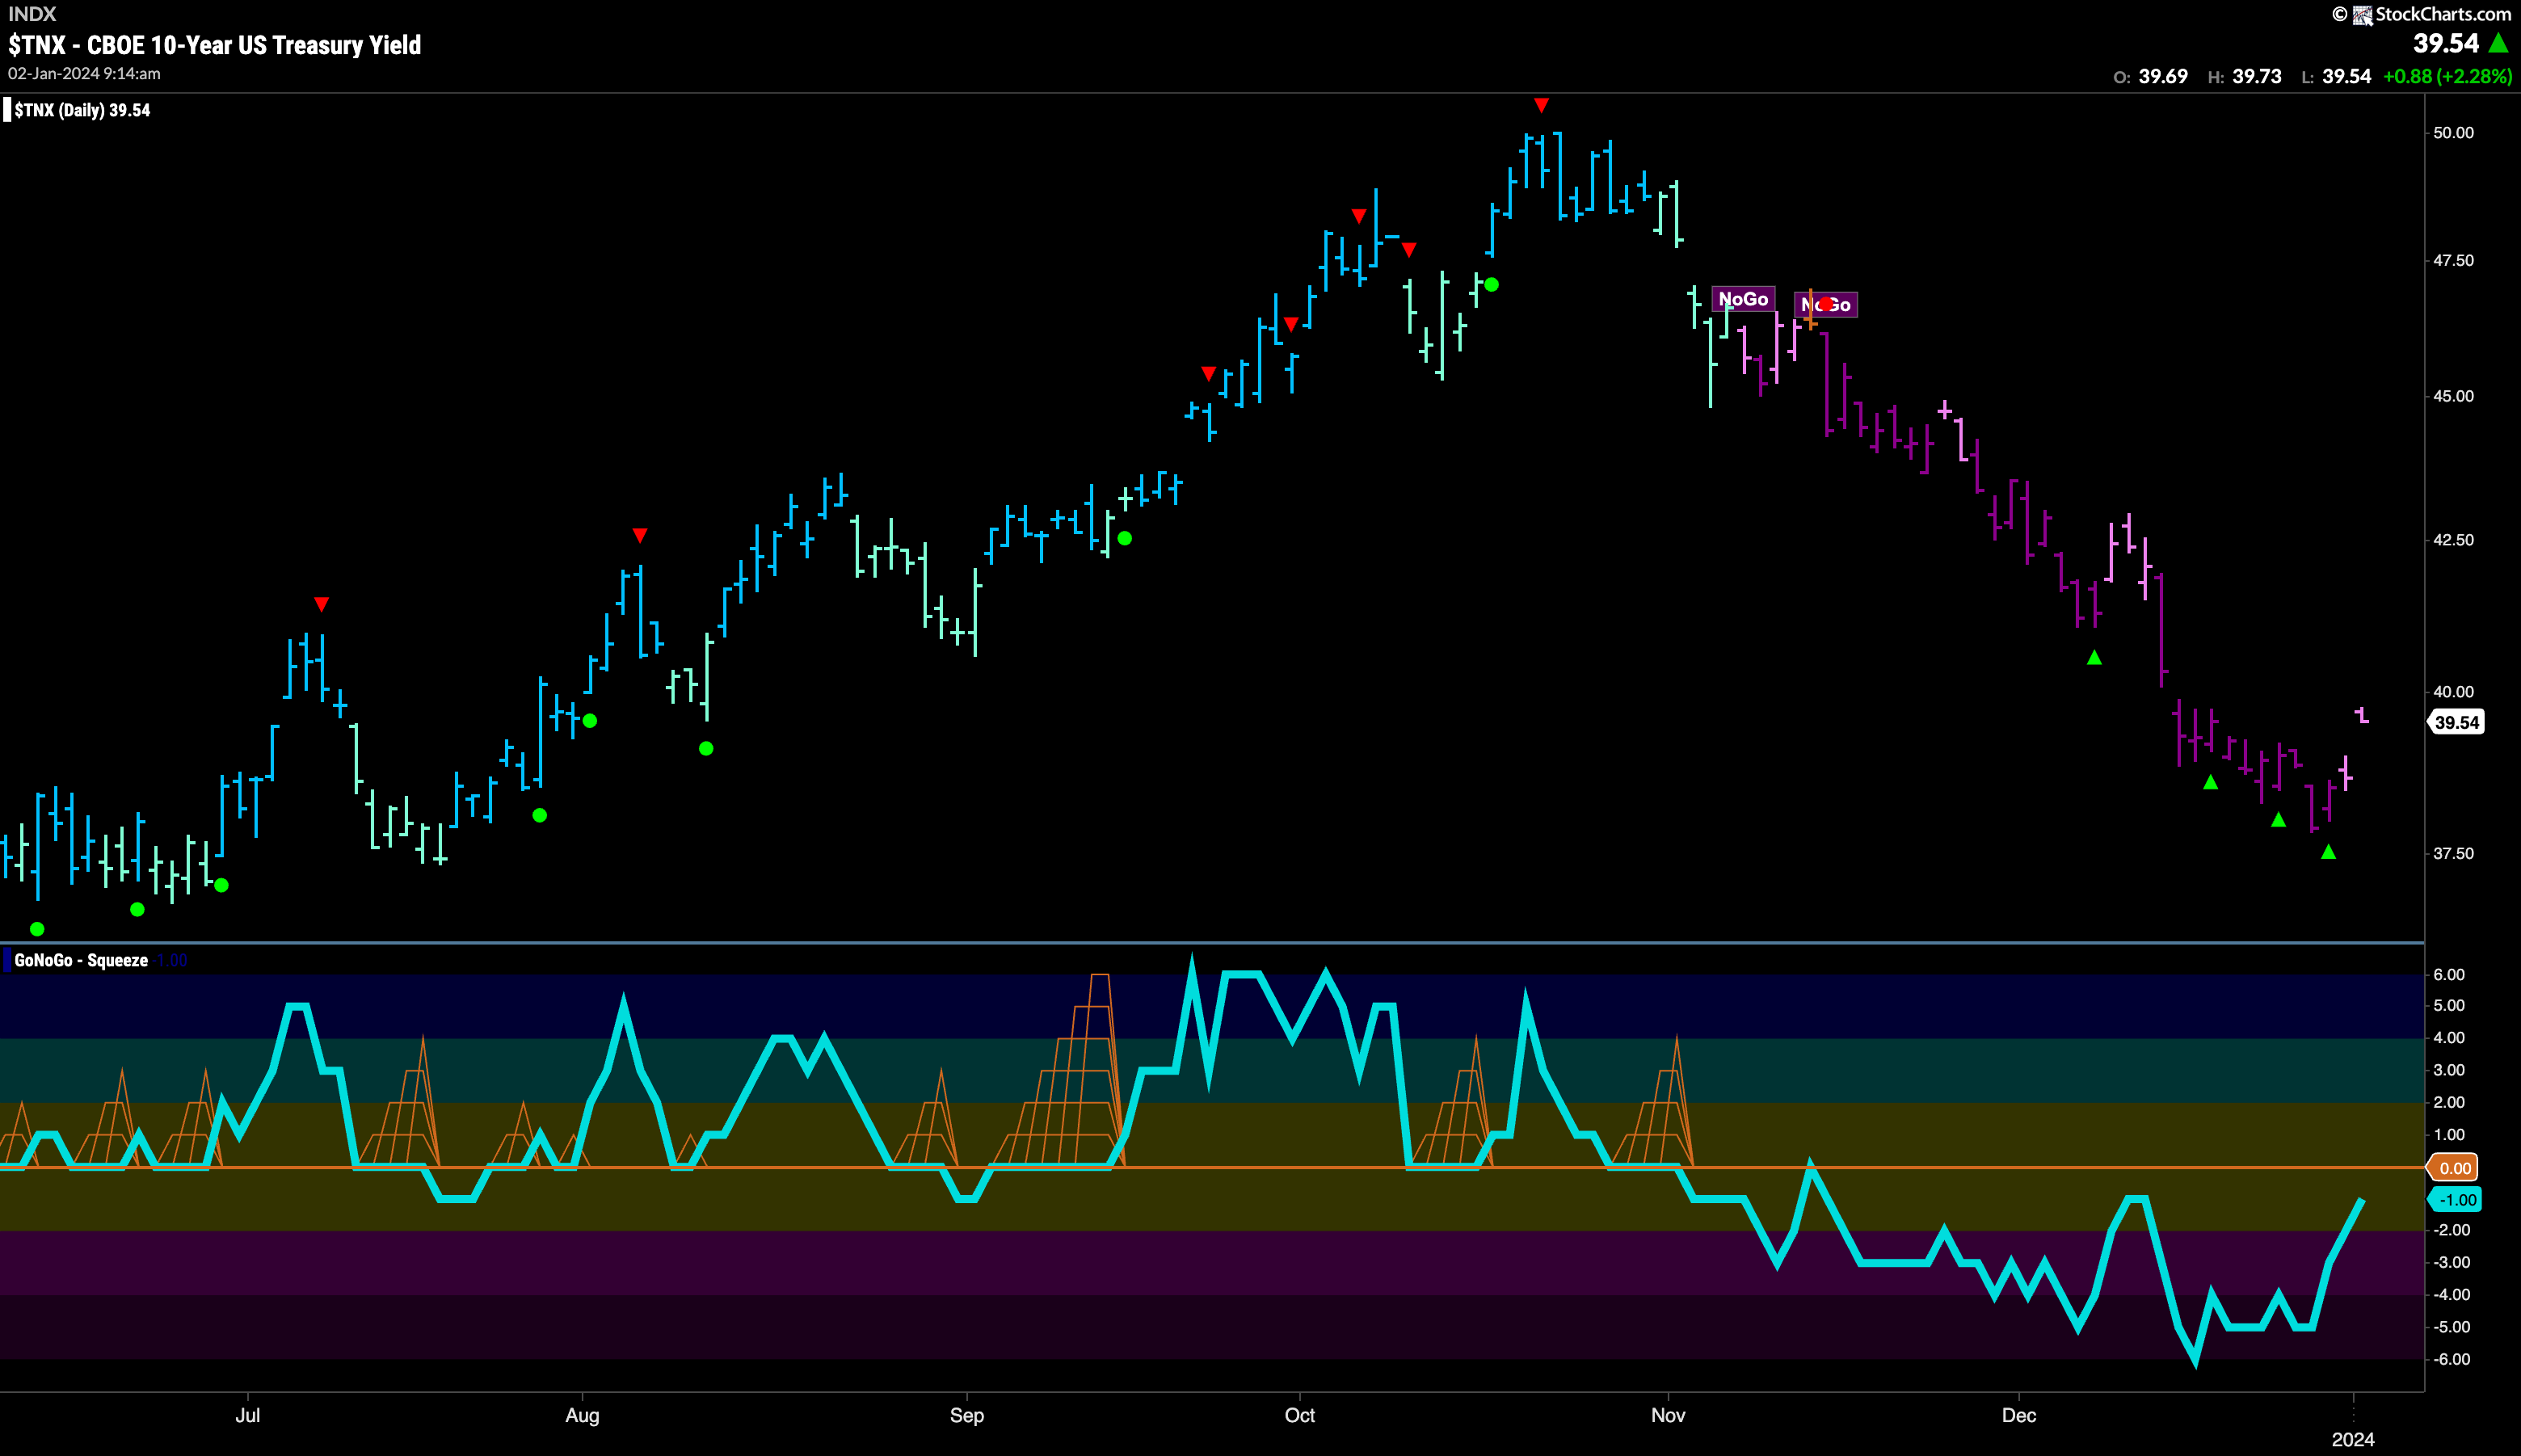
The “NoGo” trend continues in rates and we saw another lower low this past week. The end of the week saw a small rally and pink trend bars which shows some weakness in the current “NoGo” trend. However, GoNoGo Oscillator is still in negative territory which indicates momentum on the side of the “NoGo” trend. We will watch to see if prices rally further this week and if they perhaps set a new lower high. GoNoGo Oscillator is approaching the zero line from below and we will look to see if it gets rejected at that level in which case we will look for NoGo Trend continuation
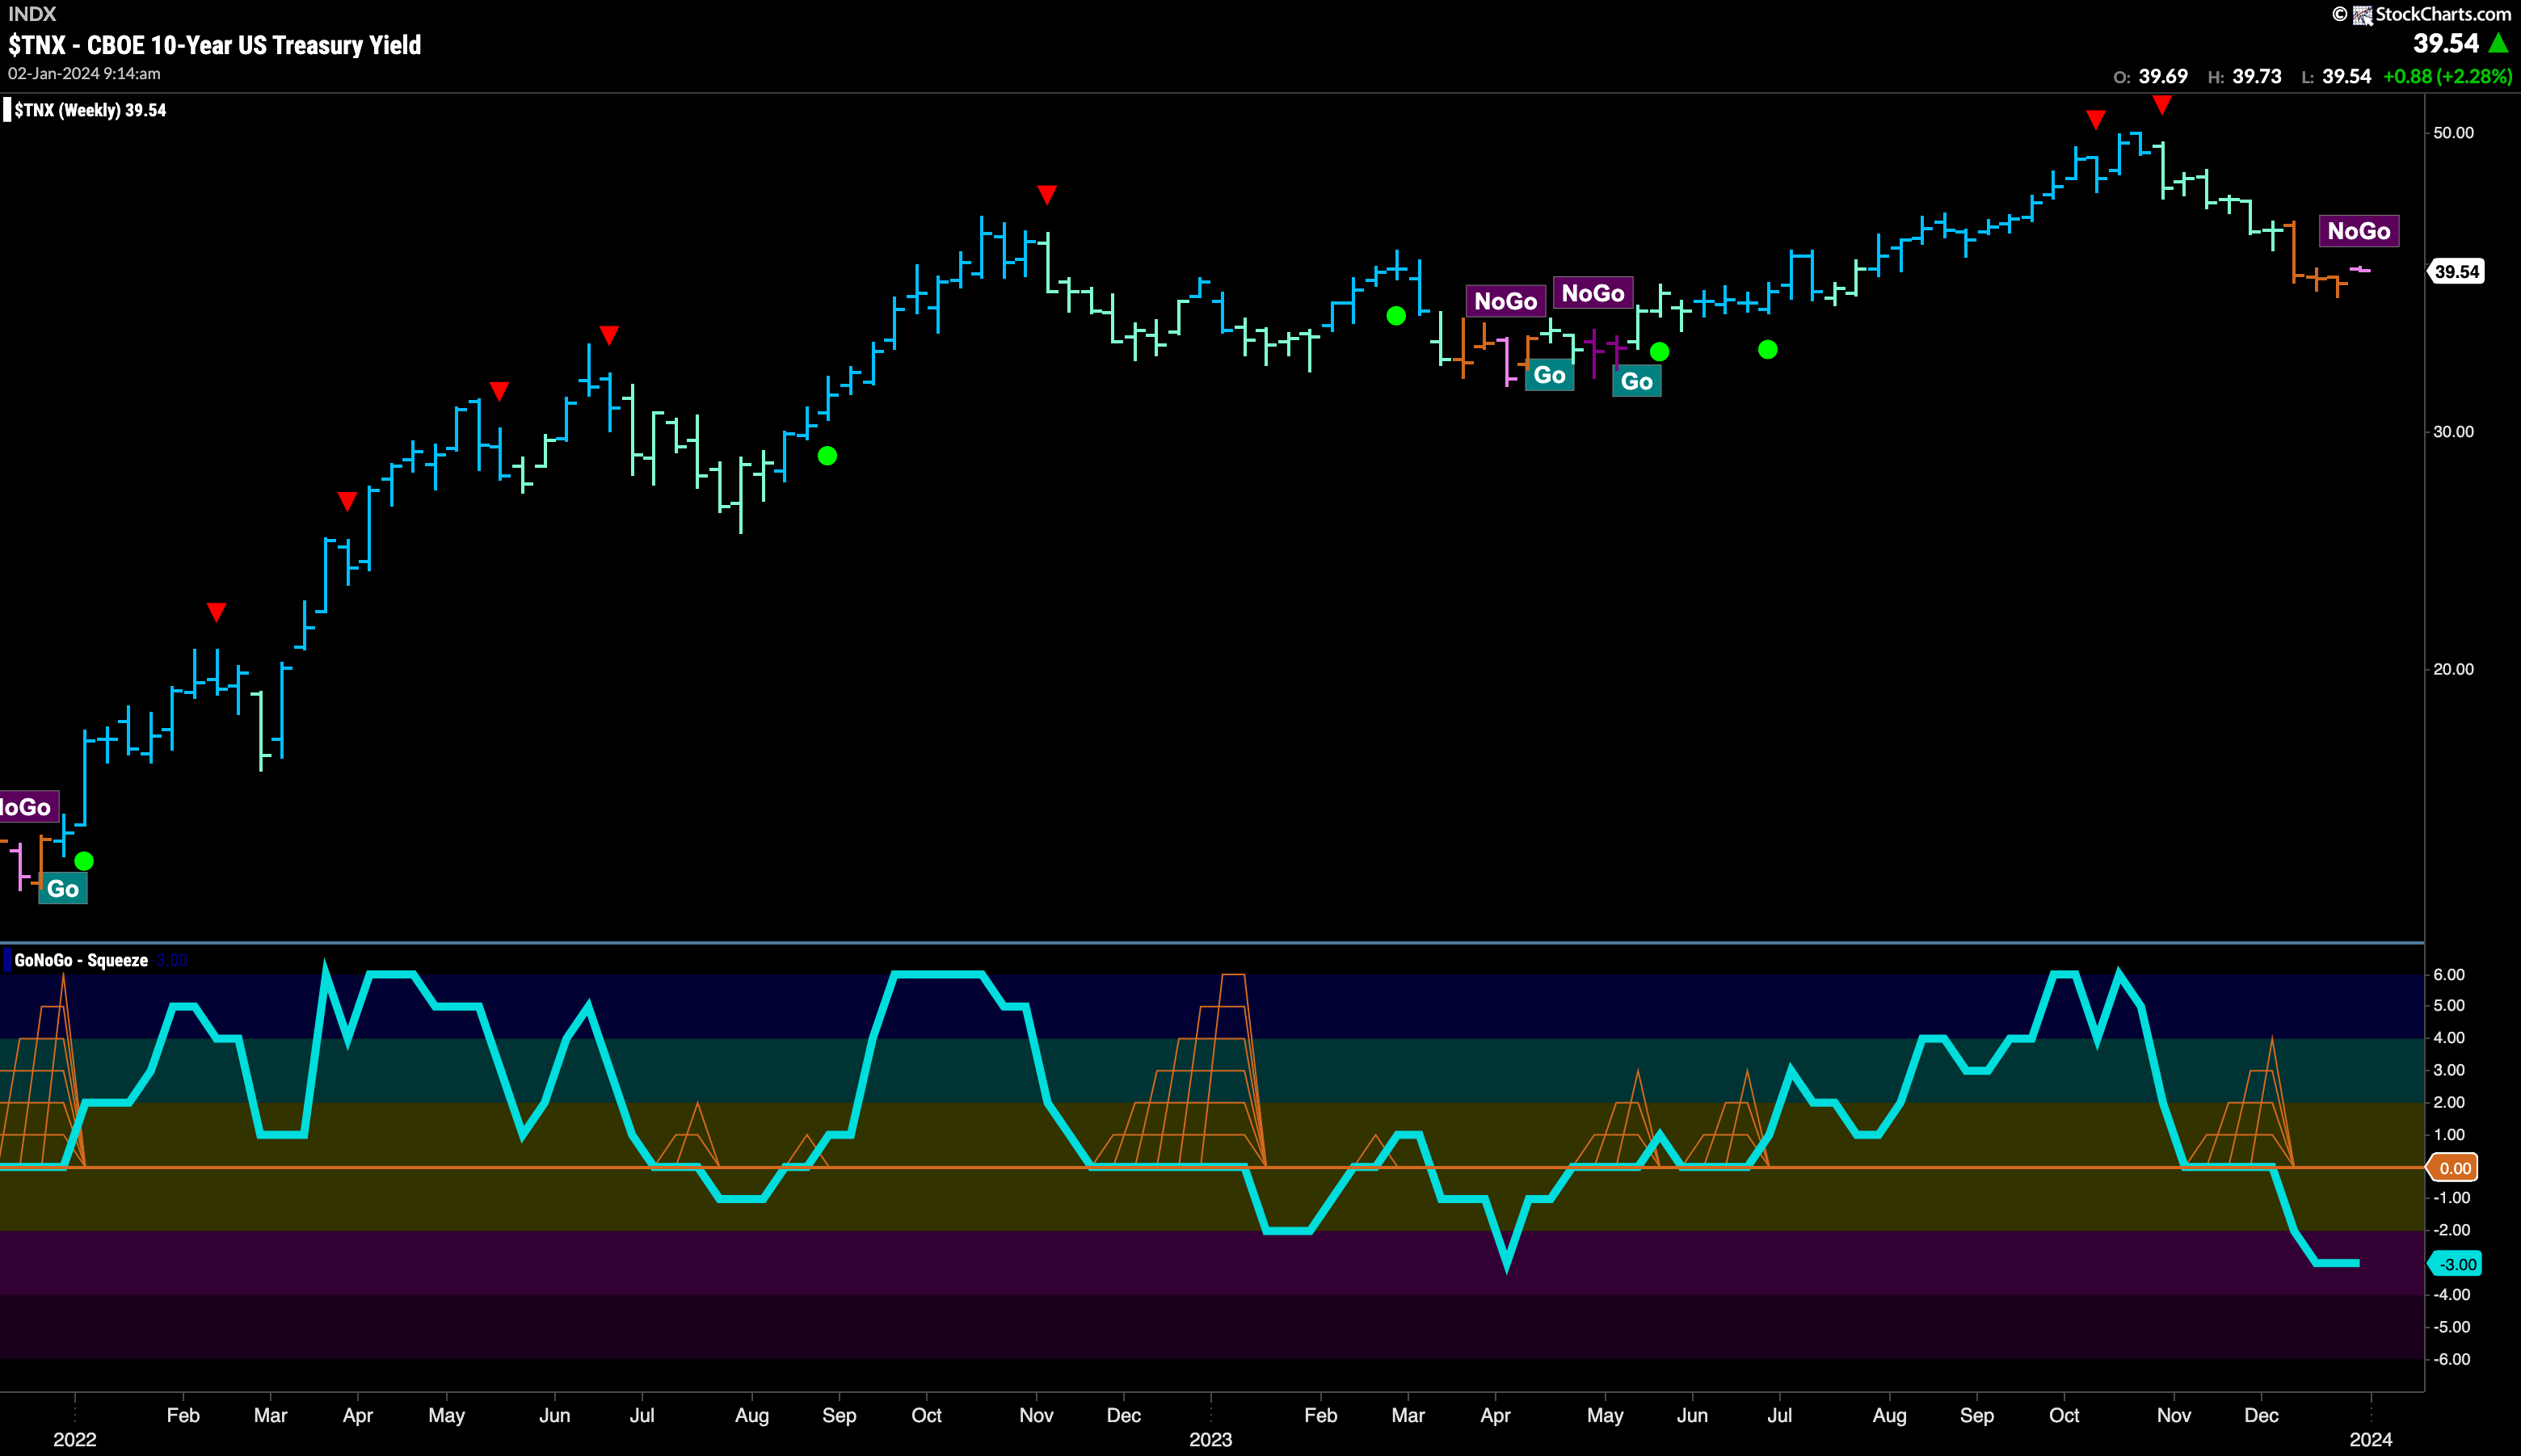
The larger timeframe chart is interesting as it shows a “NoGo” creeping in to the last bar (chart updated Monday morning after the open). We will pay close attention this week to see if the NoGo holds. GoNoGo Oscillator continues to remain in negative territory after breaking out of the recent GoNoGo Squeeze.
Dollar Chart in Strong “NoGo”
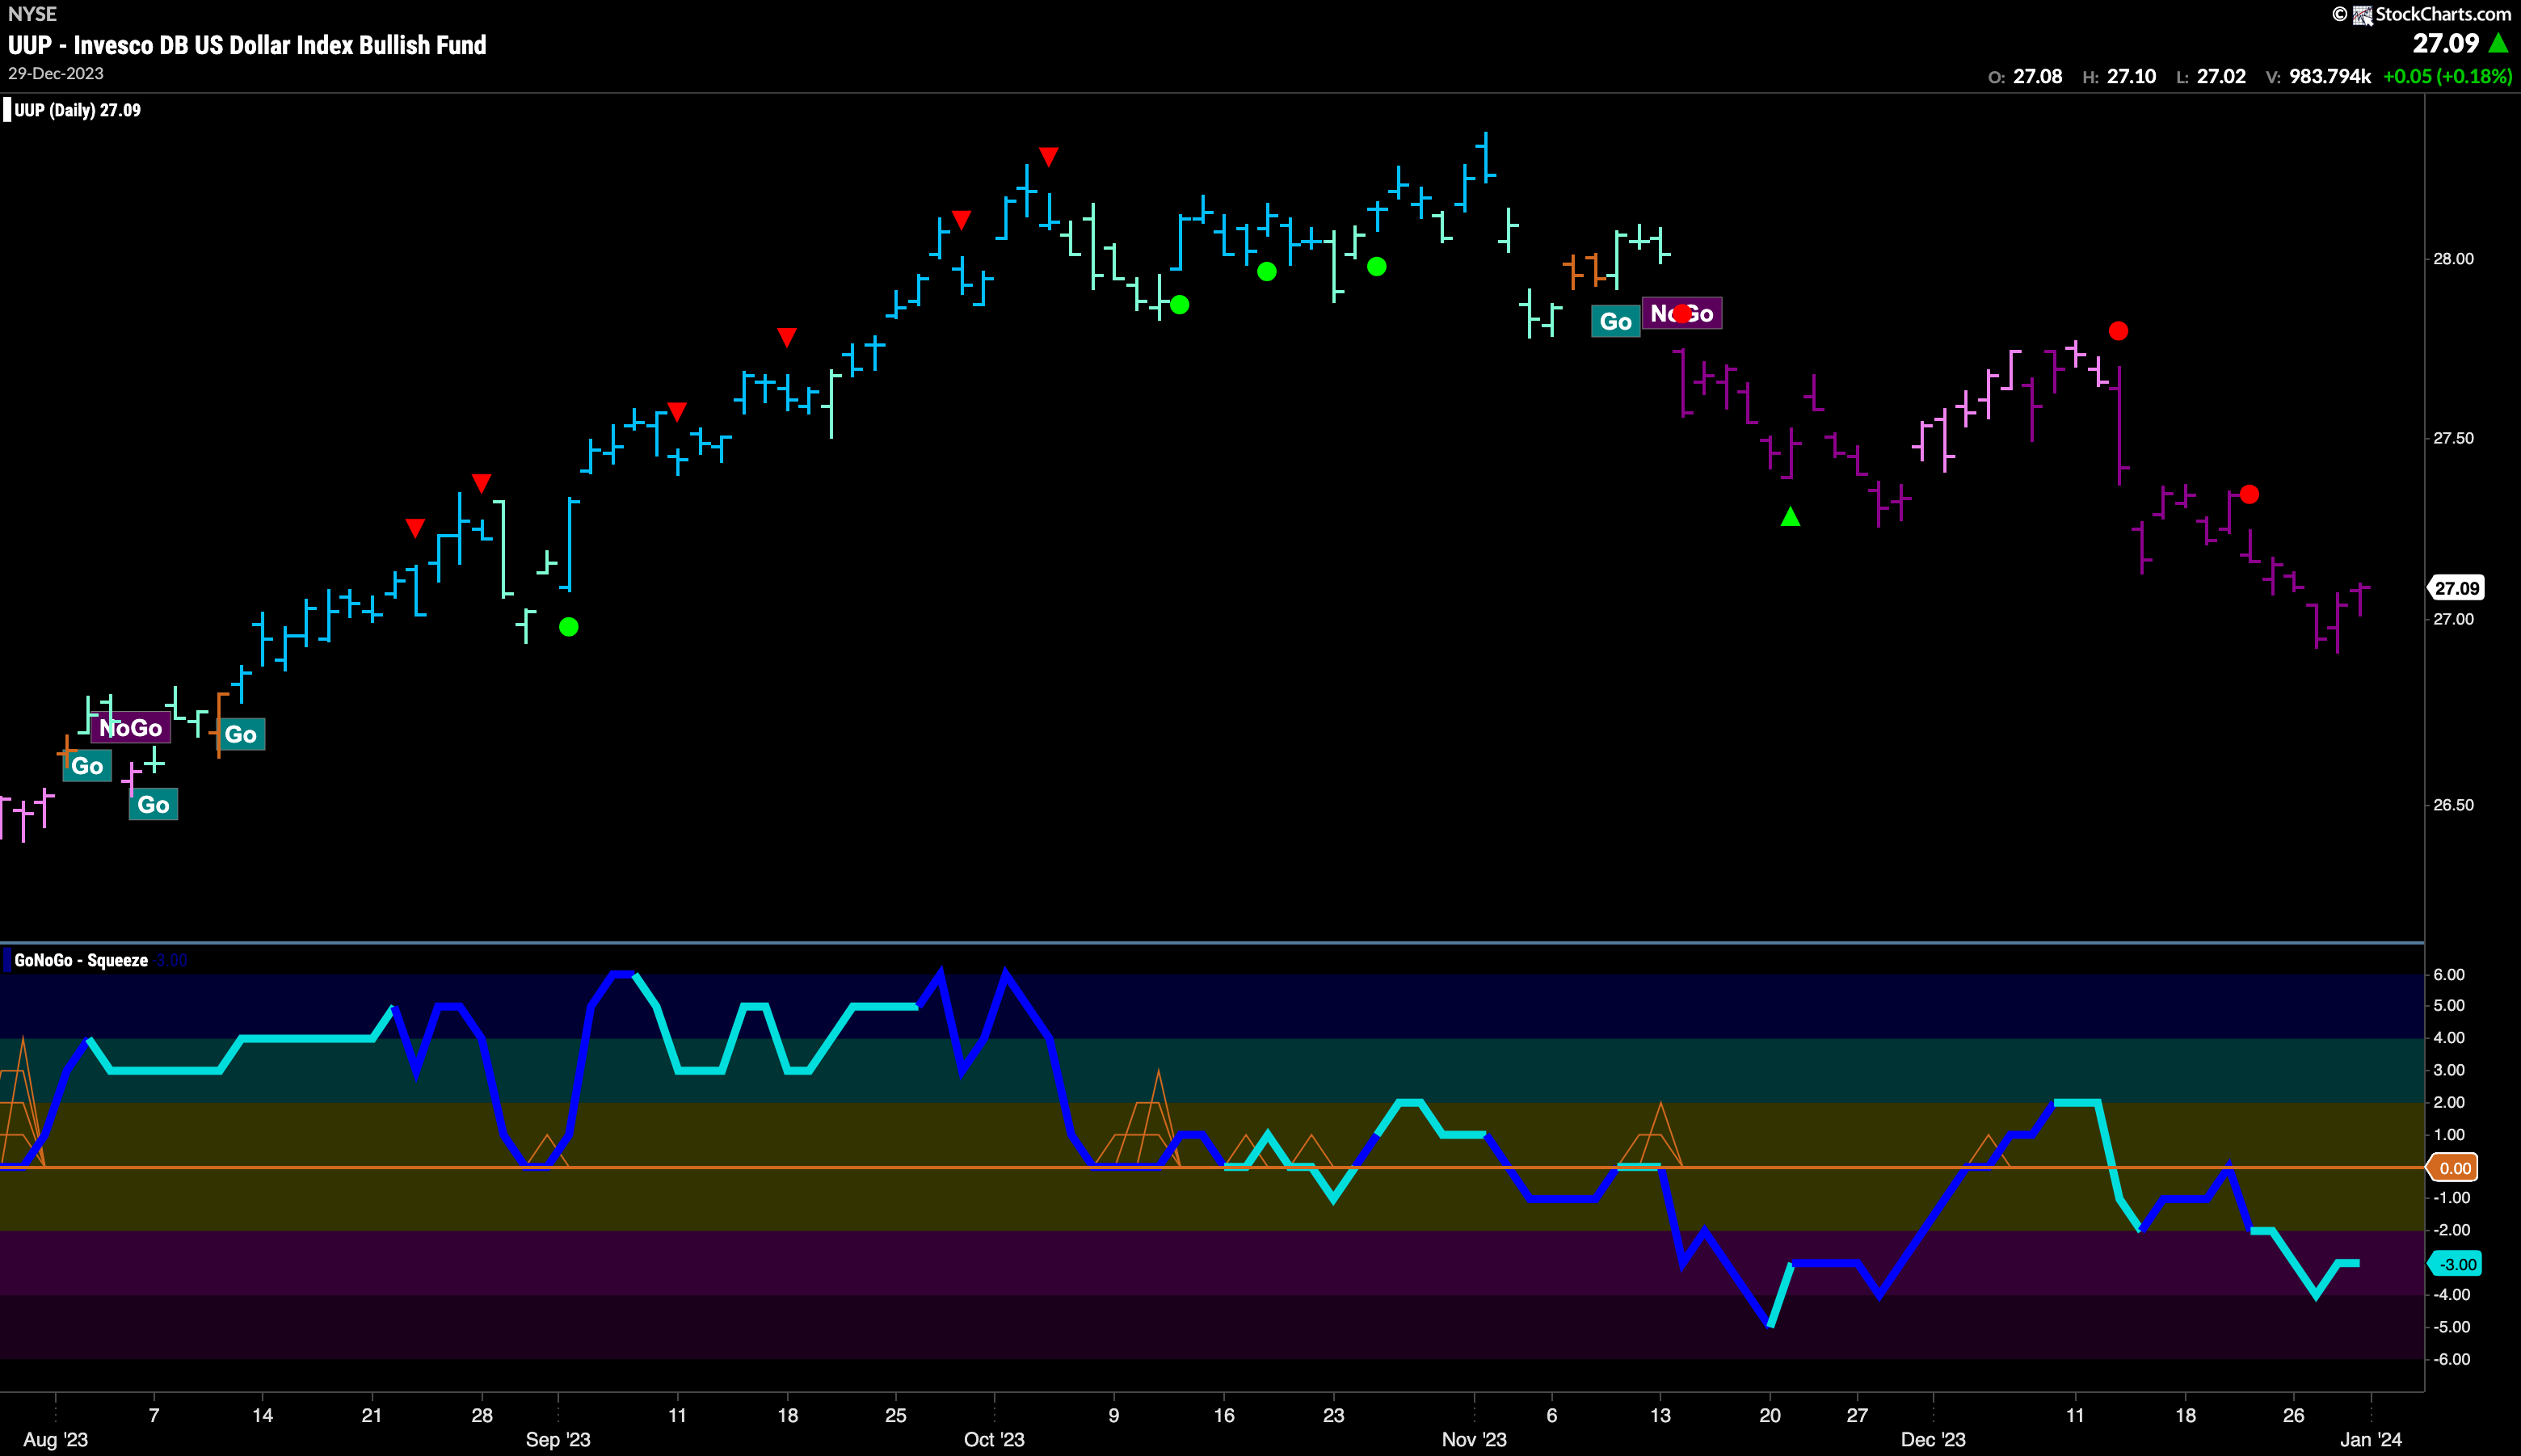
Looking at the daily chart below we can see that the dollar is still falling. Strong “NoGo” bars are being exclusively painted by GoNoGo Trend. Another new lower low was set this week as well as prices fell since the last NoGo Trend Continuation Icon (red circle). GoNoGo Oscillator is in negative territory at a value of -3 and so is confirming the “NoGo” we see in price.
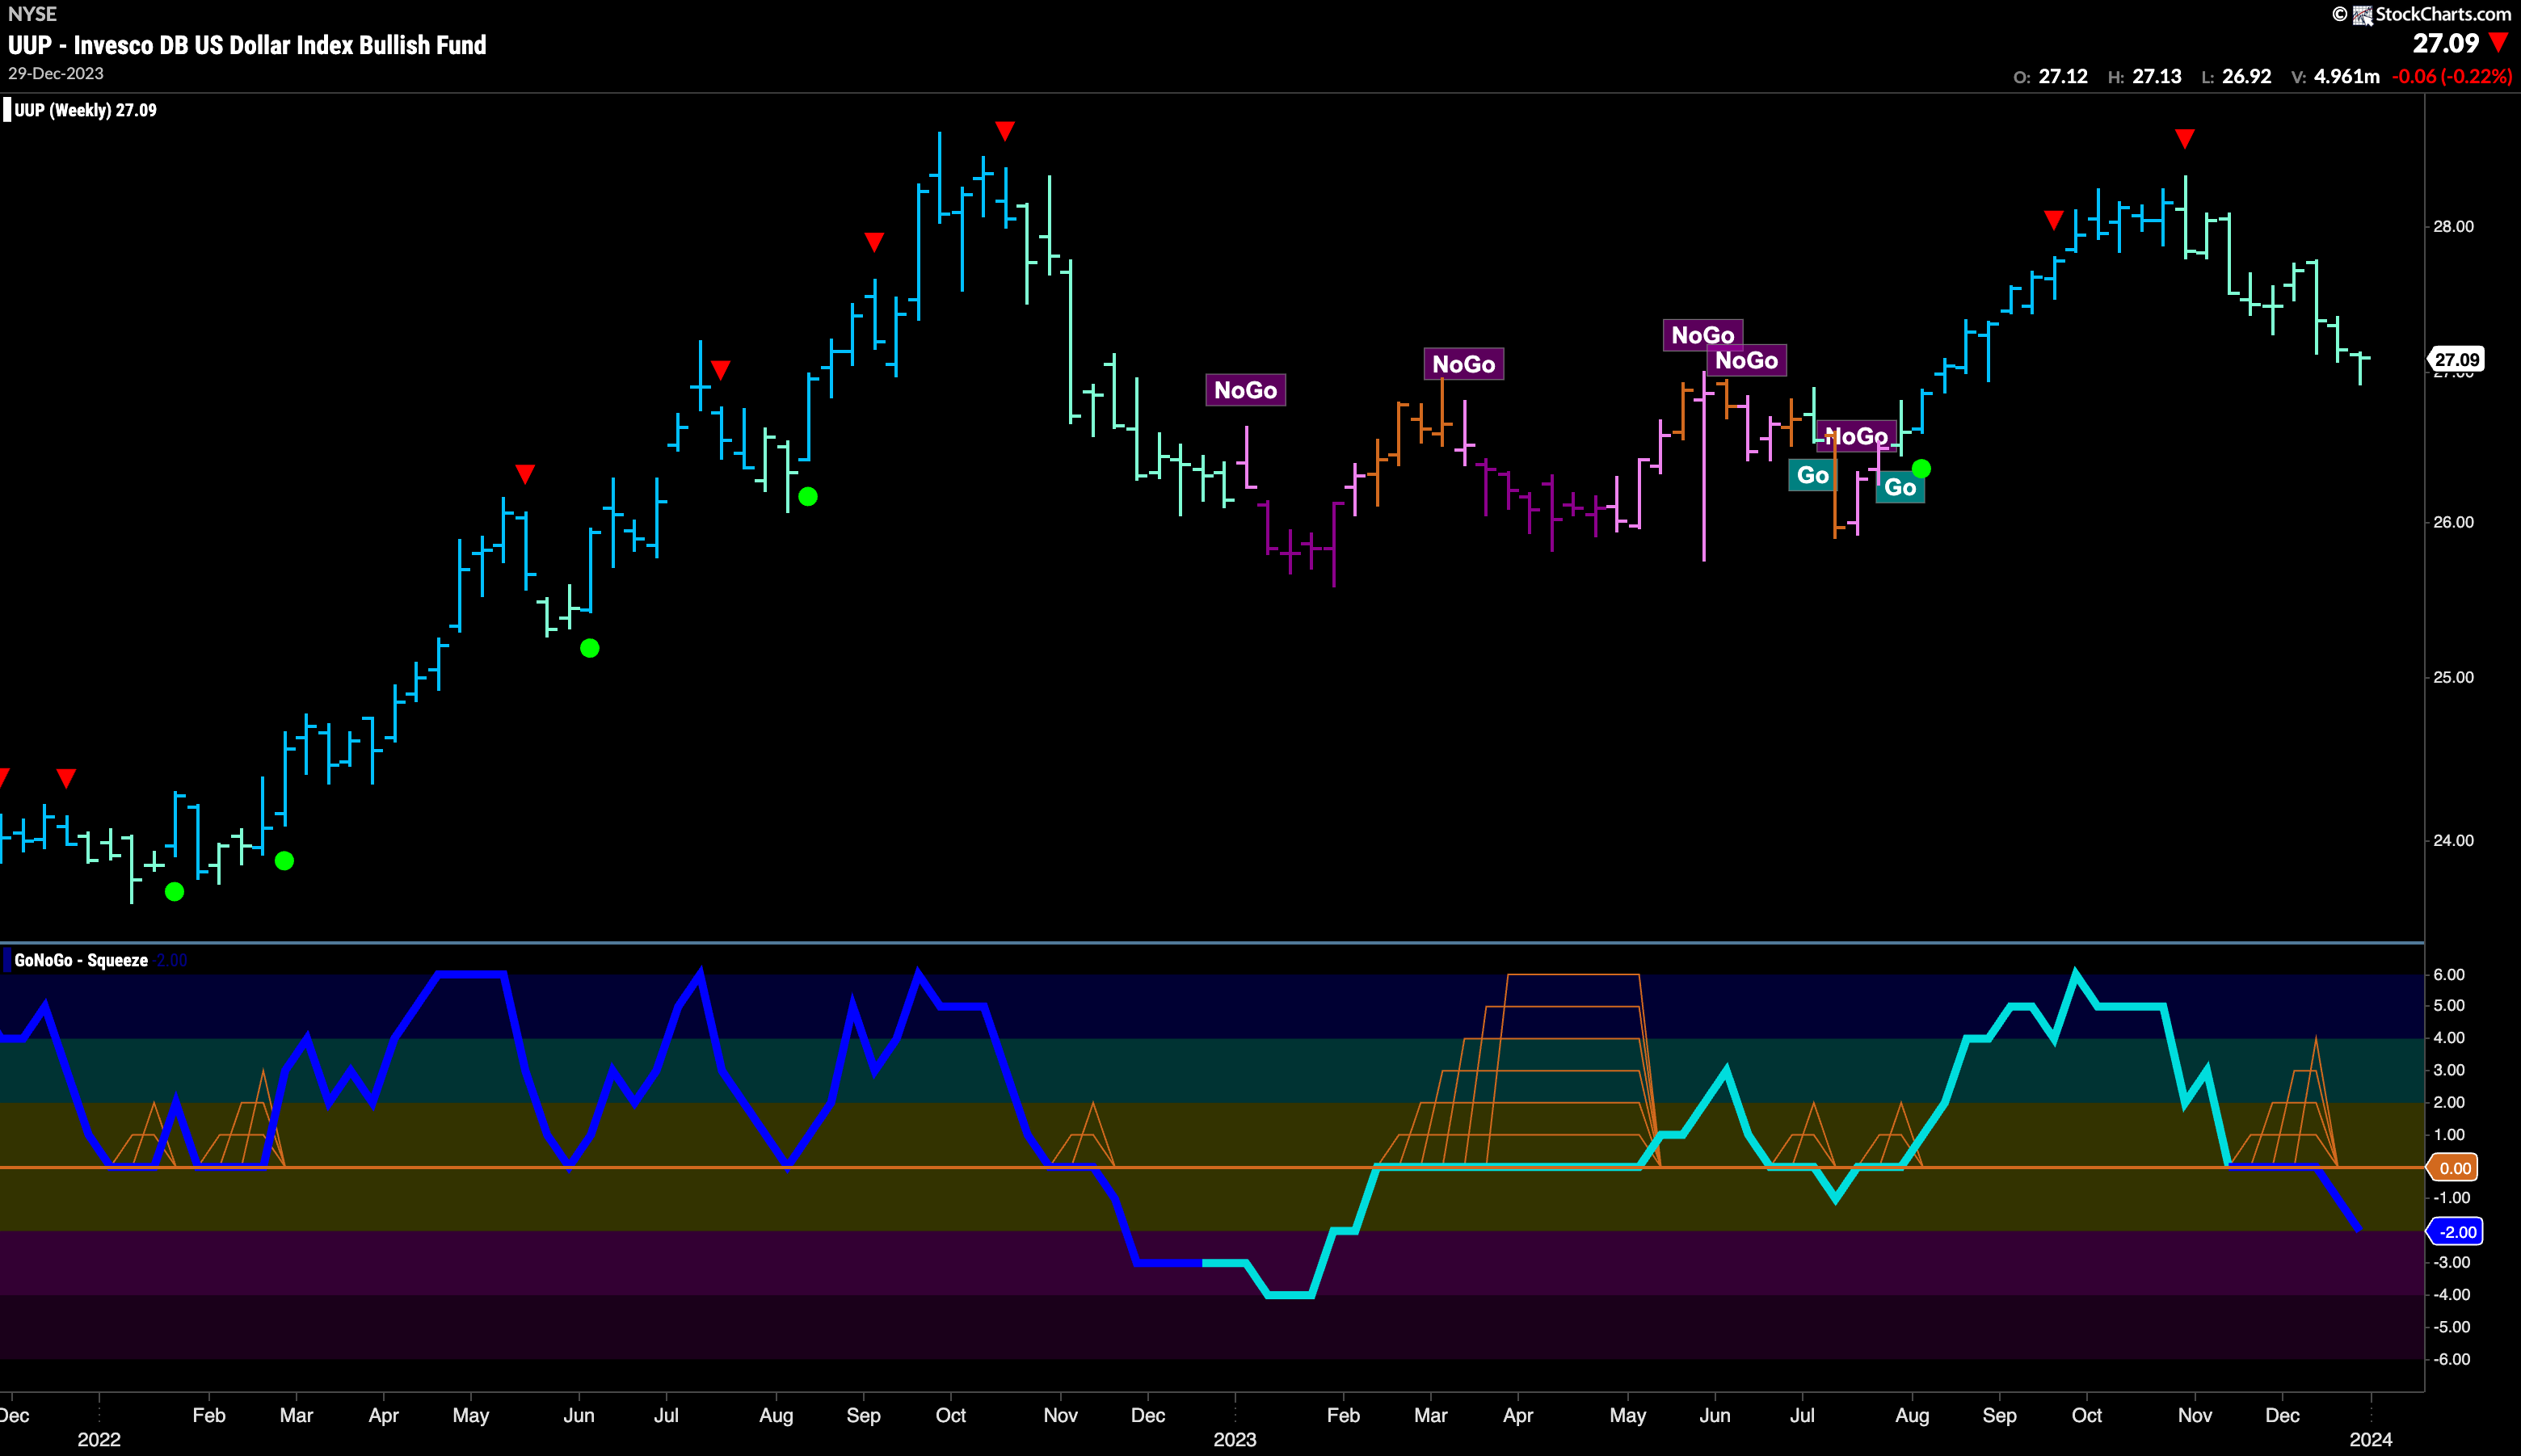
The weekly chart shows that the longer term trend is in trouble as well. Although we are still seeing weak aqua “Go” colors, GoNoGo Oscillator broke out of a small GoNoGo Squeeze and on heavy volume and is now in negative territory at a value of -2. Price may now be at a level that could act as support from prior highs last spring and summer but if that support isn’t found then we will look for price to fall further and a possible change in trend.
Oil Sets New Lower High
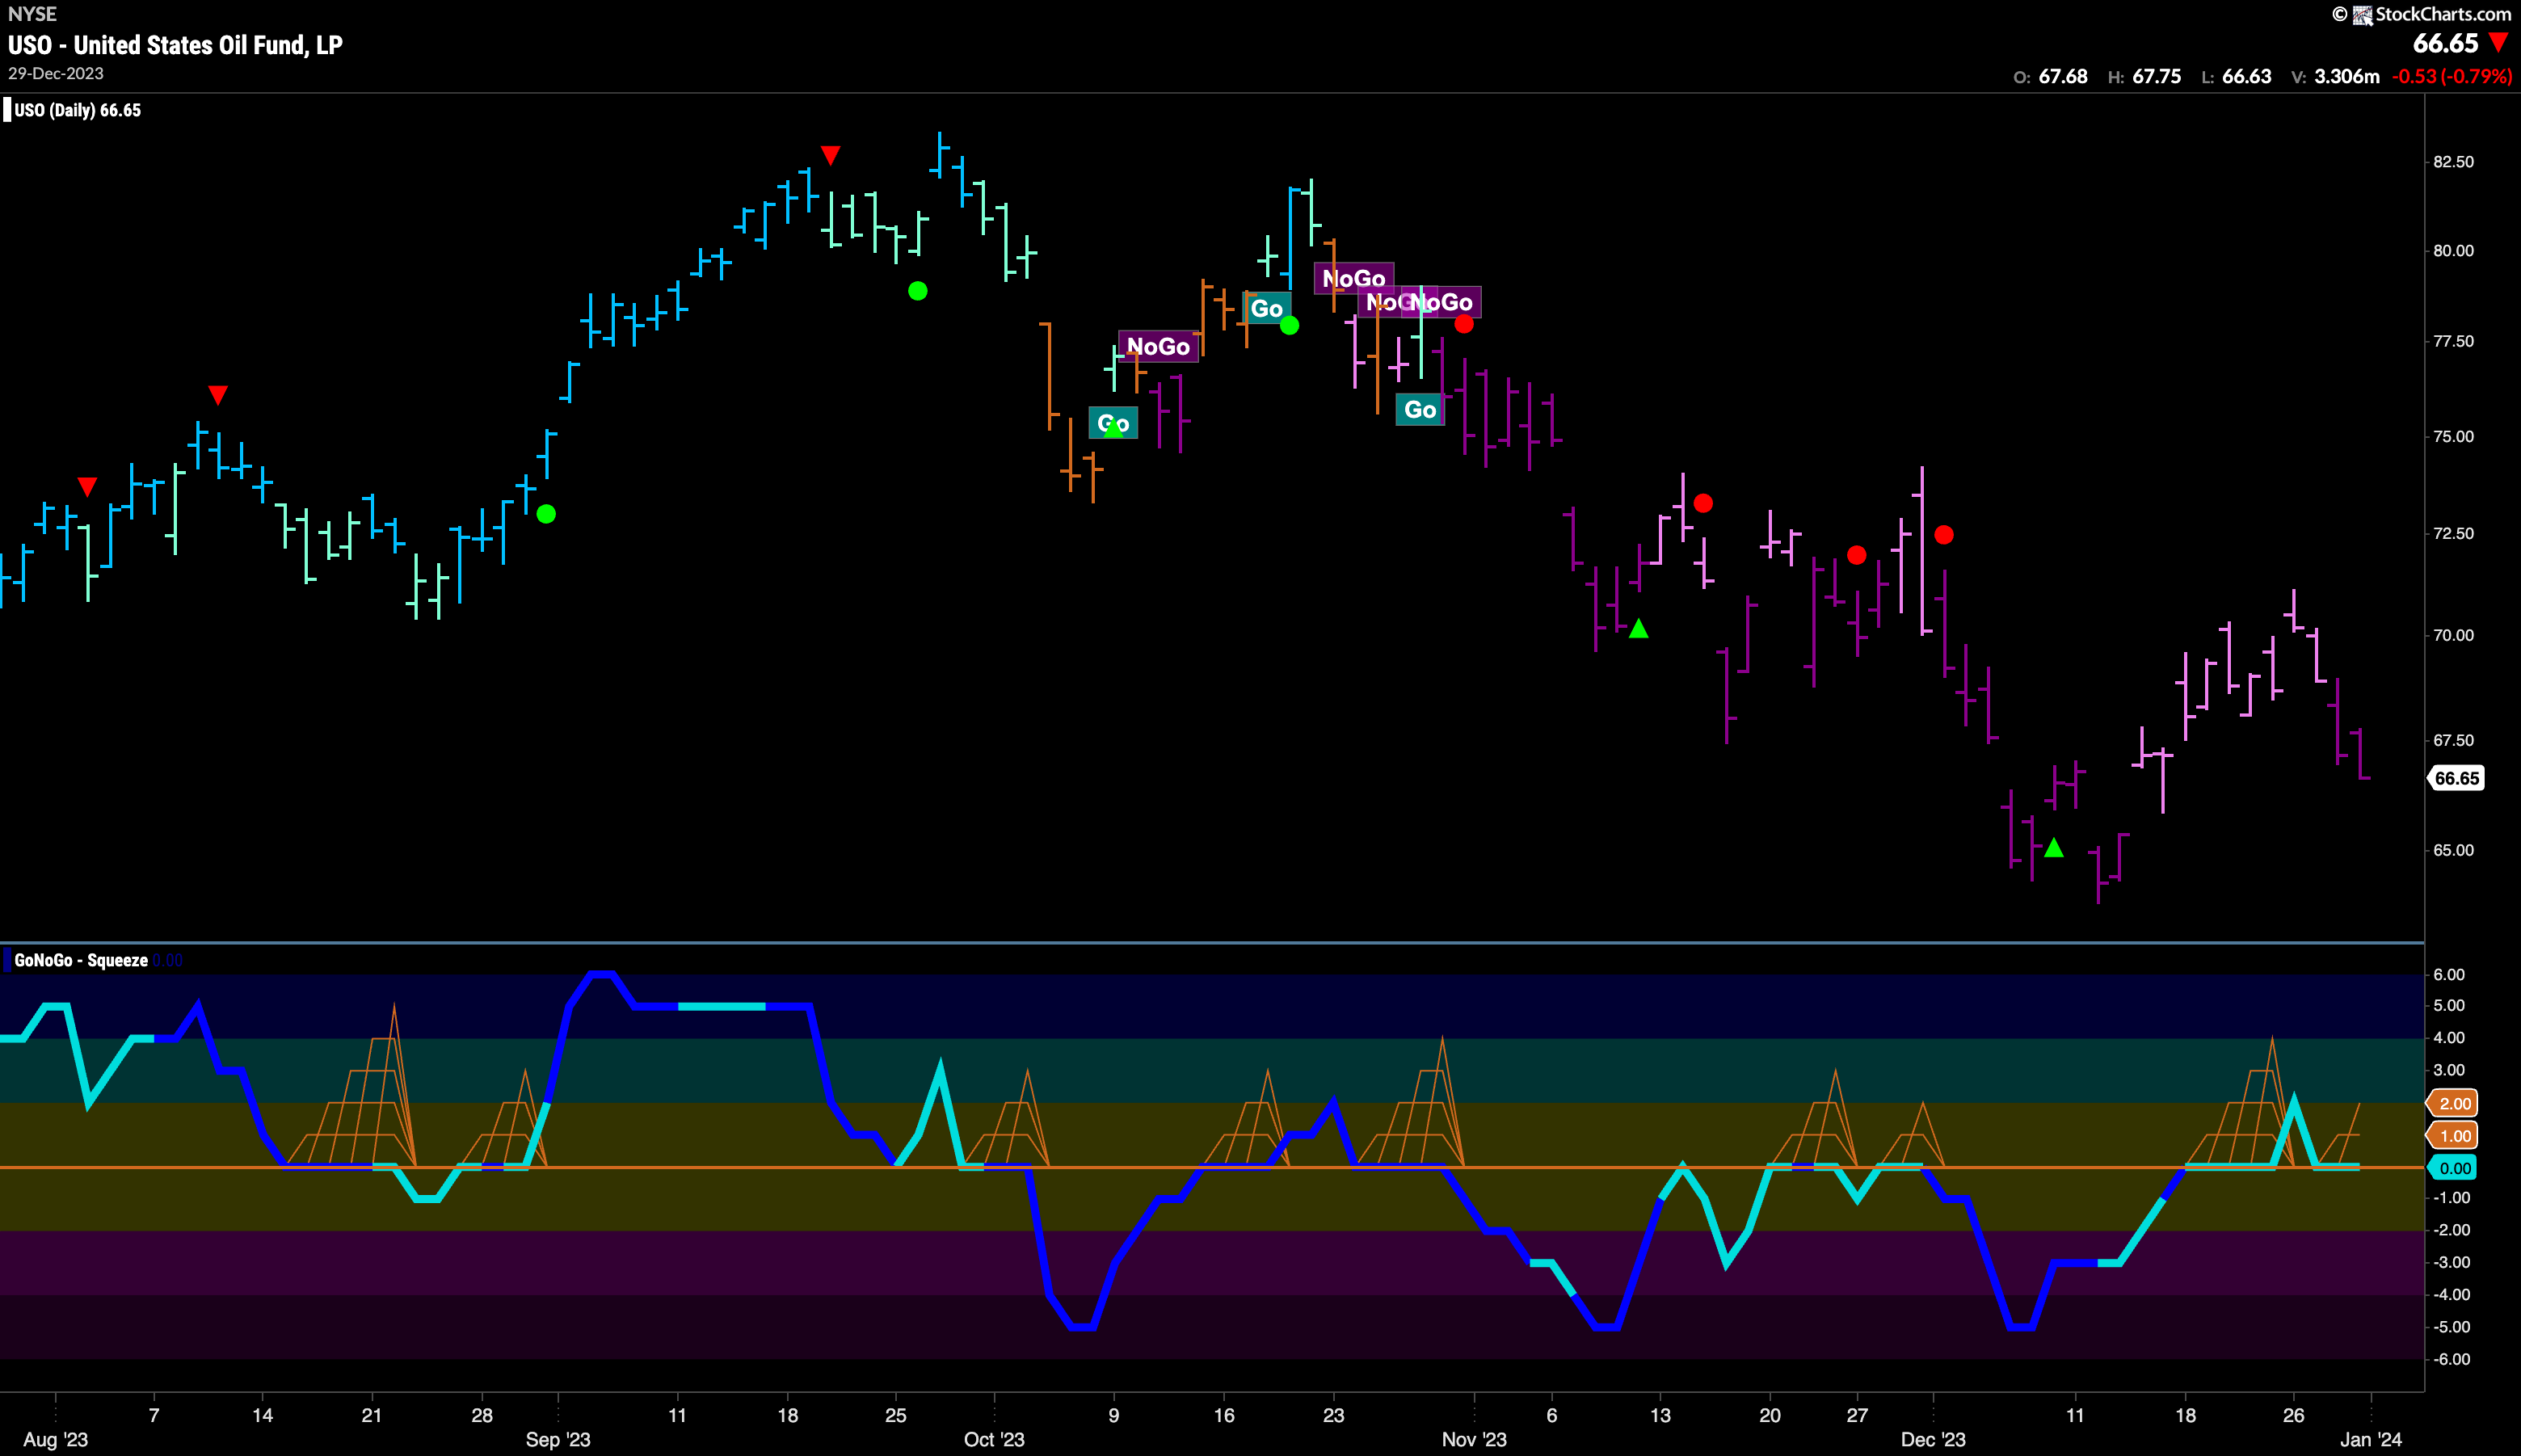
After a lot of talk about Oil prices having put in an “ultimate low in early December we see that GoNoGo Trend never stopped painting “NoGo” colors even as prices rallied and now after a lower high has returned to paint strong “NoGo” bars as prices fall again. Perhaps the recent low was the lowest of the “NoGo” but until we can confirm that we are in a “NoGo” making lower highs and lower lows. Of note, GoNoGo Oscillator is testing the zero line from above. If we find support, then perhaps we will see the first higher low. If the Oscillator falls back to negative territory then we can expect price to test prior lows.
Gold Sets a Slightly Higher High
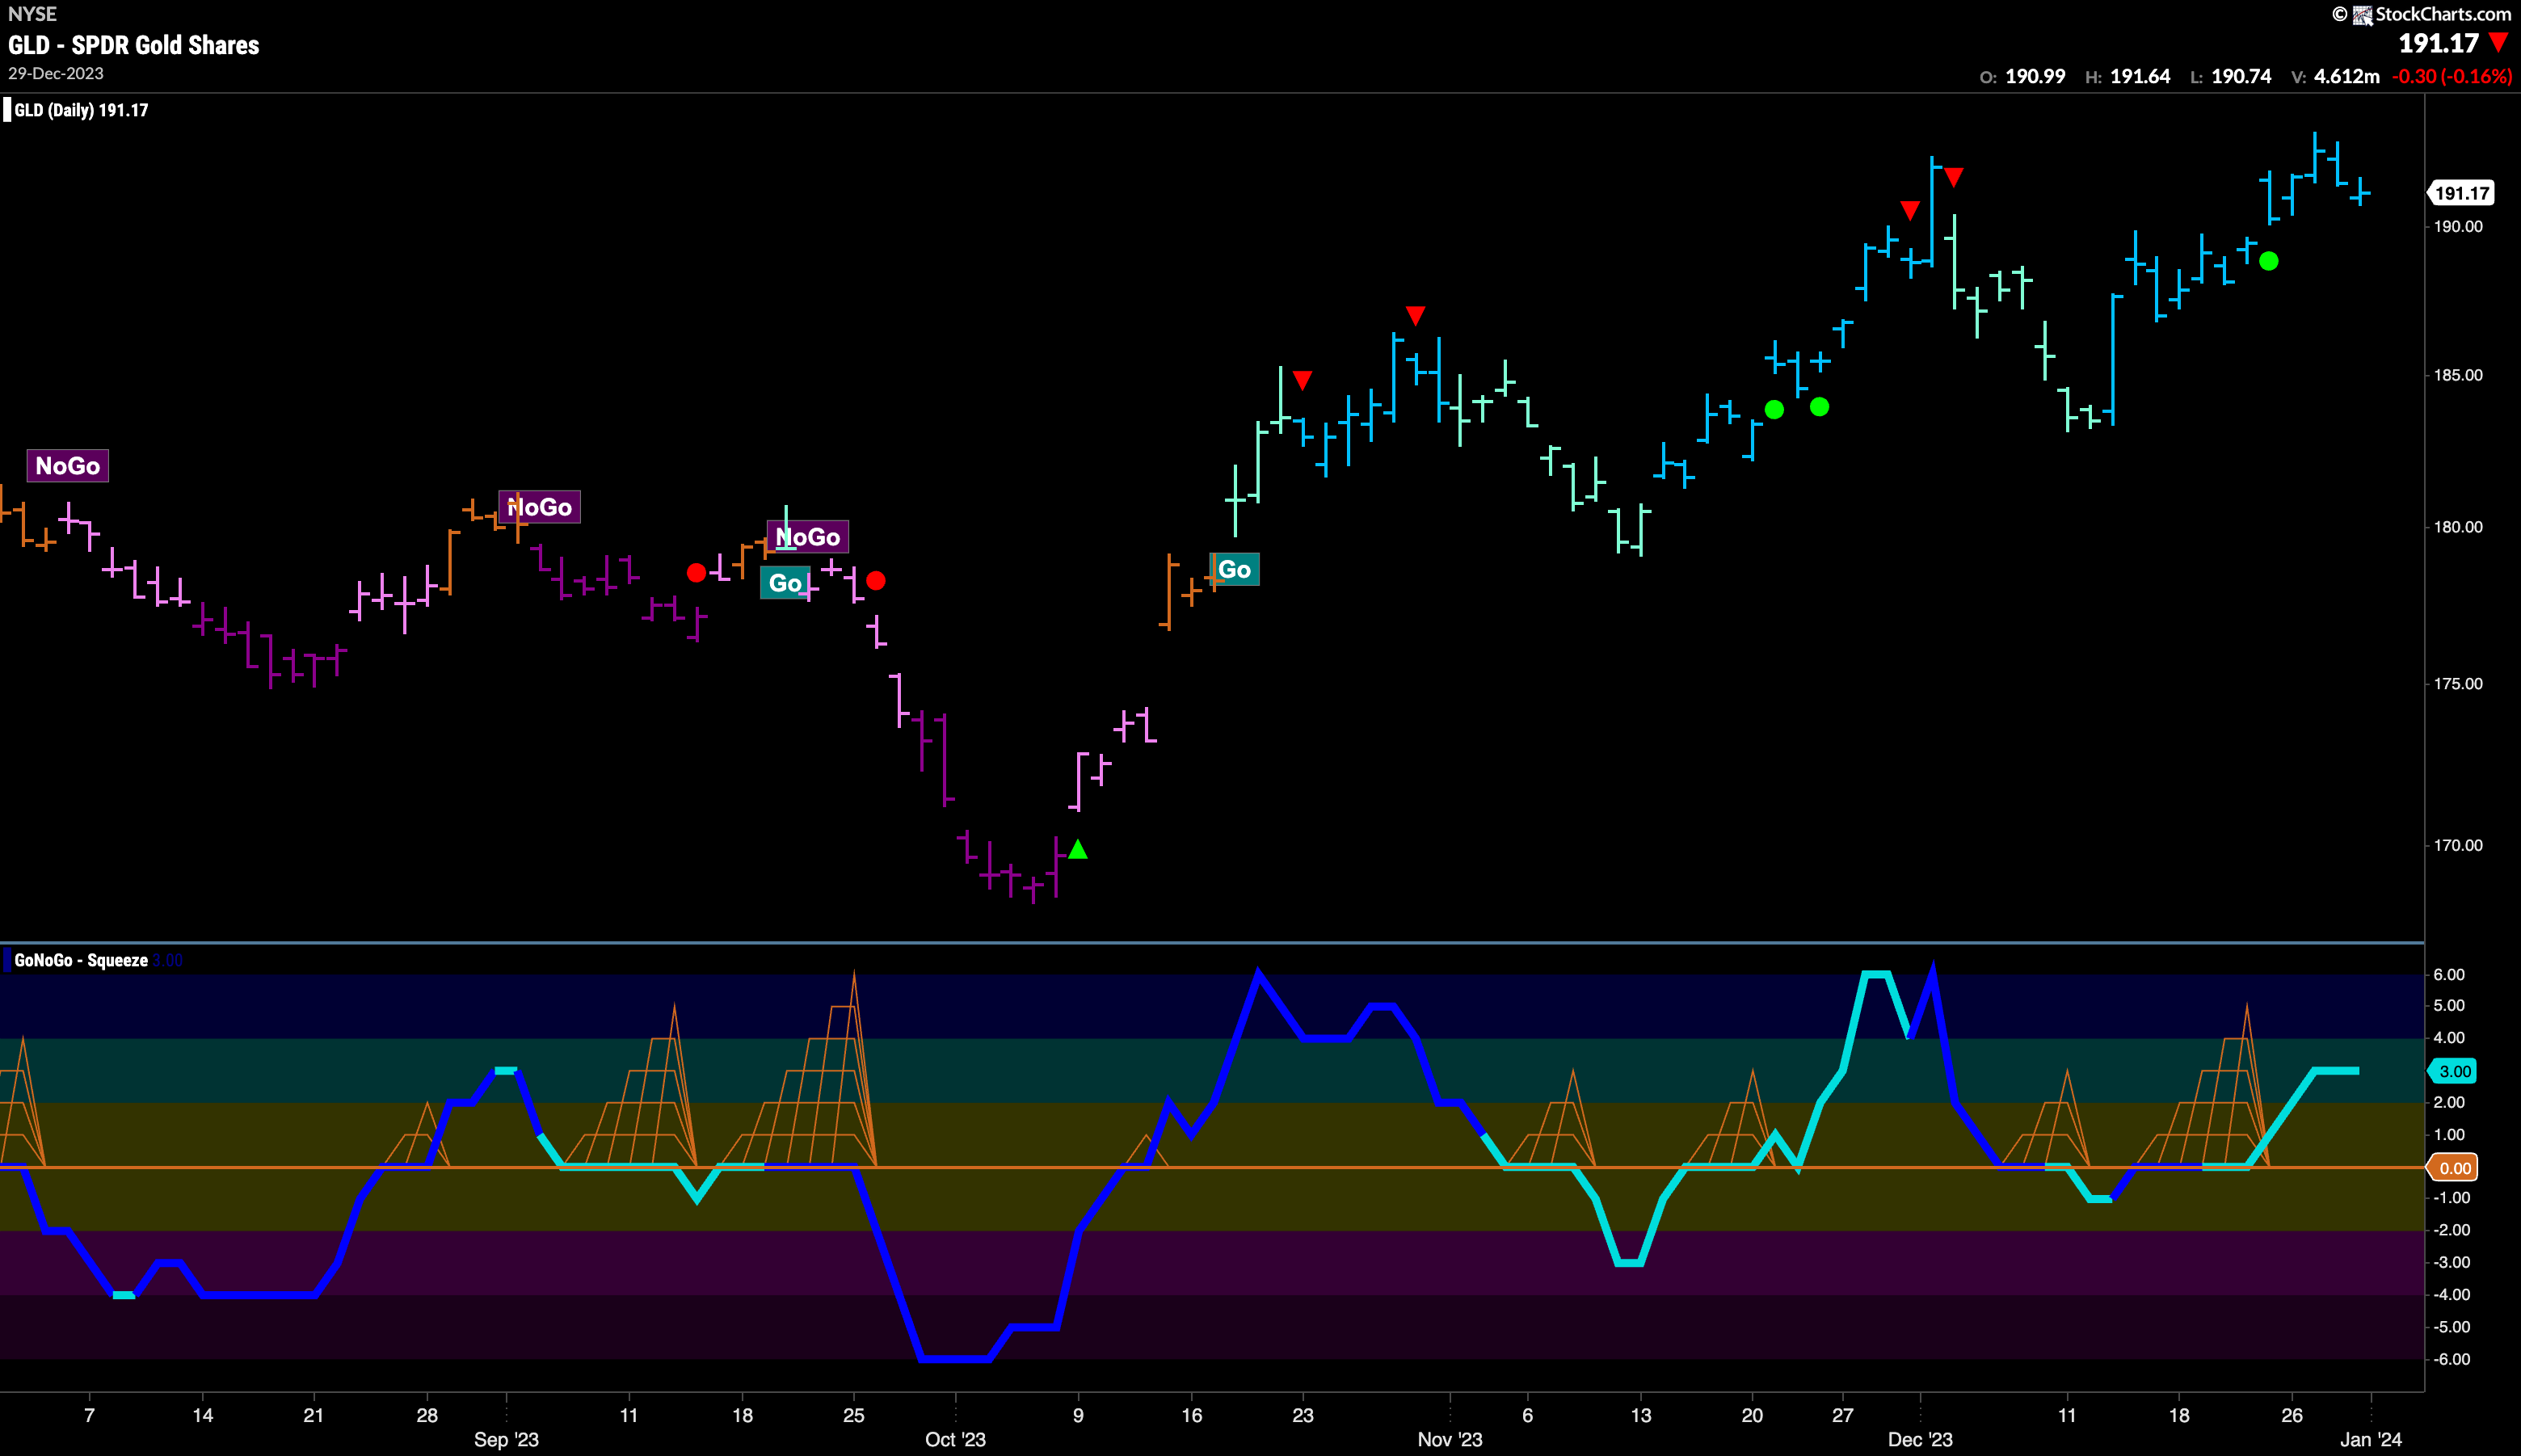
GoNoGo Trend another week of strong blue “Go” bars as price climbed to another higher high. A Go Trend Continuation Icon (green circle) showed us that momentum was resurgent in the direction of the underlying “Go” trend and that was enough to see price edge higher. This came after GoNoGo Oscillator broke out of a GoNoGo Squeeze as the bulls won the tug of war between buyers and sellers.
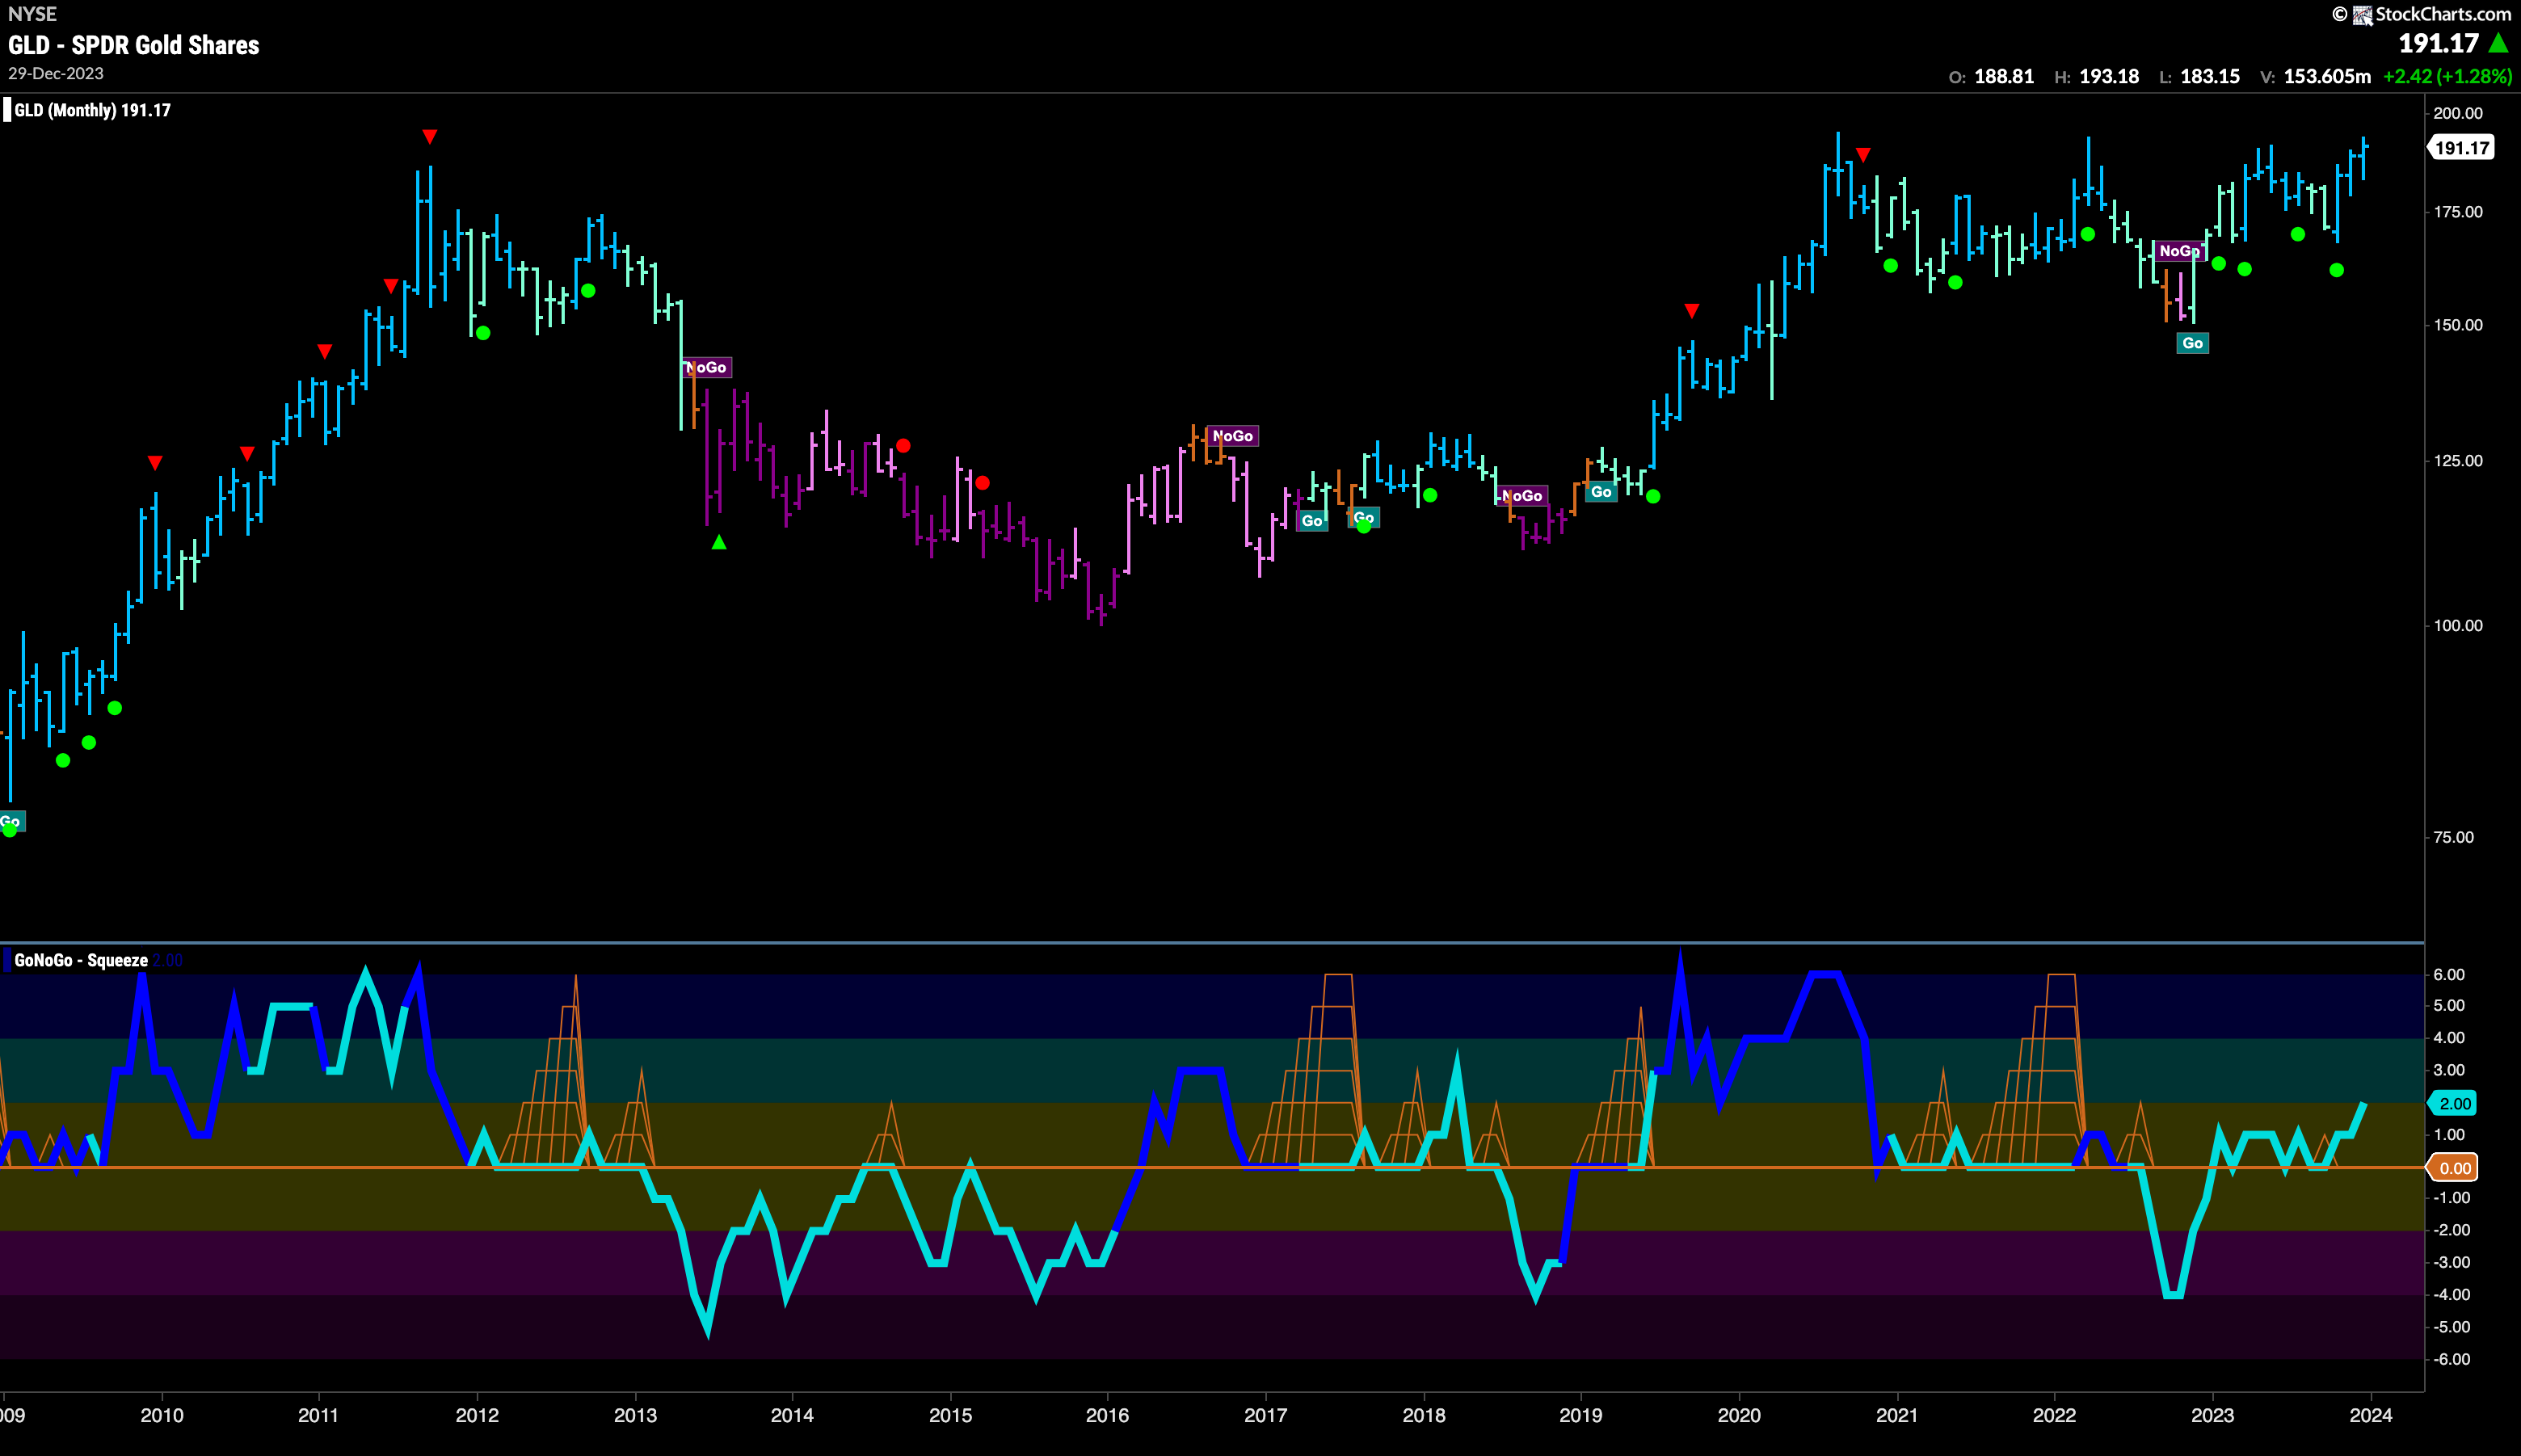
The monthly chart continues to be bullish. A new monthly close shows that prices are really making an attempt to break higher and climb out of a pattern that has been taking shape for over a decade. GoNoGo Oscillator has found continued support at the zero line as it tries to help send price higher.
Sector RelMap
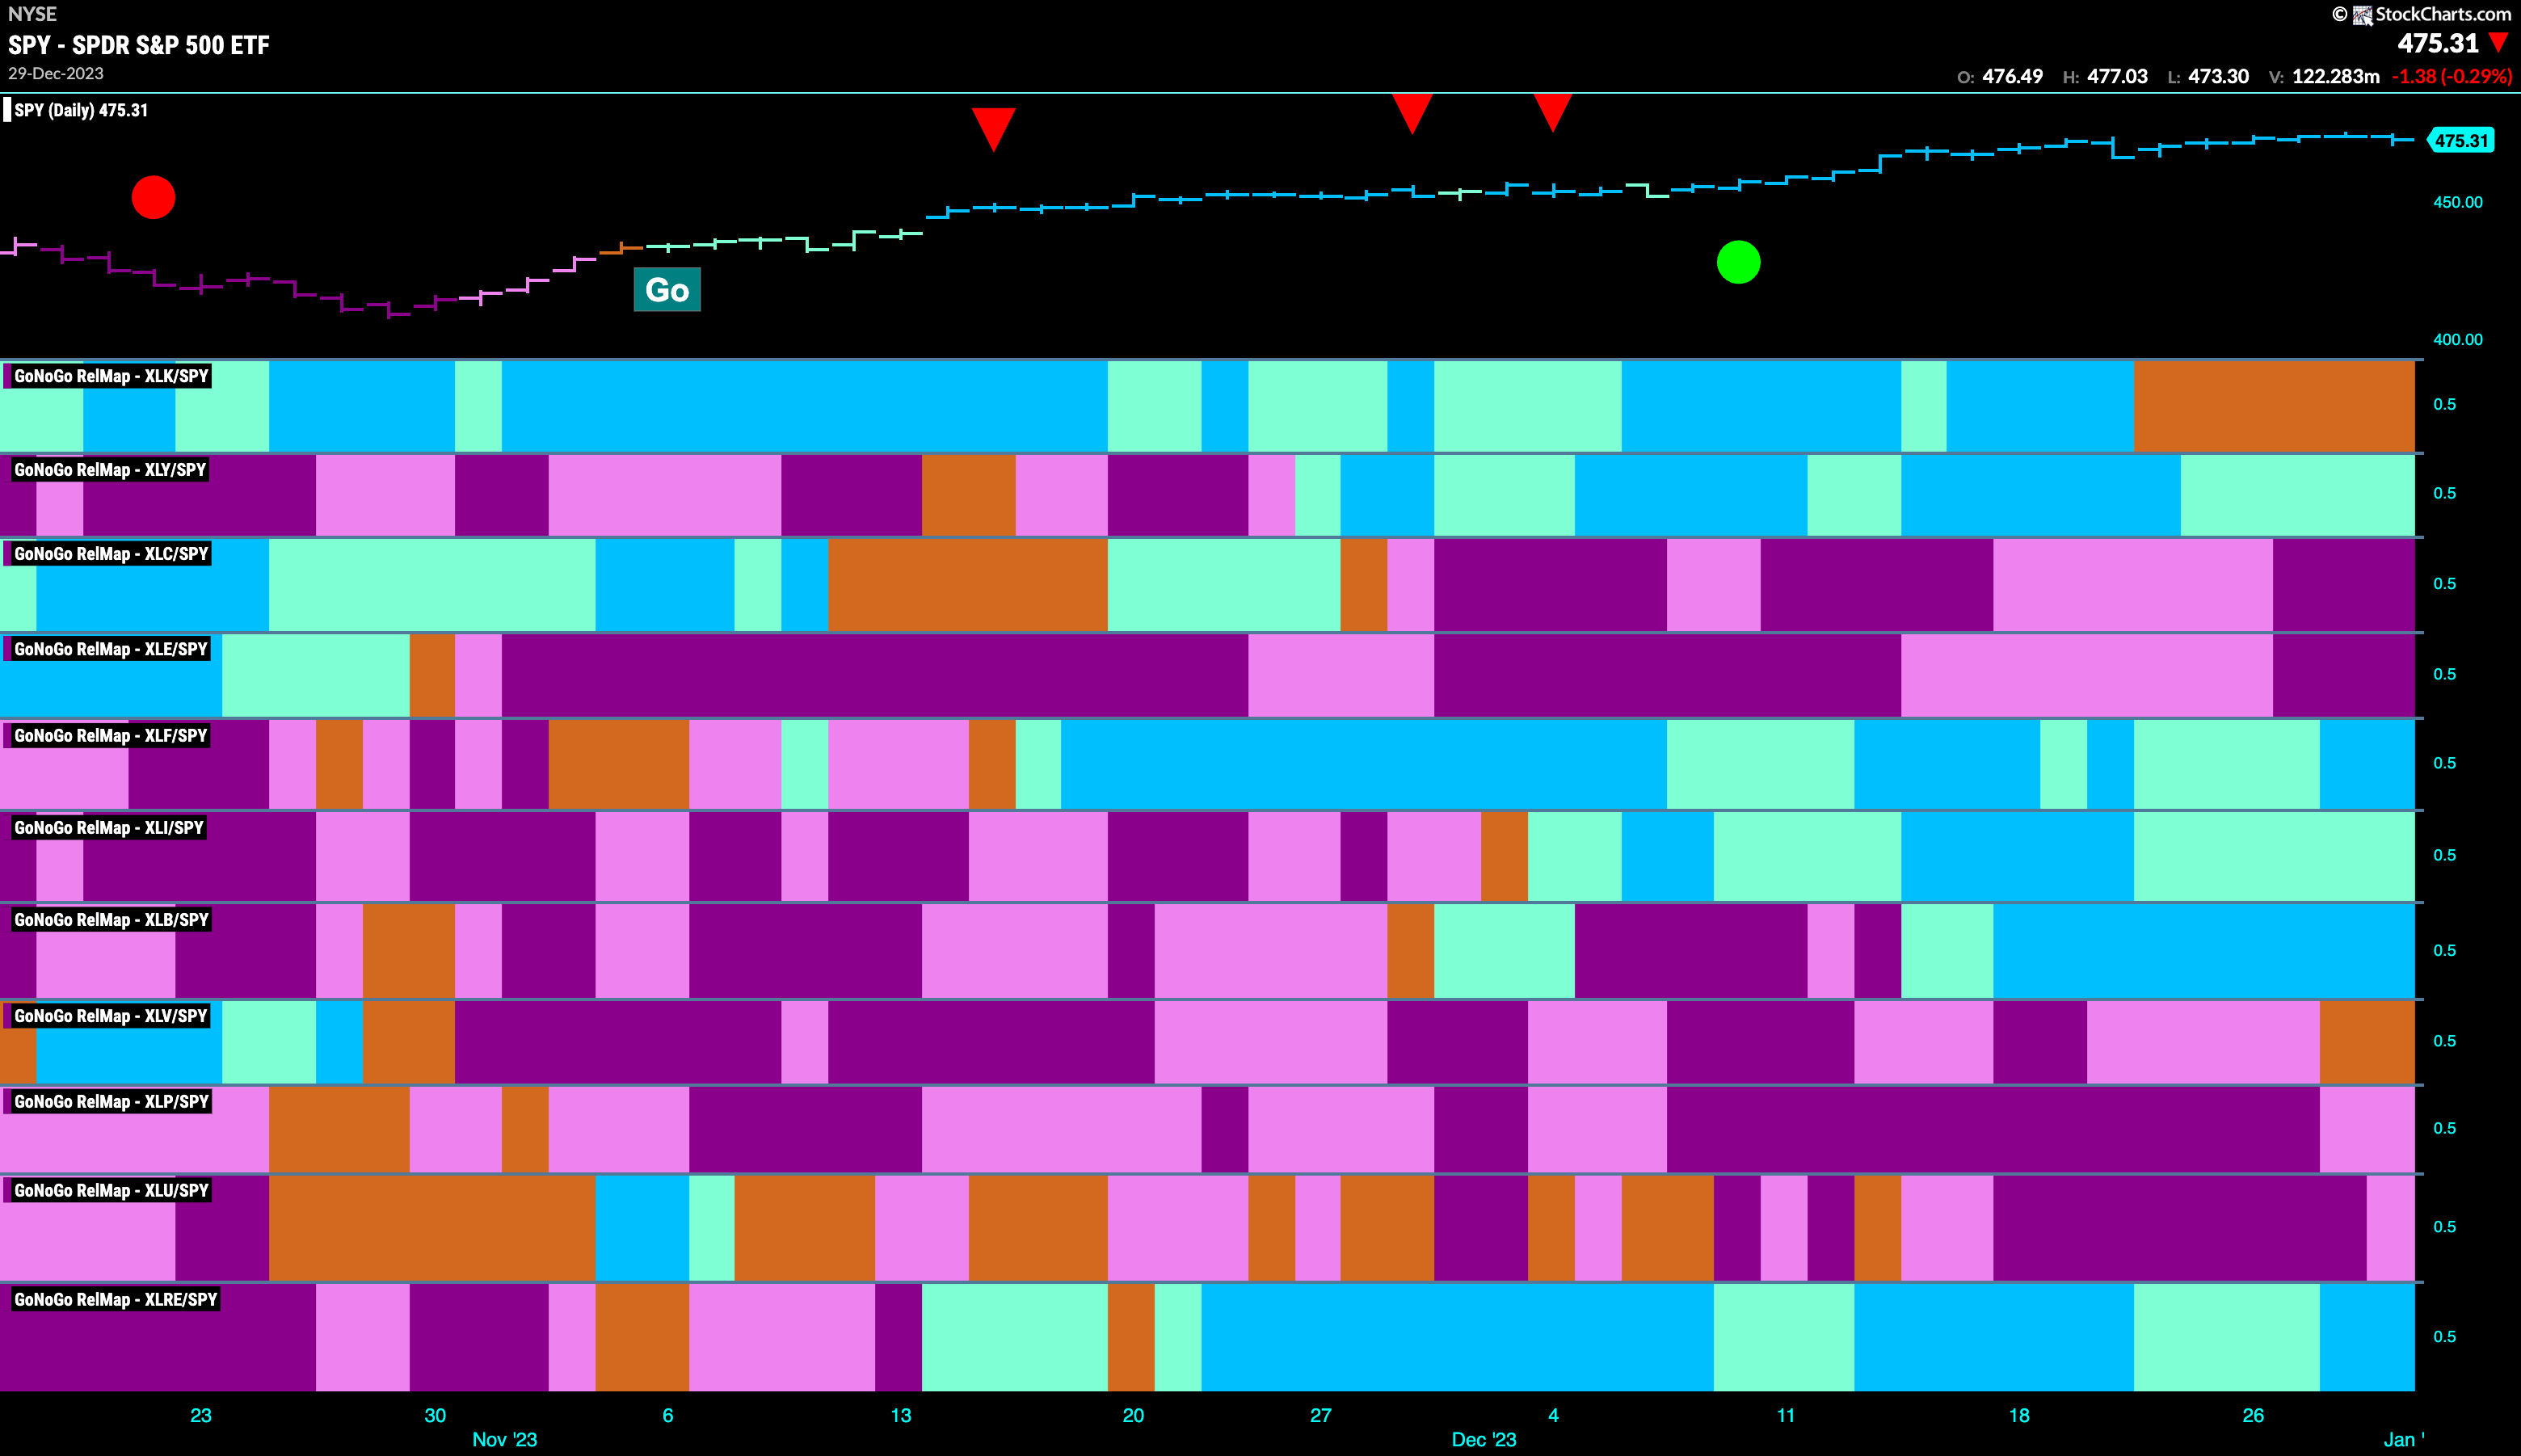
Below is the GoNoGo Sector RelMap. This GoNoGo RelMap applies the GoNoGo Trend to the relative strength ratios of the sectors to the base index. Looking at this map, we can quickly see where the relative outperformance is coming from as well as which sectors are lagging on a relative basis. 5 sectors are outperforming the base index this week. $XLY $XLF, $XLI, $XLB, and $XLRE, are painting “Go” bars.
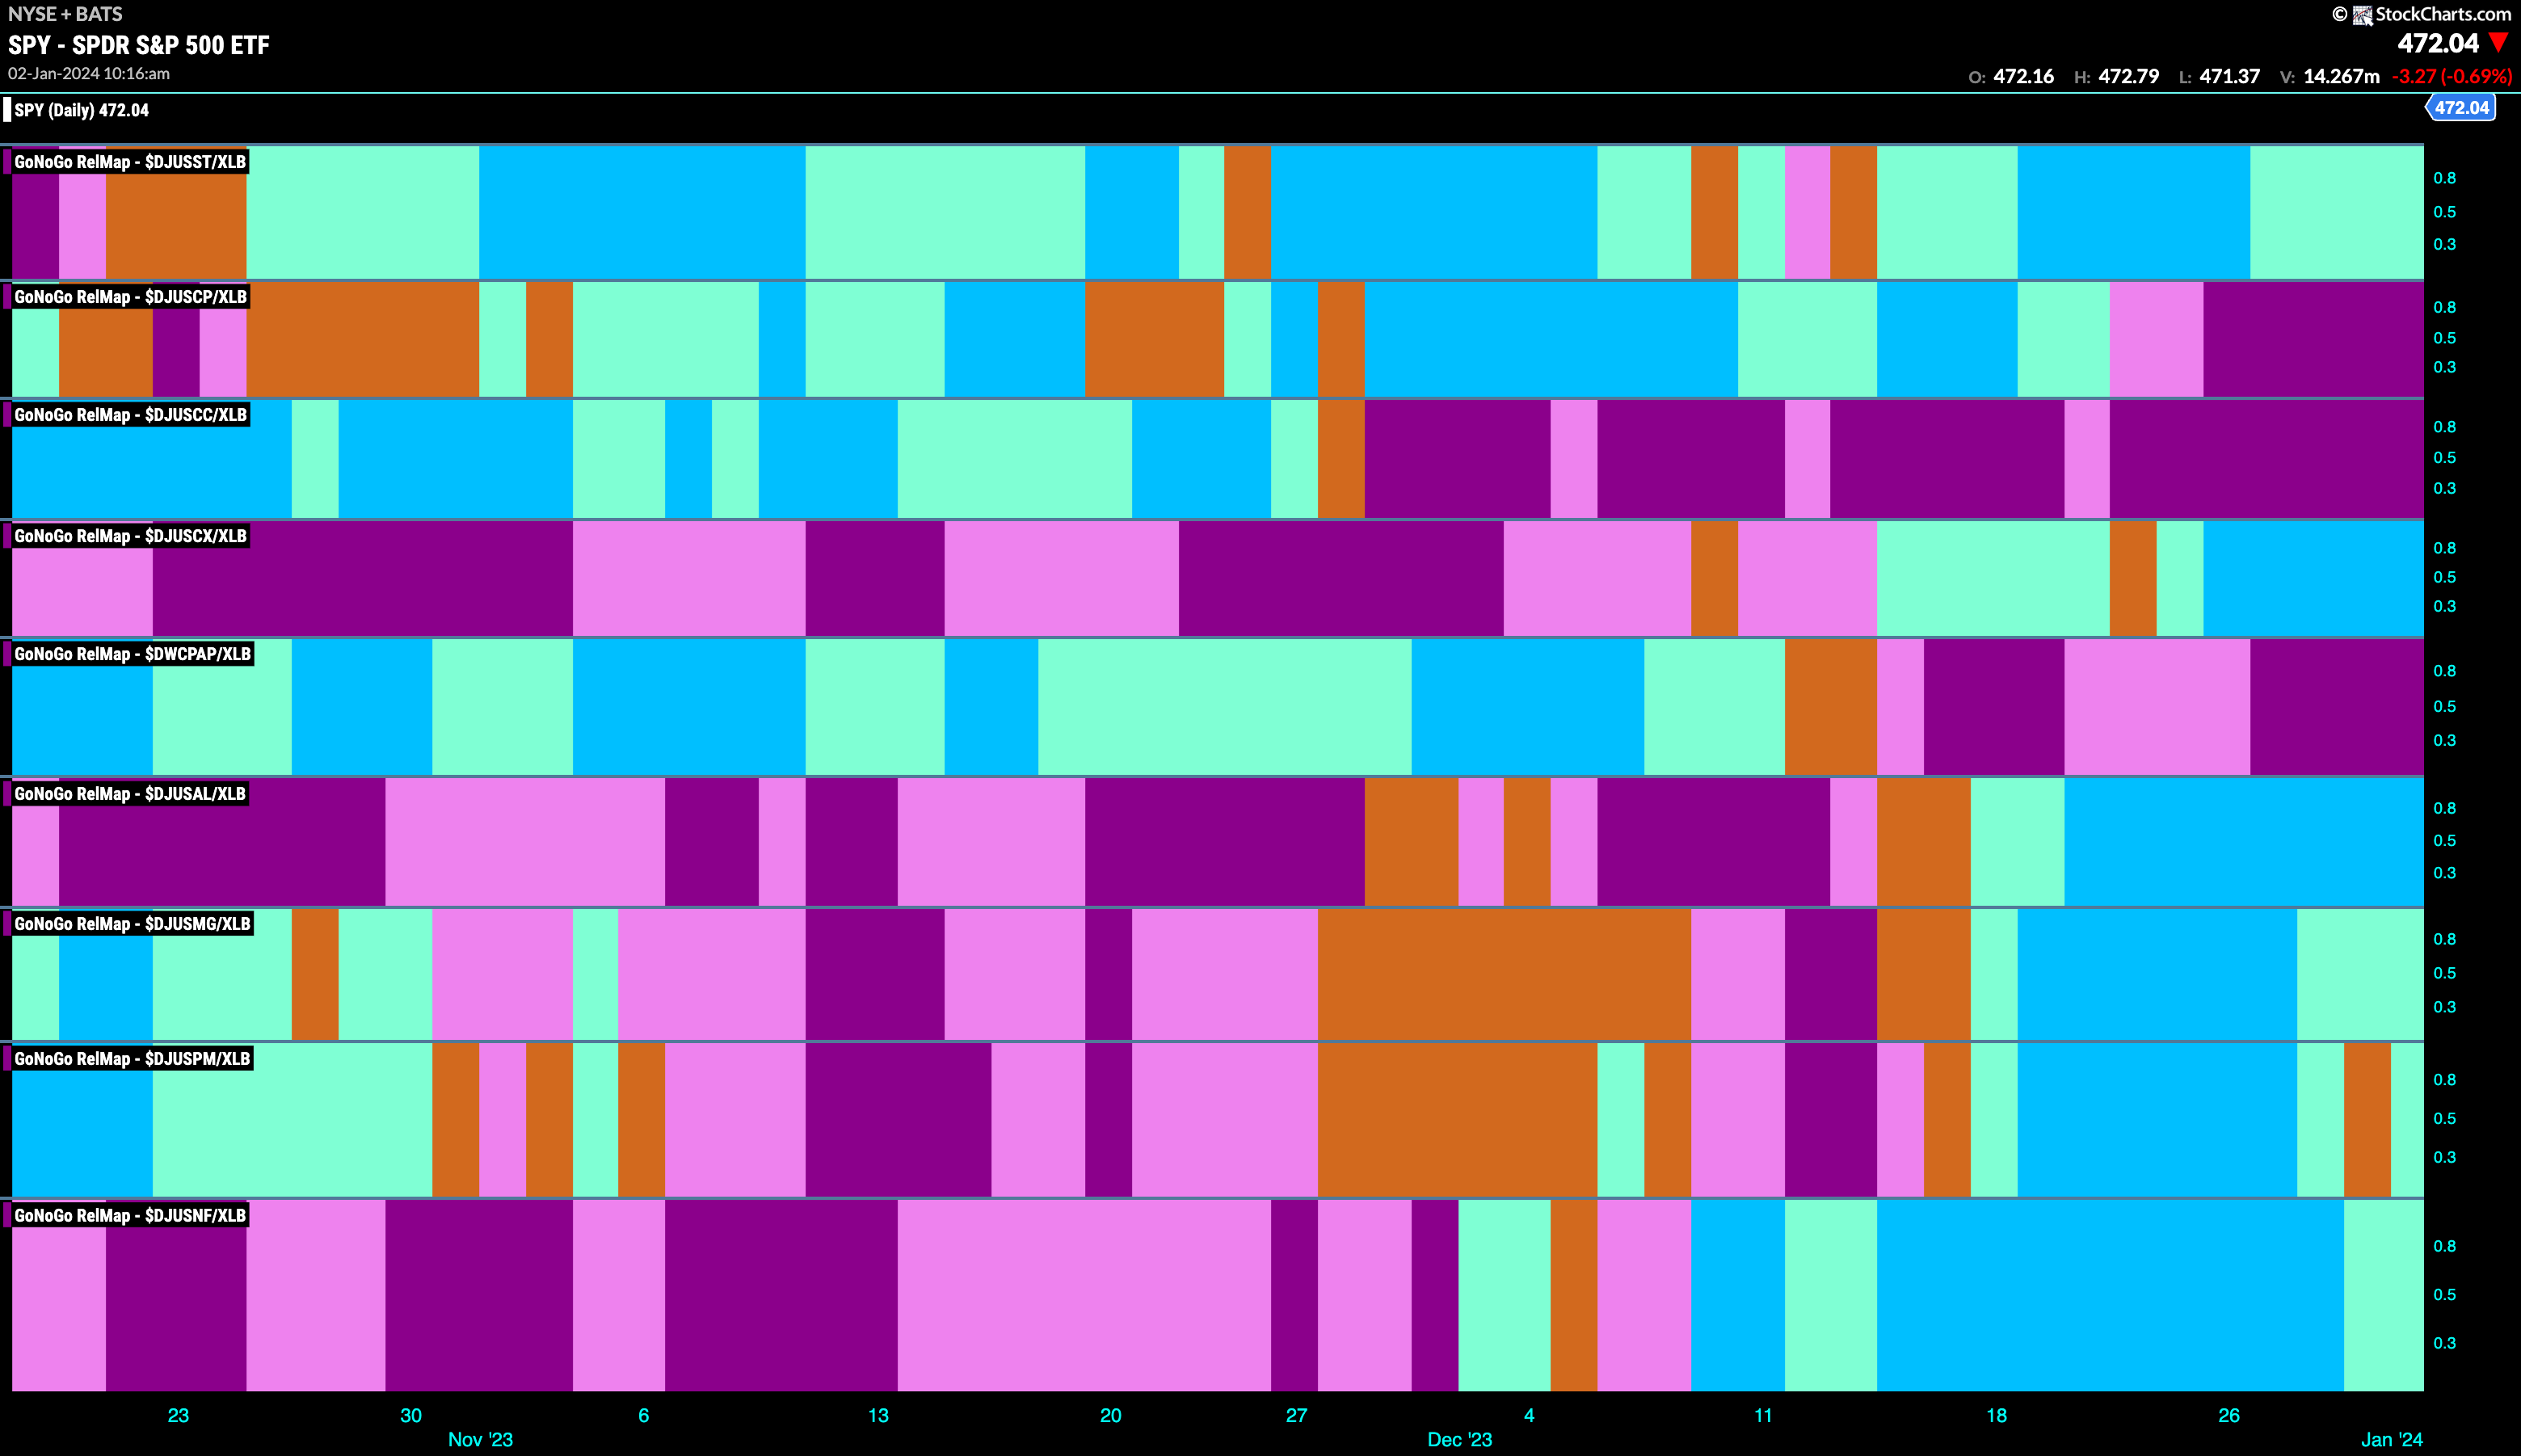
Materials Sub-Group RelMap
The GoNoGo Sector RelMap above shows that the materials sector continues to outperform and paints strong blue relative “Go” bars. Below is the GoNoGo RelMap showing the sub groups of the materials sector relative to the sector. We can see that there are several sub groups that are in relative “Go” trends. In the 6th panel, aluminum is painting strong blue “Go” bars relative to the sector.
$CENX Enters Weekly “Go” Trend
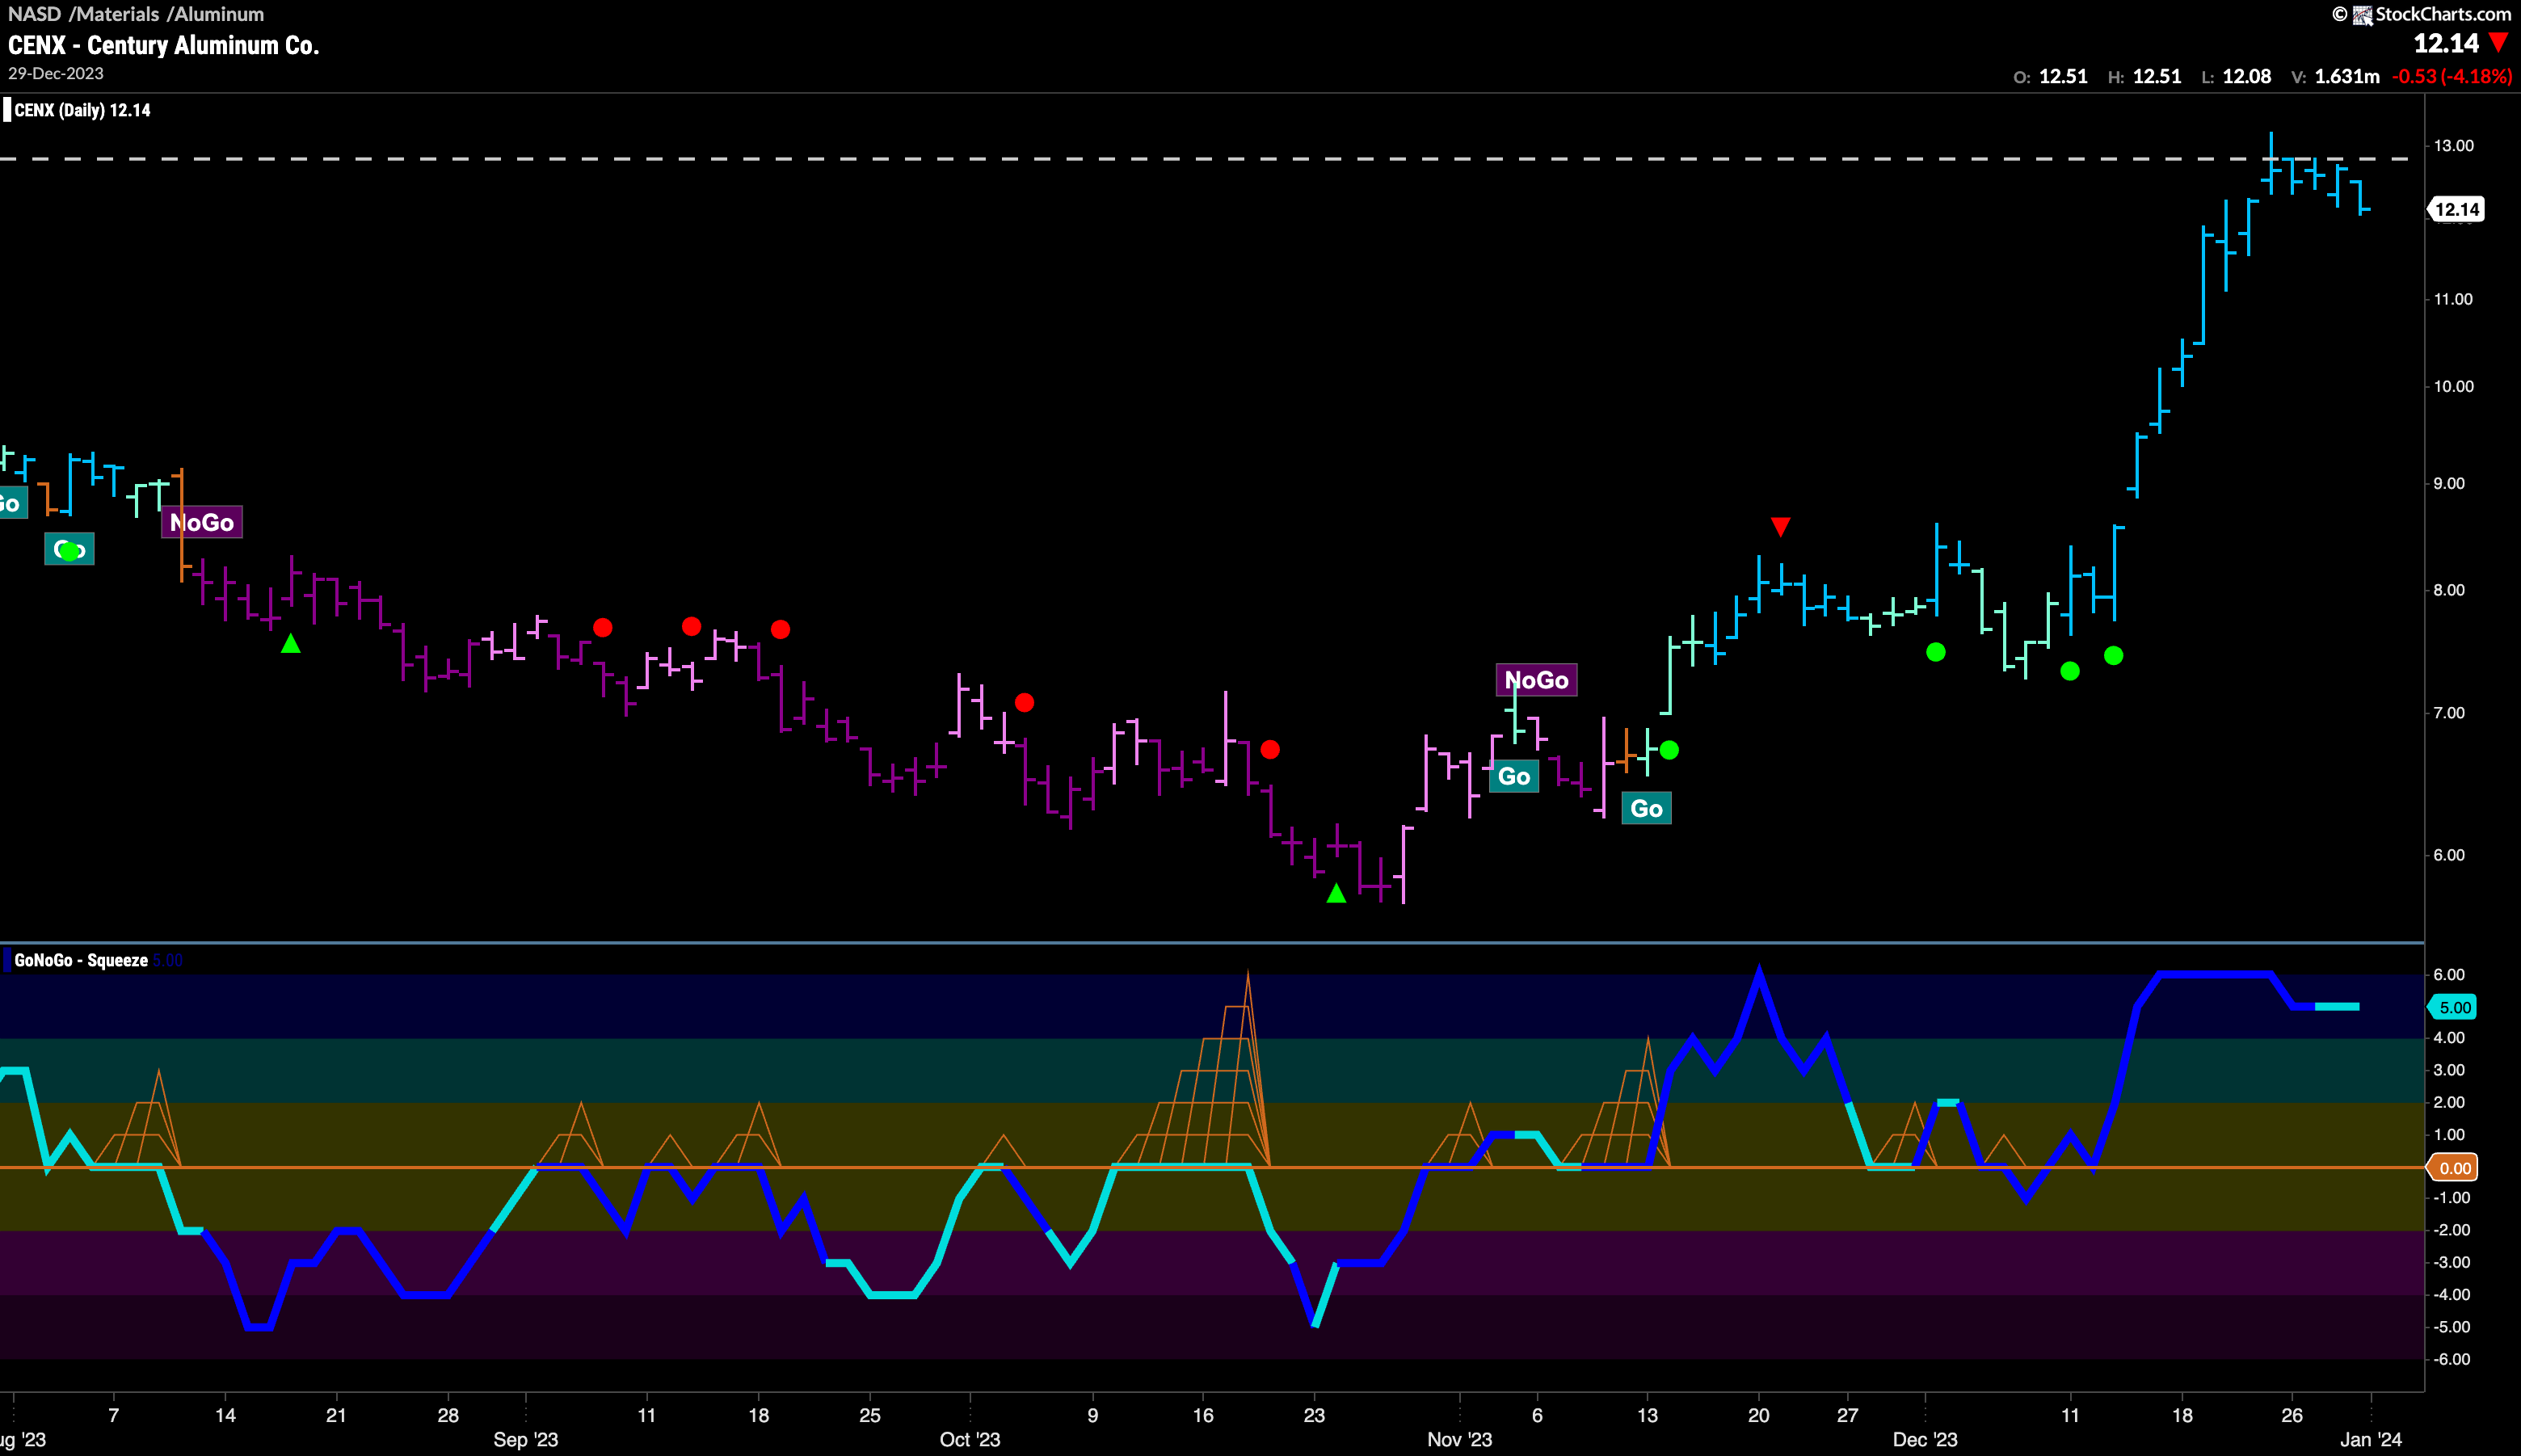
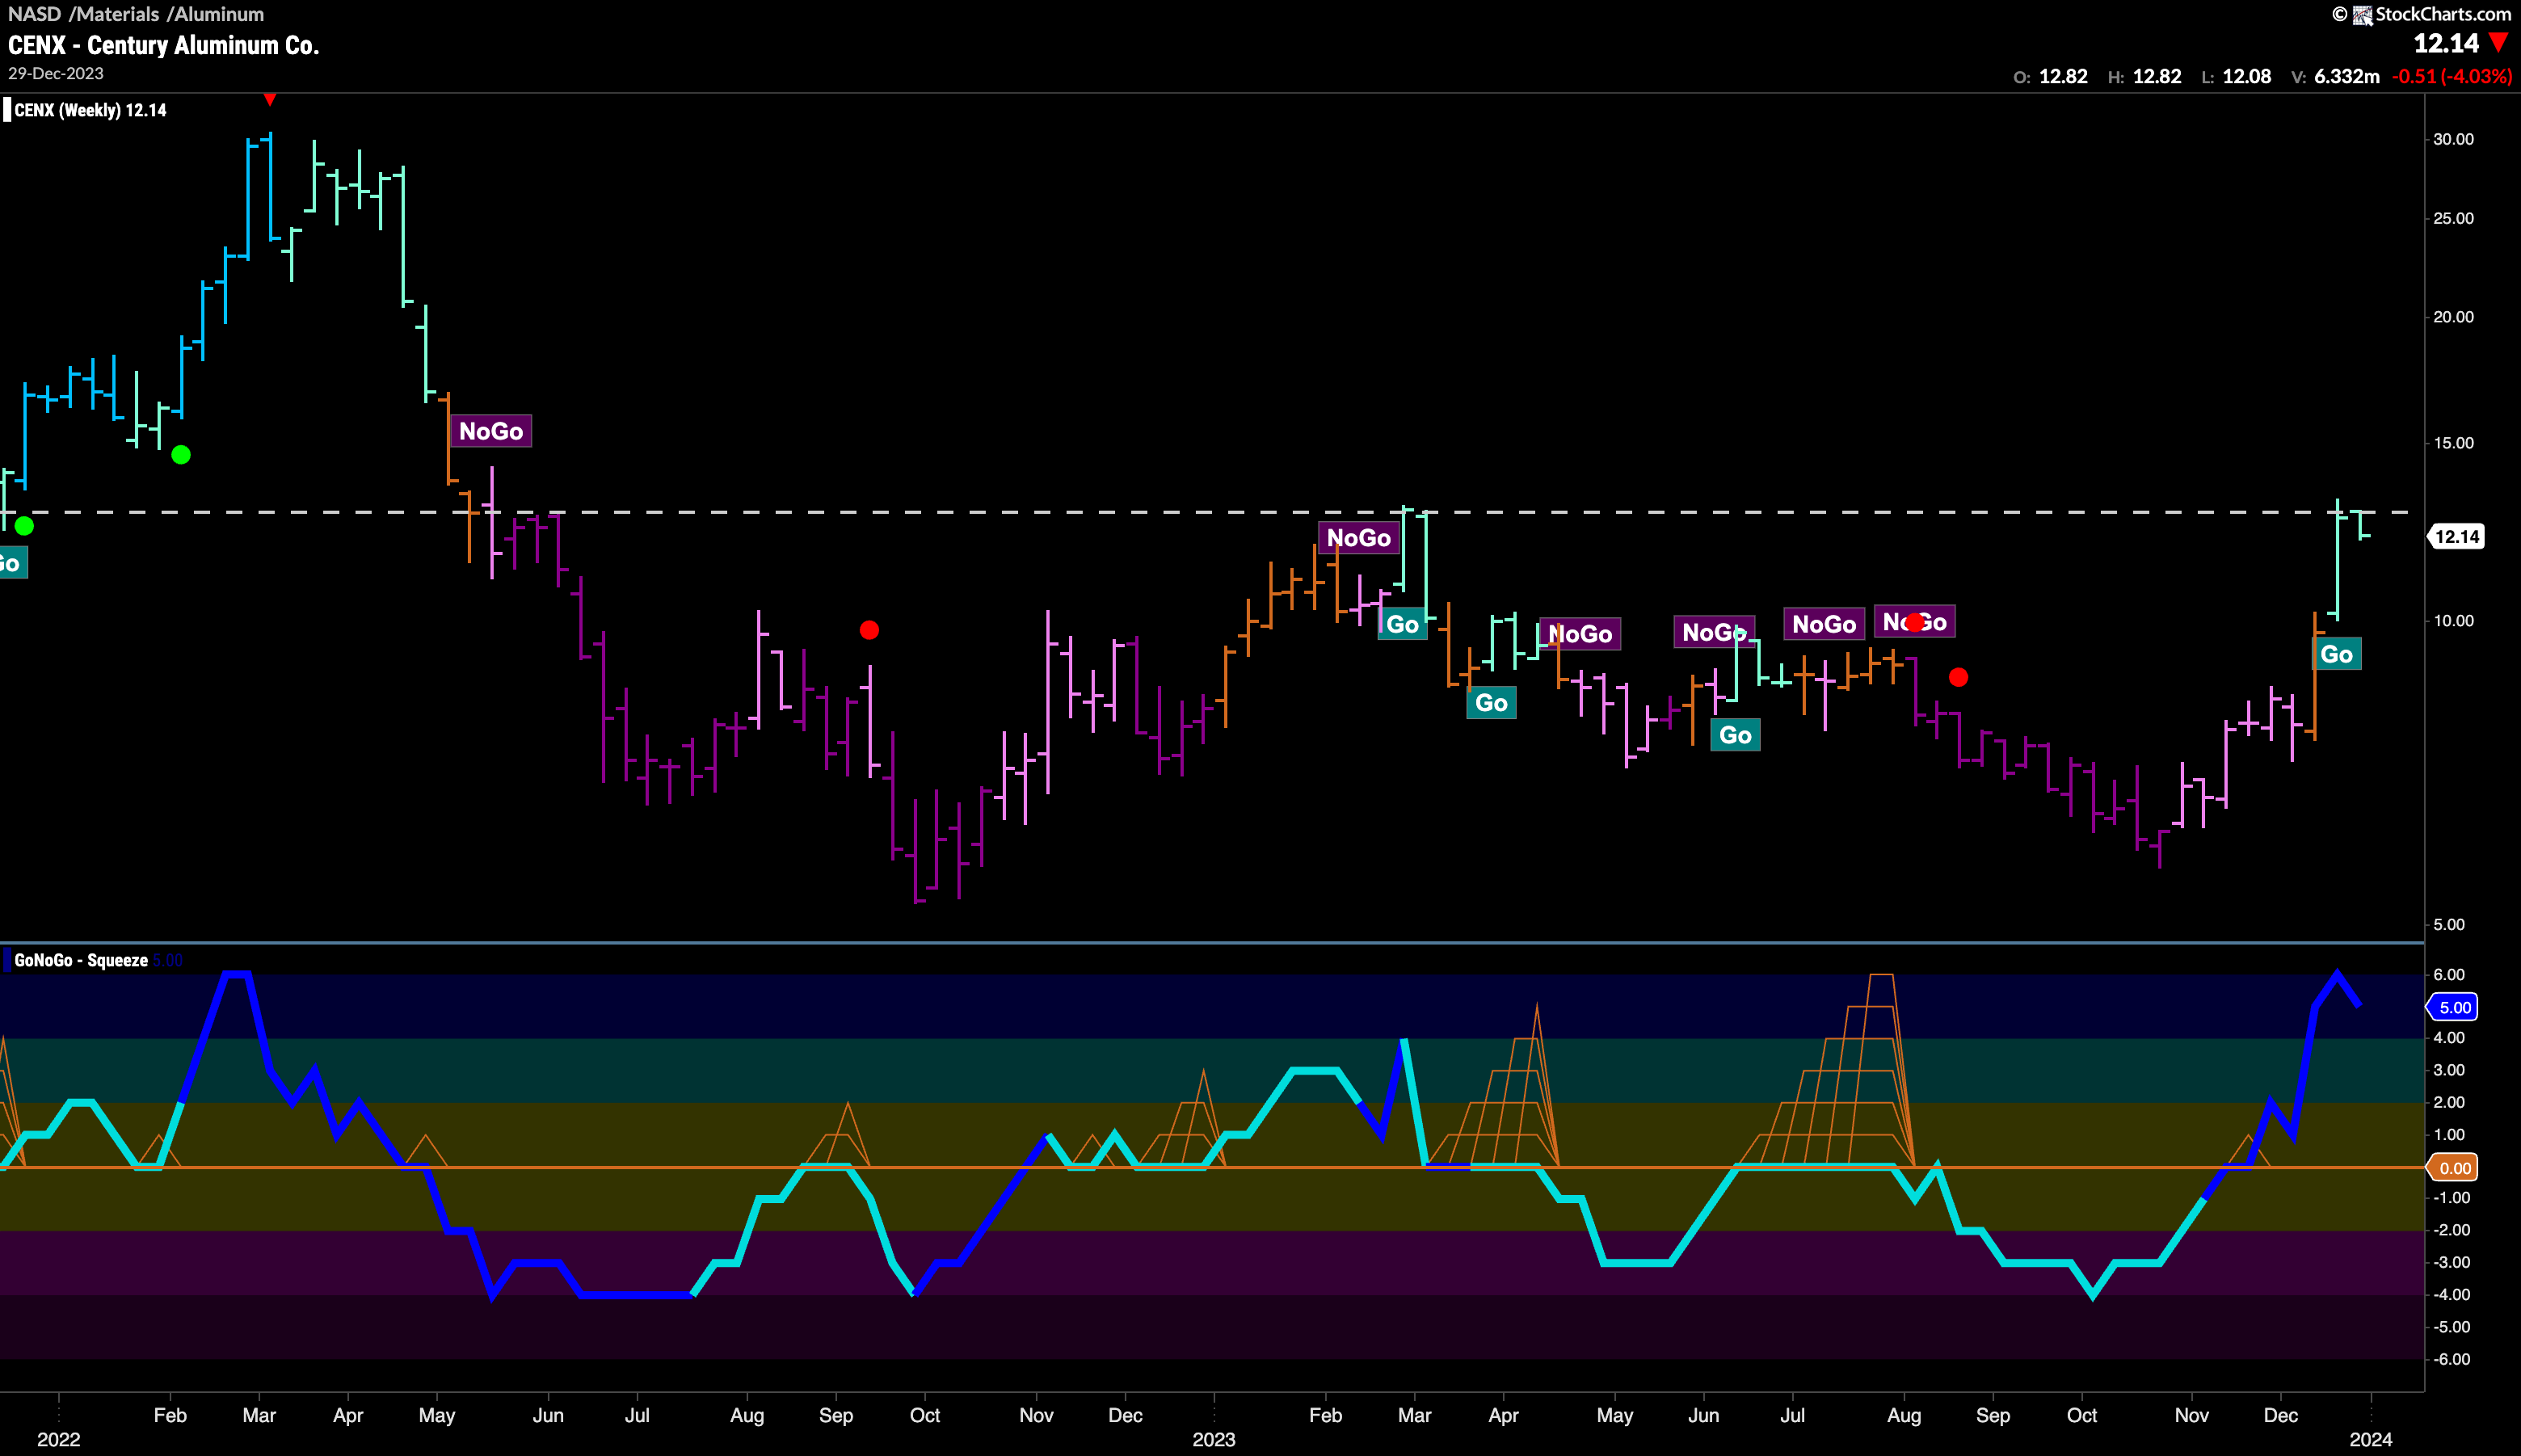
$CENX is a company in the Aluminum sub group of the materials sector and the weekly chart below shows that it has recently entered a new “Go” trend. Momentum has been fierce over the last few weeks as it has soared on heavy volume to overbought territory. We will watch to see if this surging momentum can give price the push it needs to climb above resistance to new highs. The resistance on the chart could prove to be strong, but a close above the horizontal line could lead to significant gains.
The daily chart shows that price is banging up against that resistance from the larger time frame chart. With GoNoGo Trend painting uninterrupted strong blue “Go” bars we will look to see if GoNoGo Oscillator can maintain its extended period of enthusiasm as it stays in overbought territory. Perhaps we will need to see momentum cool and surge again, bouncing off the zero line before price can attack new highs.
