Good morning and welcome to this week’s Flight Path. The equity trend is a “NoGo” and we saw the market respond sharply to tariff news by gapping lower on strong purple bars. Treasury bond prices stayed in a “Go” trend painting strong blue bars while U.S. commodities showed uncertainty again. The dollar remained in a strong “NoGo” trend with purple bars this week.

$SPY Reflects Market Turmoil in Strong “NoGo”
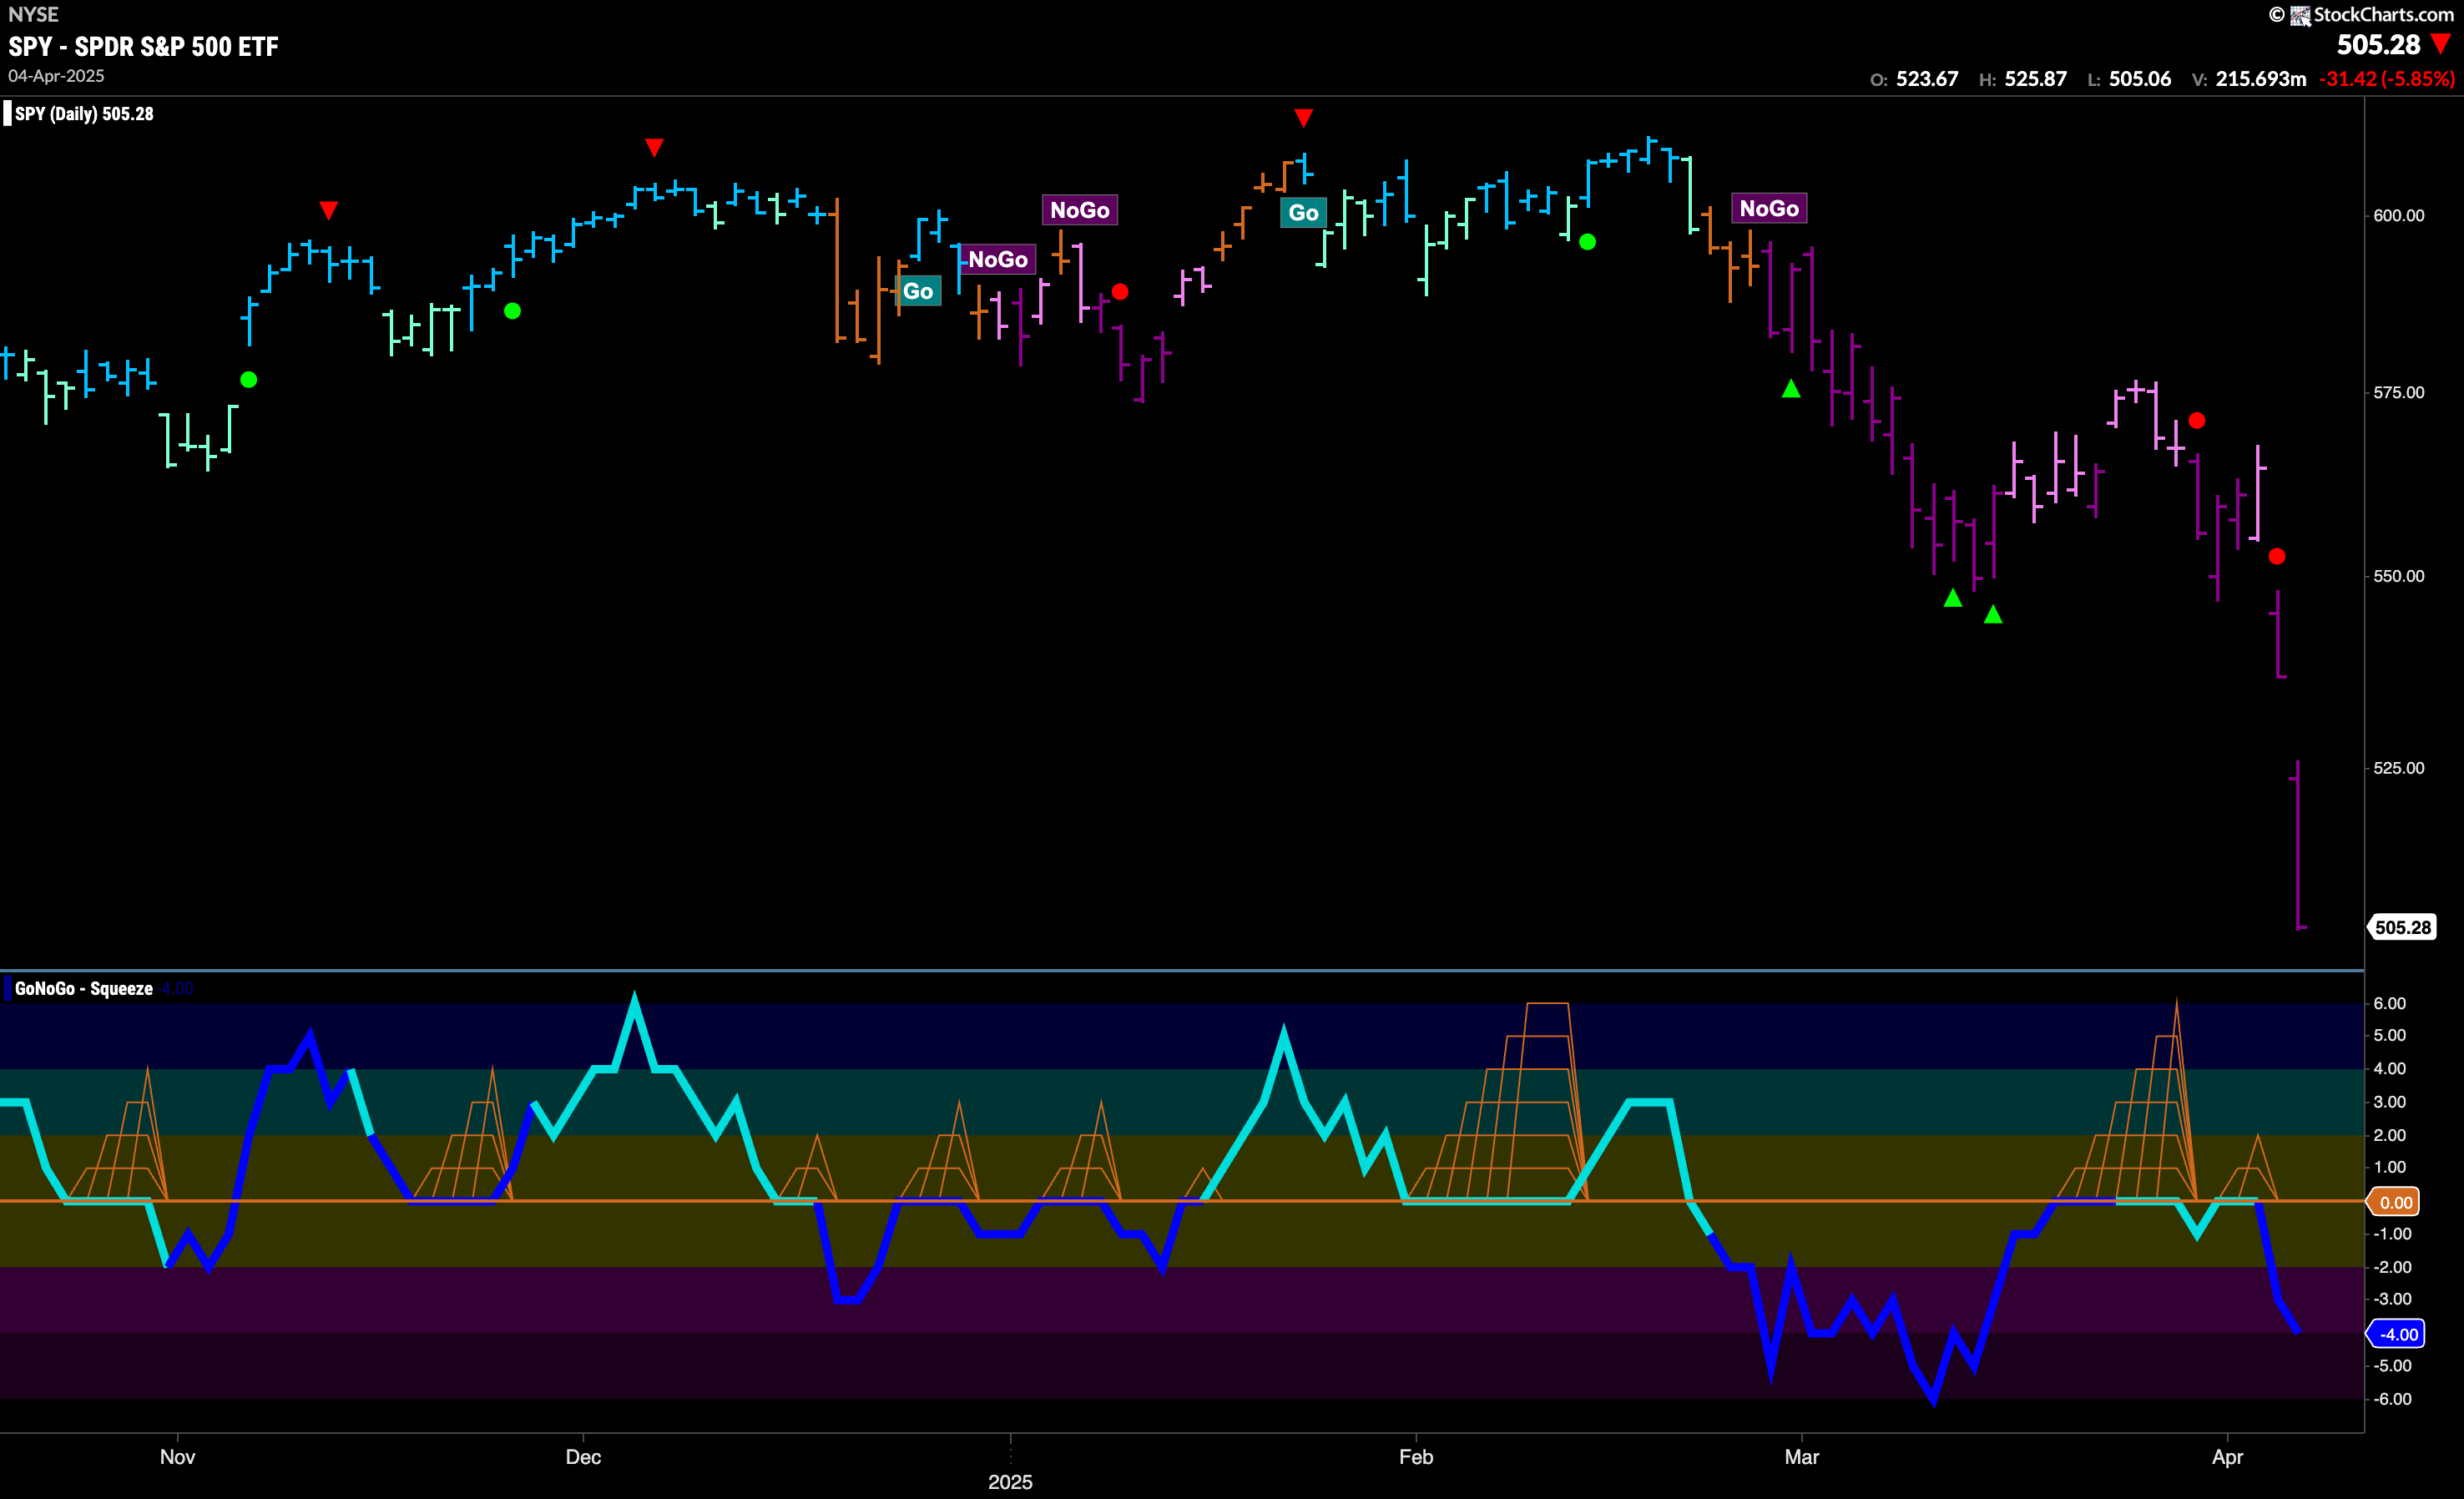
The GoNoGo chart below shows that the “NoGo” trend remains strong as last week closed with a strong purple bar after gapping to new lows. GoNoGo Oscillator has been rejected again by the zero line and is falling quickly toward oversold territory on heavy volume.
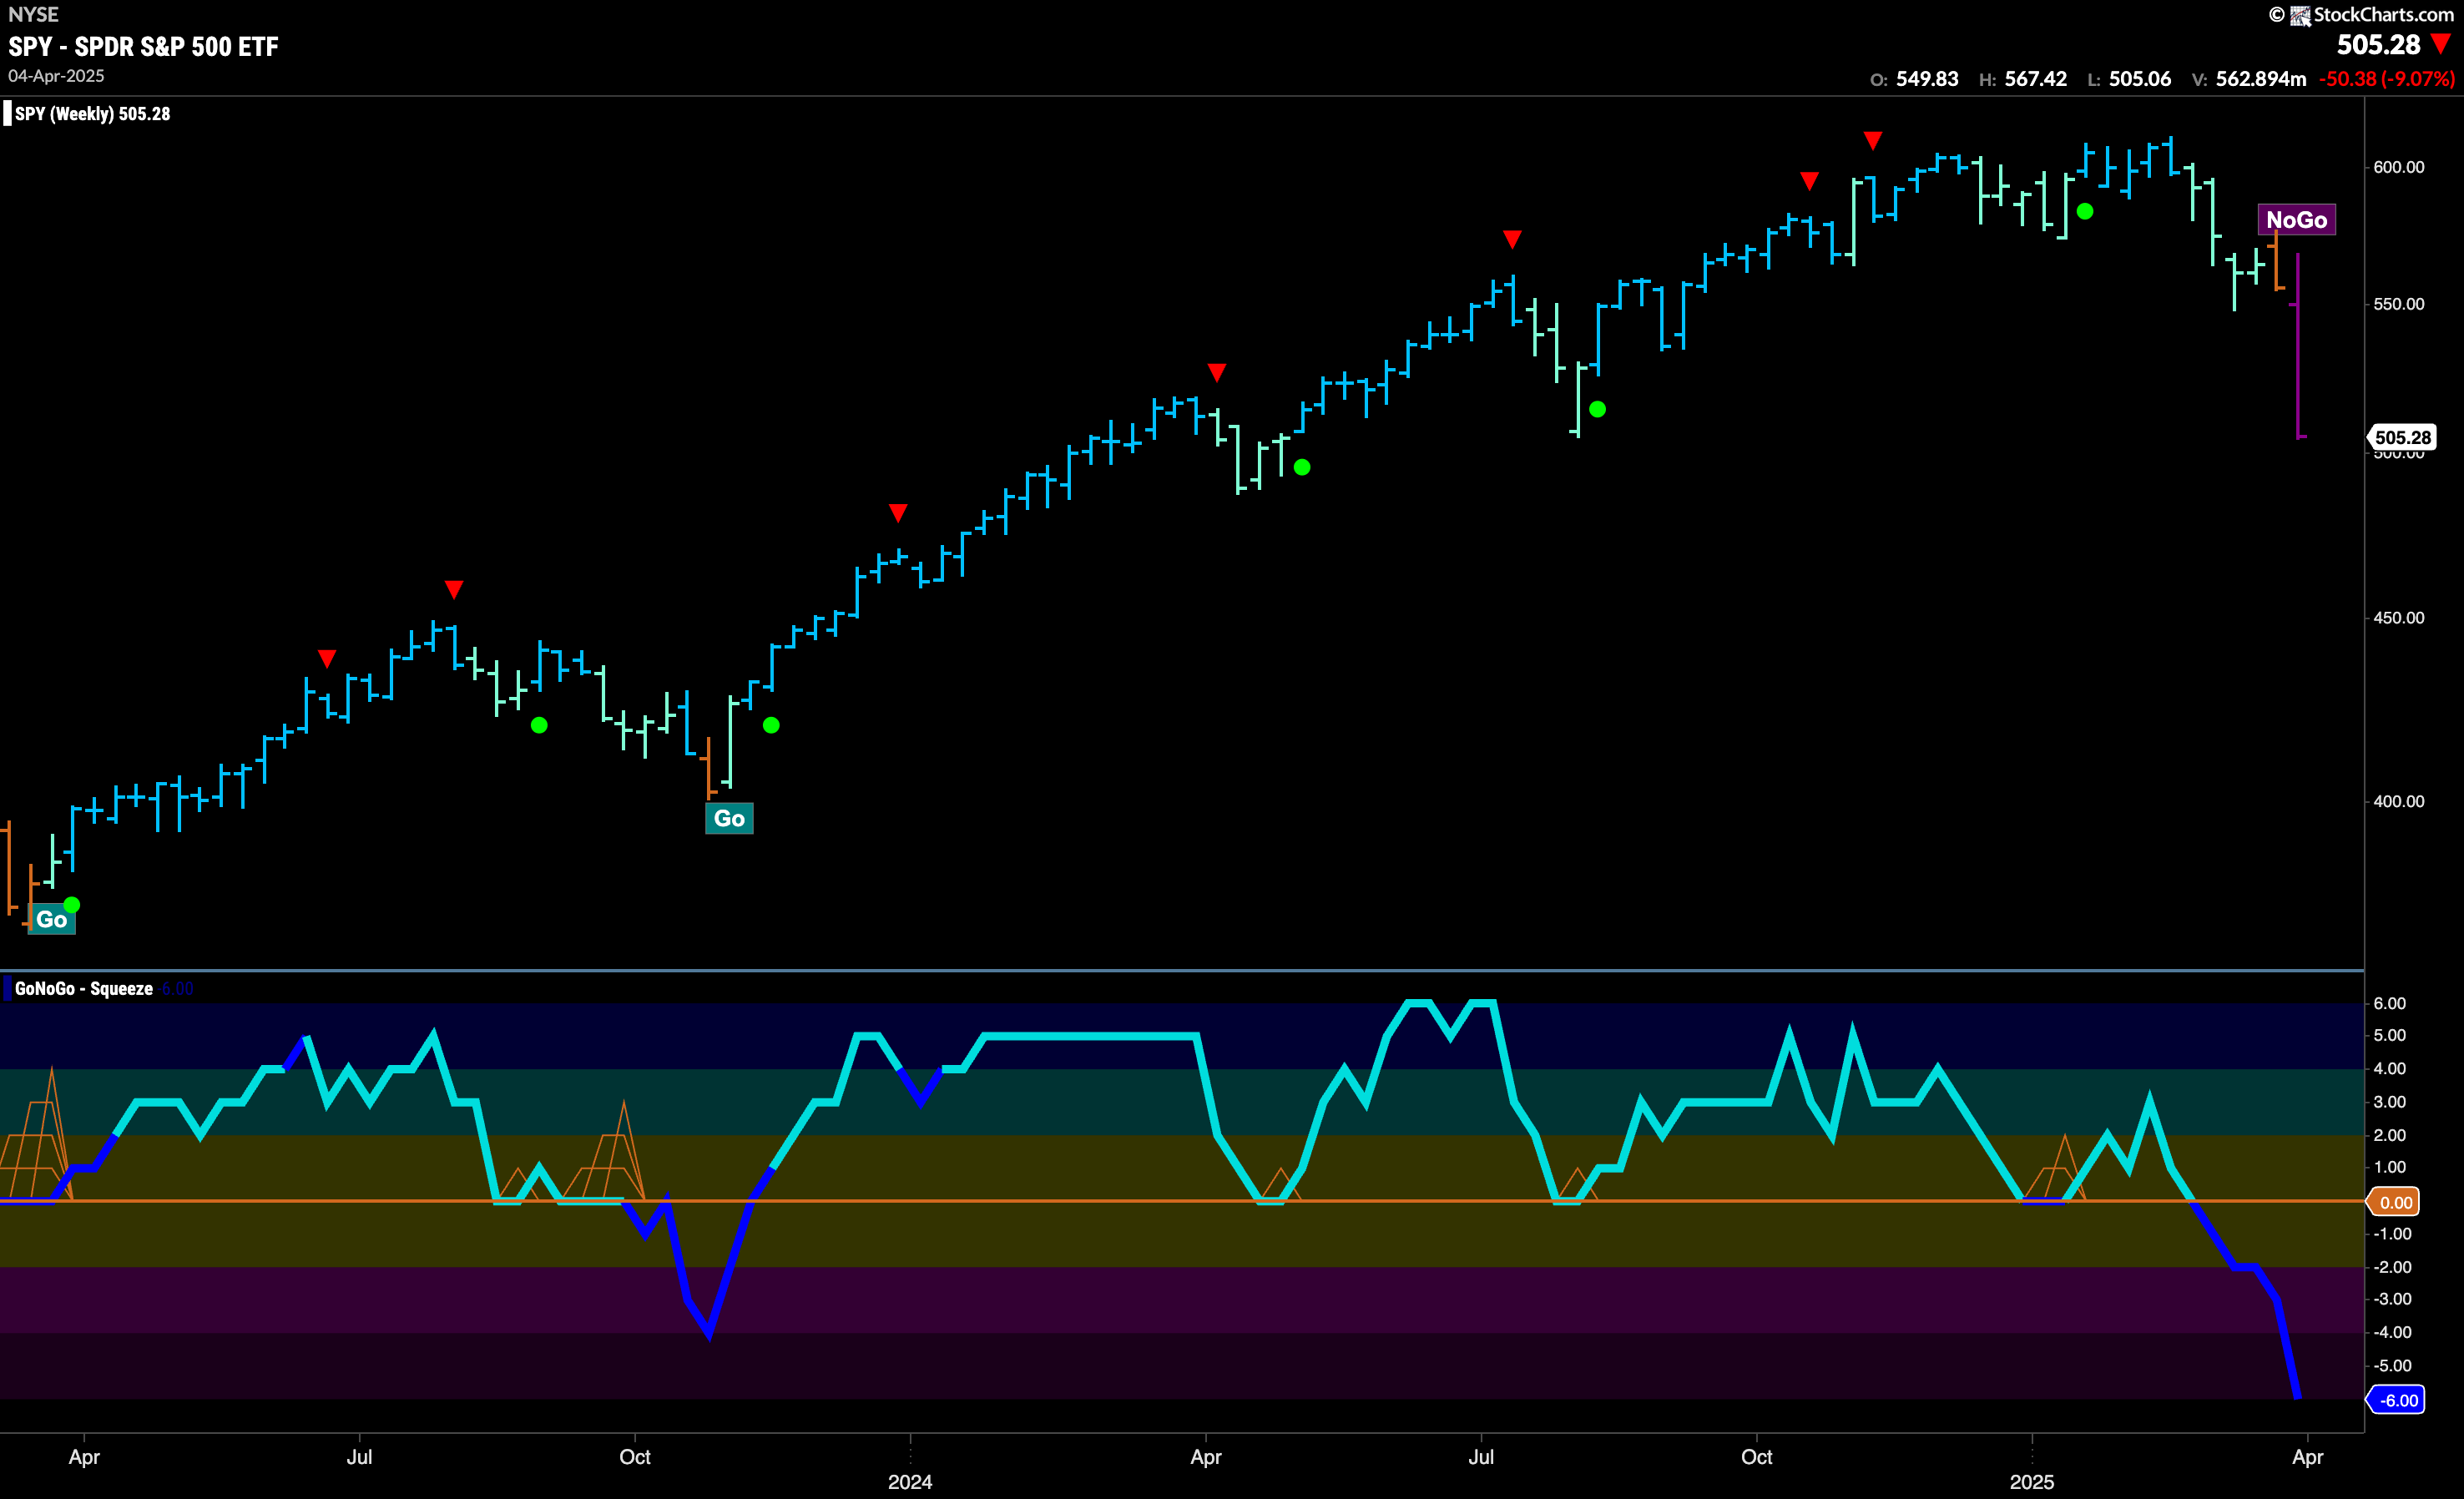
The trend is a “NoGo” now on the weekly chart. A strong bar has taken prices lower than last summer’s lows. This move lower from the most recent high has also taken place on increased volume. Now, with momentum confirming the “NoGo” trend we will watch to see how low price goes from here.
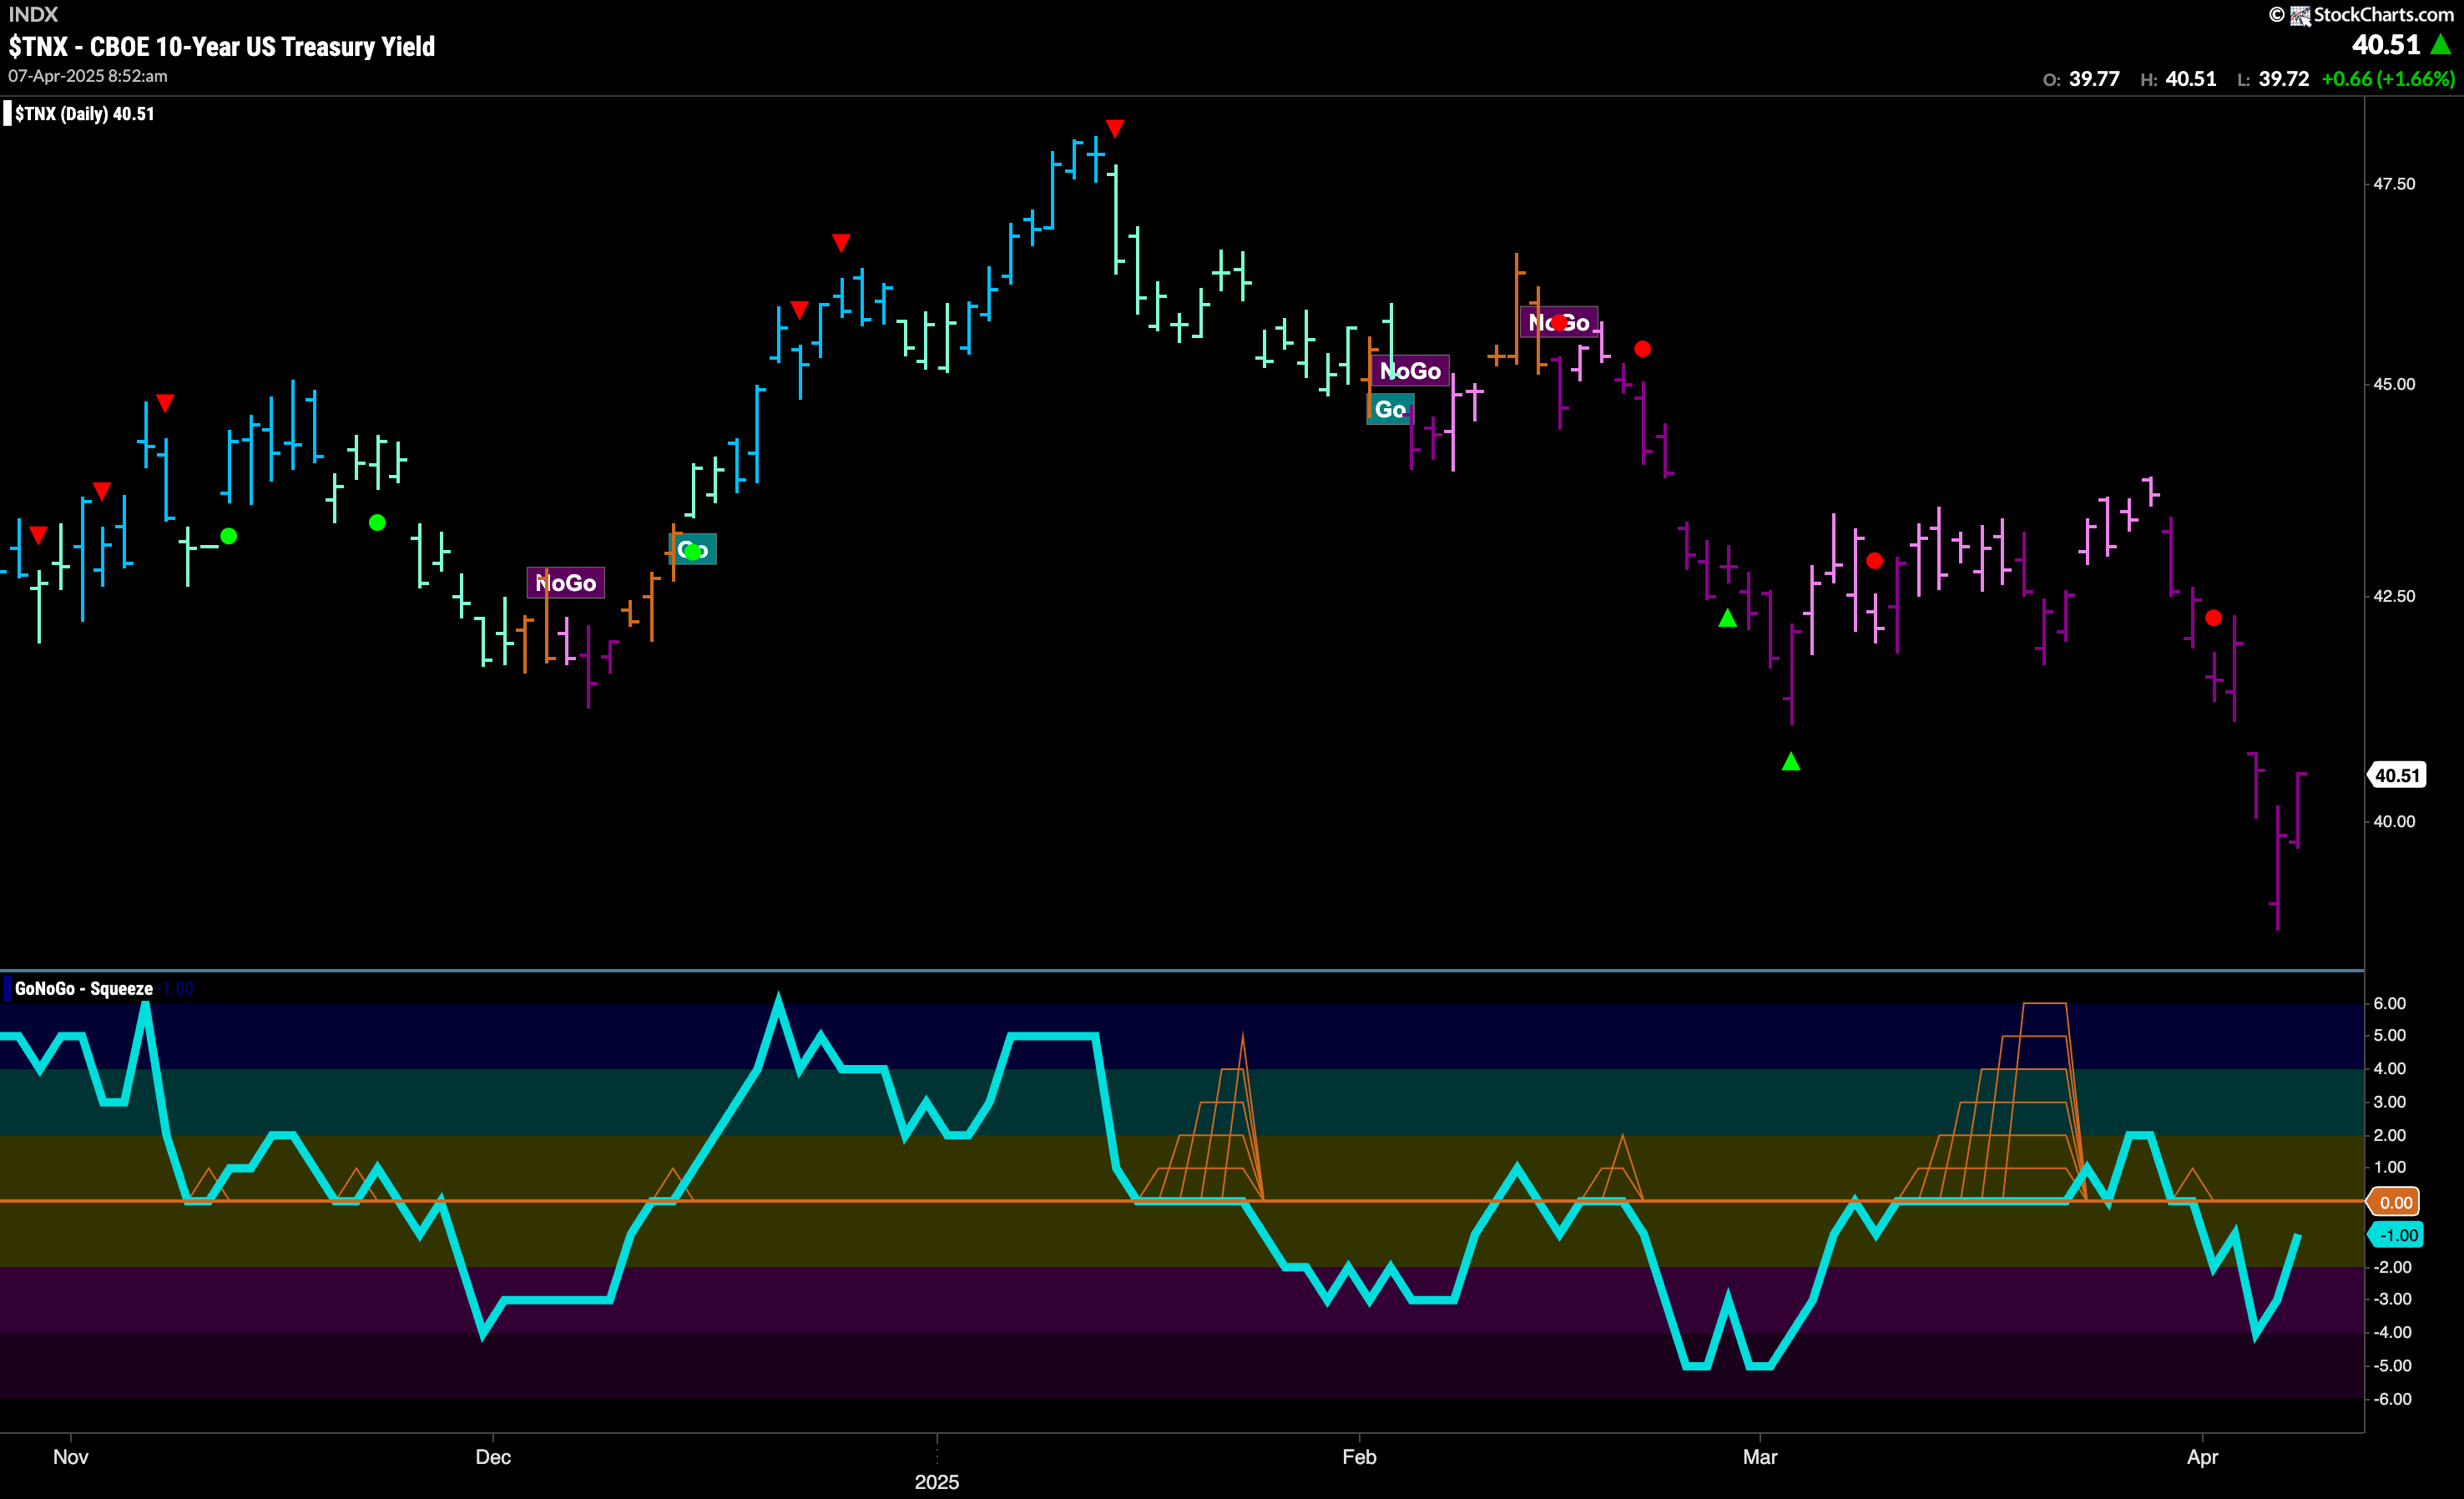
Treasury Rates Hit Another Low
GoNoGo Trend shows that the “NoGo” trend has fallen further with price hitting a new lower low on strong purple bars. GoNoGo Oscillator is rising but still in negative territory at a value of -1. We will watch to see if rates recover this week or settle at these new lows.
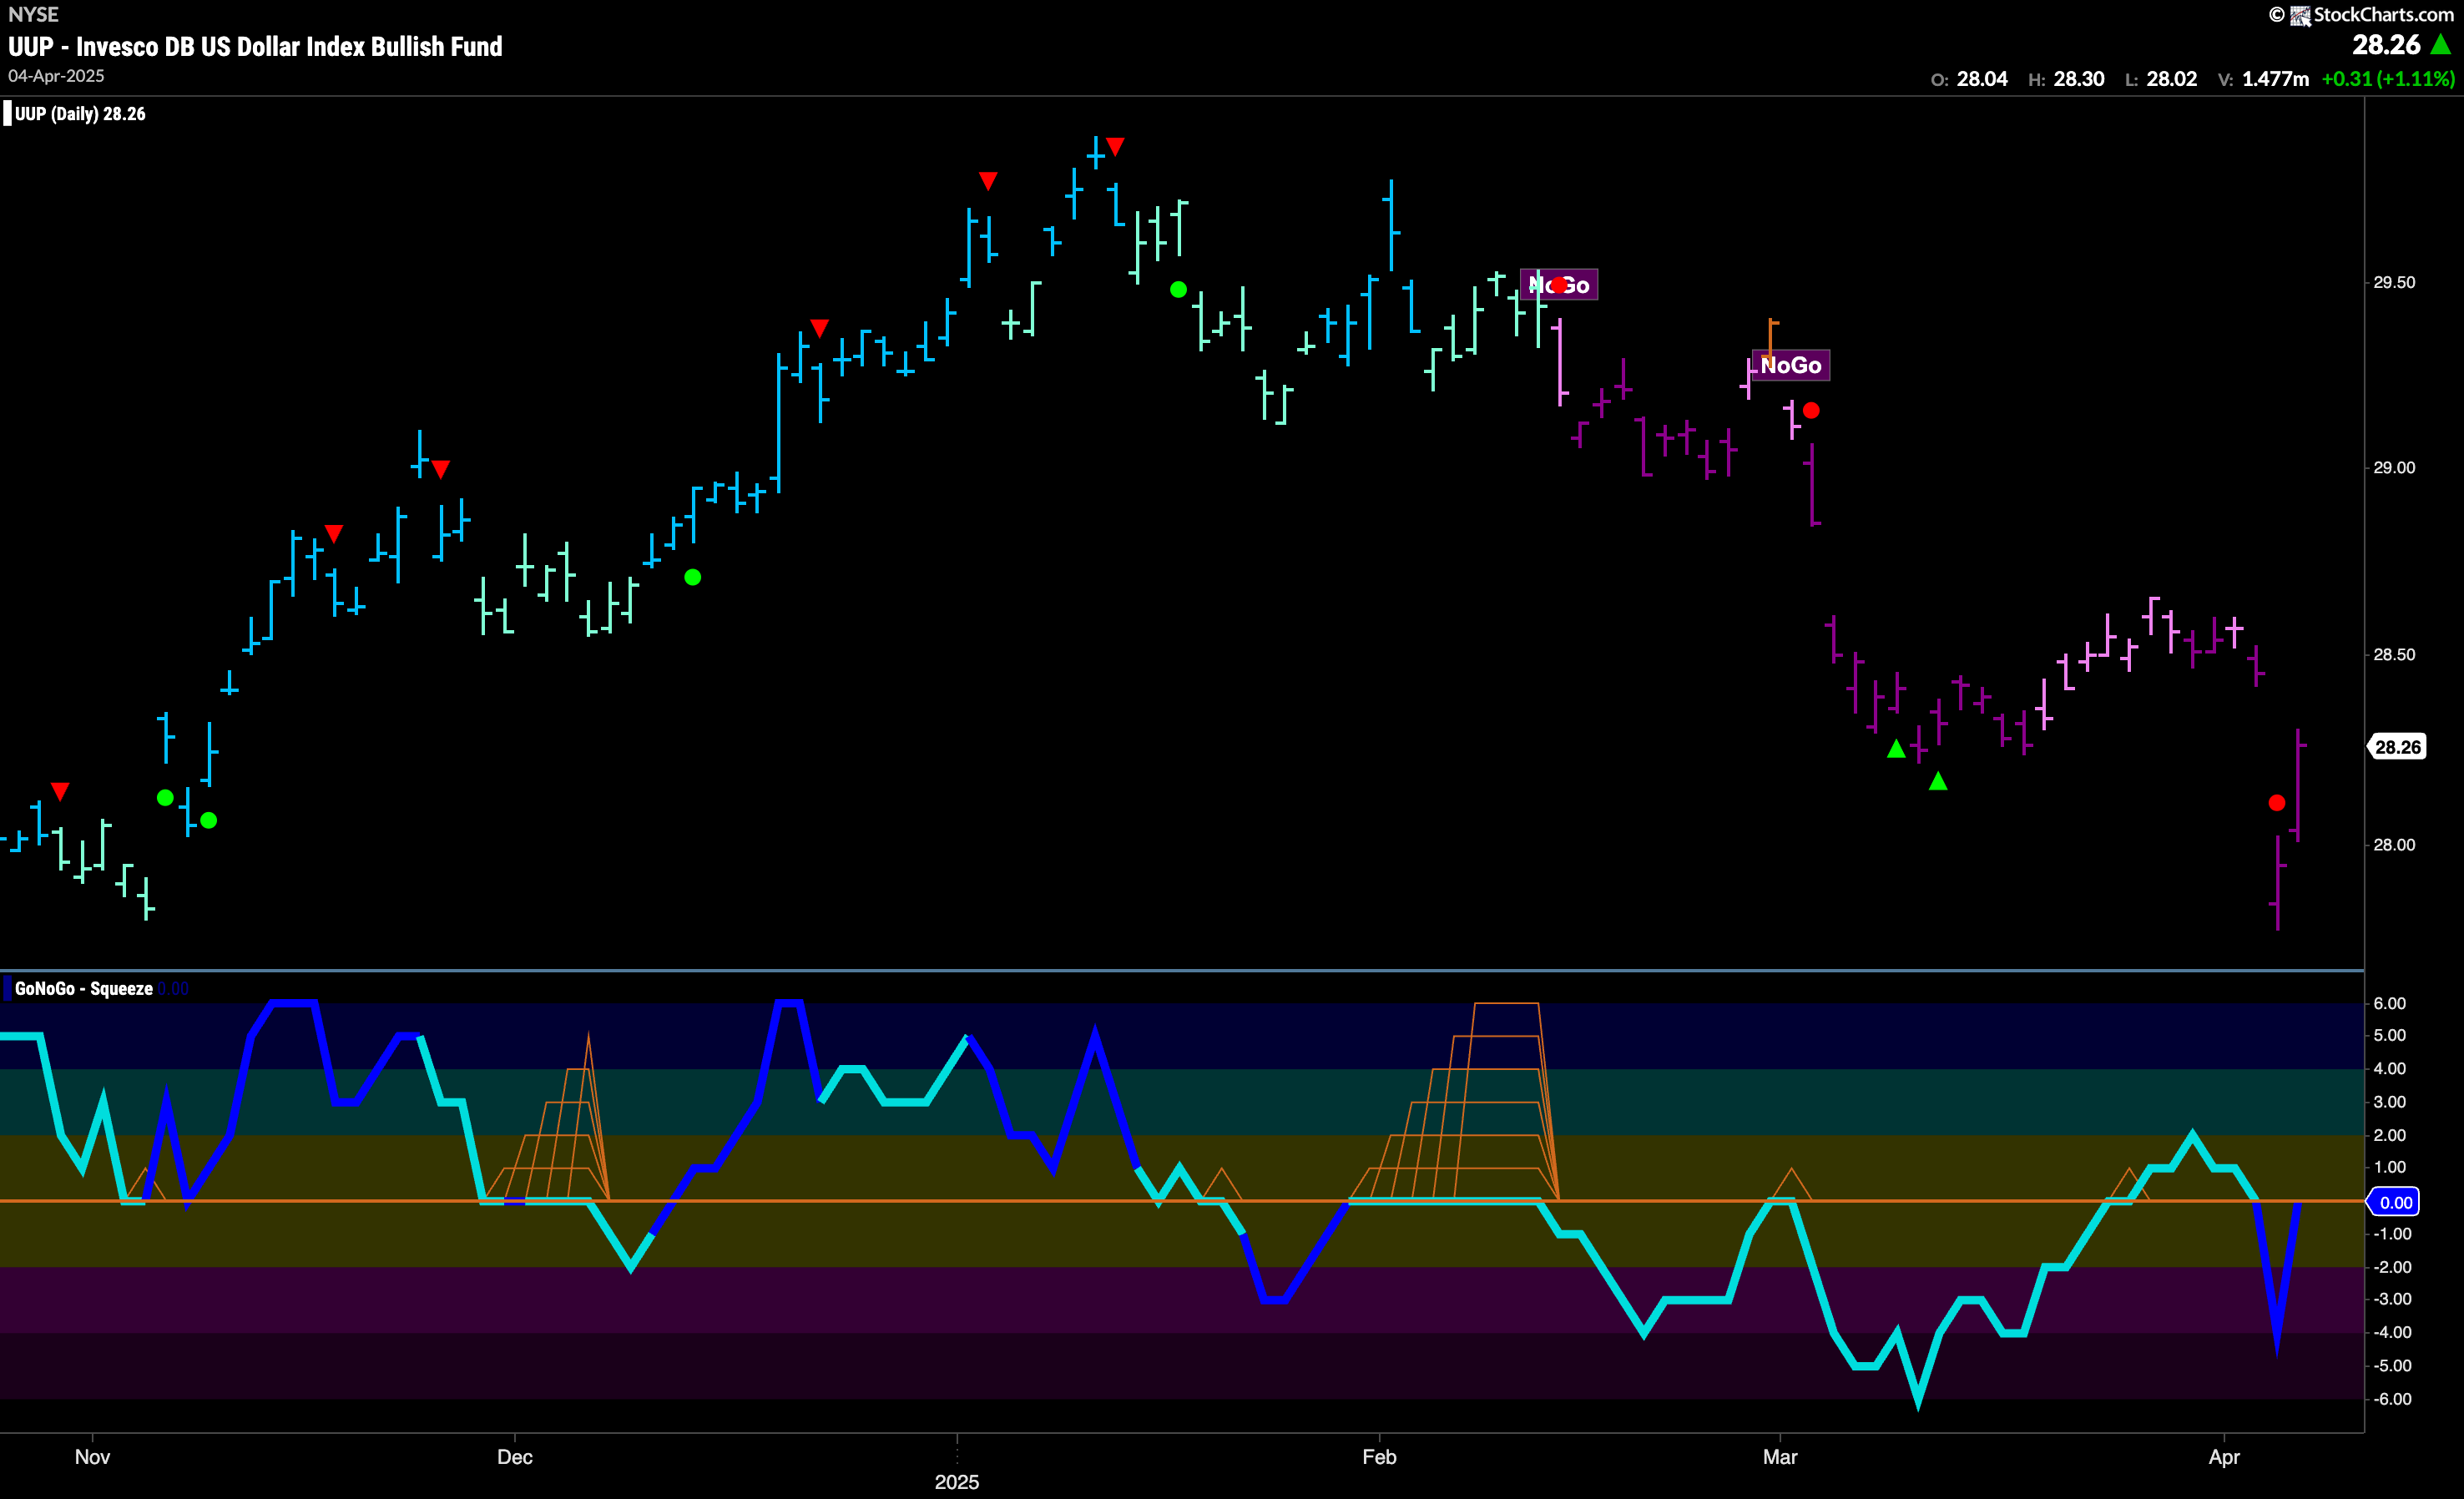
“NoGo” In Place As Dollar Hits New Lower Low
The “NoGo” trend continued as we saw another lower low for the greenback. Strong purple bars accompanied a gap lower. GoNoGo Oscillator fell through the zero line on heavy volume but has rallied to retest that level from below. We will watch to see if it gets rejected at that level going forward.
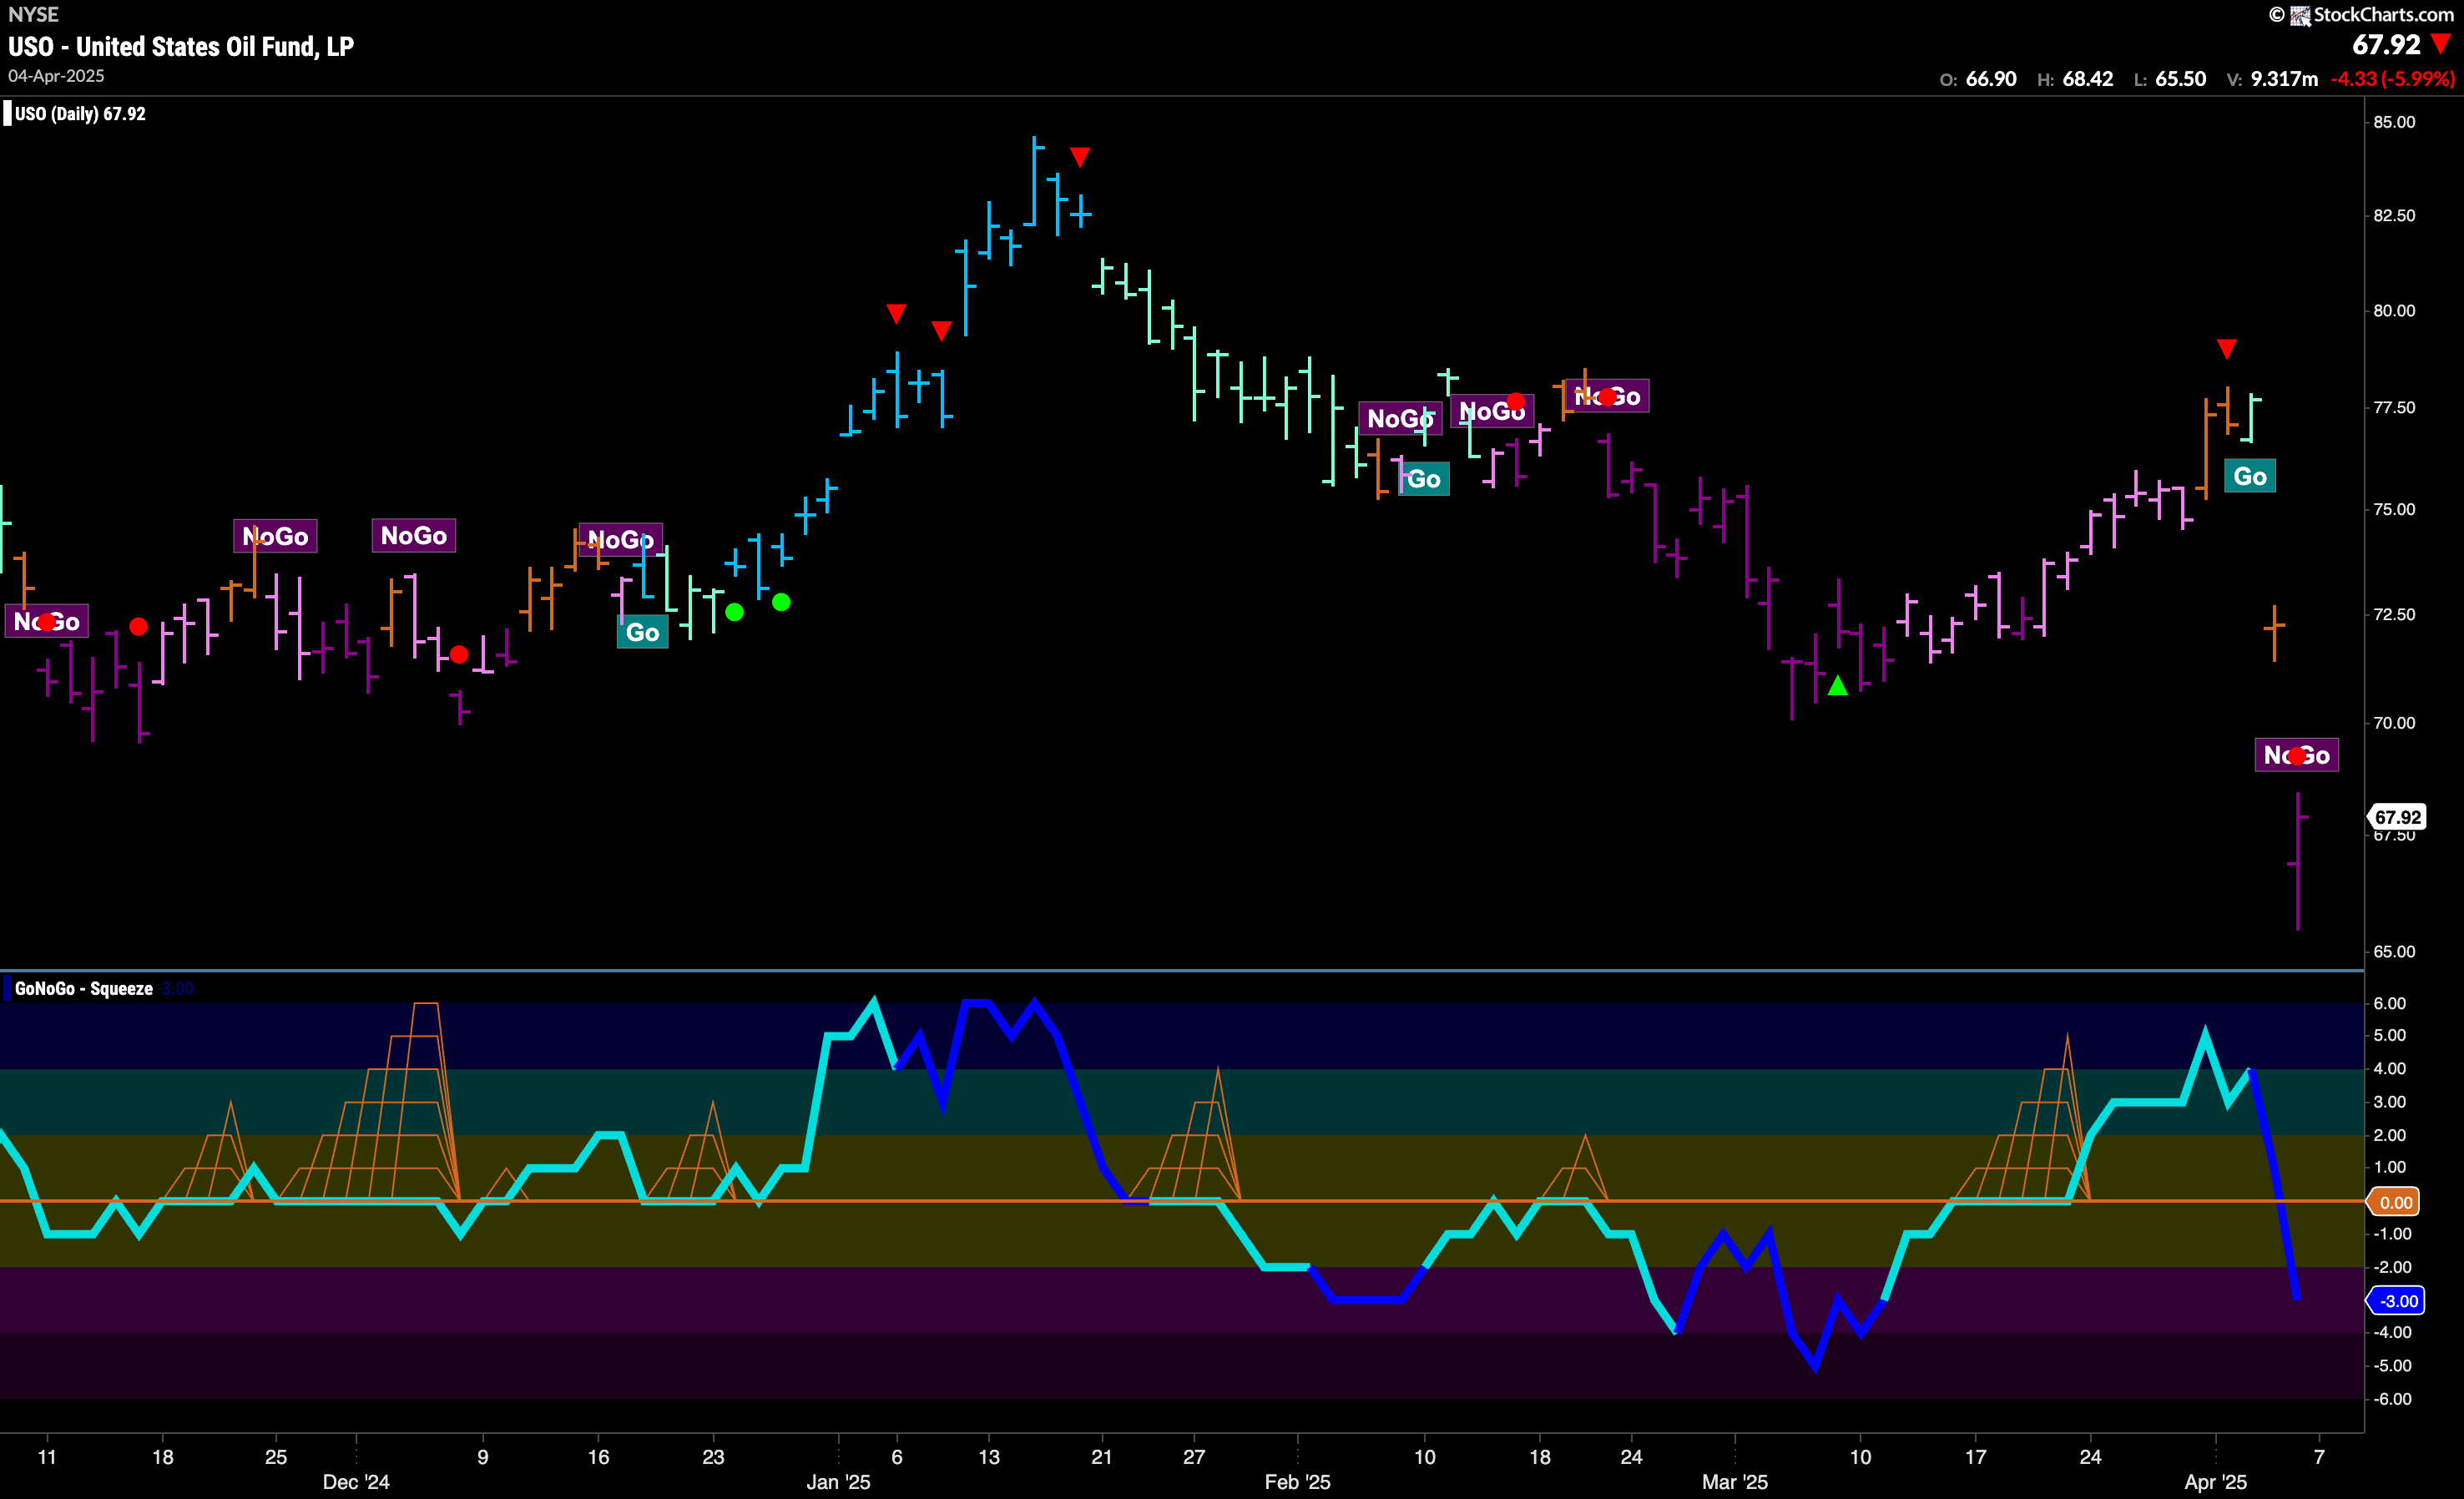
After Some Uncertainty It is a “NoGo” for $USO
The “NoGo” returned in full force at the end of last week as we saw another gap lower and a strong purple bar at new lows. GoNoGo Oscillator which had been in positive territory crashed through the zero line on heavy volume and so now we have momentum confirming the price trend.
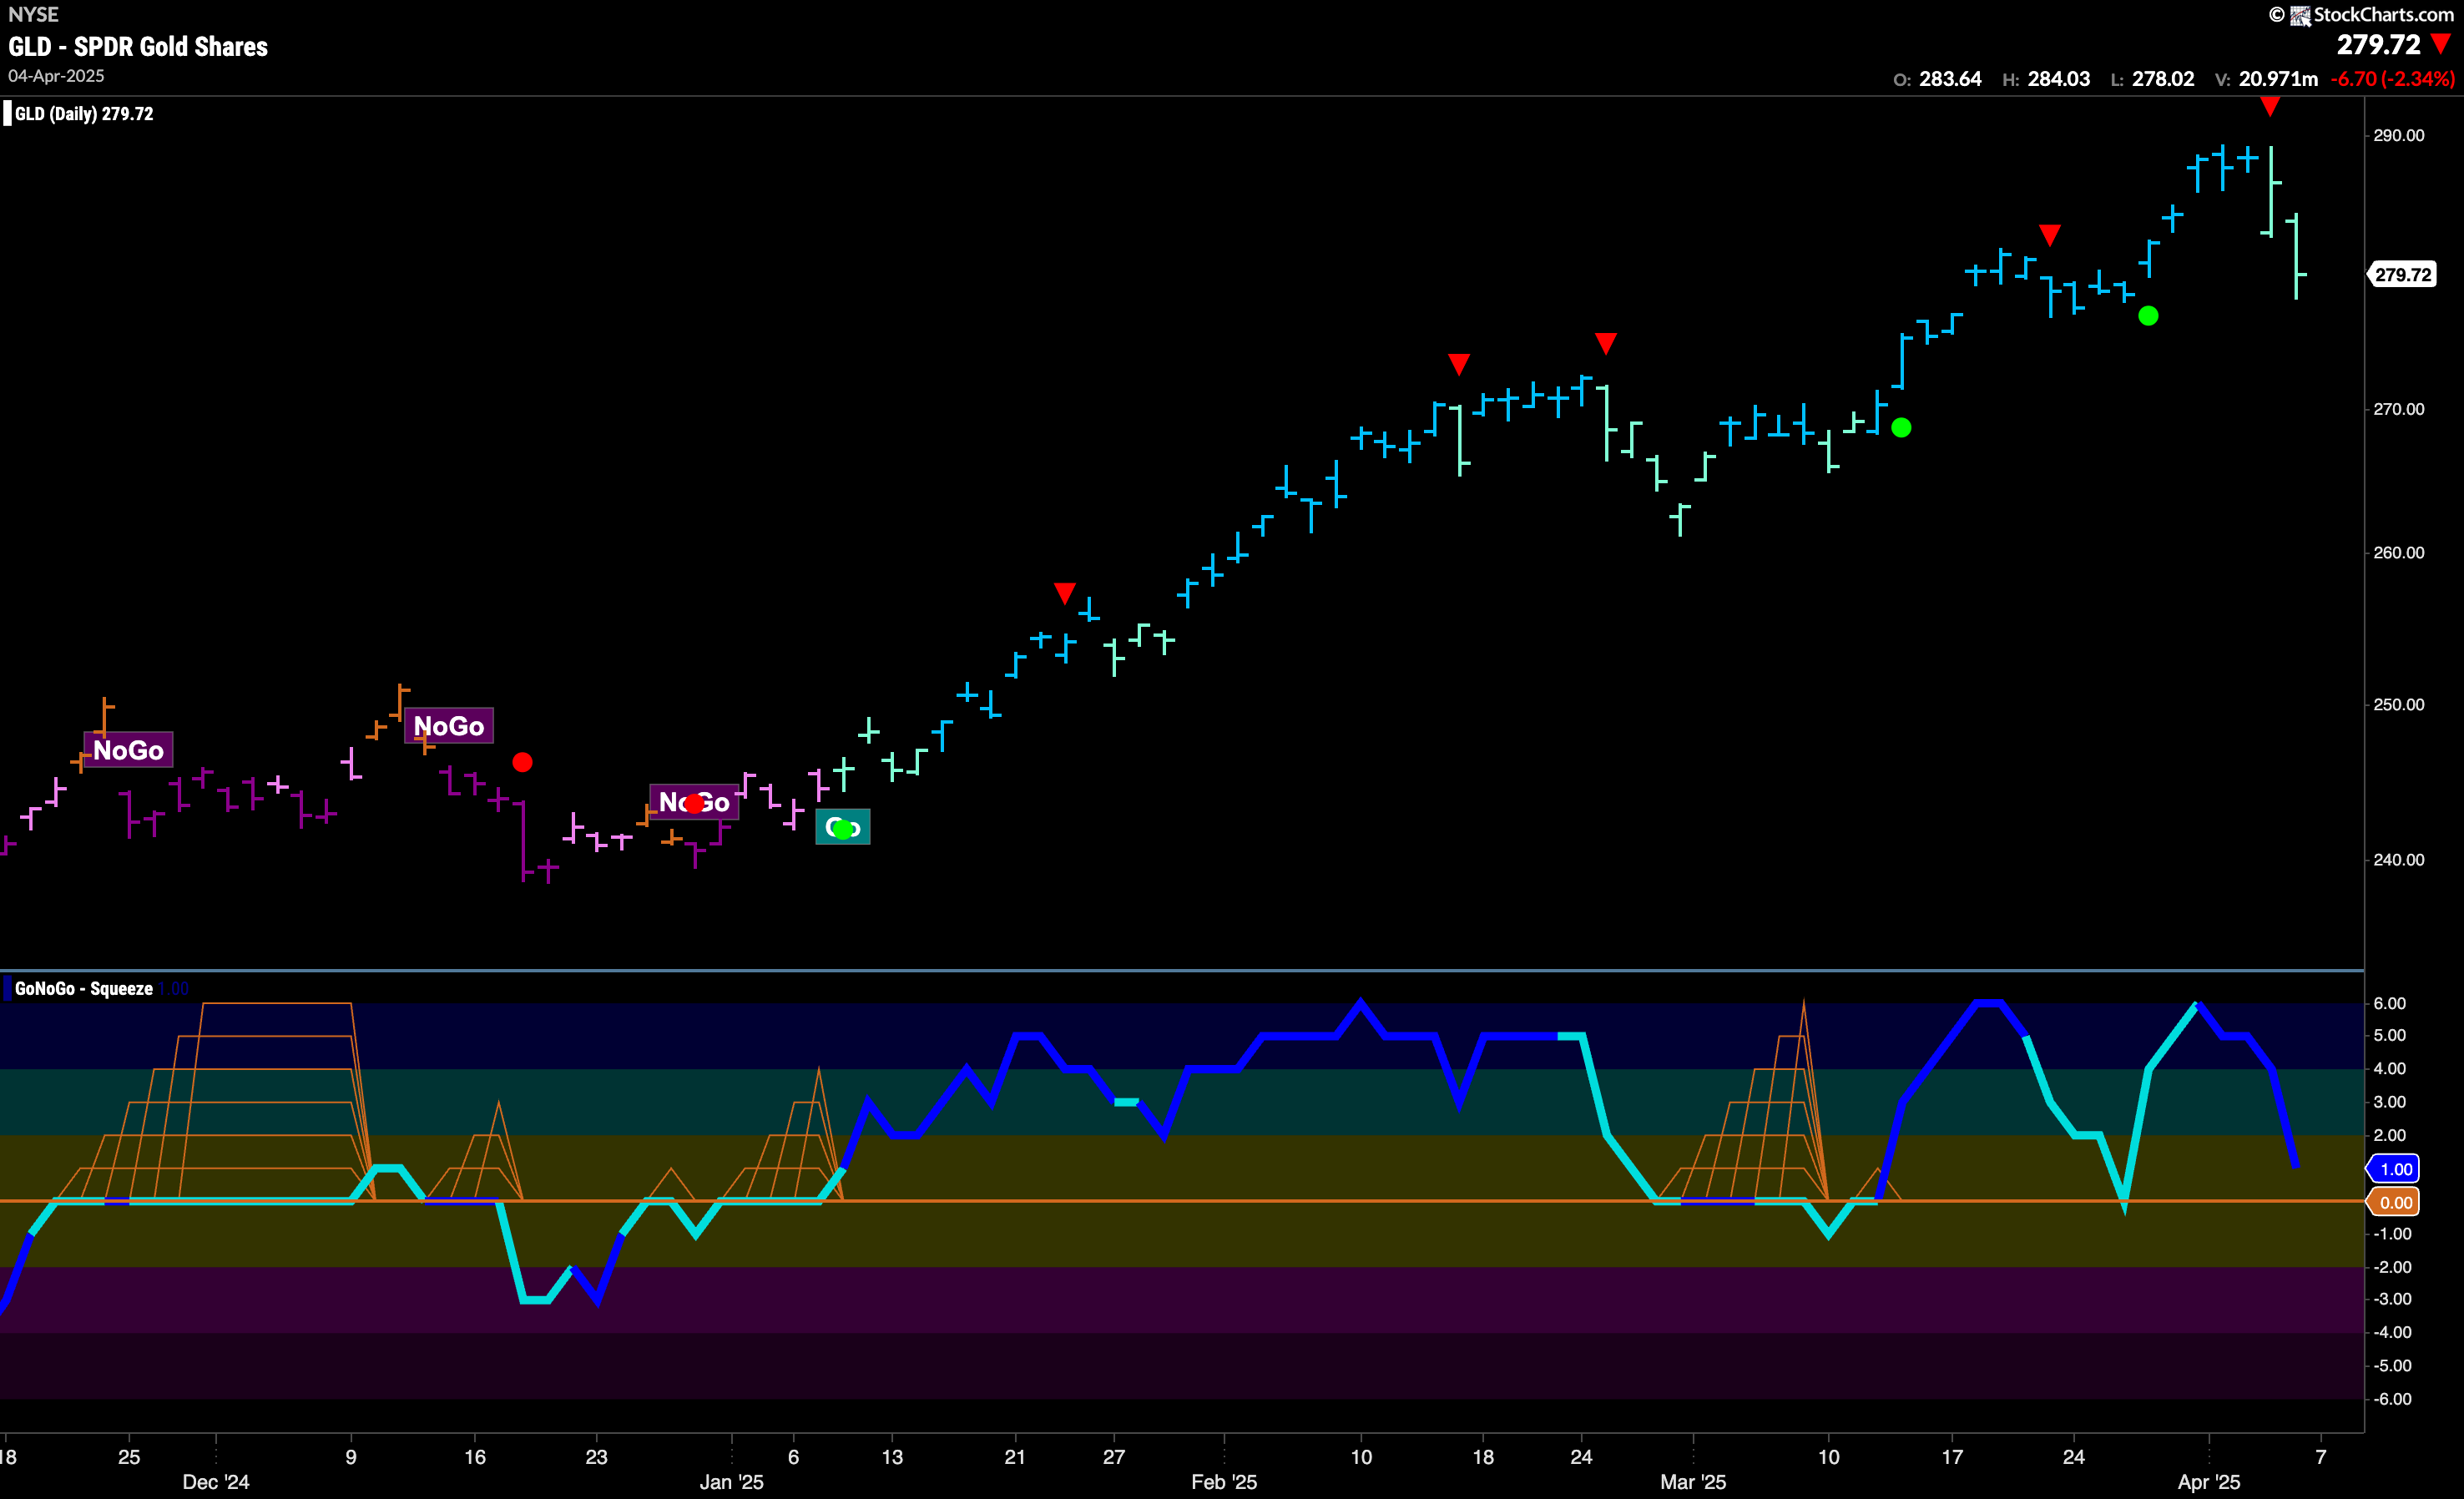
Gold “Go” Trend Sees Weakness
Another week another higher high for gold. But, this time it has been followed by a Go Countertrend Correction Icon (red arrow) and a few weaker aqua “Go” bars. We will watch closely as price entered a natural level of support from the prior low and as GoNoGo Oscillator falls to test the zero line on heavy volume. If the oscillator finds support at zero then we will see signs of Go Trend Continuation.
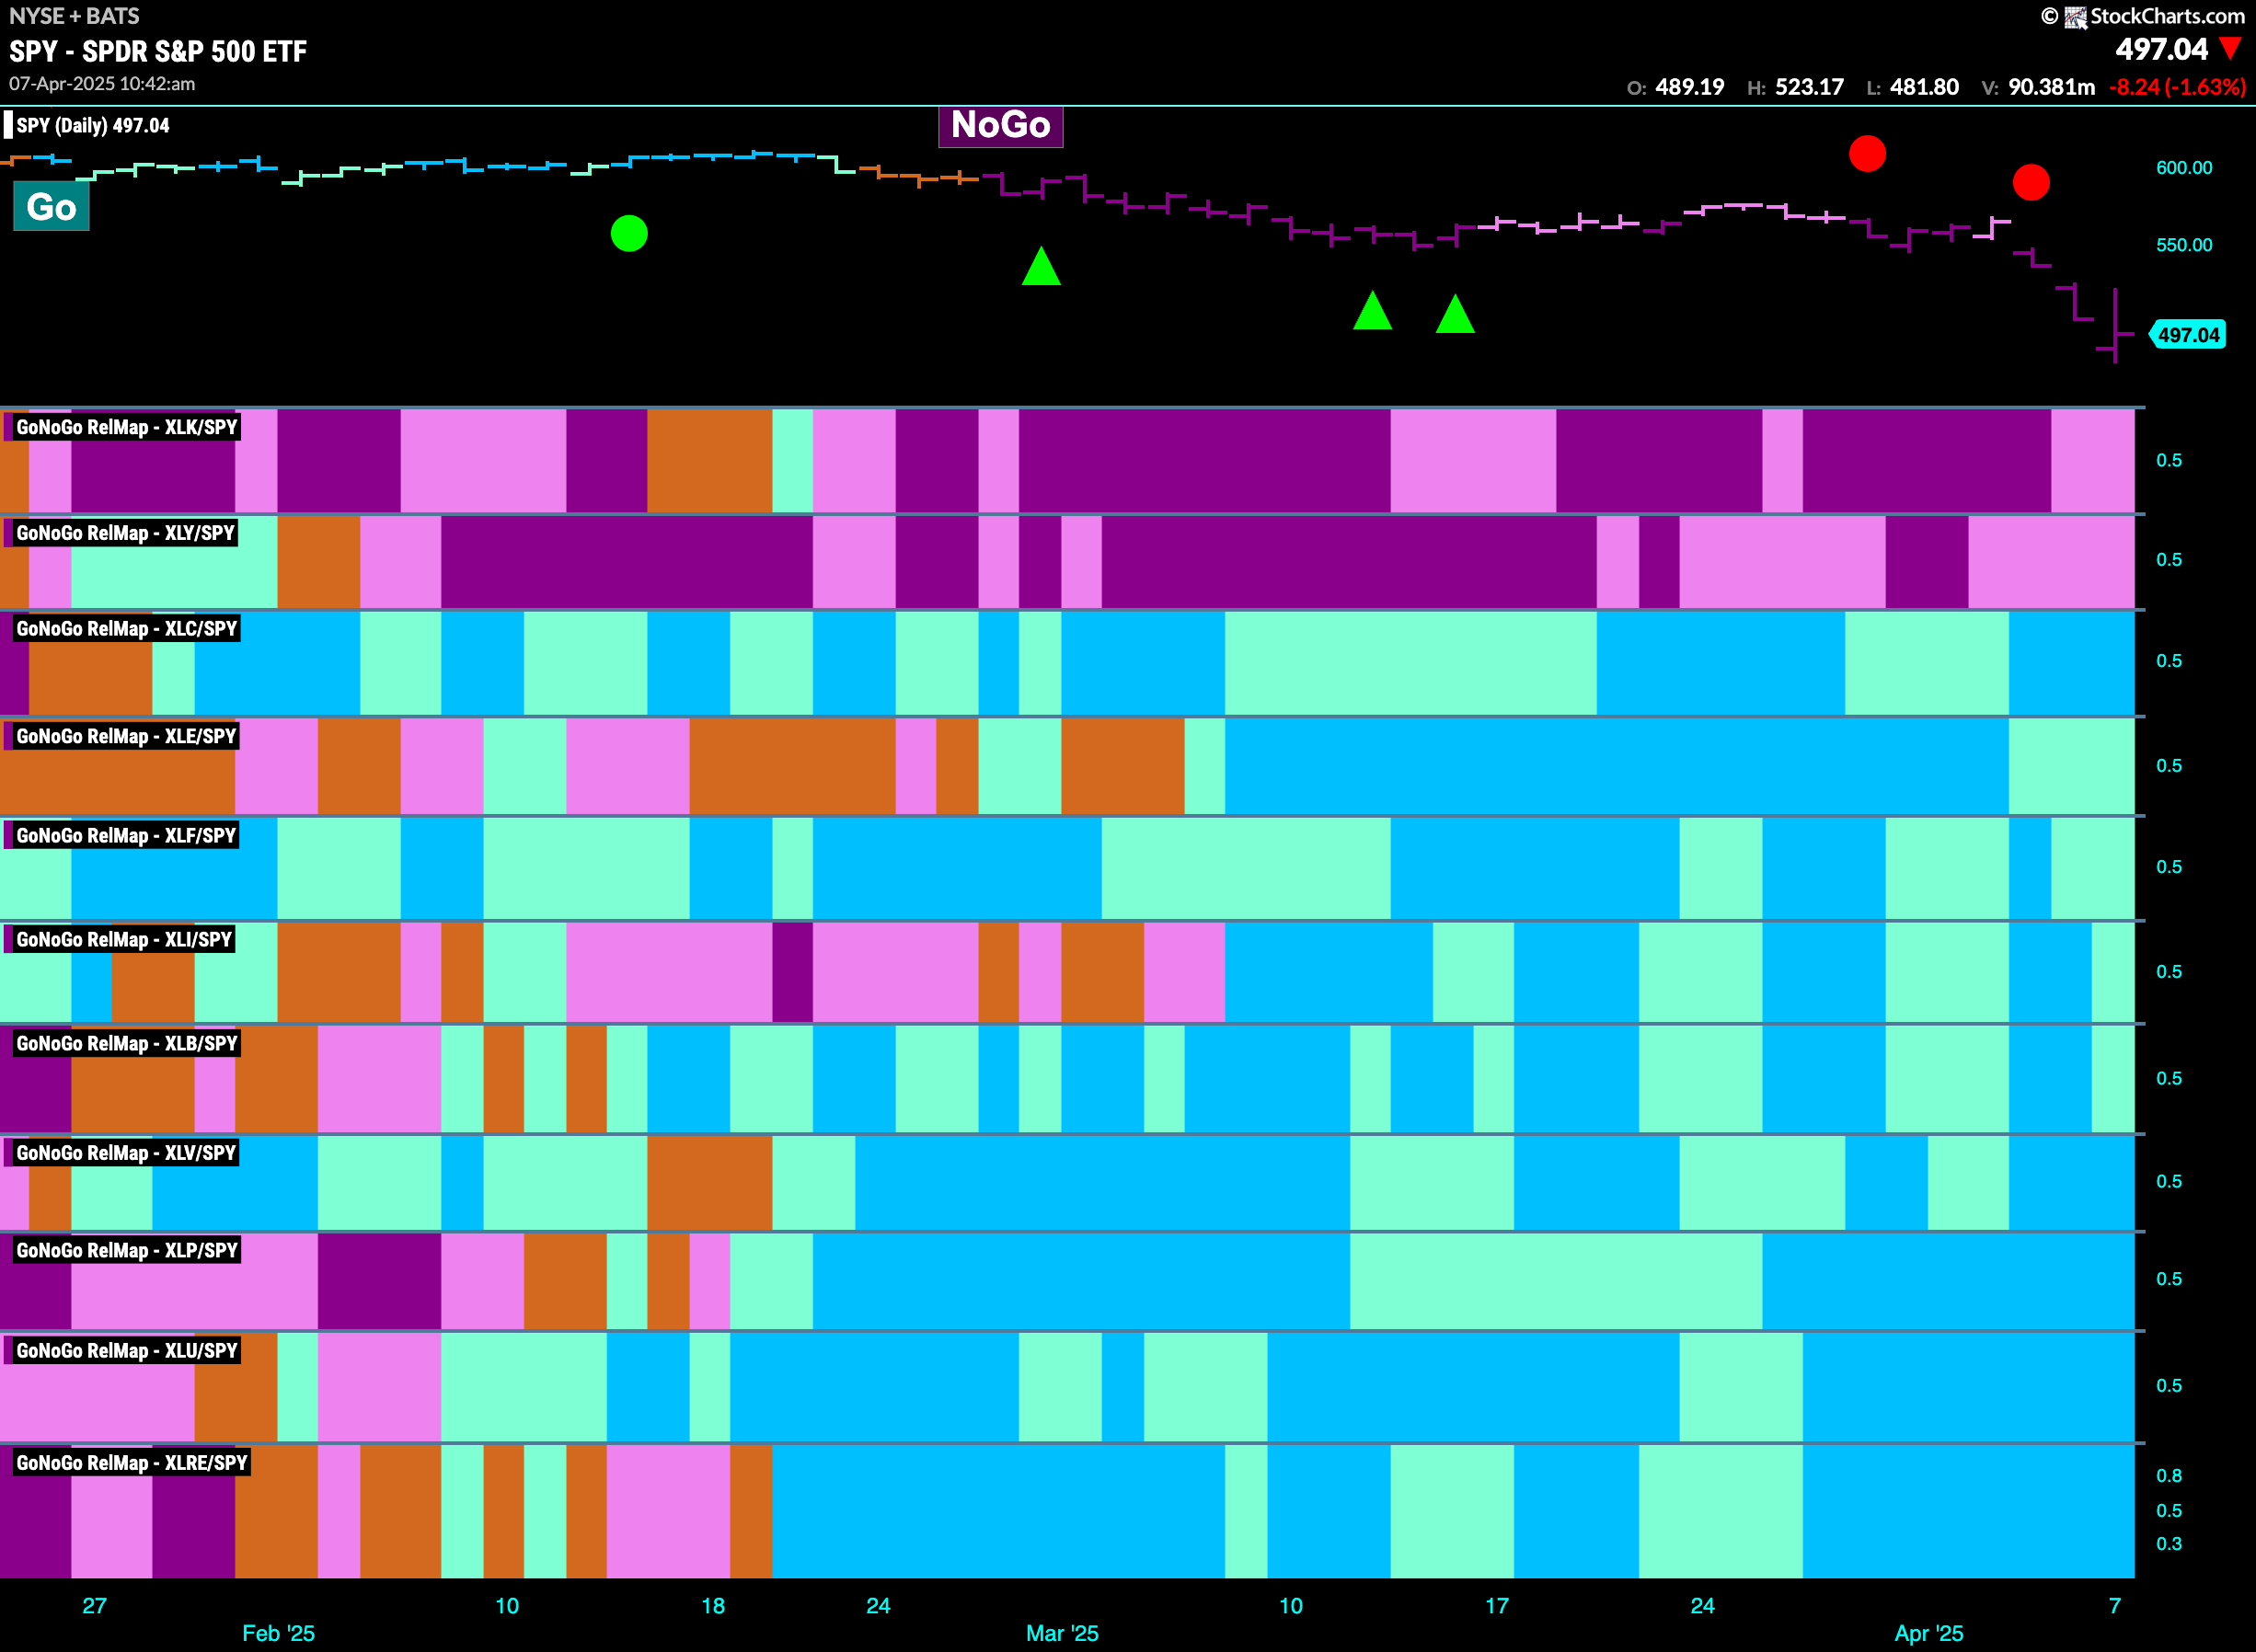
Sector RelMap
Below is the GoNoGo Sector RelMap. This GoNoGo RelMap applies the GoNoGo Trend to the relative strength ratios of the sectors to the base index. With this view we can get a sense of the relative out performance and relative underperformance of the sectors. 9 sectors are in relative “Go” trends. $XLC, $XLE, $XLF, $XLI, $XLB, $XLV, $XLP, $XLU, and $XLRE are painting relative “Go” bars.
Technology Sub-Group RelMap
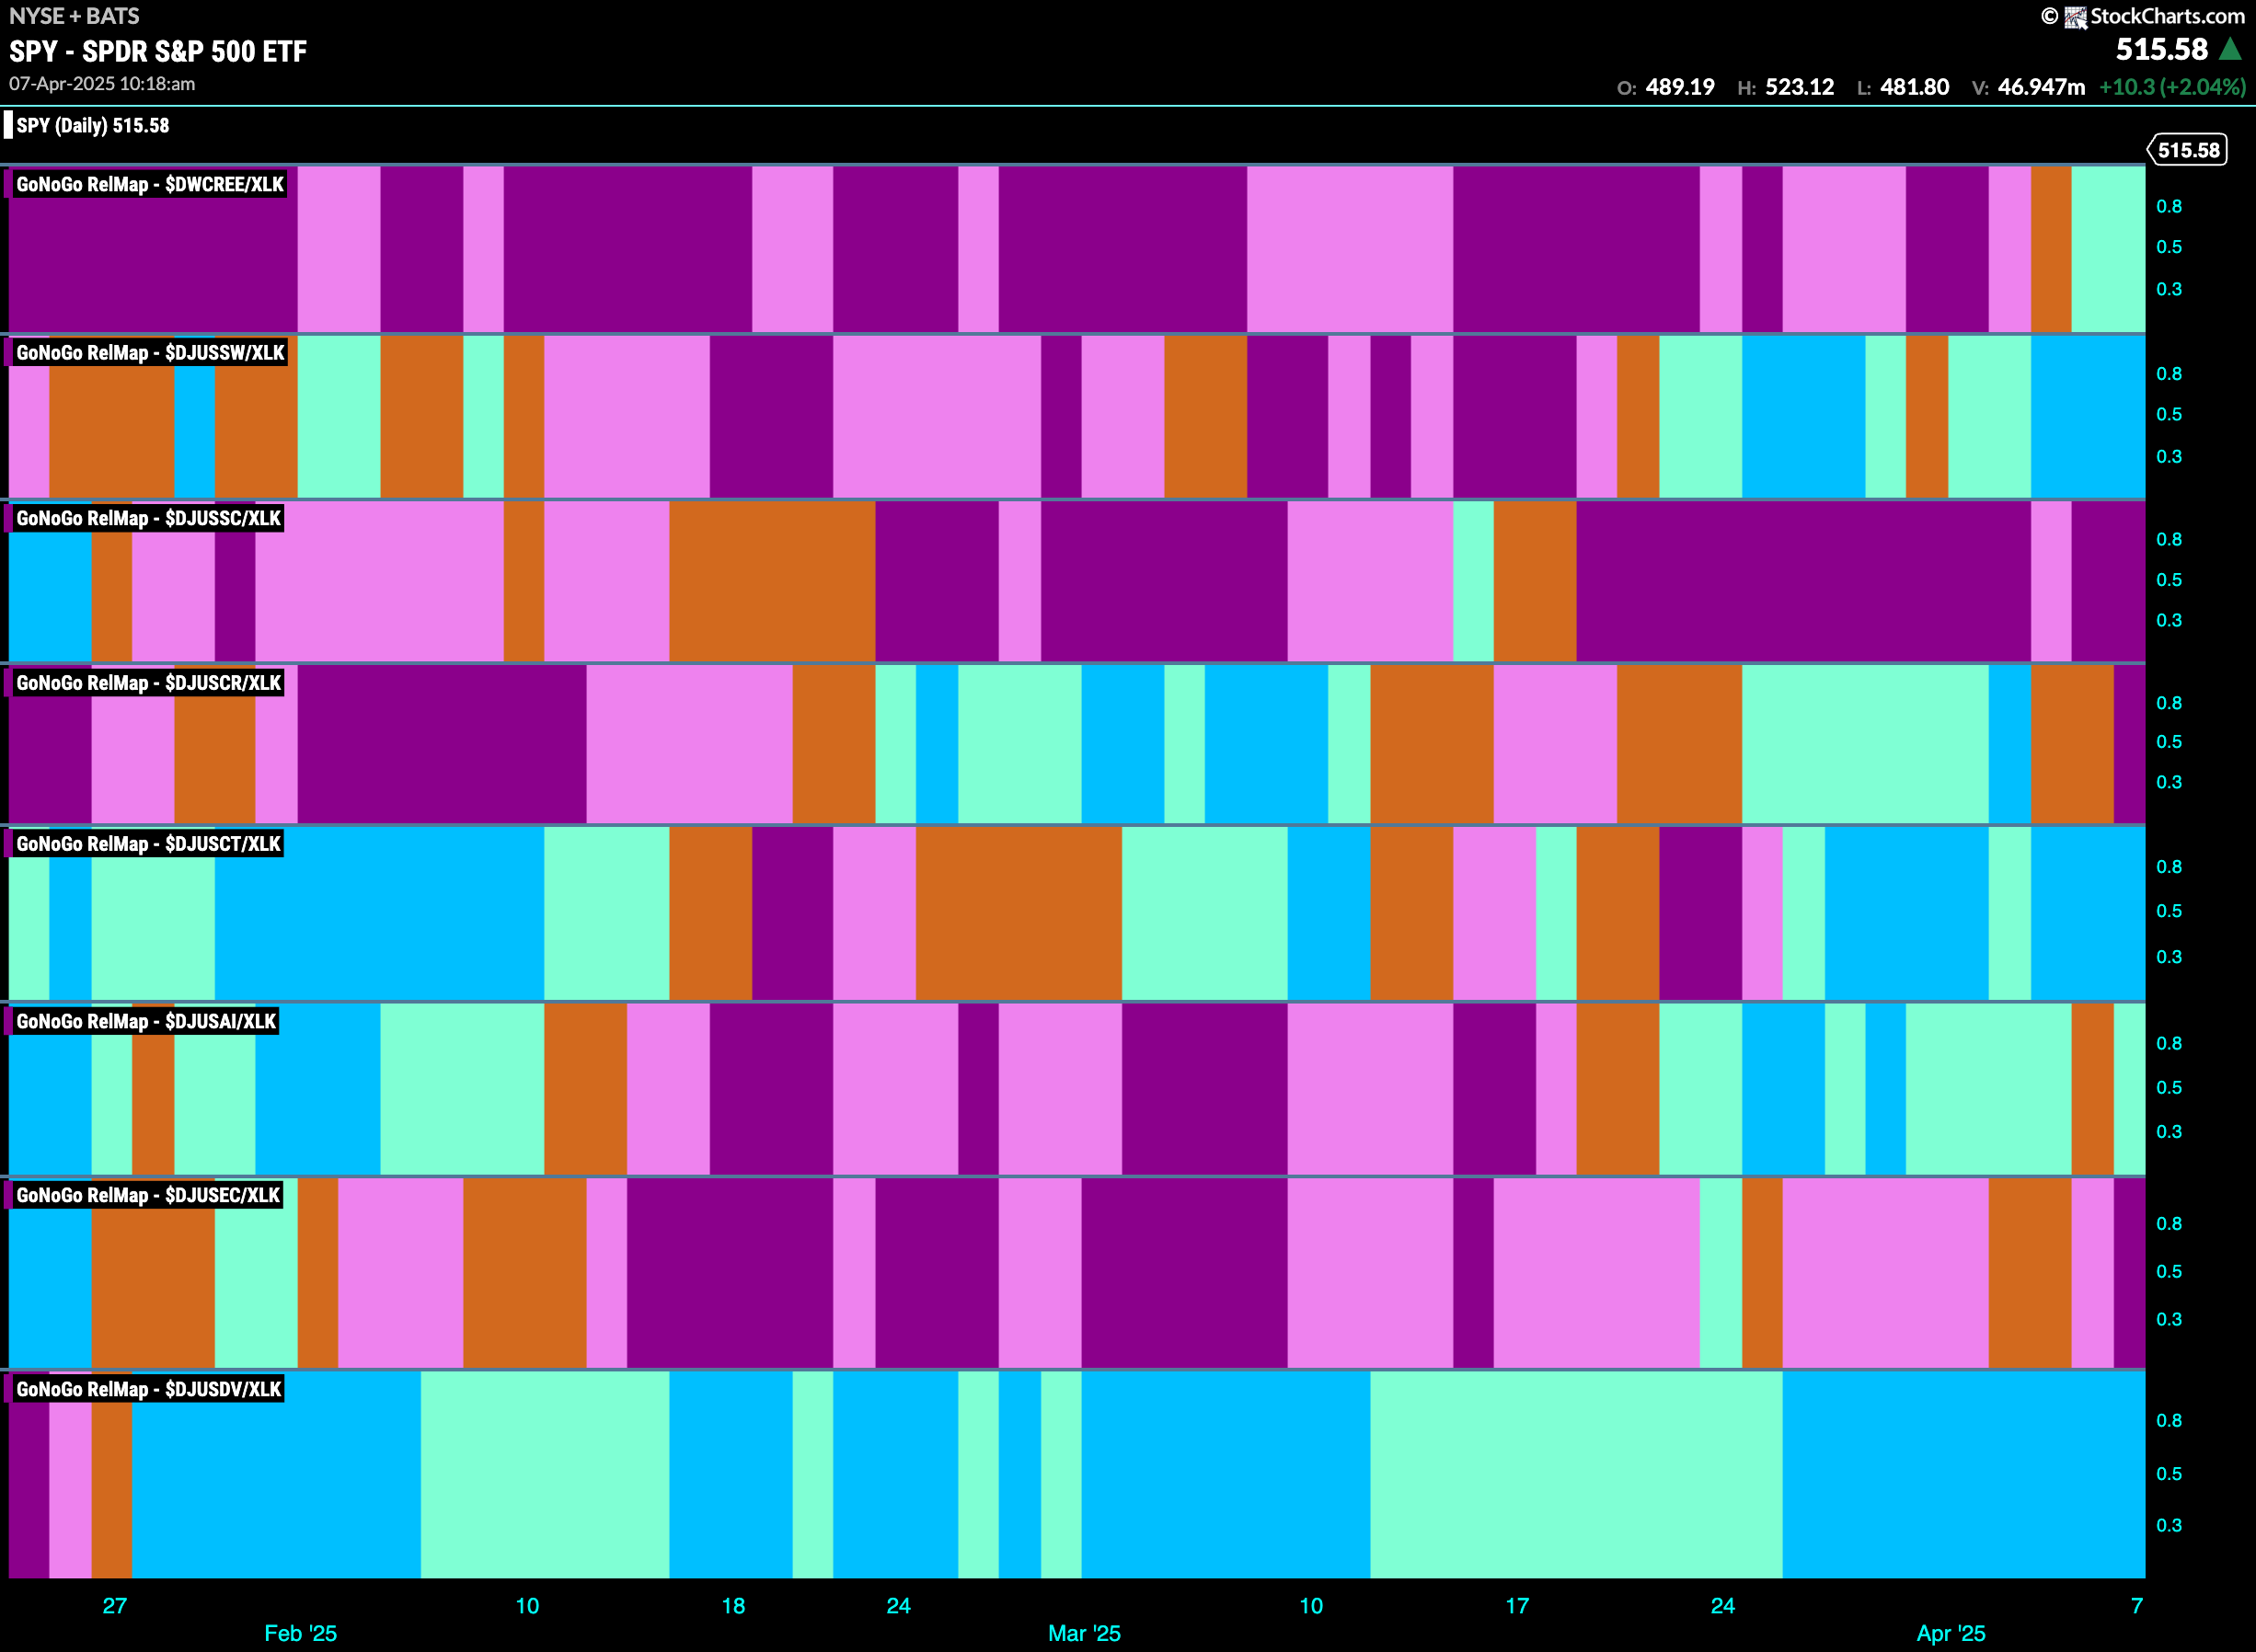
The chart below shows a relative trend breakdown of the sub groups within the tech sector this week. The Sub-Group RelMap plots the GoNoGo Trend of each sub index to the $XLK. We saw in the above GoNoGo Sector RelMap that $XLK is strongly under-performing the base index at the moment with strong purple “NoGo” bars. GoNoGo Trend helps identify both up an down trends and so we look at the below RelMap and can see that in the third panel, the semiconductor index is dragging the index lower with relative “NoGo” bars.
$MRVL Breaks to New Lower Lows
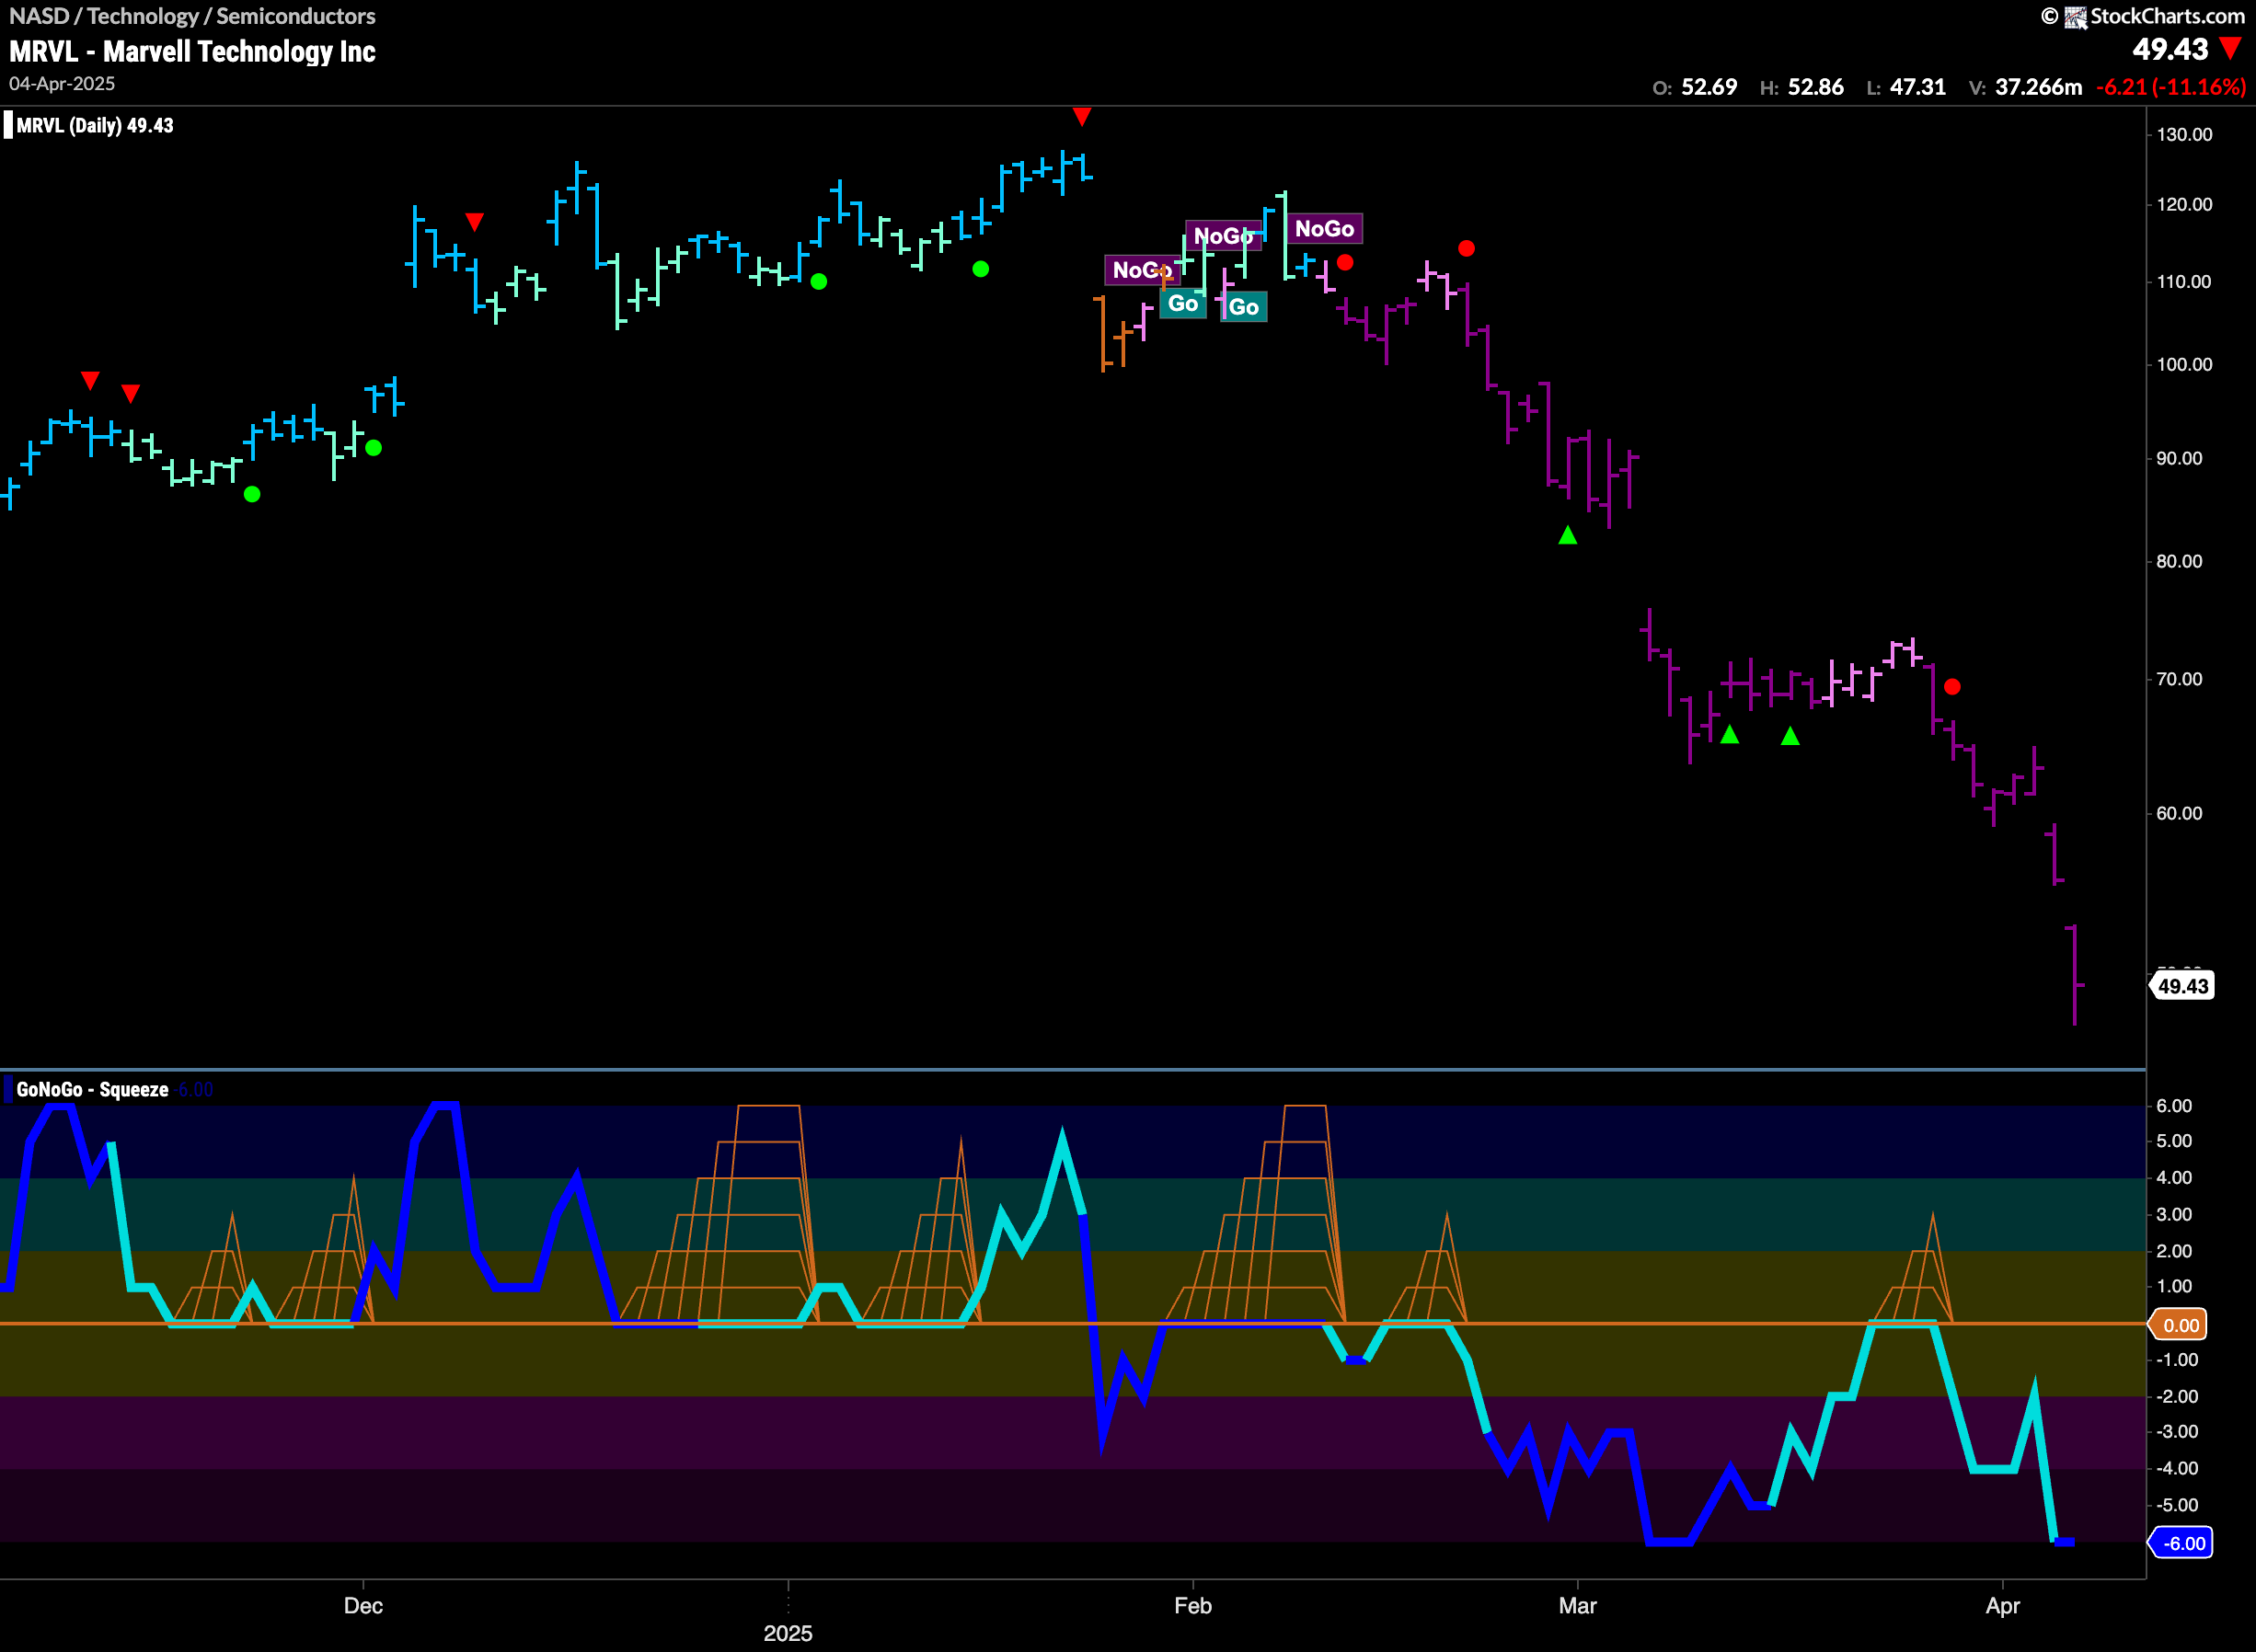
GoNoGo Trend shows that the trend is a strong “NoGo” for $MRVL. We see uninterrupted purple “NoGo” bars as price falls to new lower lows with successive gaps. GoNoGo Oscillator is now in oversold territory and we see volume increasing. We will watch to see if any pause in momentum will allow price to stabilize at these lows.
$AMD Sets New Low with Break of Support
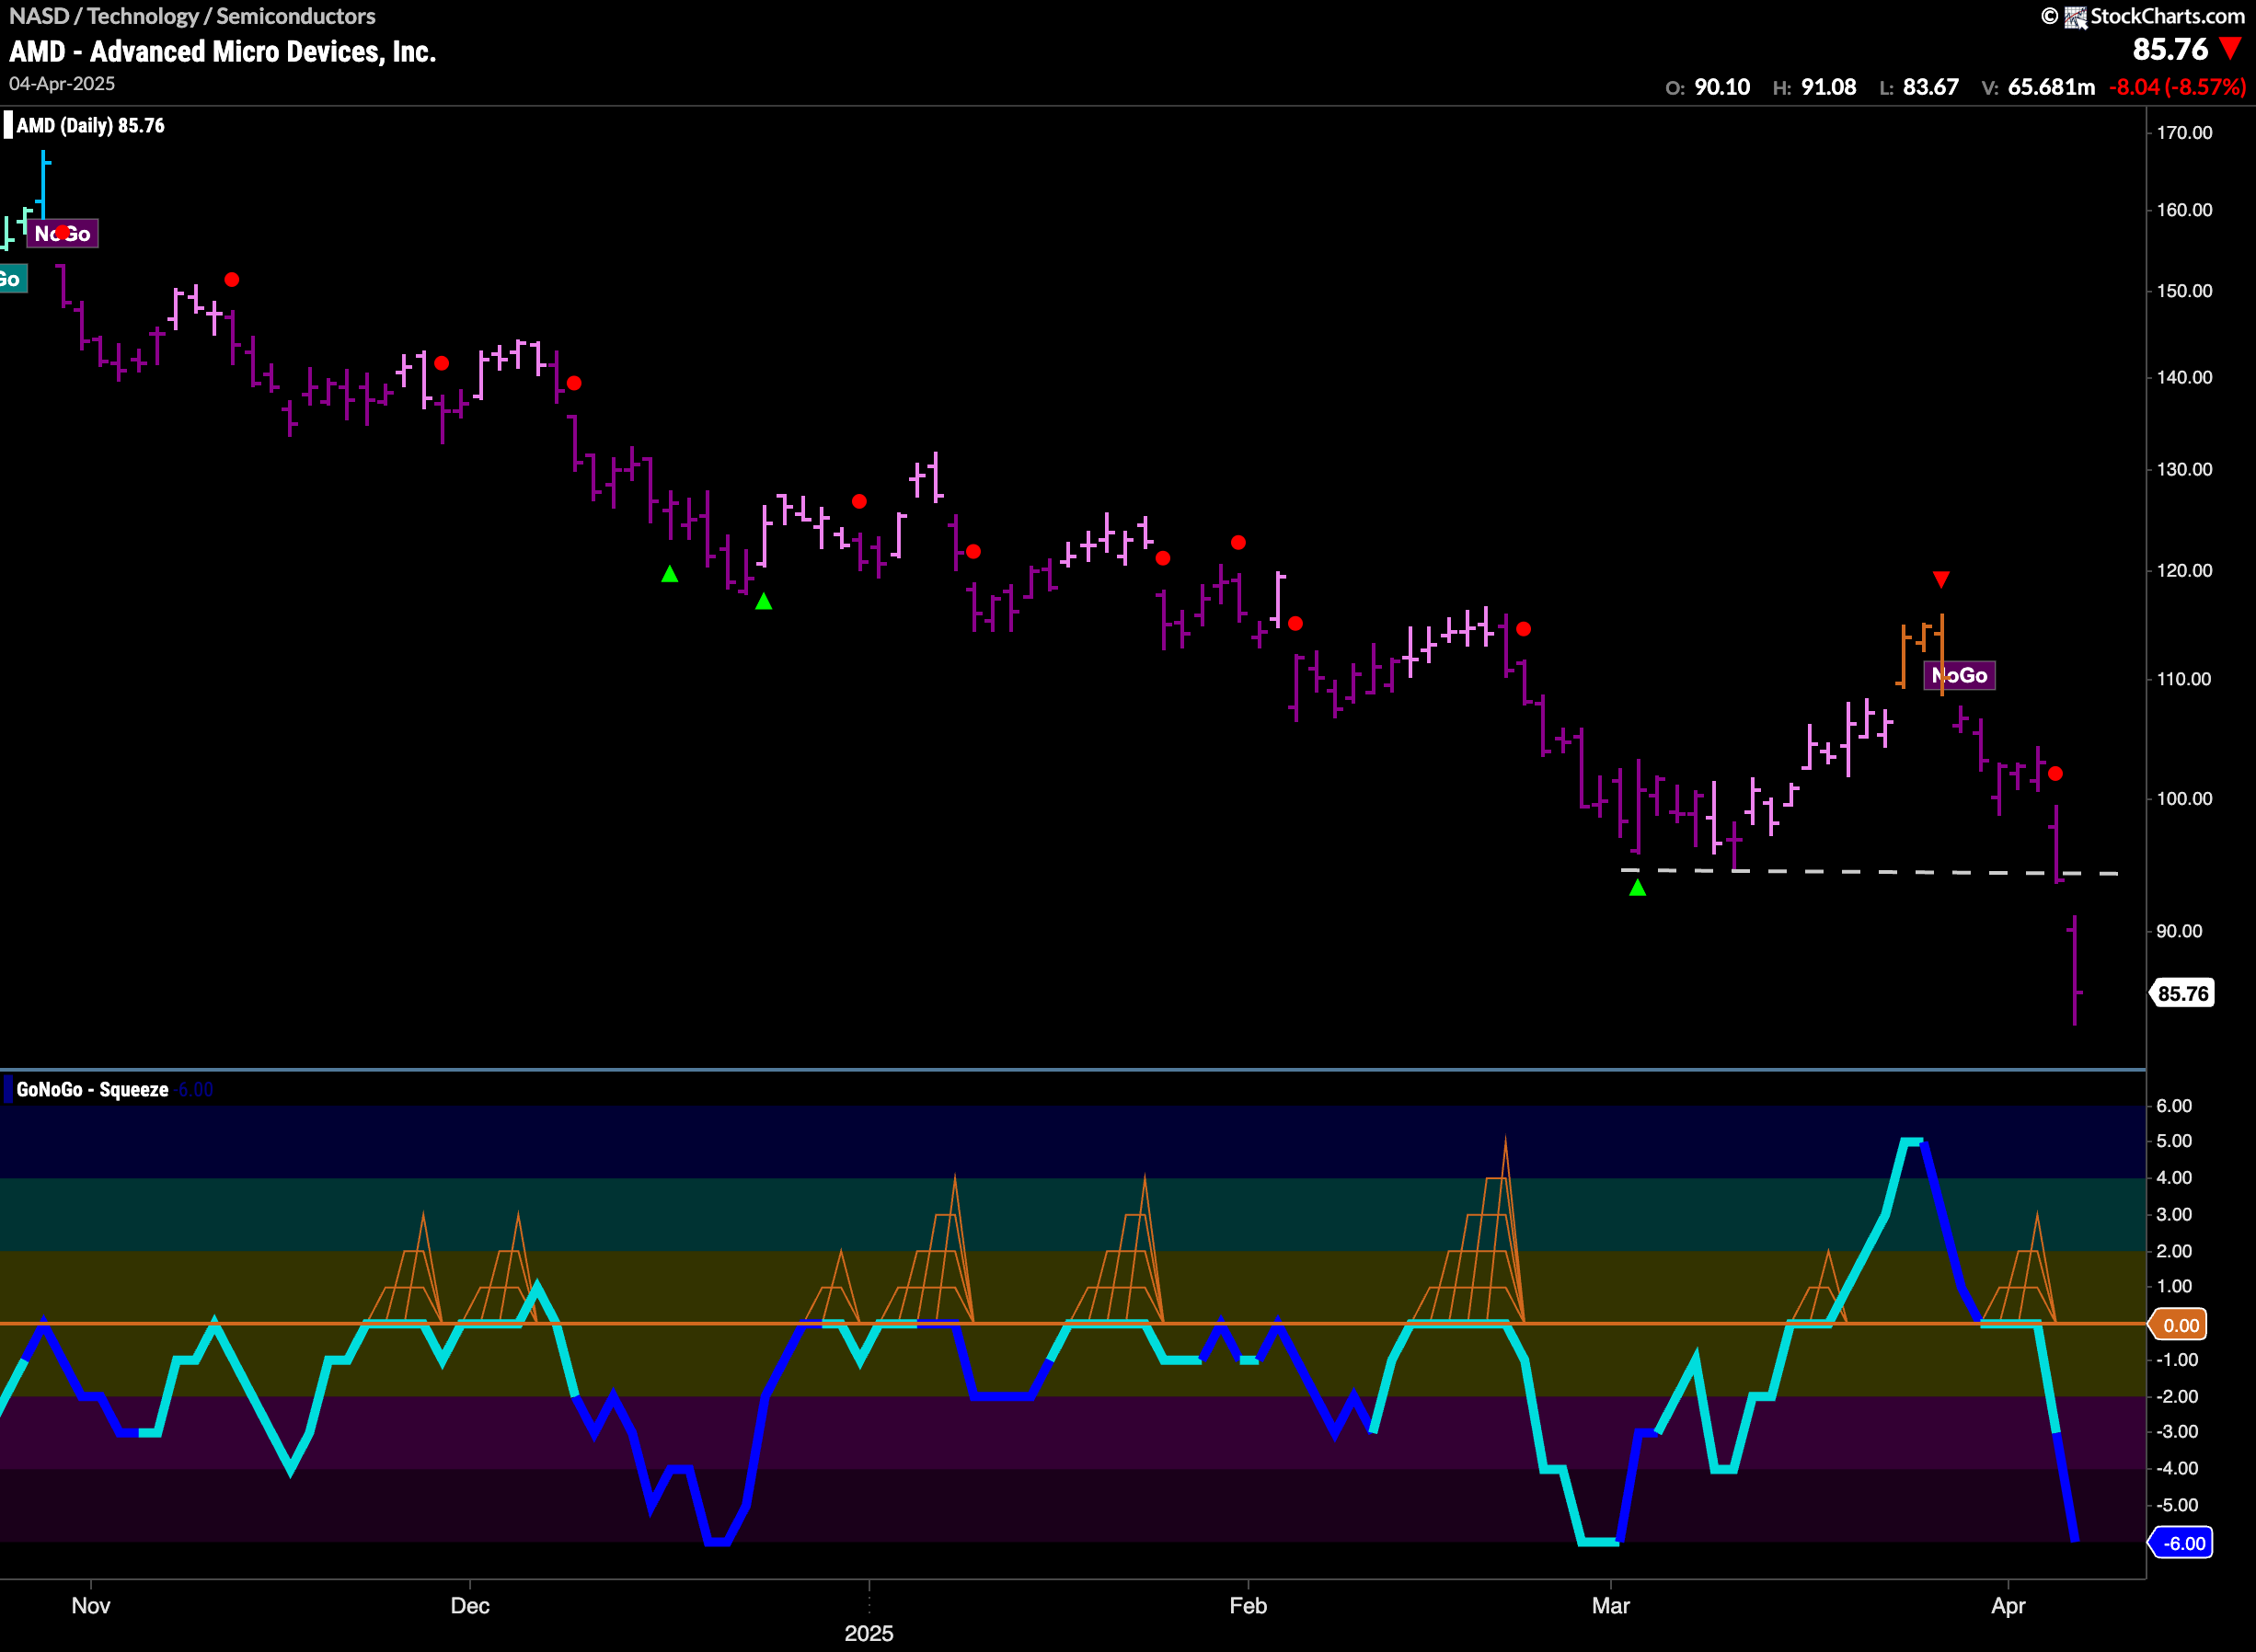
$AMD is in a “NoGo” trend and we have seen a series of lower lows and lower highs. A few weeks ago, the “NoGo” trend was threatened as GoNoGo Trend painted a few amber “Go Fish” bars of uncertainty and GoNoGo Oscillator jumped into positive territory. This was short-lived, and we now see NoGo Trend Continuation (red circle) as momentum is resurgent in the direction of the “NoGo” trend and price breaks through support to new lows.
