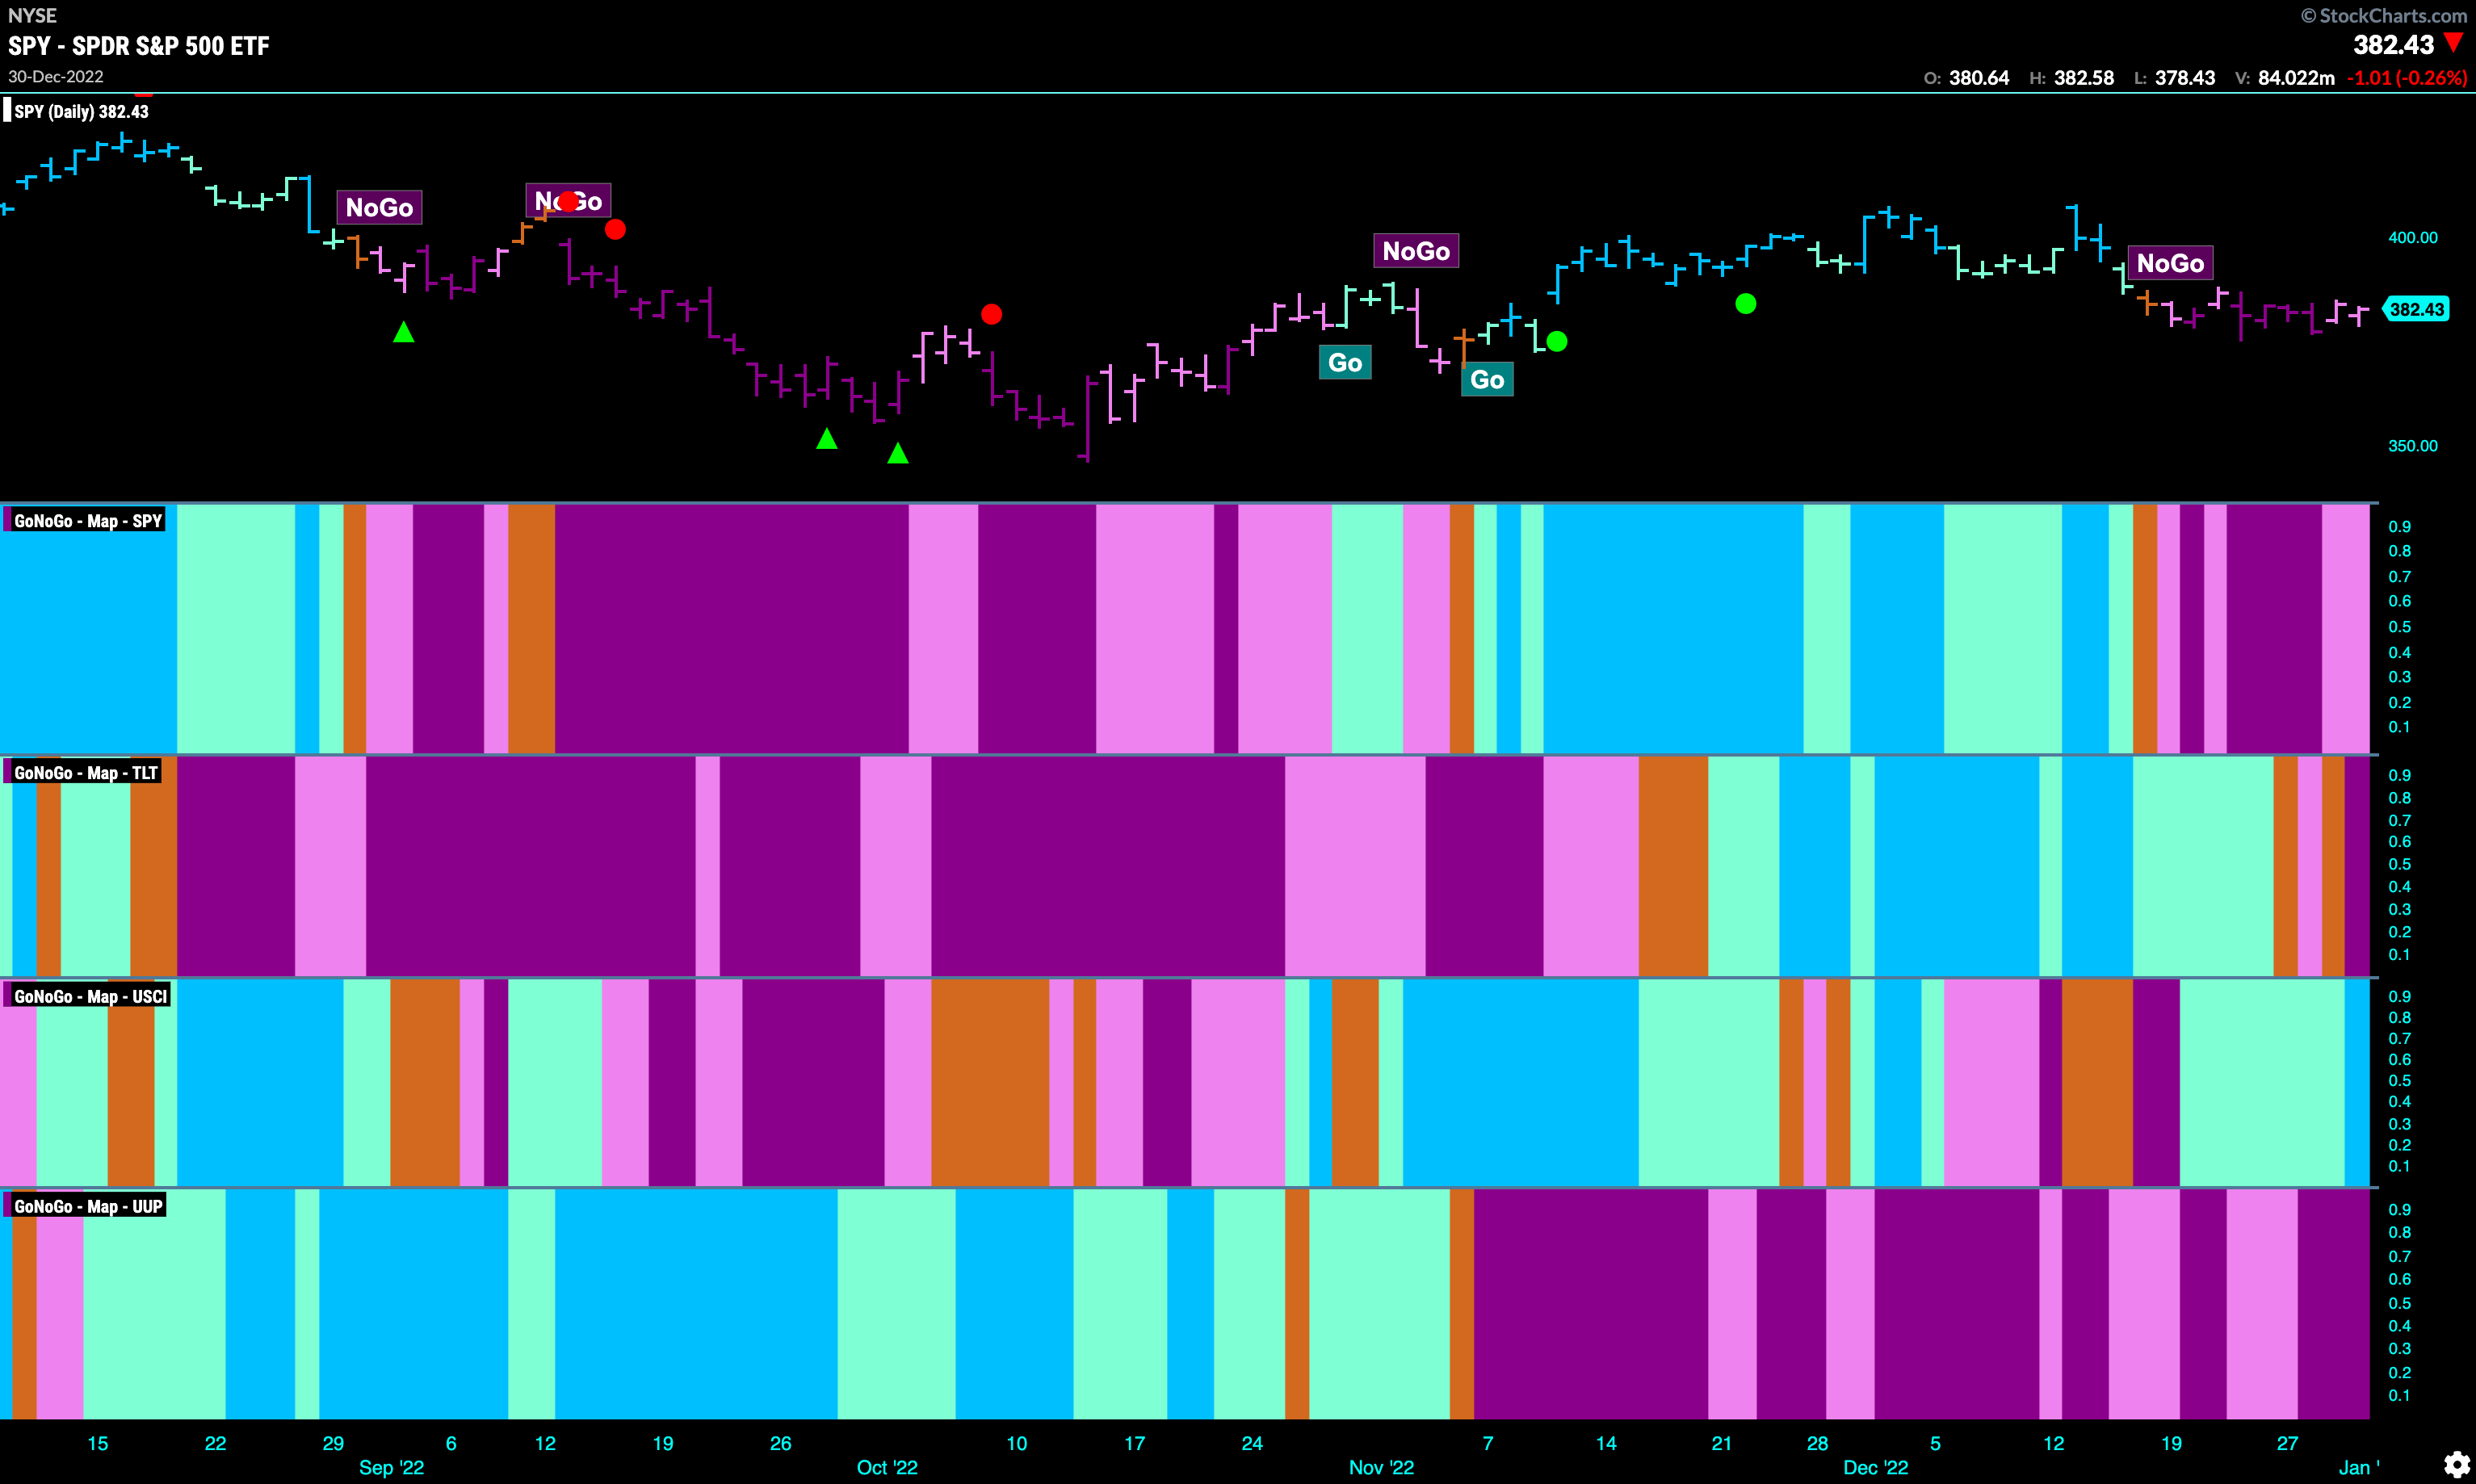
Good morning and welcome to this week’s Flight Path. Let’s take a look at the GoNoGo Asset map below. The “NoGo” continues is U.S. equities but we do see some weaker pink bars as the week ends. Of note is the return to ‘NoGo” bars in treasury bond prices. The foray into a “Go” trend was short. Commodities have managed to stay in a “Go” trend this week and in fact saw some increased strength as the week ended with a strong blue “Go” bar. The dollar remains embroiled in a strong “NoGo” as purple bars remain predominant.
No Santa Rally in U.S. Equities?
Mostly flat since entering this current “NoGo” trend, $SPY shows little signs of a Santa Rally. The Santa rally is the tendency the market has to rally the last five days of the year and the first couple of the next. Statistically, when this doesn’t happen it is more likely we’ll see a weaker January and indeed whole year. GoNoGo Trend is painting weak pink bars and GoNoGo Oscillator is in negative territory but not oversold. 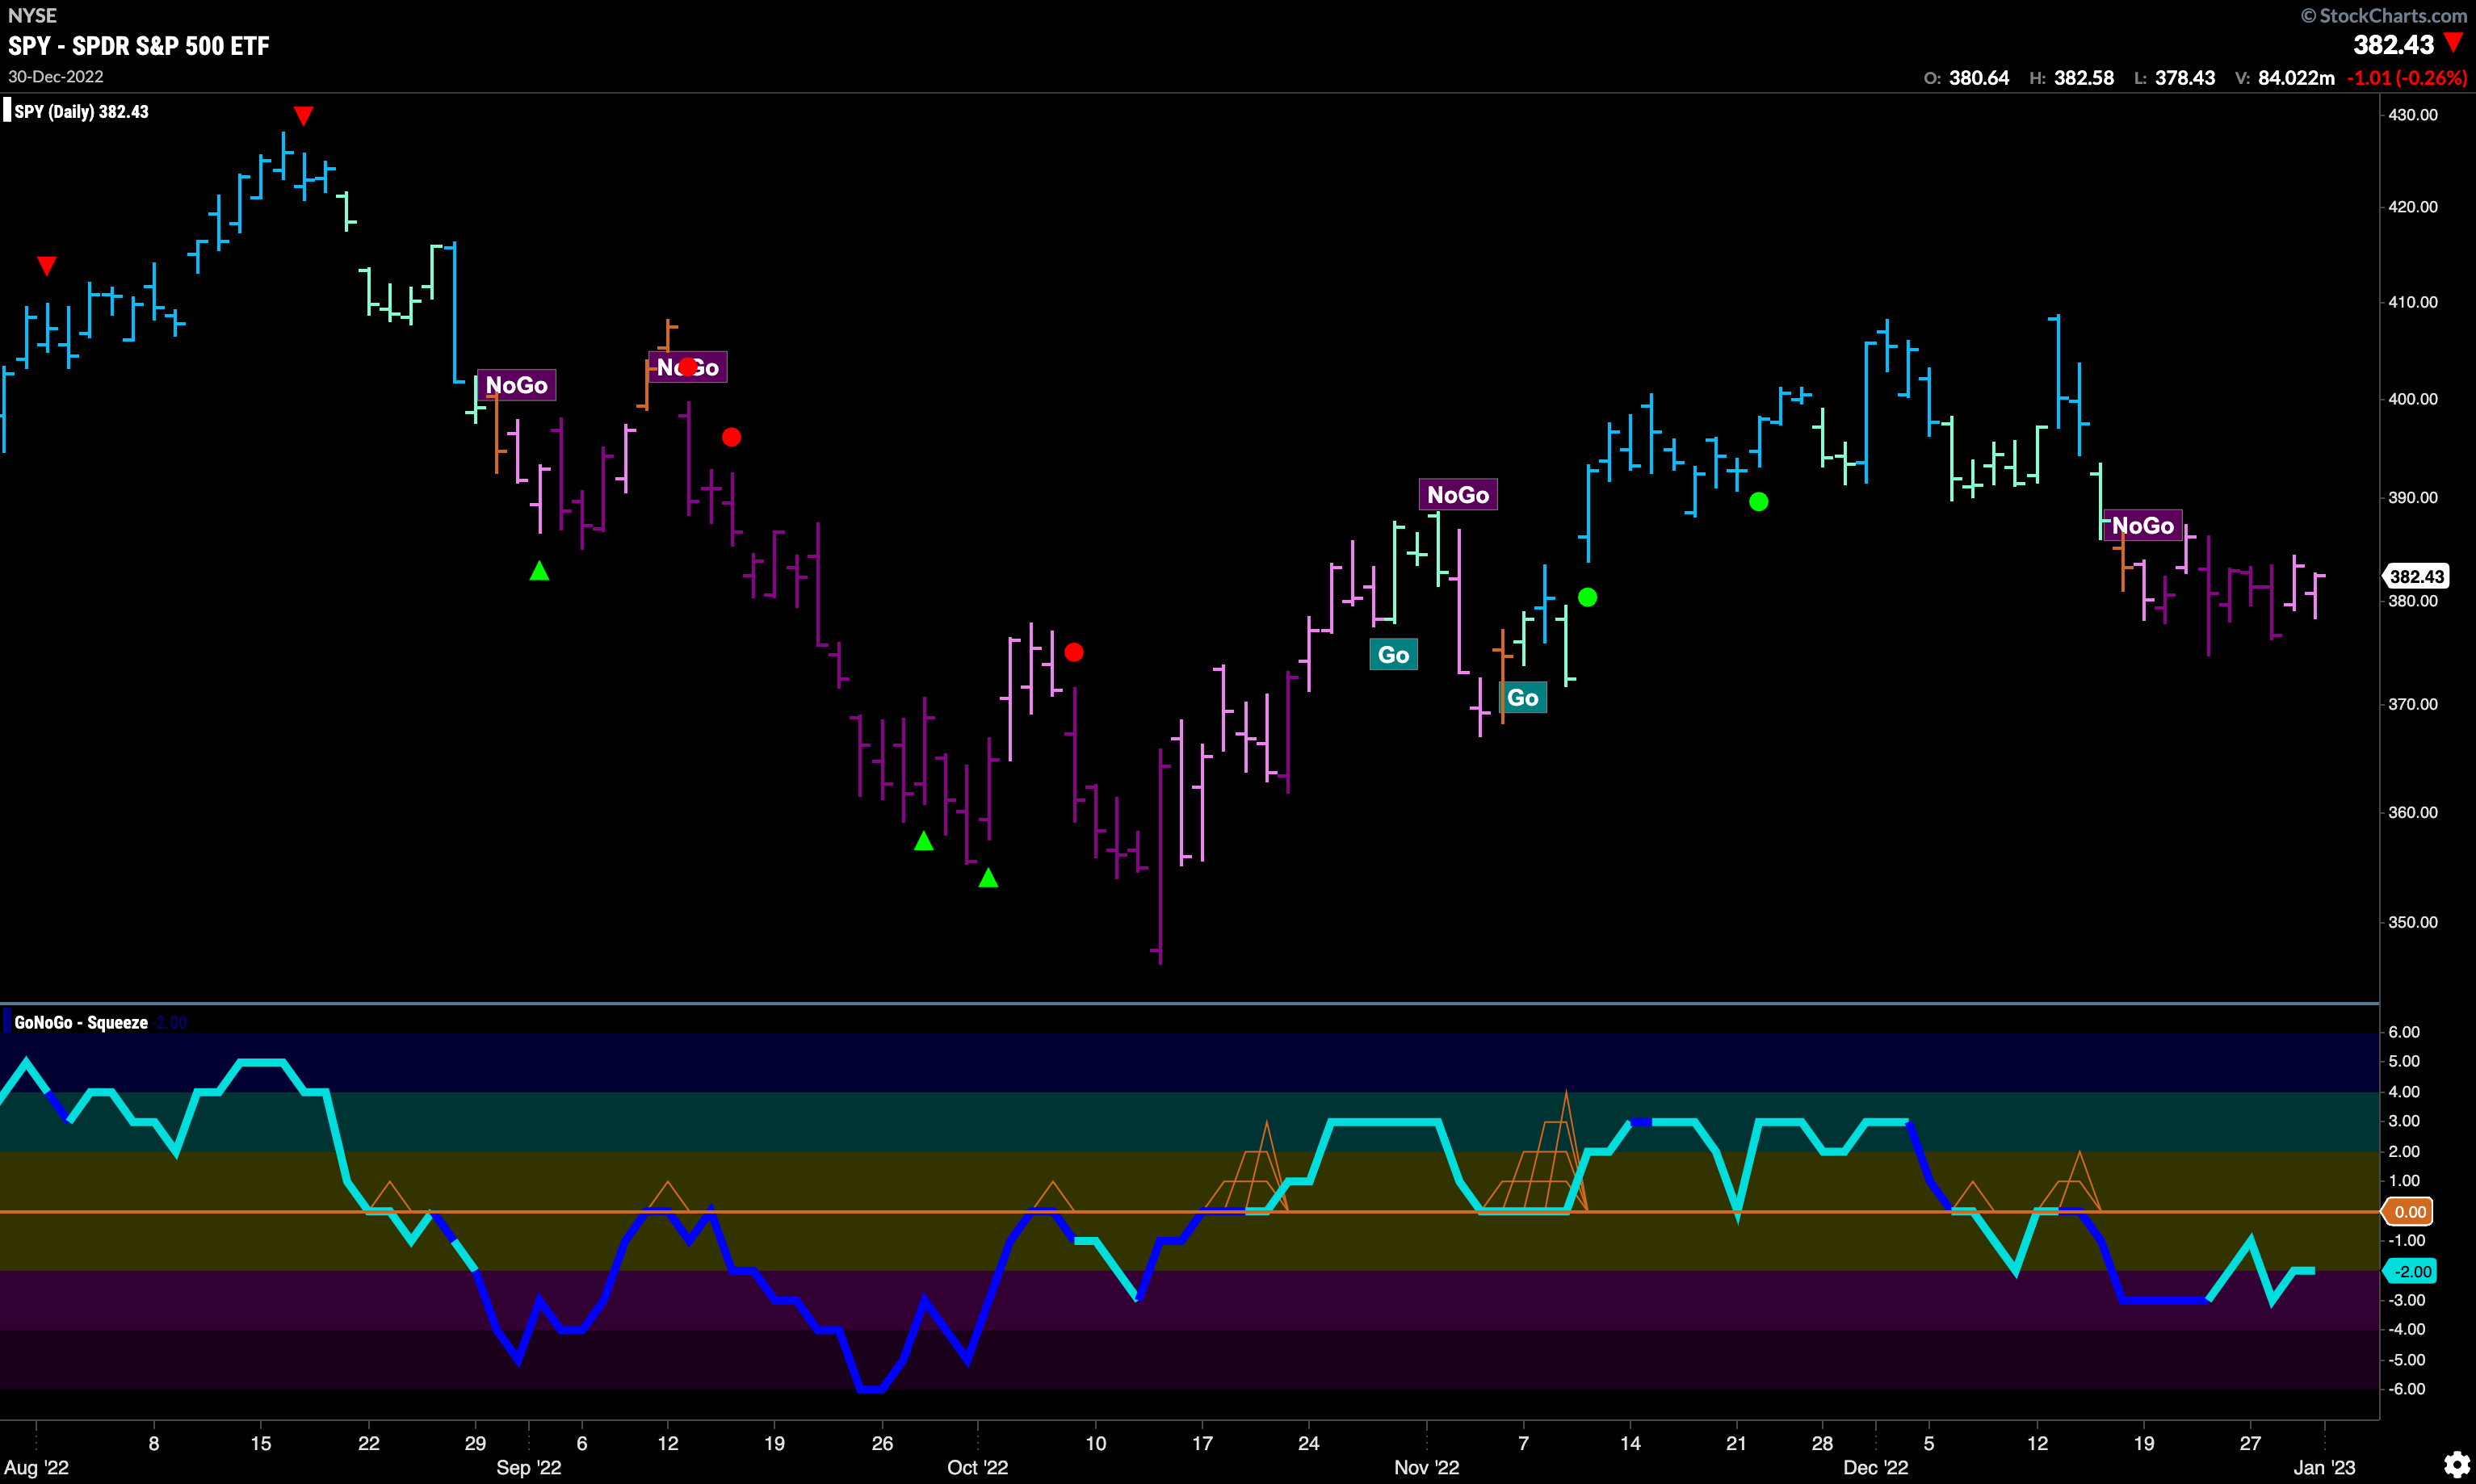
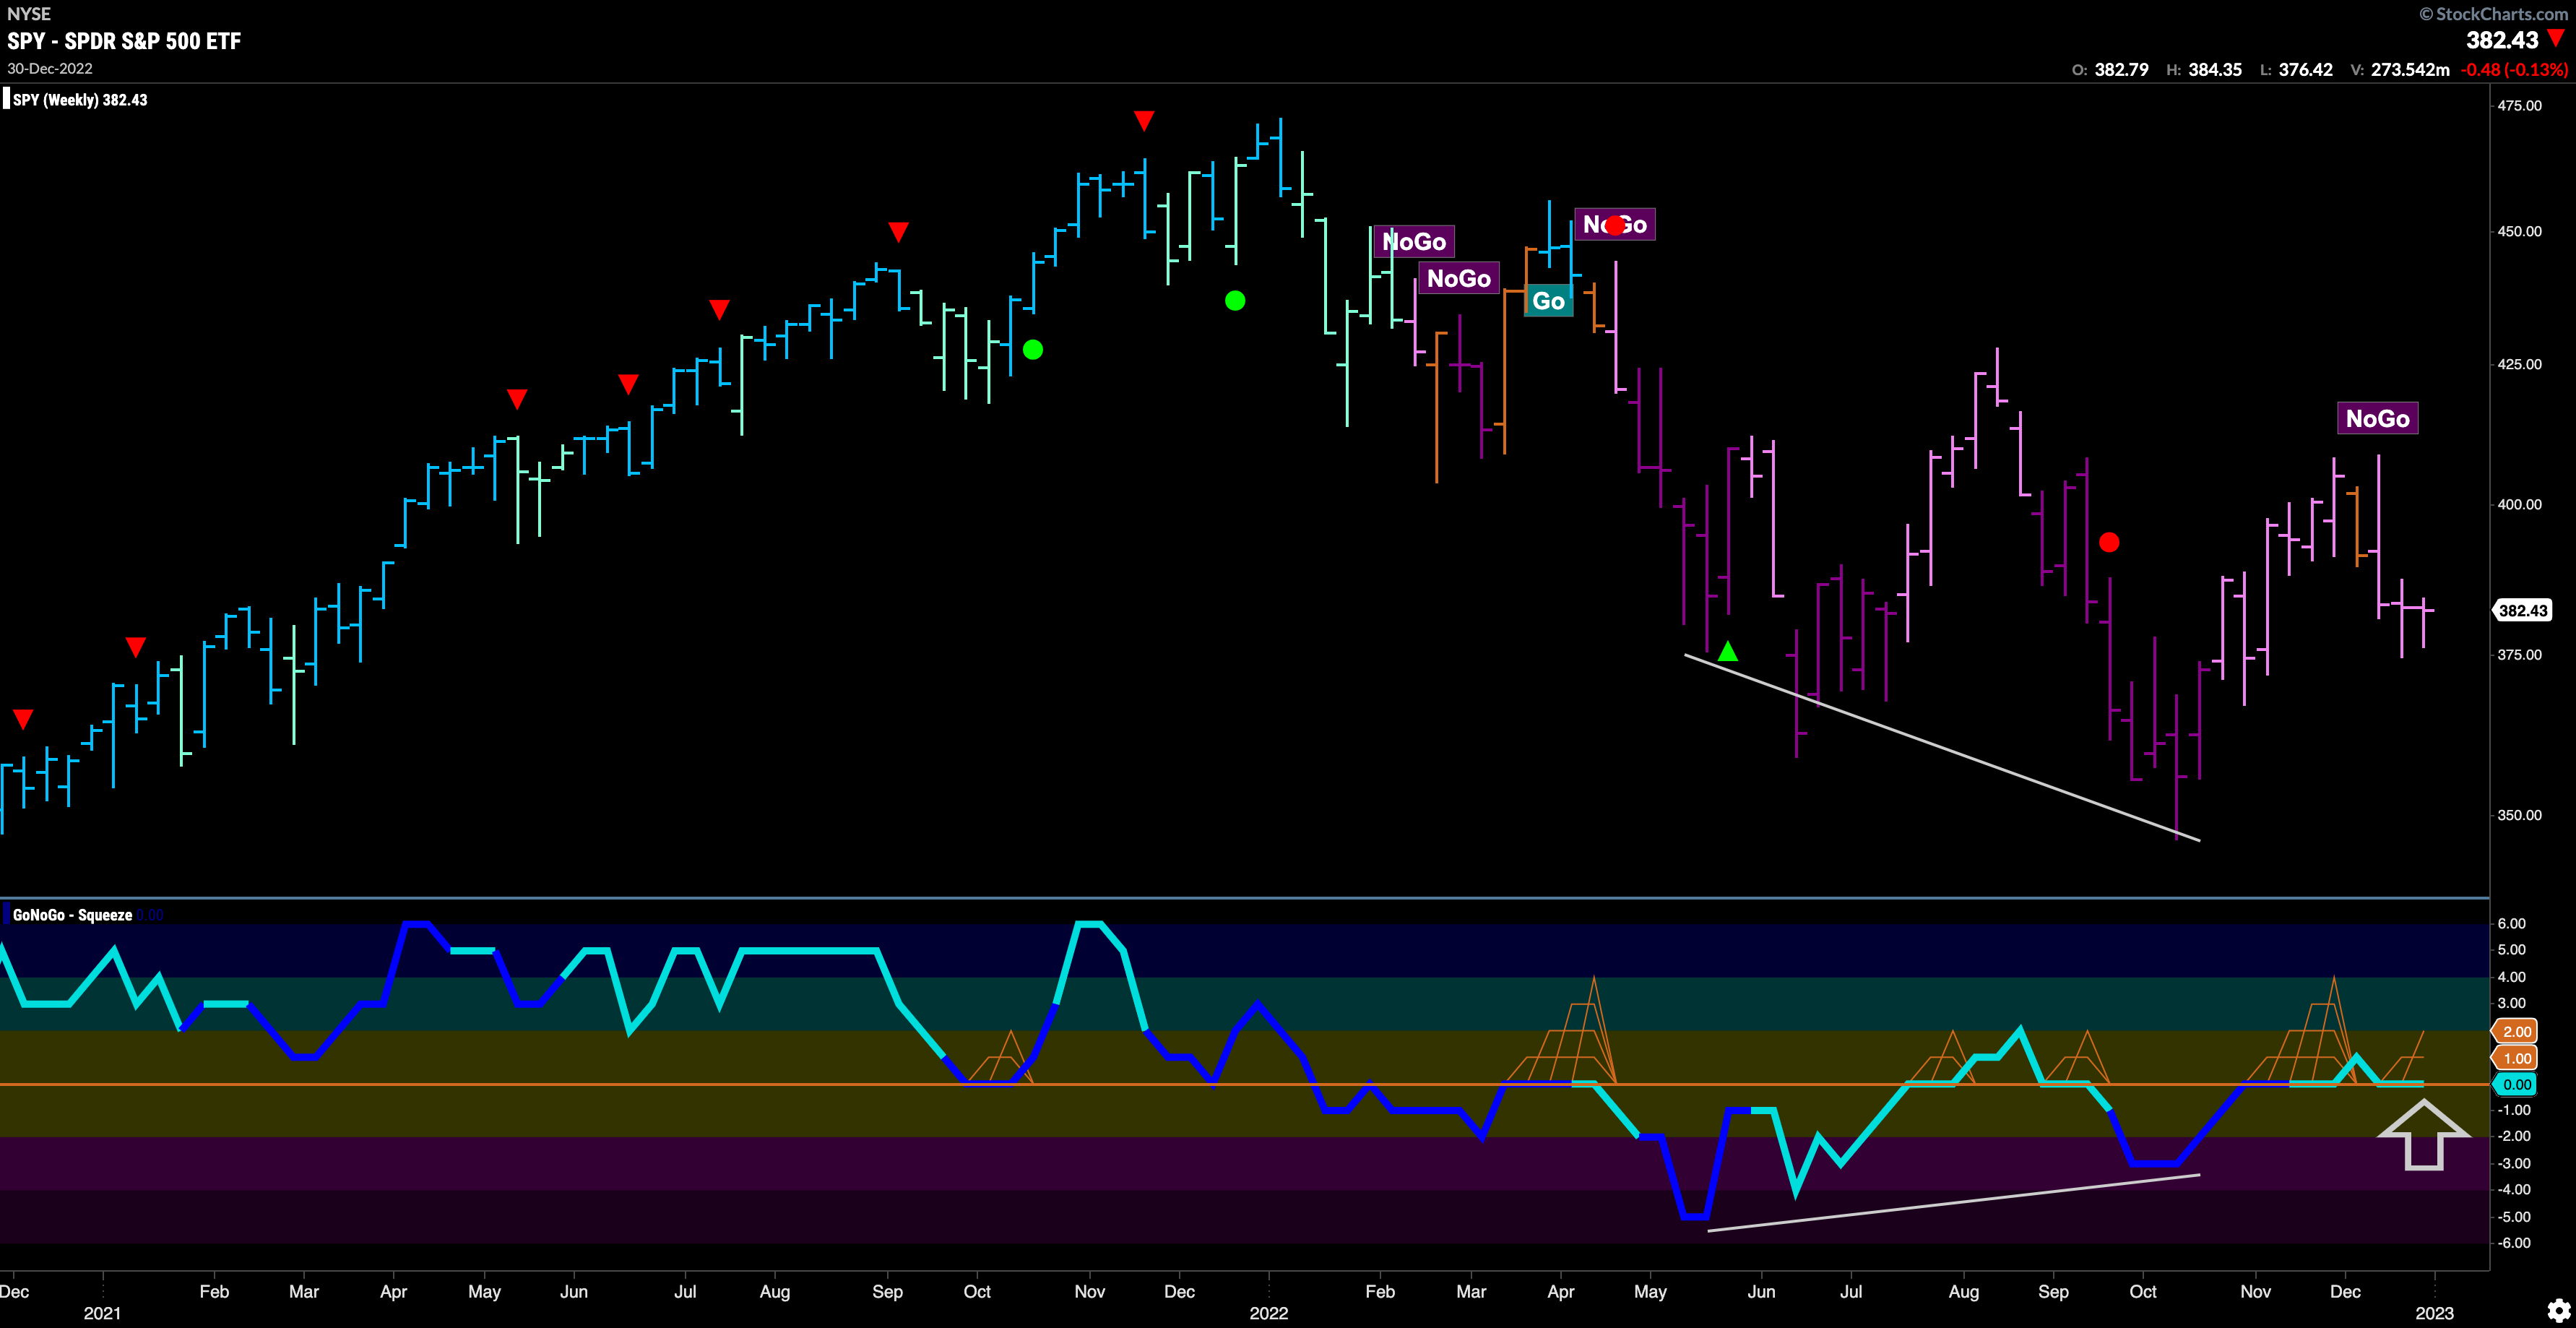
The longer term weekly chart shows that the “NoGo” holds fort. We are seeing weaker pink bars however, and those looking for bullish signs will note the bullish divergence between the lower lows in price and higher lows in the oscillator. Of course, with a lower high, the “NoGo” prevails.
Treasury Rates Spark Fresh “Go” trend
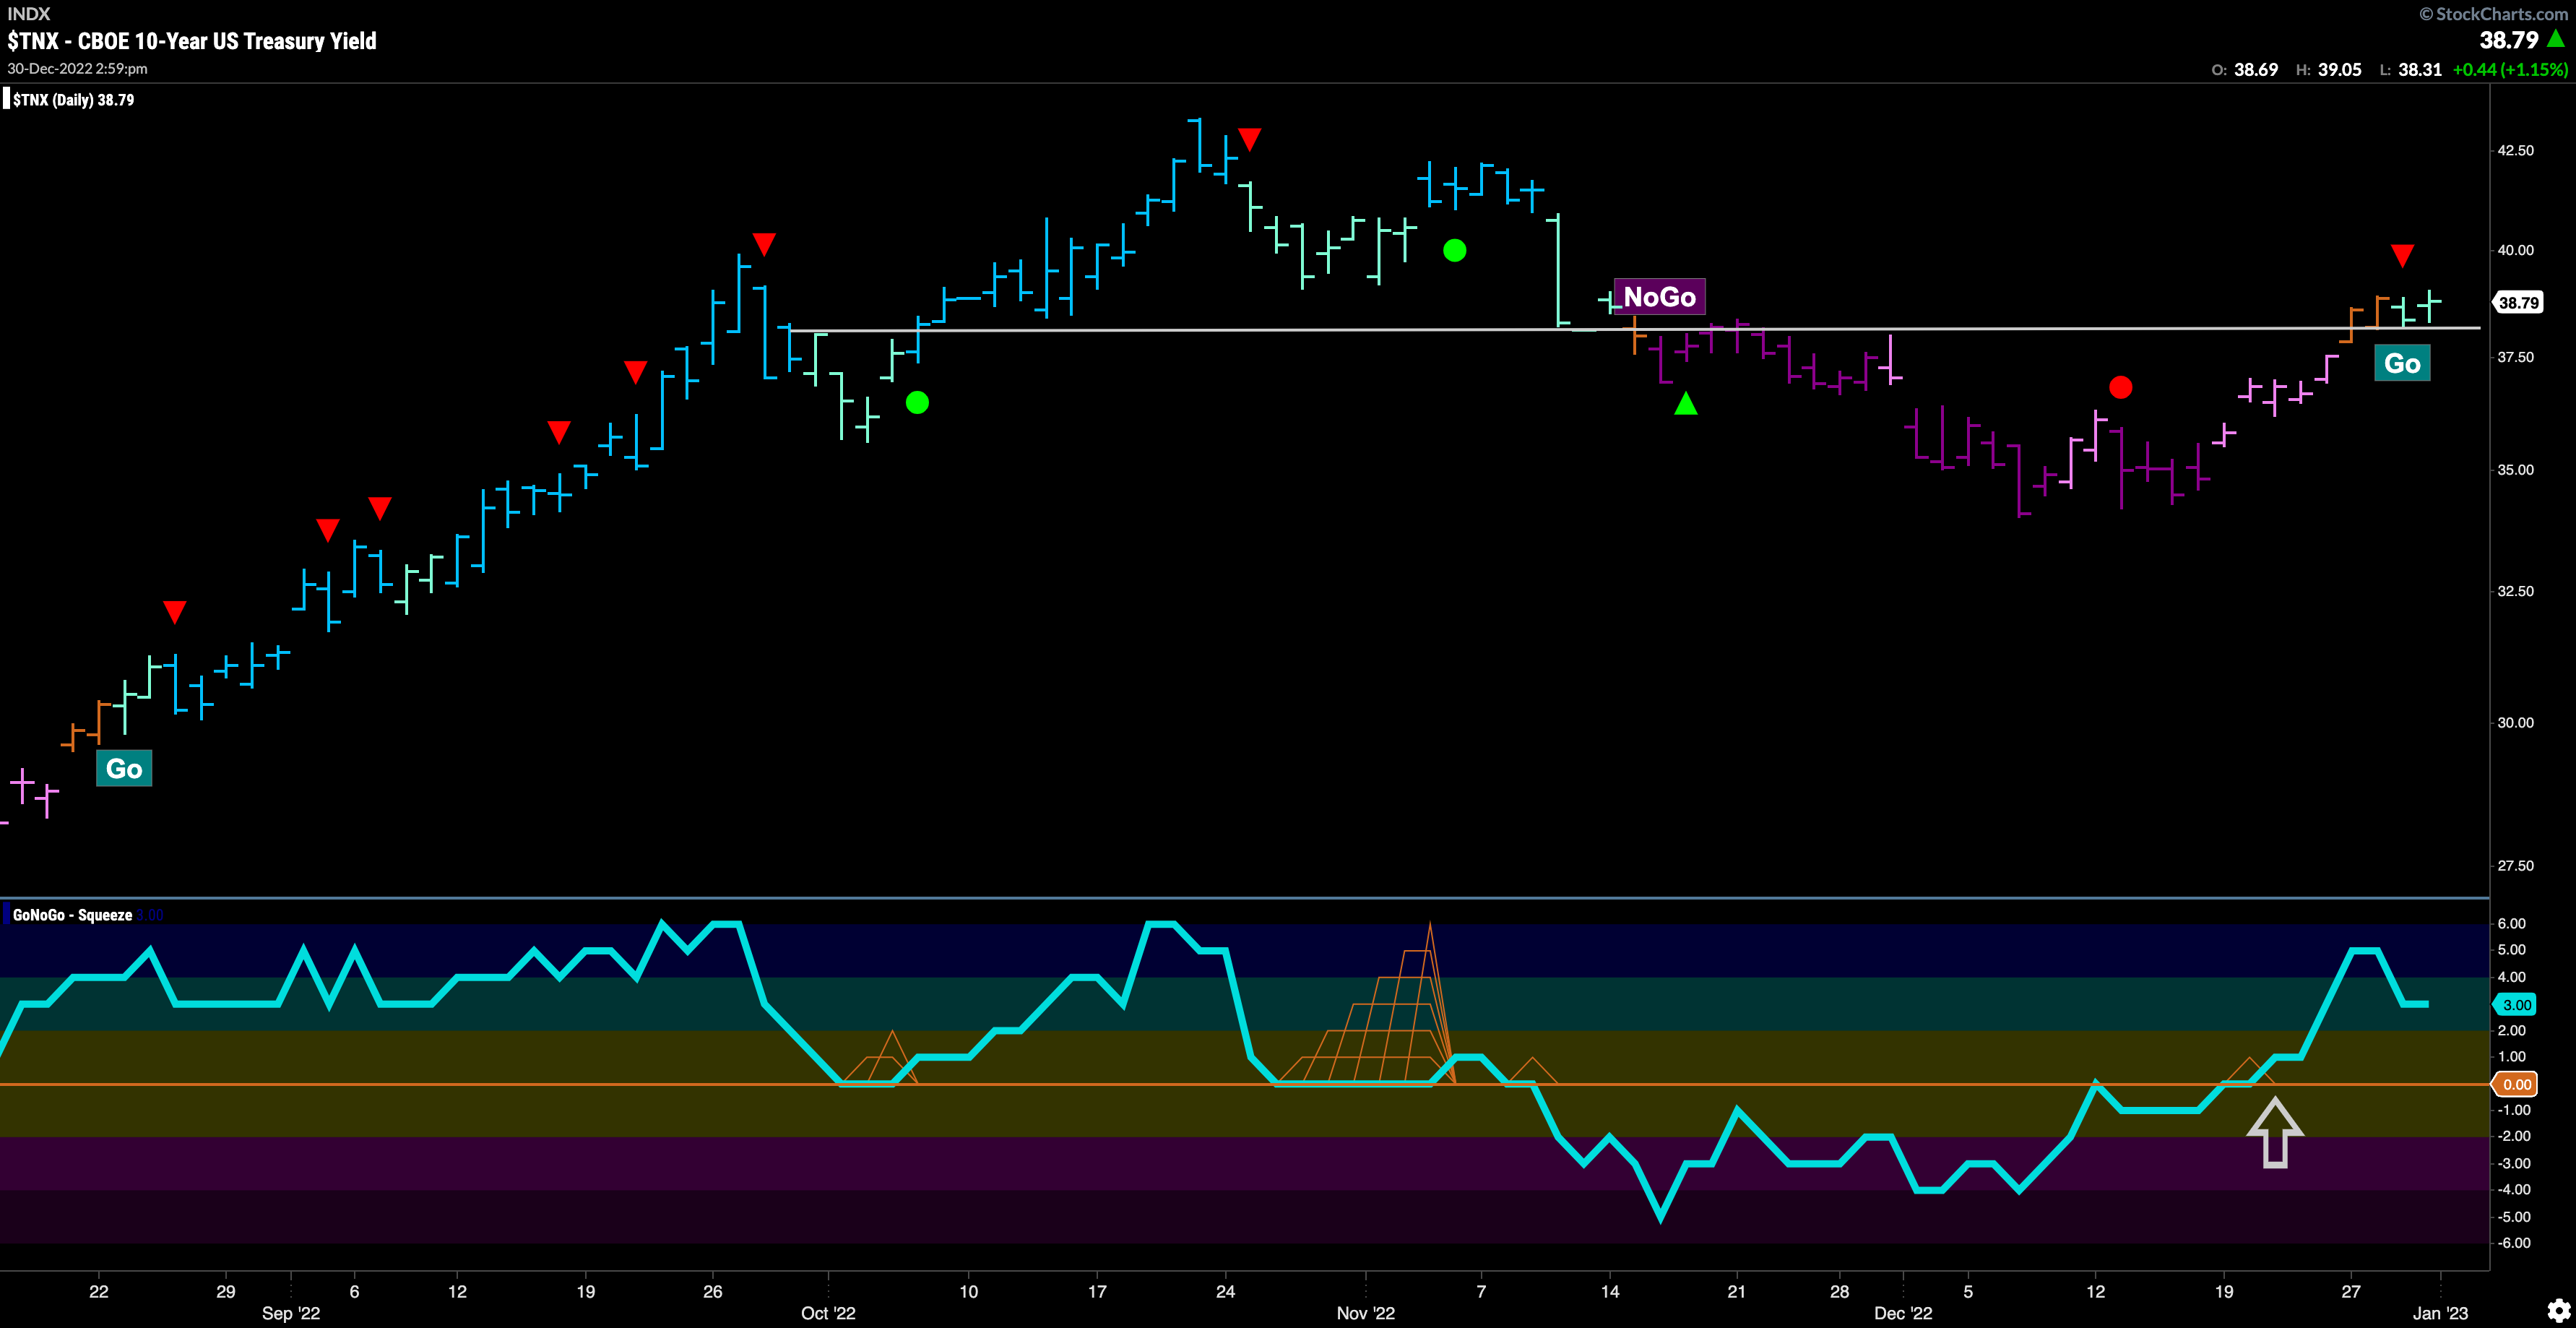
The resistance we saw last week was broken to the upside and after a couple of amber “Go Fish” bars we see a new “Go” trend emerge. This of course came after GoNoGo Oscillator broke into positive territory which gave us an early warning that there may be enough bullish momentum to move GoNoGo Trend out of “NoGo” bars. This return to a “Go” trend in treasury rates could act as a headwind for equities as we move into the new year.
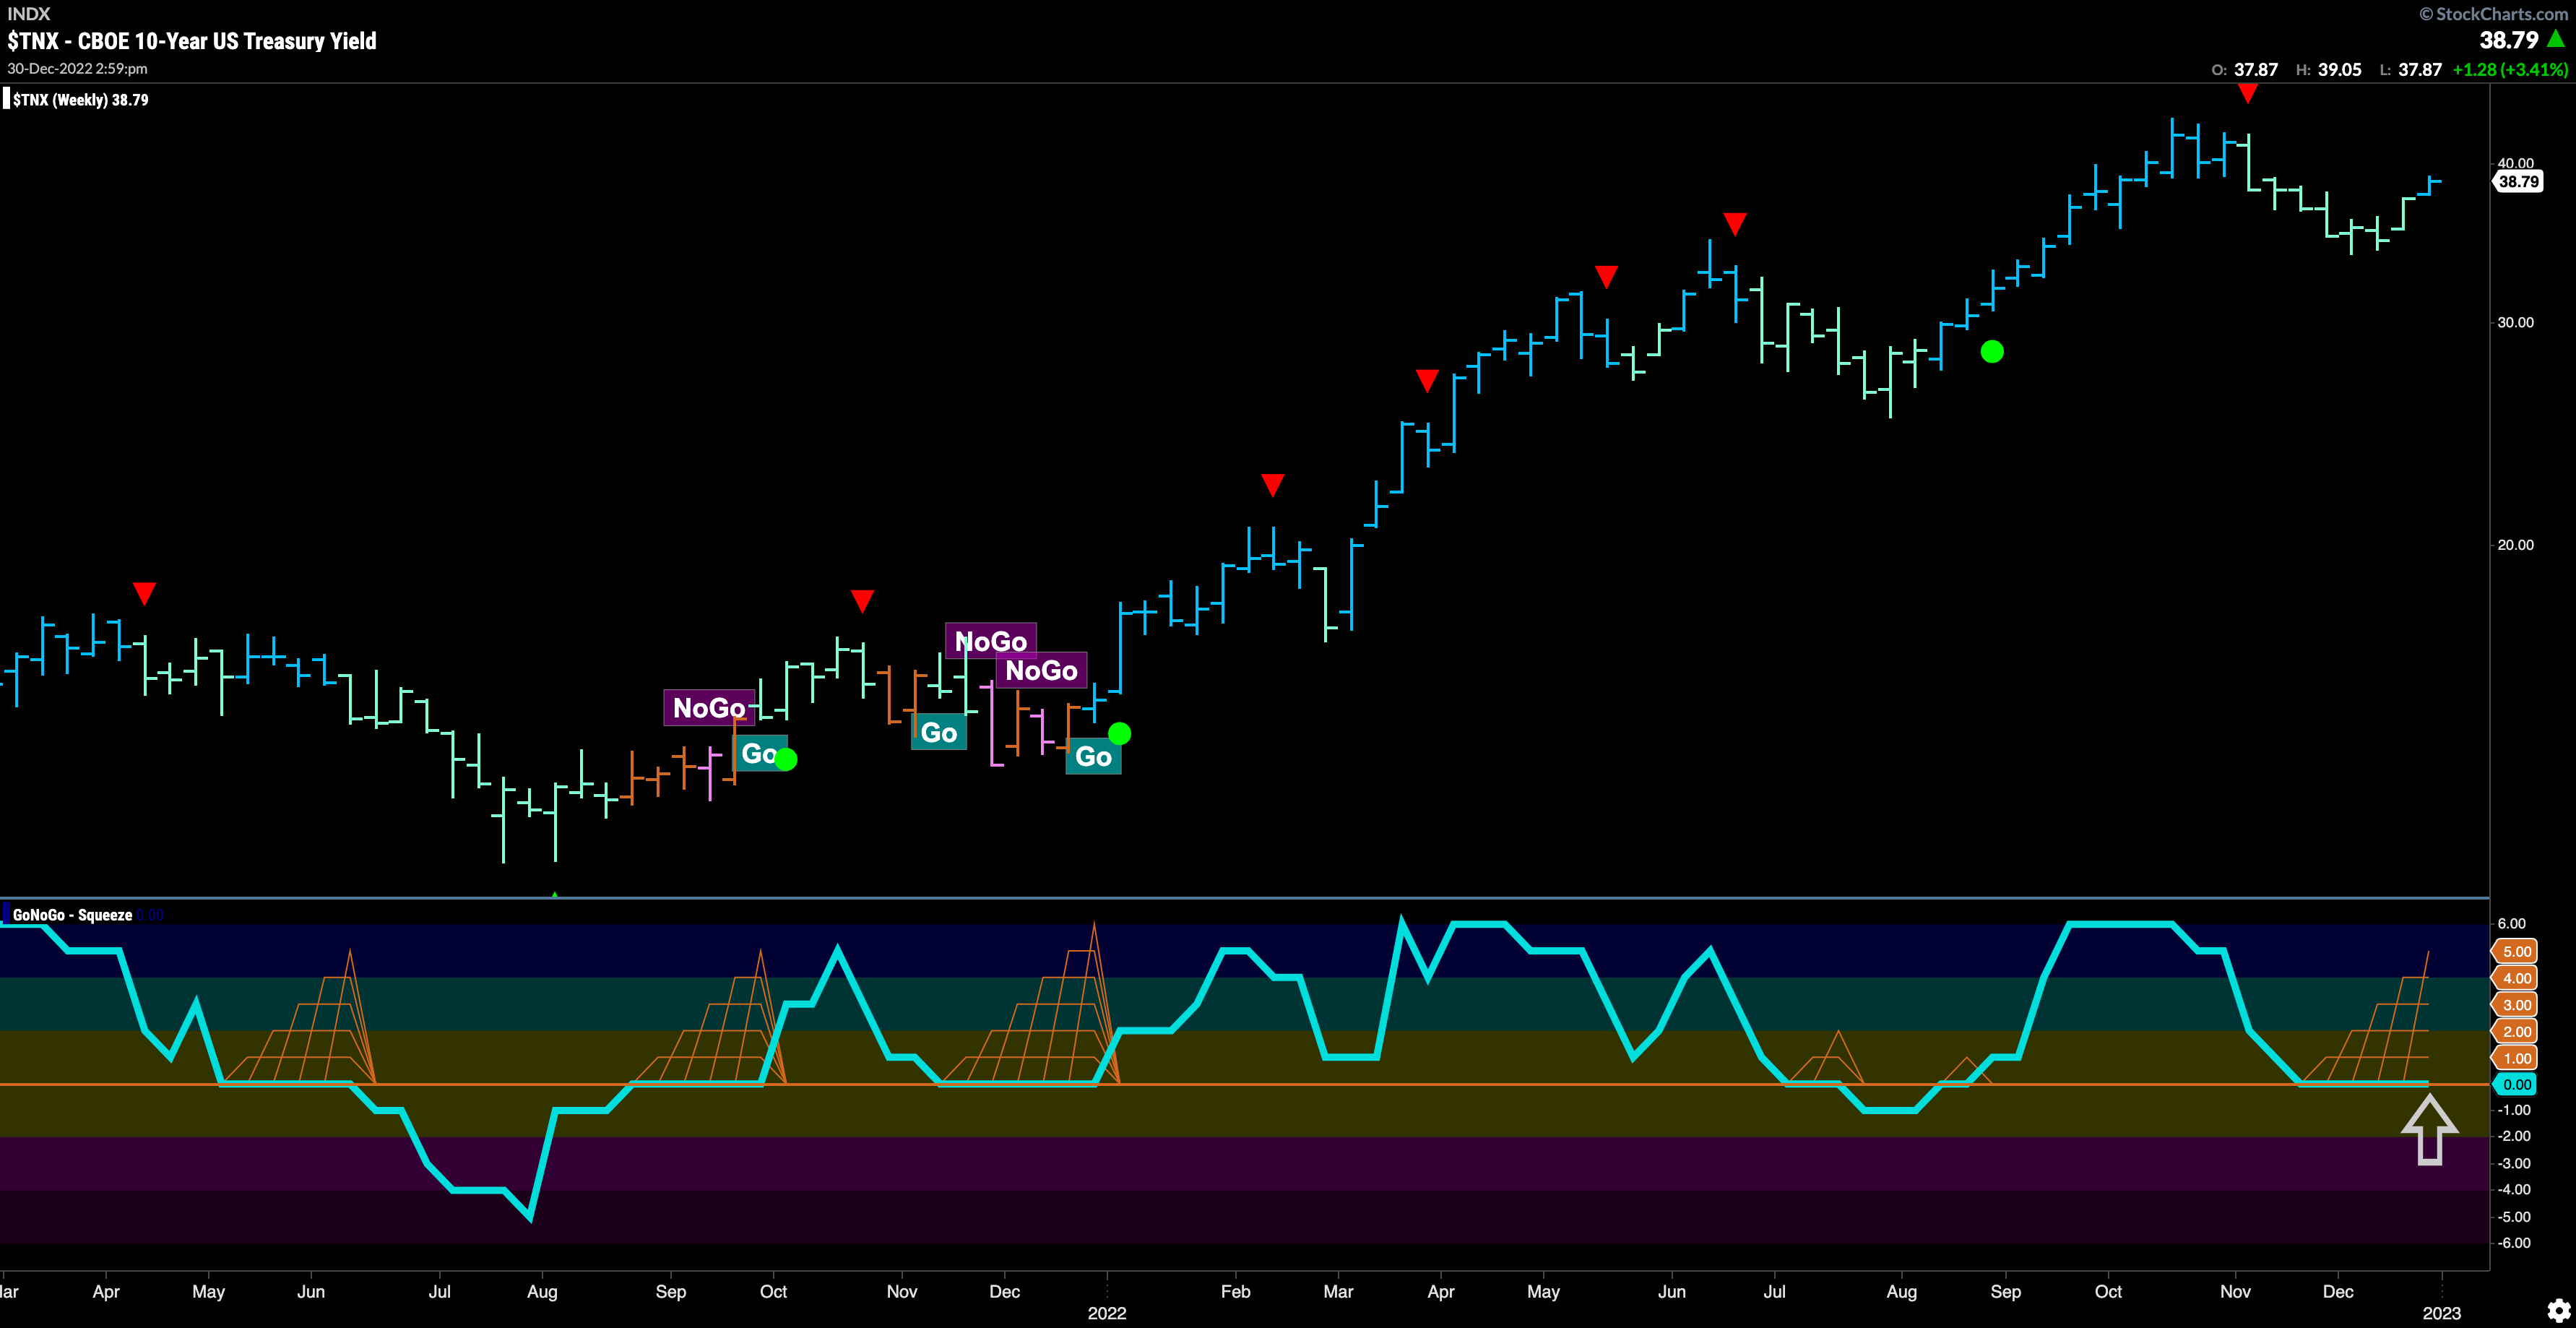
On the longer term chart we see that the “Go” trend is still in place and in fact strengthened to paint a bright blue bar last week. GoNoGo Oscillator remains in a prolonged fight with the zero line and we see a GoNoGo Squeeze climbing as the reduced volatility continues. We will watch to see if GoNoGo Oscillator can break out of the Squeeze into positive territory which would tell us that momentum remains on the side of the “Go” trend. This would suggest an attack on prior highs.
The Dollar Sees GoNoGo Oscillator Rejected by Zero Line
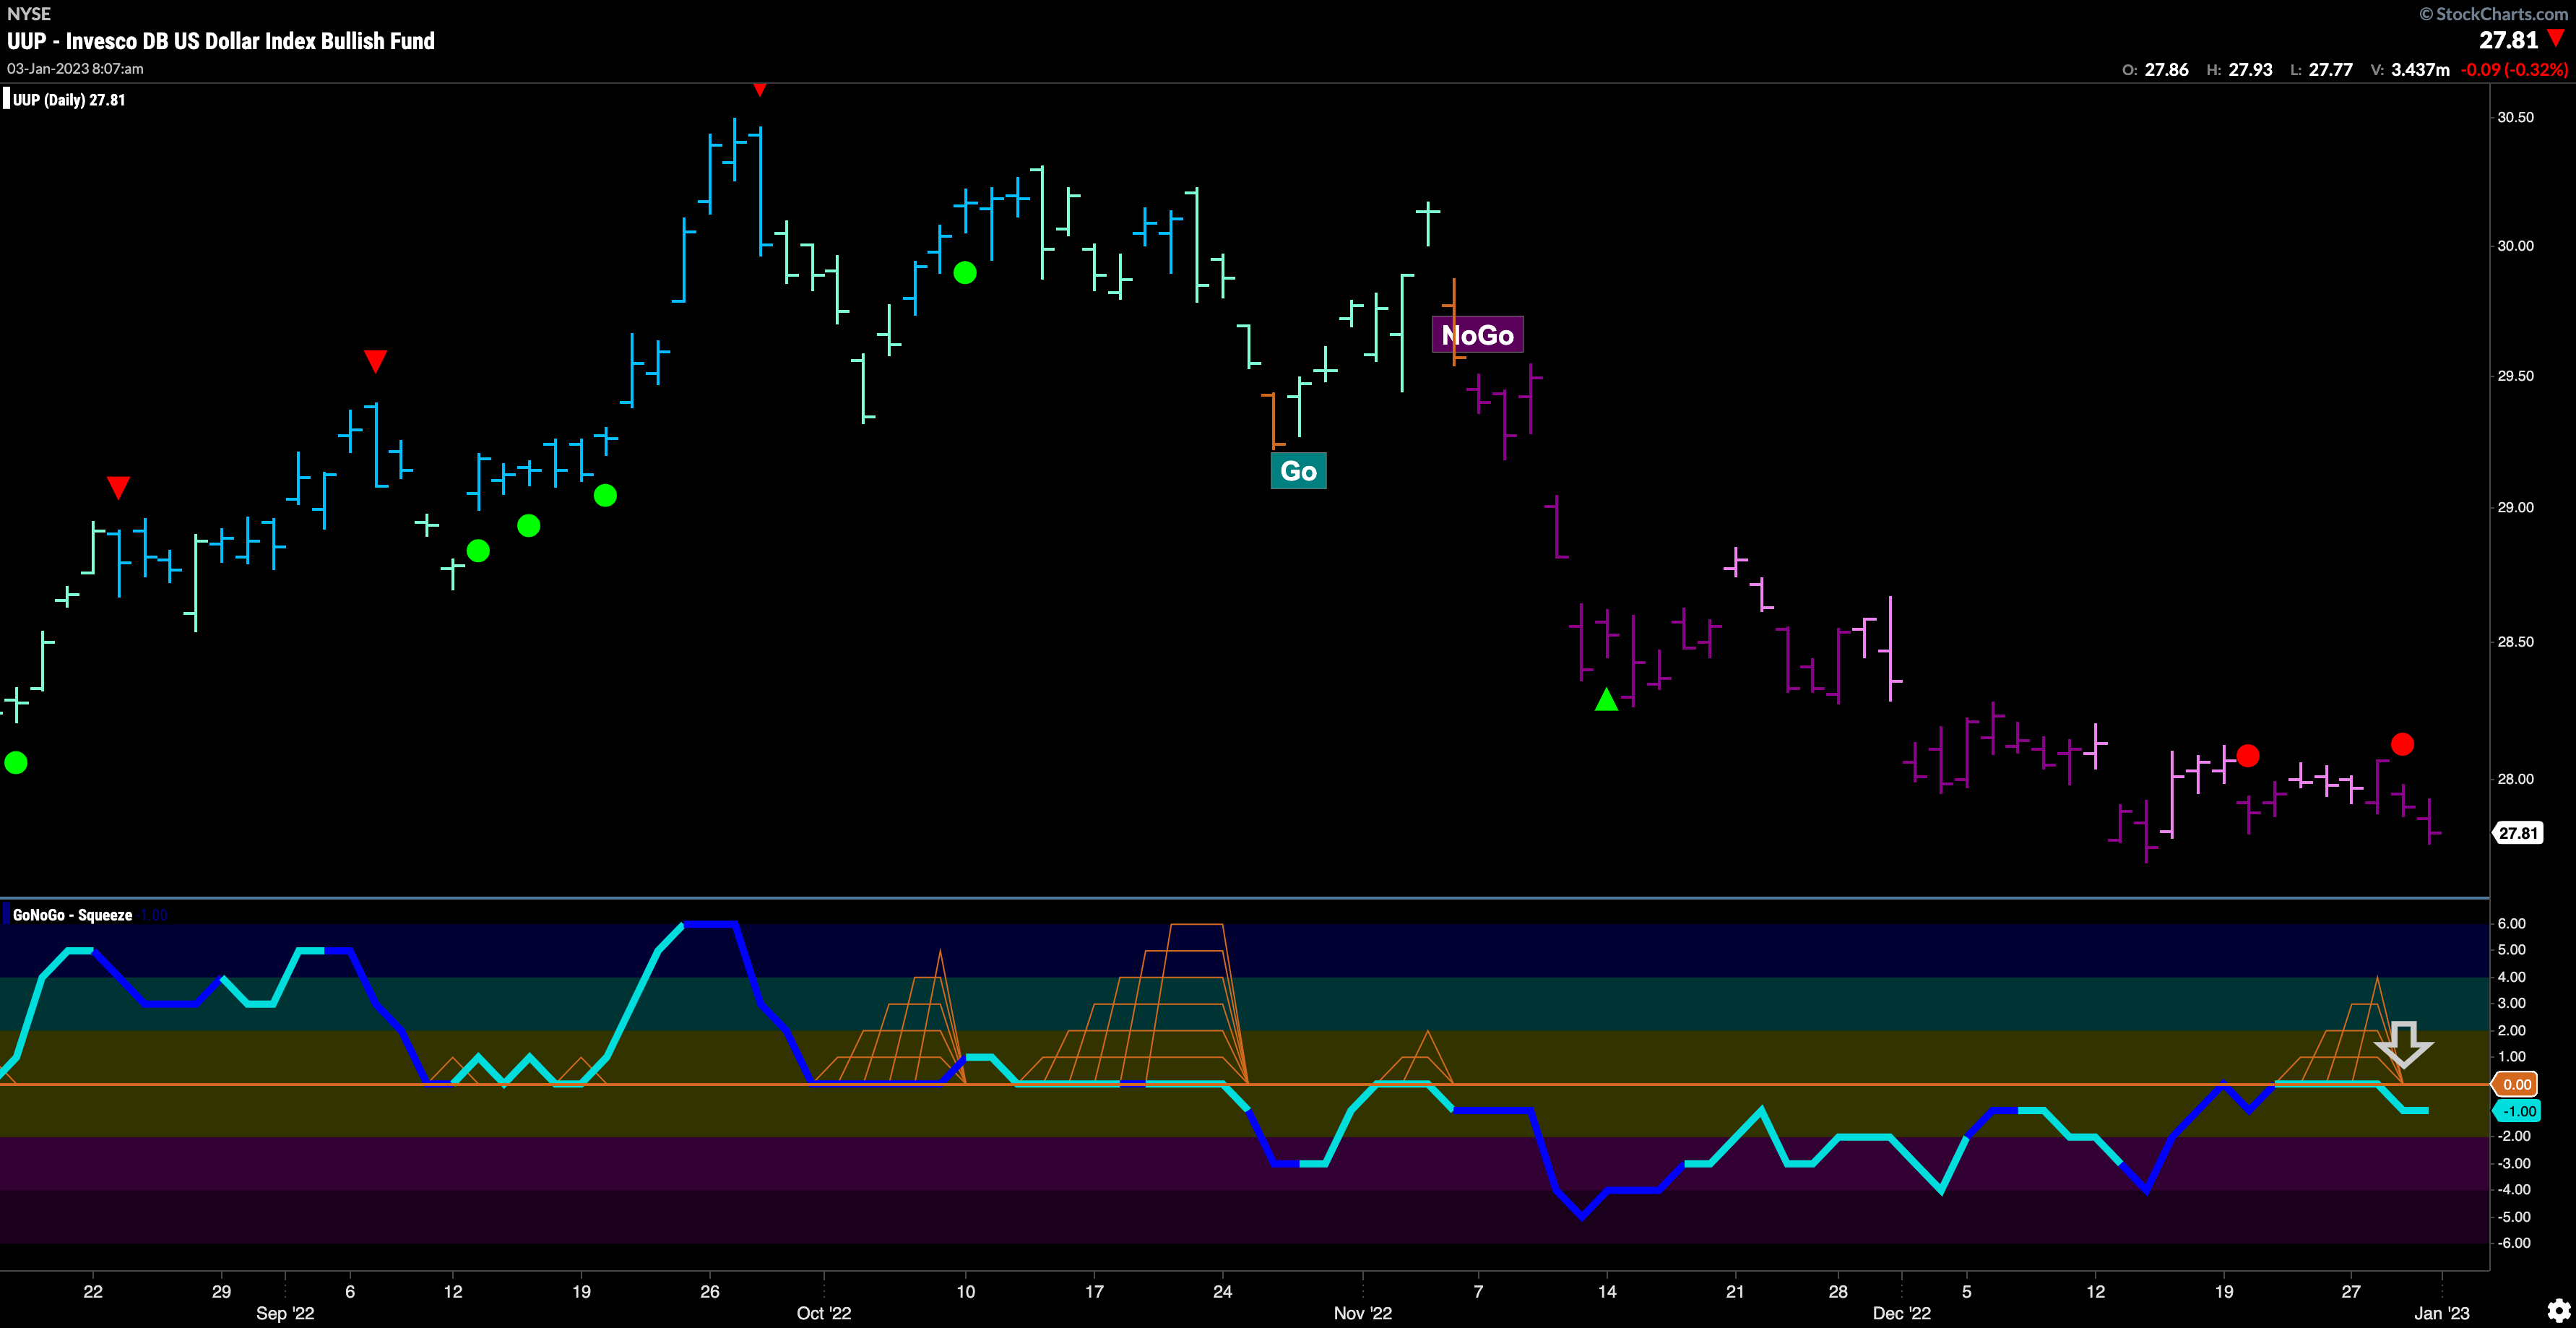
We saw GoNoGo Oscillator ride the zero line for much of last week. As the GoNoGo Squeeze was building we wondered if it would serve as resistance and it did. This indicates that momentum has returned in the direction of the “NoGo” trend and indeed we saw that trend strengthen as purple bars returned. This is setting price up for an attempt at a lower low.
“NoGo” in Oil At Inflection Point as Short and Long Term Charts Collide
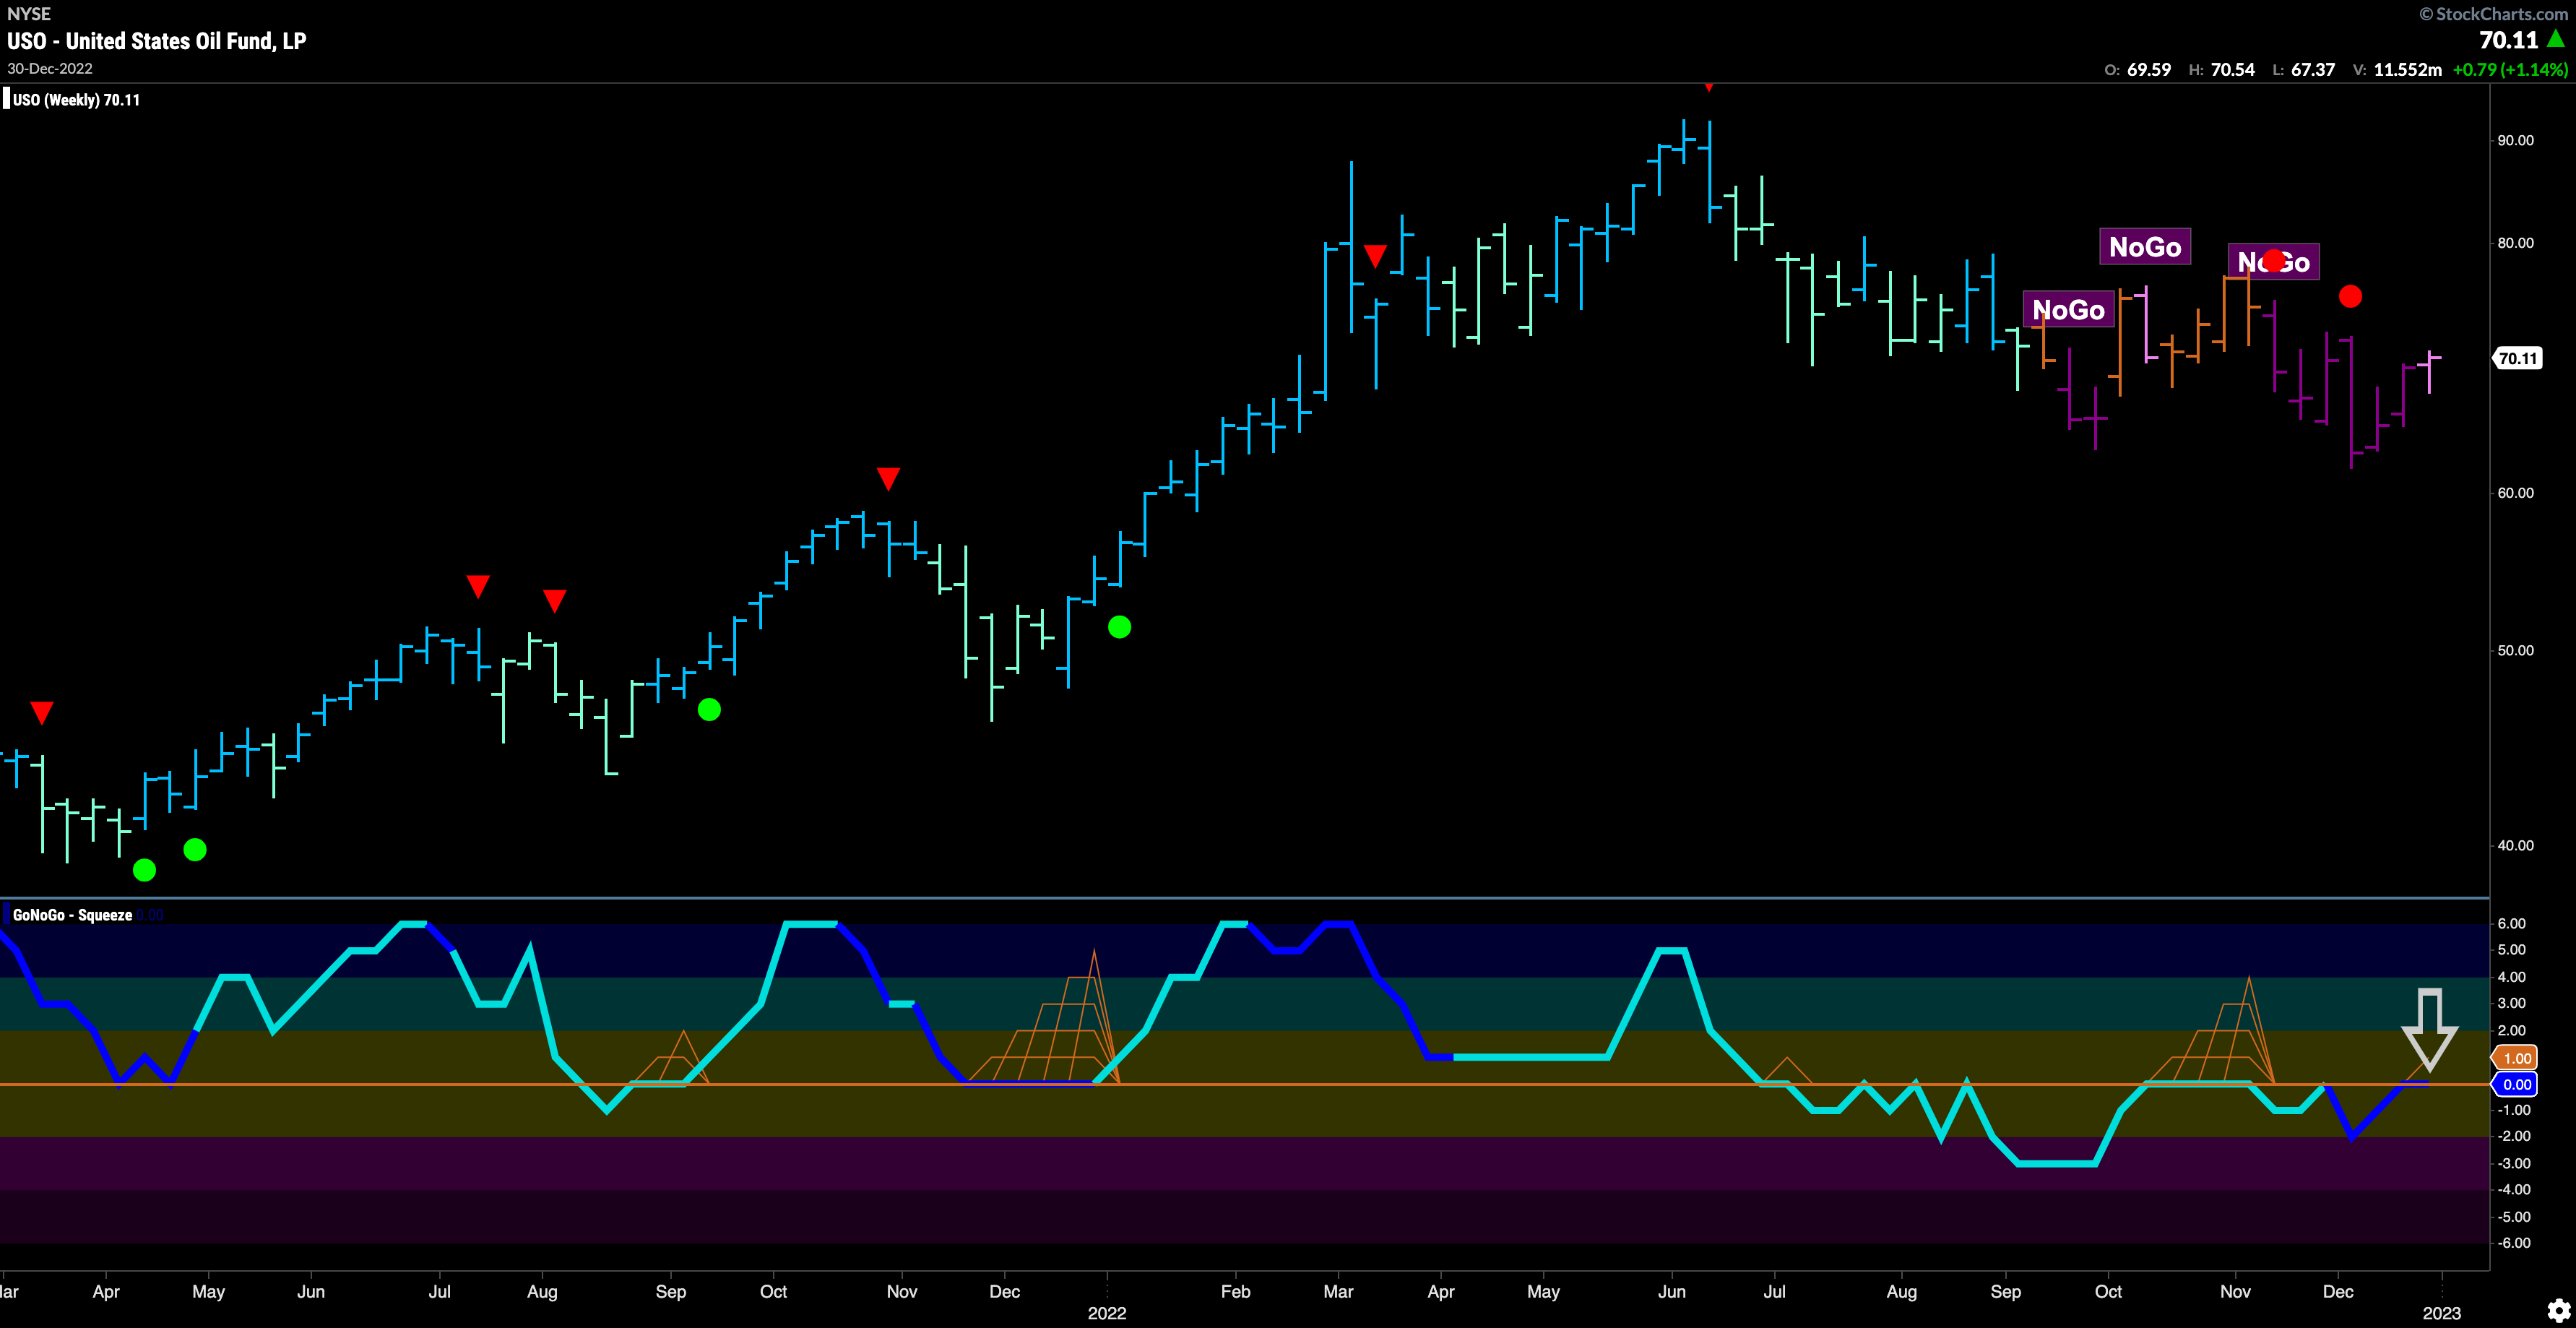
The “NoGo” remains in place on this longer term GoNoGo Chart in Oil. Last week saw a pink bar however, which is the weaker form of the “NoGo” trend. We also see that GoNoGo Oscillator has quickly risen to retest the resistance at the zero line and on heavy volume. It will be important to see whether this level holds as resistance. If it does then we will likely see the “NoGo” trend continue and further price decay. On the other hand, if the oscillator can break into positive territory that would suggest some trouble for the “NoGo” trend.
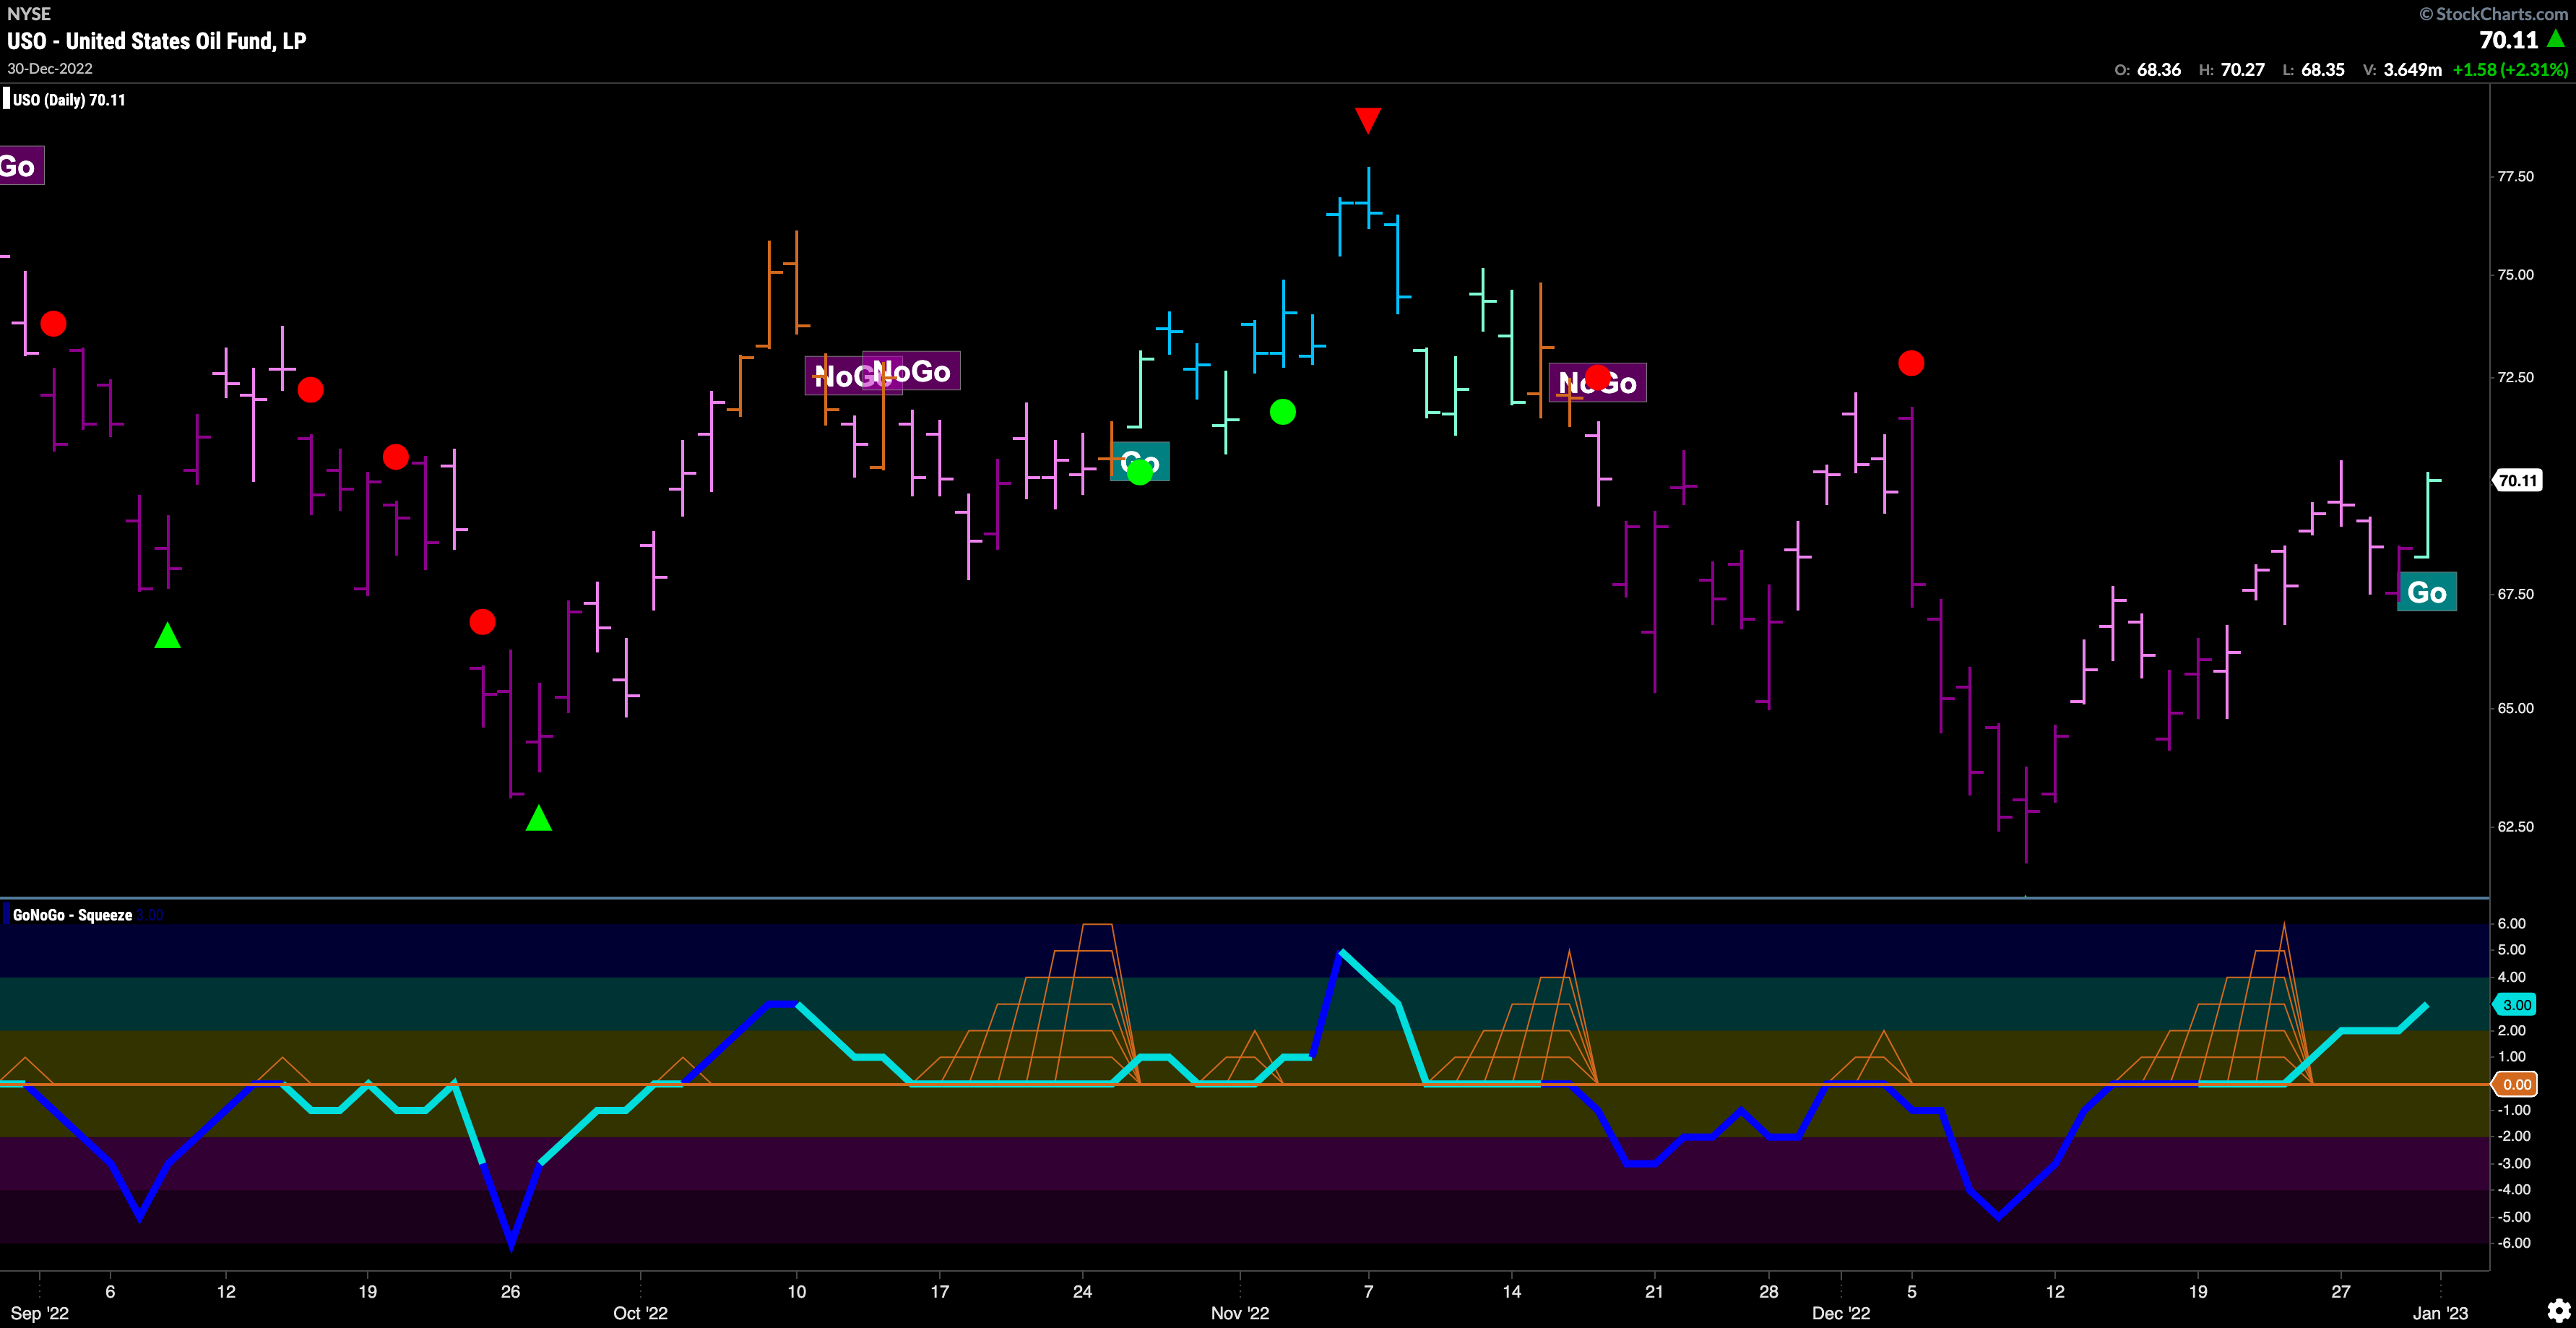
On the shorter term chart, we can see that price has moved off the floor enough to paint a first “Go” colored bar. This comes after a max GoNoGo Squeeze was broken to the upside with GoNoGo Oscillator bursting into positive territory. We will see if this “Go” can persist and drive the longer term chart to follow suit.
Sector RelMap
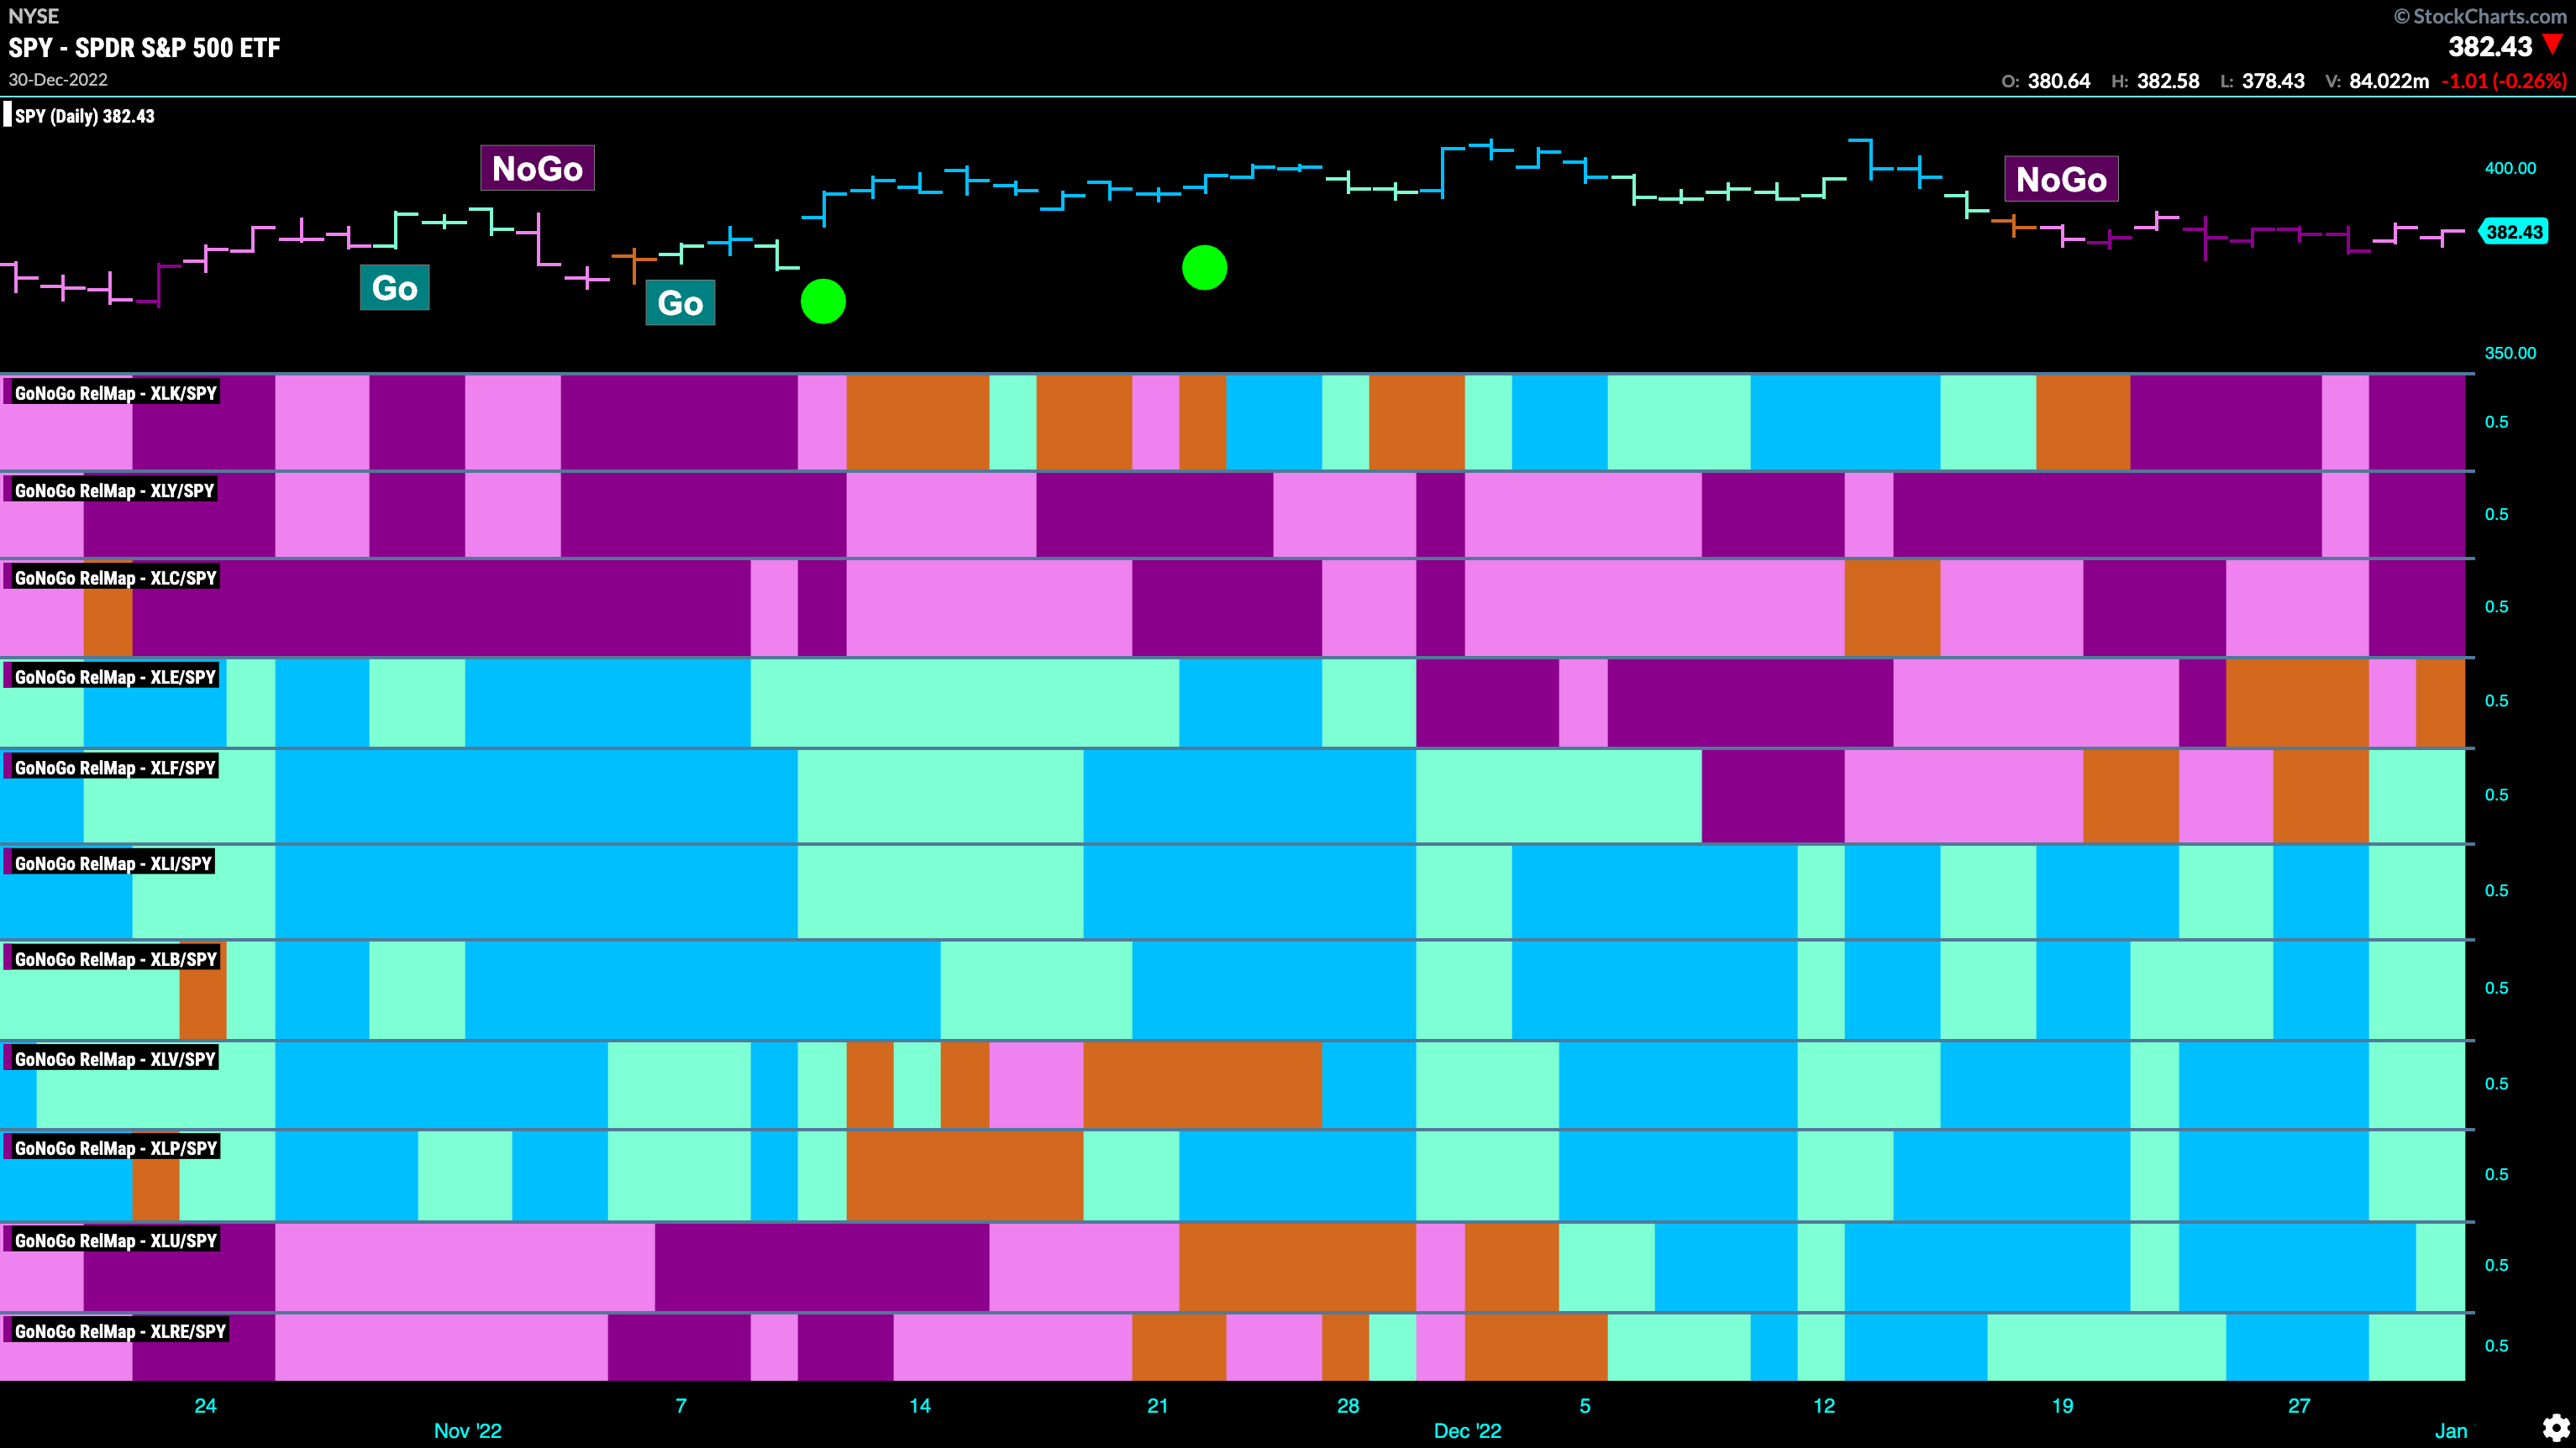
Below is the GoNoGo Sector RelMap. This GoNoGo RelMap applies the GoNoGo Trend to the relative strength ratios of the sectors to the base index. Looking at this map, we can quickly see where the relative outperformance is coming from as well as which sectors are lagging on a relative basis. 7 sectors are outperforming the base this week. $XLF, $XLI, $XLB, $XLV, $XLP, $XLU, and $XLRE, are painting “Go” bars.
Utilities Sector Outperforming as Defense Remains on the Field
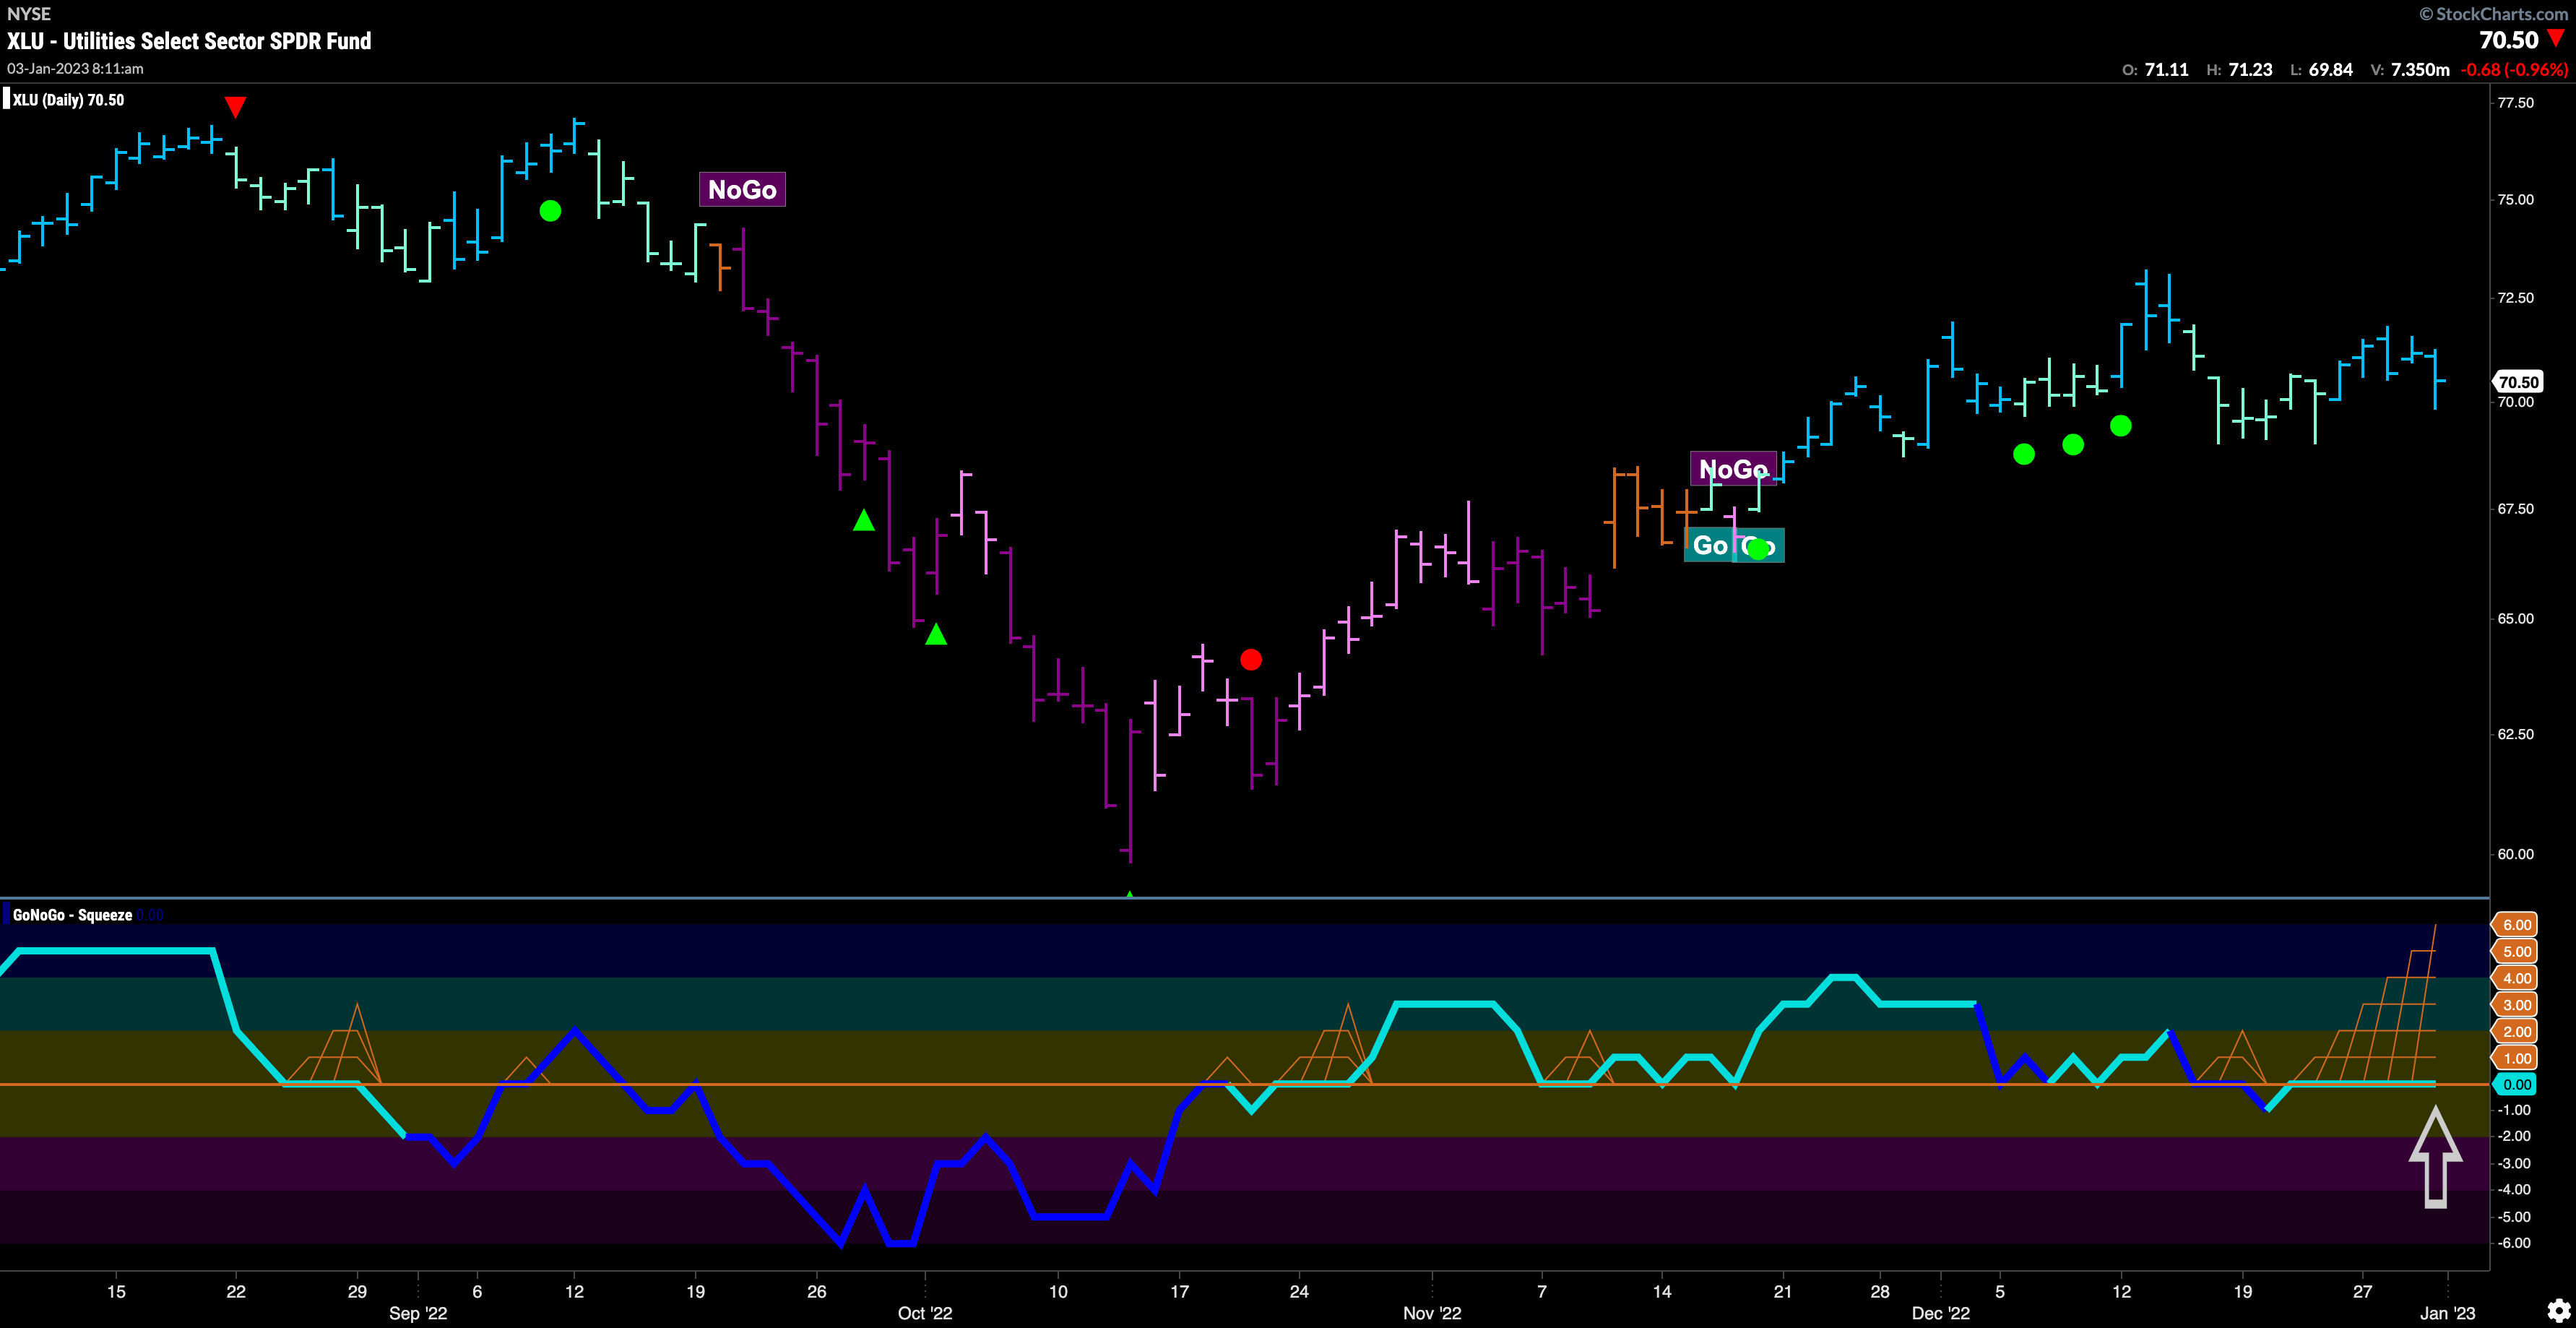
The chart below shows $XLU in a “Go” trend and painting strong “Go” bars in the face of general equity weakness. However, as price moves mostly sideways, we see that GoNoGo Oscillator is testing the zero line from above where a lack of directional. momentum has caused the climbing grid of GoNoGo Squeeze to climb to its max. For the “Go” trend to continue, GoNoGo Oscillator should break out of the Squeeze into positive territory which would signal the return of momentum in the direction of the “Go” trend.
$EXC Looking to Break out of Ascending Triangle in “Go” Trend
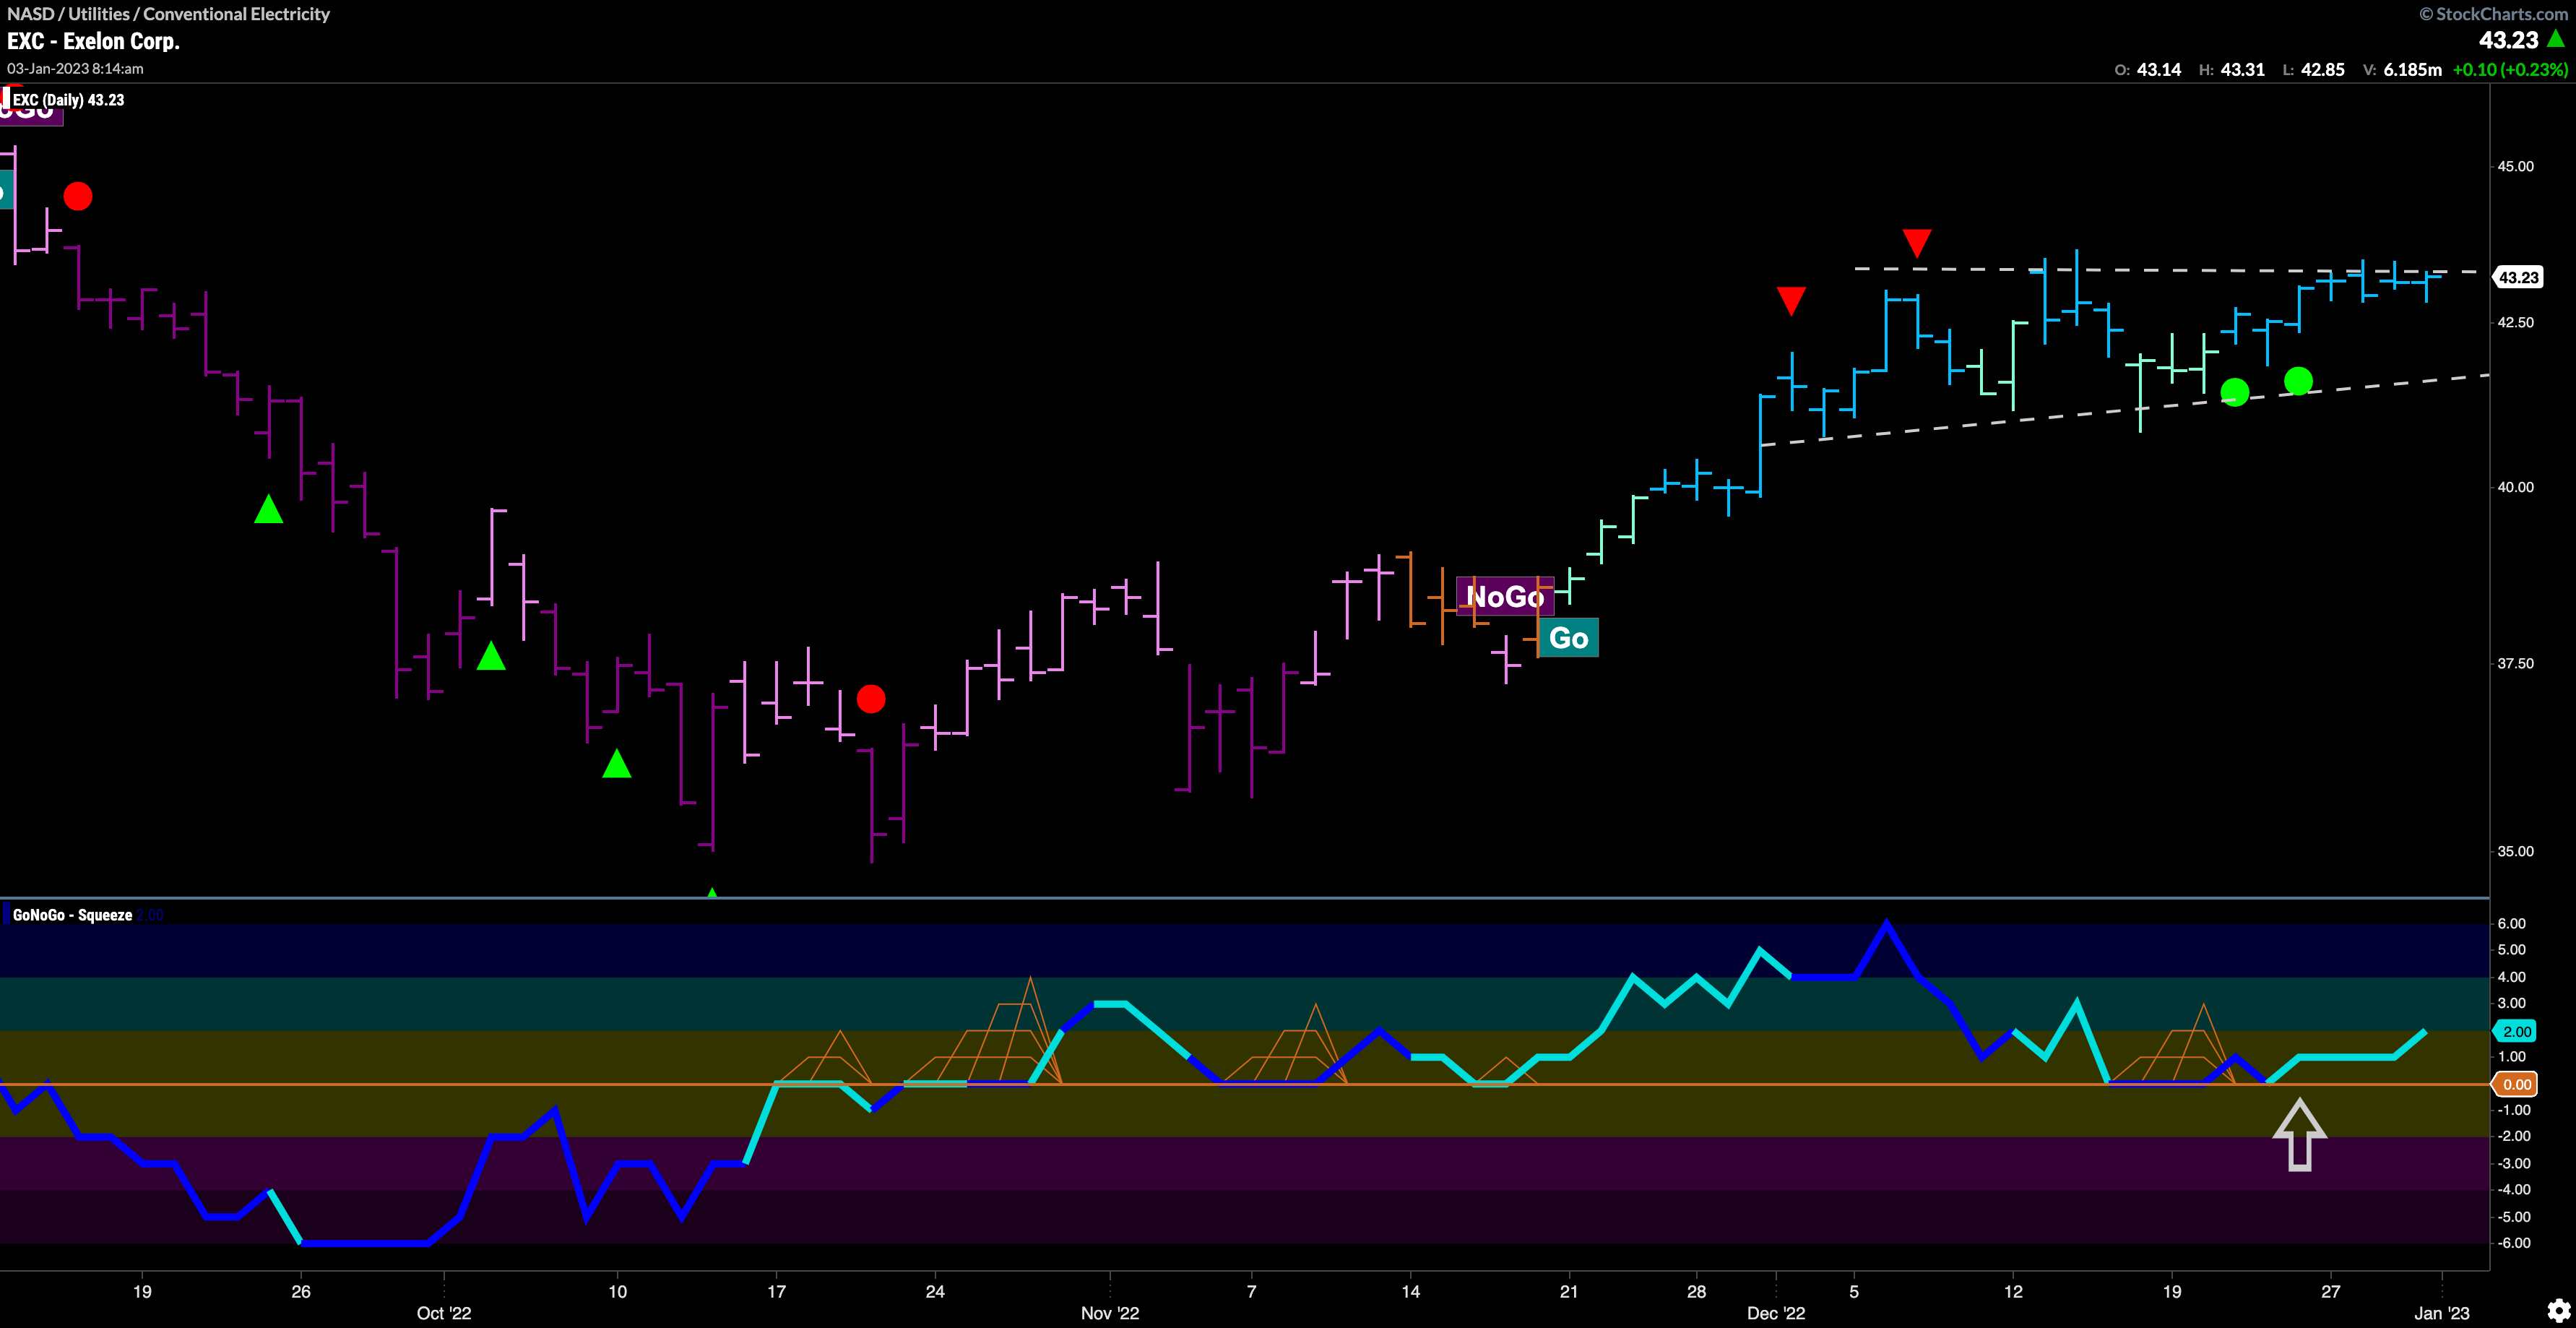
Exelon Corp is representative of a large utilities company seeing strong price action in an outperforming sector. We can see that last week saw a run of strong “Go” bars that have pushed price up against the horizontal bound of an ascending triangle. GoNoGo Oscillator found support during the pattern and triggered a couple of Go Trend Continuation Icons (green circles) as it remained in positive territory. We will watch to see if price can climb above this resistance level and set new highs.
