Risk assets continue to lead the market gains as the technical picture remains bullish. “Go” trends are still in place for equities, commodities, and cryptocurrencies.
While the trend of the US Dollar would suggest headwinds for equities, the US stock market posted strong gains last week, with the broad market averages advancing nicely. While the S&P & NASDAQ finished over 2.5% and 3% higher, small & mid-cap stocks were again the clear outperformers, gaining over 5% & 7%, respectively.
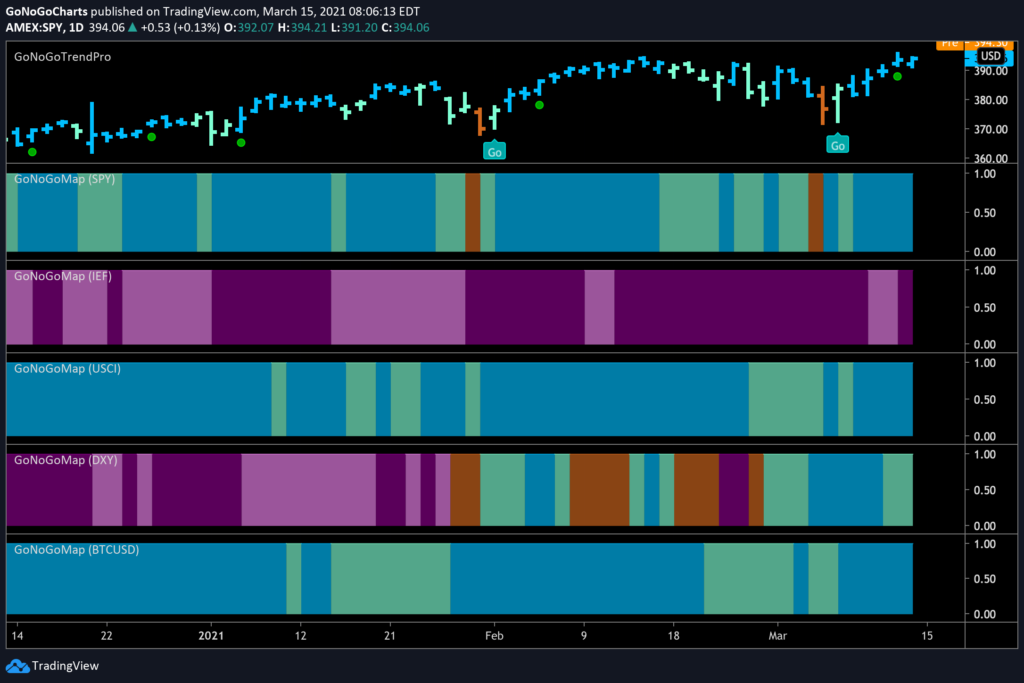
The GoNoGo Heat Map® above shows us the daily trend performance of five asset classes: Equities, Bonds, Commodities, Currencies, and Digital Assets from the US perspective.
Panel 1 – Stocks continue to paint strong “Go” bars as the trend this week persists. SPDR® S&P 500® ETF Trust seeks to provide investment results that, before expenses, correspond generally to the price and yield performance of the S&P.
Panel 2 – Government bonds, continue to paint “NoGo” bars, as the downtrend remains strong. $IEF tracks a market-value-weighted index of debt issued by the US Treasury with 7-10 years to maturity remaining.
Panel 3 – Commodities are a “Go” and painting the strongest blue bars again this week. $USCI tracks an equal-weighted index of 14 commodity futures contracts and holds at least one precious metal, industrial metal, energy, livestock, soft, and grain commodity.
Panel 4 – The US Dollar is now in an established “Go” trend but it has weakened this week. $DXY is an index of the value of the United States Dollar relative to a basket of foreign currencies.
Panel 5 – Bitcoin’s “Go” trend continues with strength this week as it climbs ever higher on strong blue bars.
Dollar Dilemma
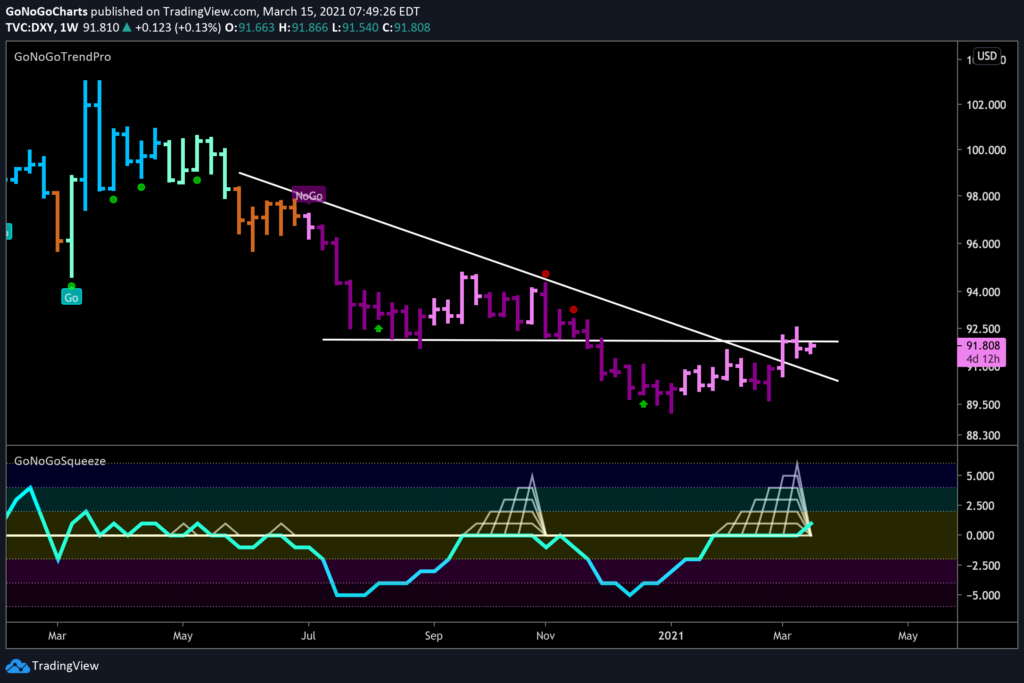
GoNoGo Research has been looking at the trend of the US dollar index $DXY for several weeks as the trend conditions have fluctuated. Today, we need to pull back from what is happening short-term and study the weekly chart.
- The trend is a NoGo, although the current rally is painted with weaker pink bars
- After setting a slightly higher low, price is at resistance
- GoNoGo Oscillator® is riding the zero line, highlighted by the climbing grid of the GoNoGo Squeeze®
- For the longer-term “NoGo” trend to continue, the oscillator will need to break out of the squeeze to the downside
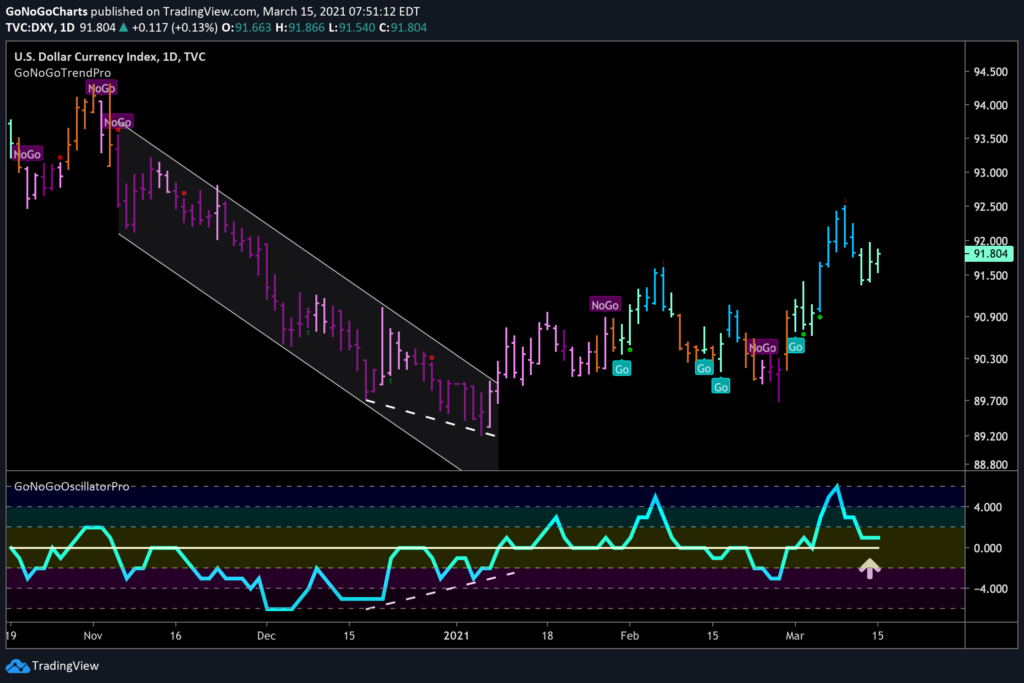
The daily chart provides detail of the short-term dollar strength which constitutes the weak pink bars on the weekly chart above.
- Price has made consecutive higher highs and higher lows
- GoNoGo Oscillator is currently at the zero line after this recent pullback in price
- The oscillator will have to rally from here for the “Go” trend in price to forge higher
SECTOR STRENGTH
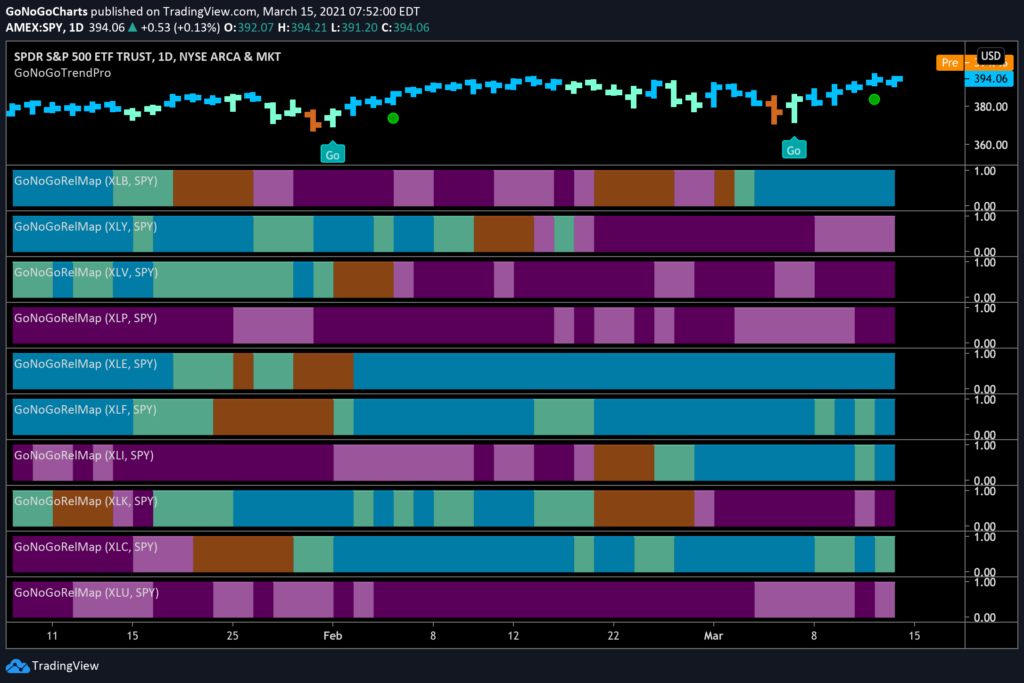
As the economy begins to re-open and rebound from pandemic quarantine, a GoNoGo RelMap® below highlights the outperforming and underperforming sectors – relative to the S&P index.
- Materials ($XLB), as we noted last week have joined leadership. The sector is now in a pronounced “Go” trend, outpacing the returns of the broad index
- Similarly, the Industrials sector ($XLI) is also beating the benchmark, signaling the return of cyclical areas of manufacturing, transportation, and the non-digital industrial economy in 2021
- Energy ($XLE), Financials ($XLF), and the Communications ($XLC) sectors round out the leadership
KINDER TIMES FOR KINDER MORGAN
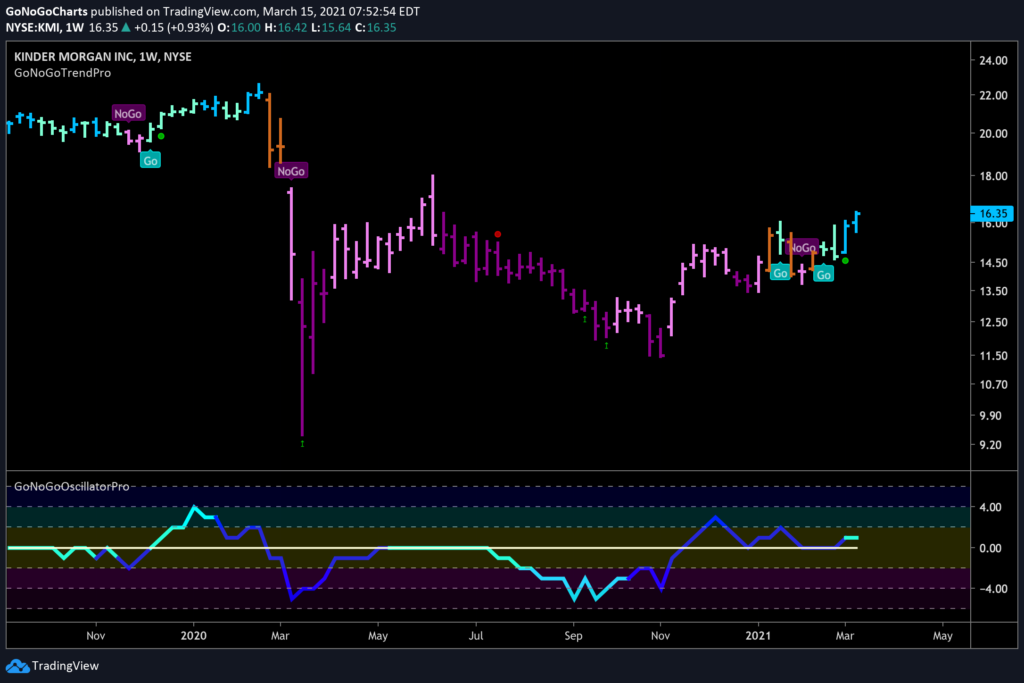
Taking advantage of the strength in energy, the weekly chart below shows Kinder Morgan Inc, ($KMI) an oil and gas pipeline company.
- The technical environment on a large timeframe is finally showing some strength
- The last two price bars have been painted the strongest blue of the “Go” trend
- On the penultimate bar, we see a low-risk entry icon (green circle) indicating that momentum has returned in the direction of the “Go” trend
- If GoNoGo Oscillator is able to rally into positive territory, expect price to attempt to break above prior highs
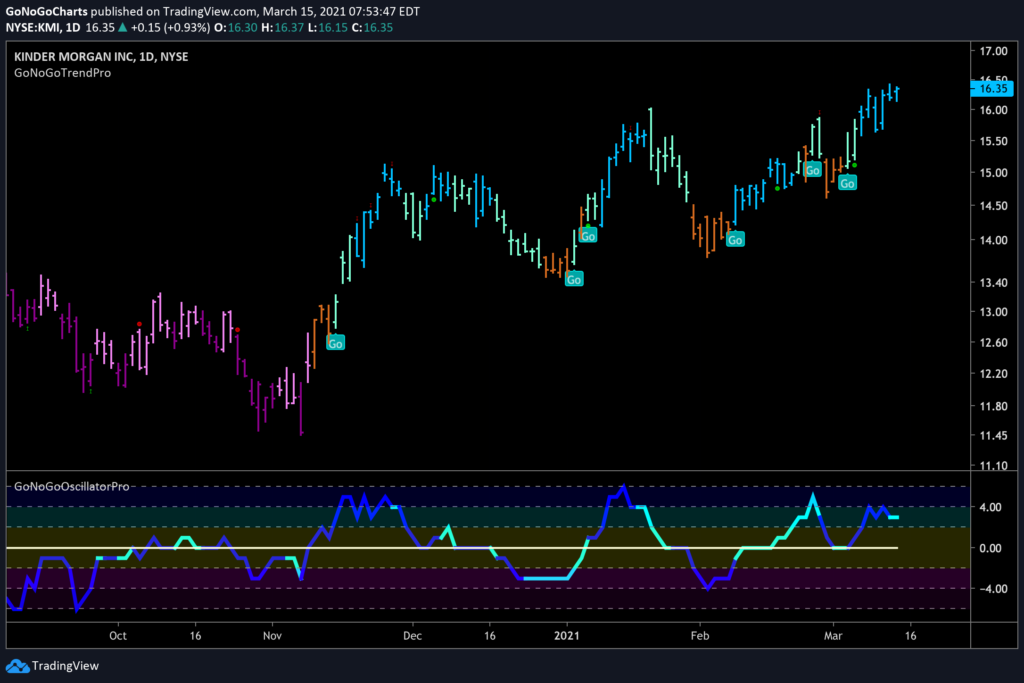
The daily chart below shows that $KMI is in a strong “Go” trend.
- Price is making a higher high as the GoNoGo Trend is painting strong blue bars
- GoNoGo Oscillator is in positive territory but not overbought
FORD FORGES HIGHER
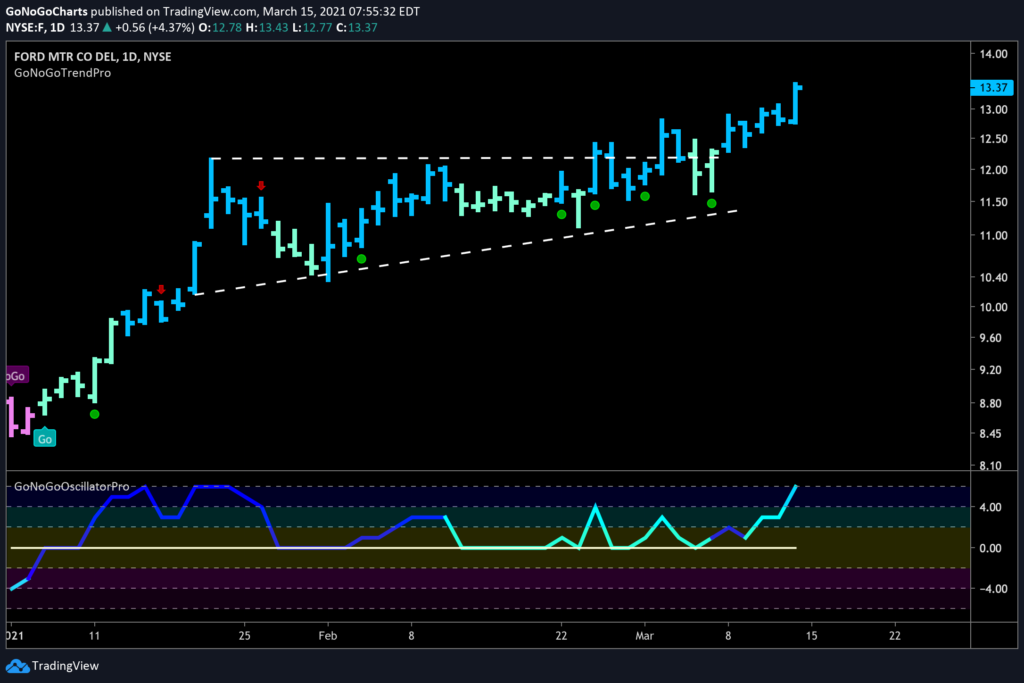
Shares of Ford Motor Company have been trending favorably for months now, and the GoNoGo daily chart below shows continued bullish activity.
- Throughout the current “Go” trend, GoNoGo Oscillator has found support at the zero line without exception
- Multiple low-risk entry icons (green circles) were triggered as the ascending triangle matured suggesting that price was going to break out
- Price hasn’t yet reached the measured move target from the height of the triangle
BELIEVE IN BITCOIN
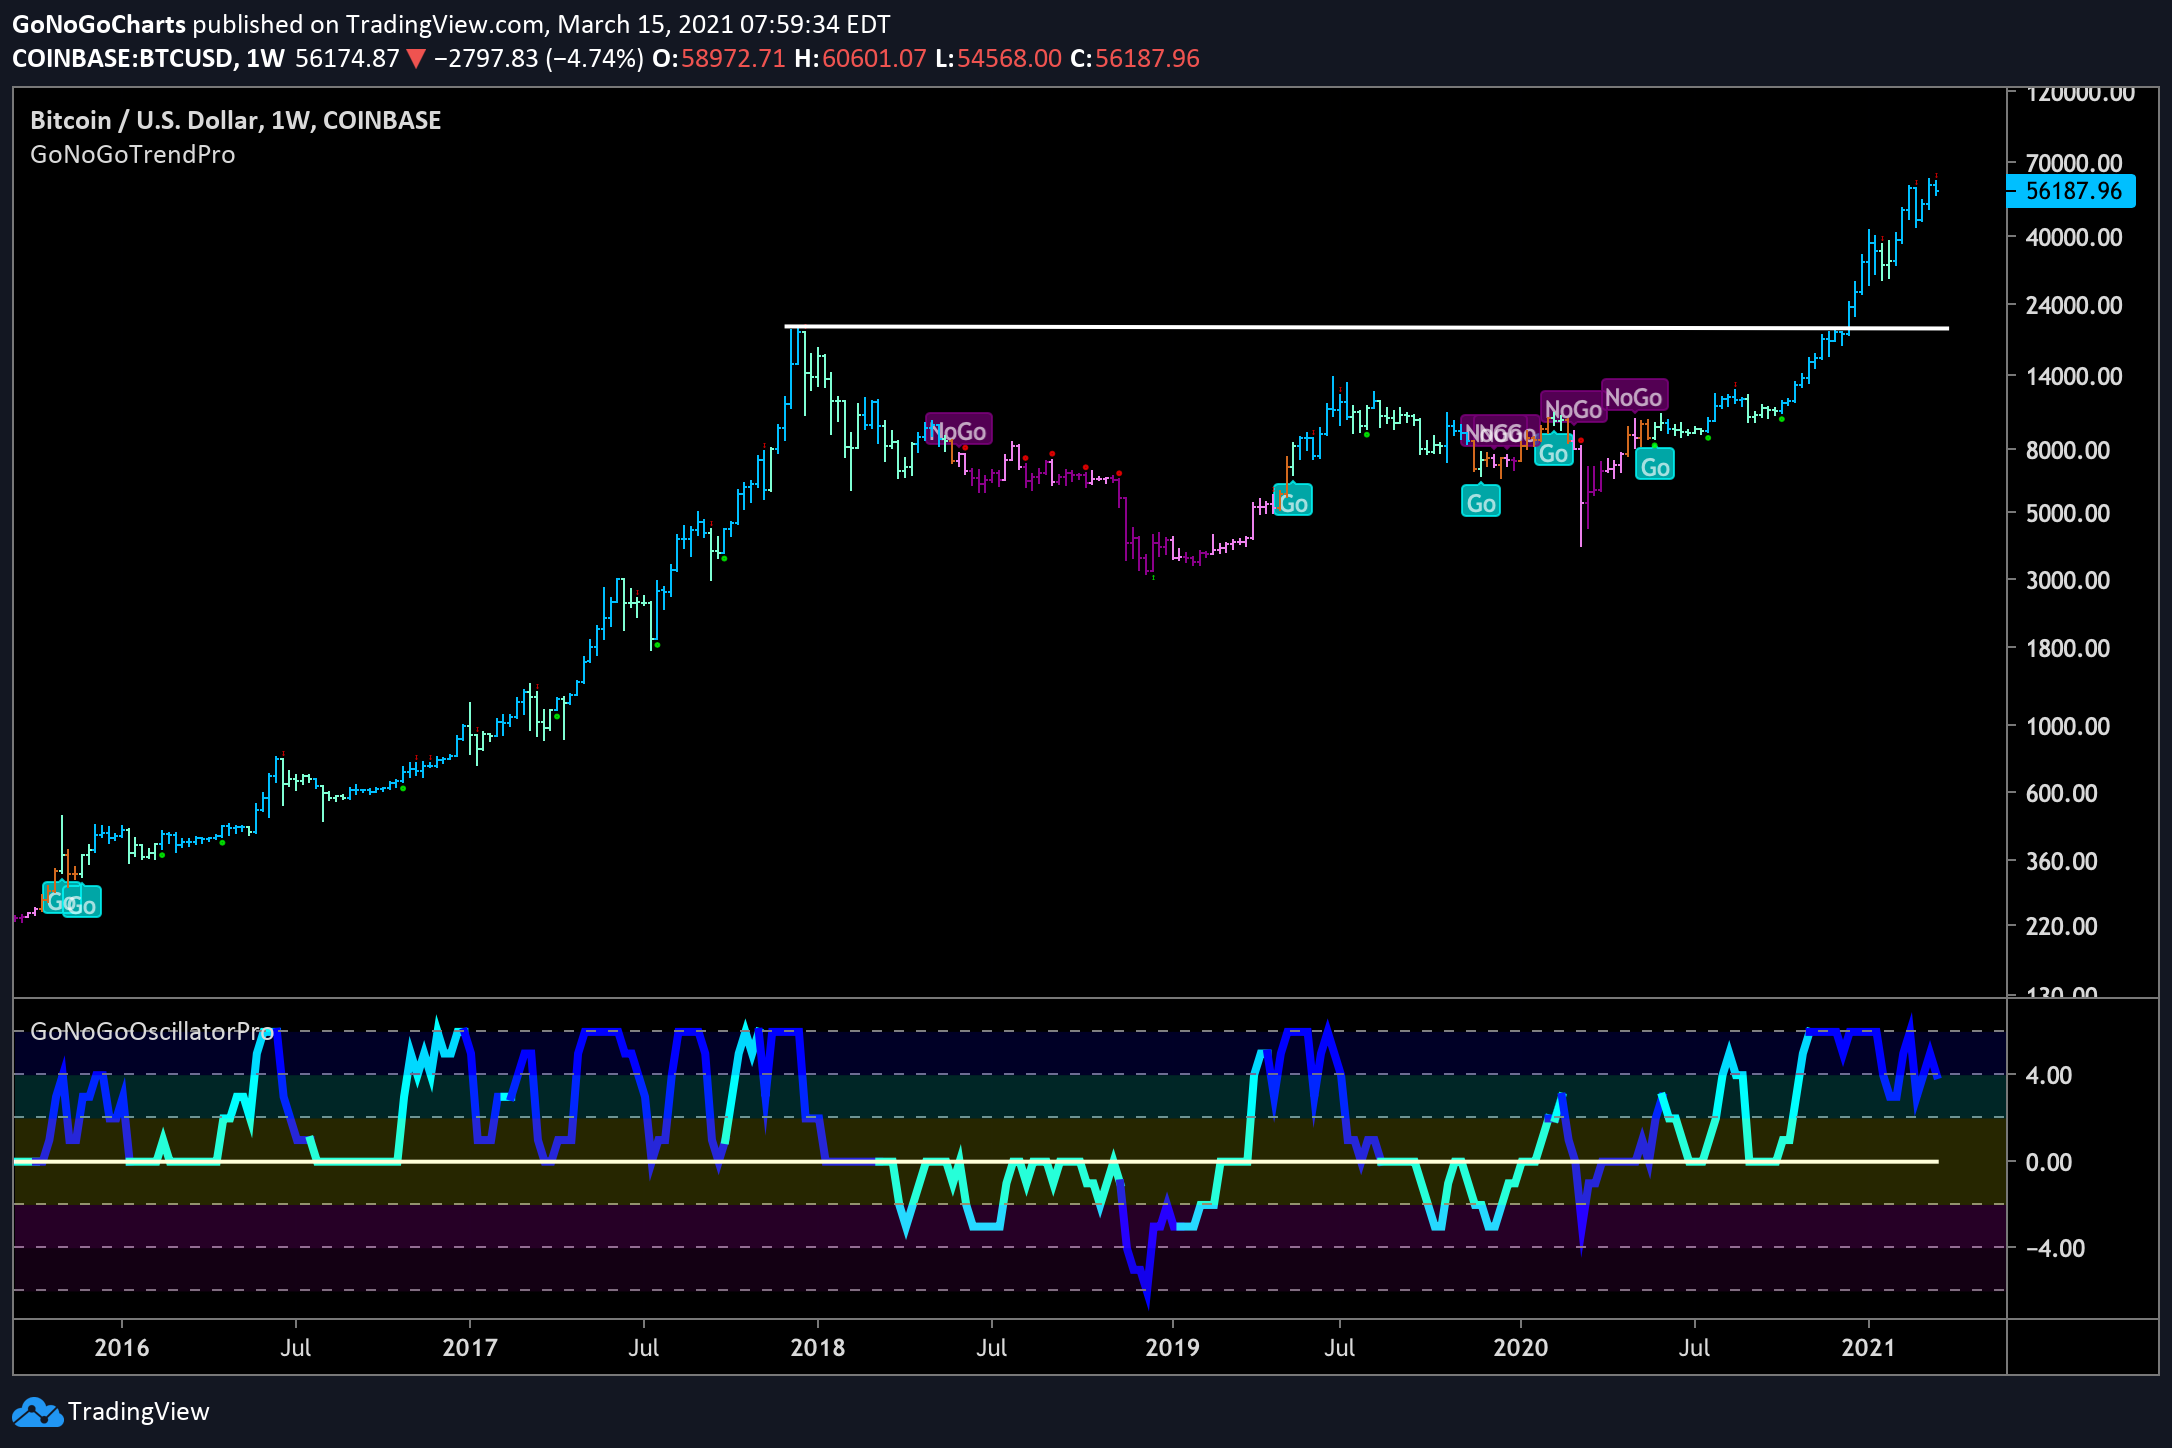
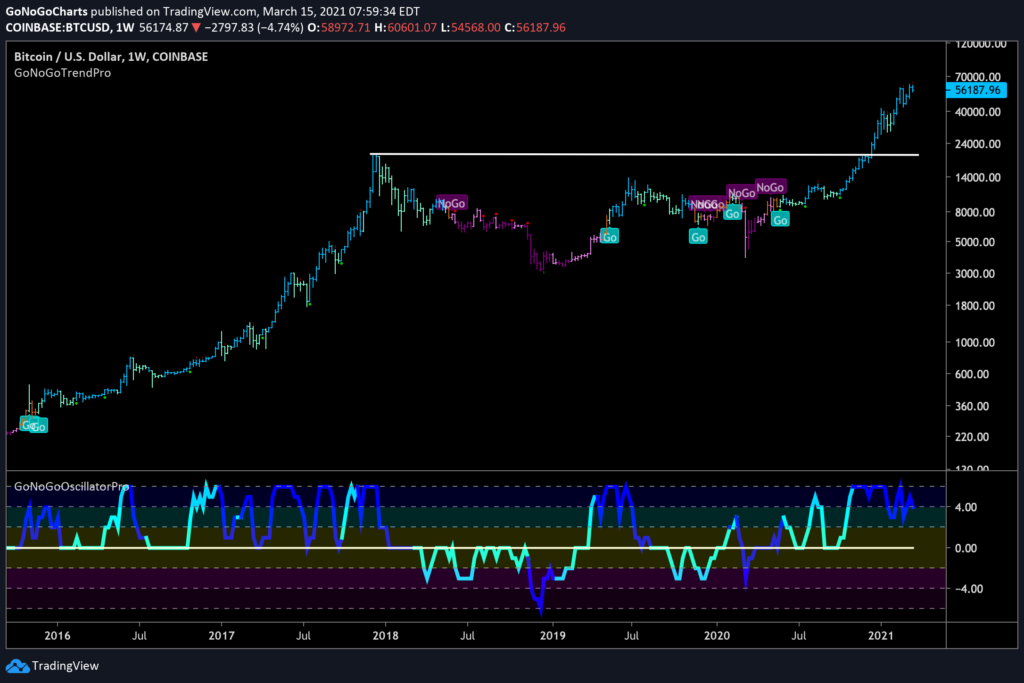
The weekly GoNoGo chart below depicts the incredible trend of the world’s most important cryptocurrency – Bitcoin. New highs have been made this week as the digital asset crossed above $60,000.
- Price continued to race higher after taking out the high from 2018
- Volume is heavy and buying is enthusiastic
- Zooming out to the longer timeframe, investors will notice that %-based moves on a logarithmic chart put some lofty prices within reach
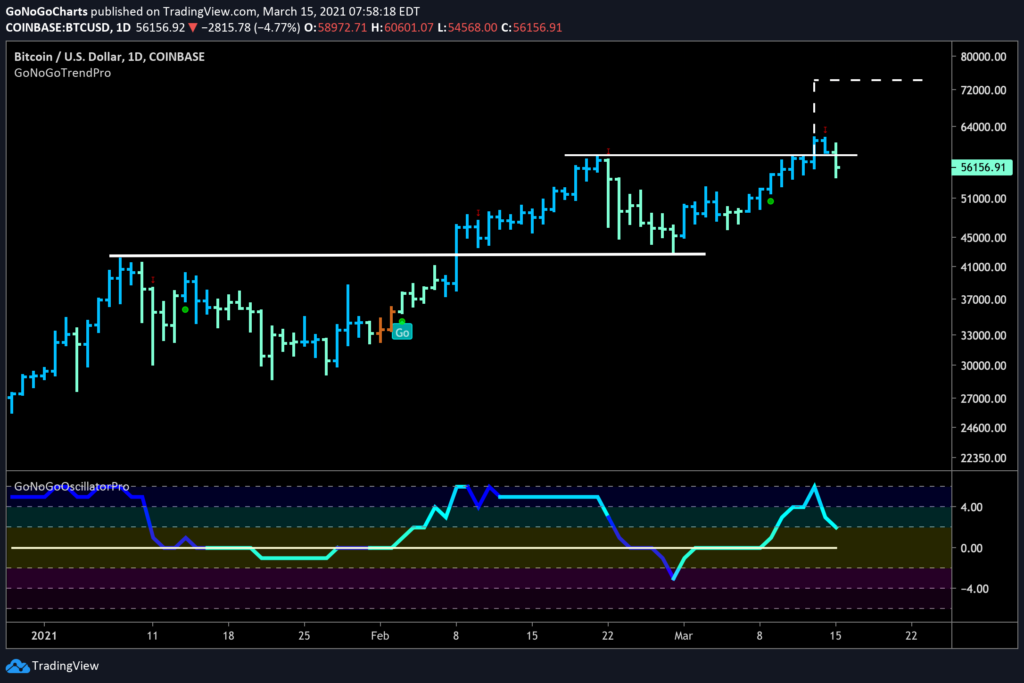
When looking at the daily chart, more detail regarding recent price action provides insights on what might lay ahead for Bitcoin.
- After breaking above $58,000, we will look to see if price can consolidate at these levels
- The green low-risk entry icon that came toward the end of the pullback from the high in February and suggested price would attack that level
- With no overhead supply to deal with, a measured move target of around $74,000 seems in reach
TIME TO RUN RIOT
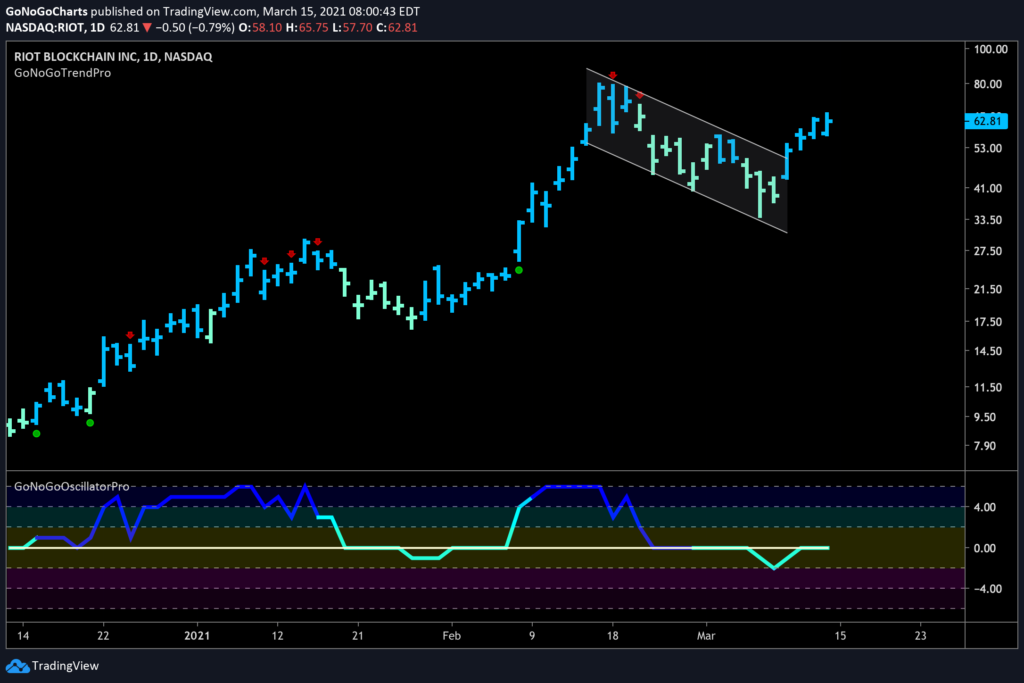
If there is to be a run higher in Bitcoin, then a company that engages in the provision of investment services to the blockchain ecosystem may be well-positioned to follow that trend. The daily GoNoGo chart below depicts the recent trend for $RIOT.
- After the recent high, price pulled back in the counter-trend channel
- GoNoGo Trend is now painting the strongest blue and appears to have broken out of the flag pattern
- GoNoGo Oscillator is at the zero line and we will look to see if it can rally into positive territory
- If this does happen, we will see a fresh low-risk entry icon (green circle) appear under the price bar
