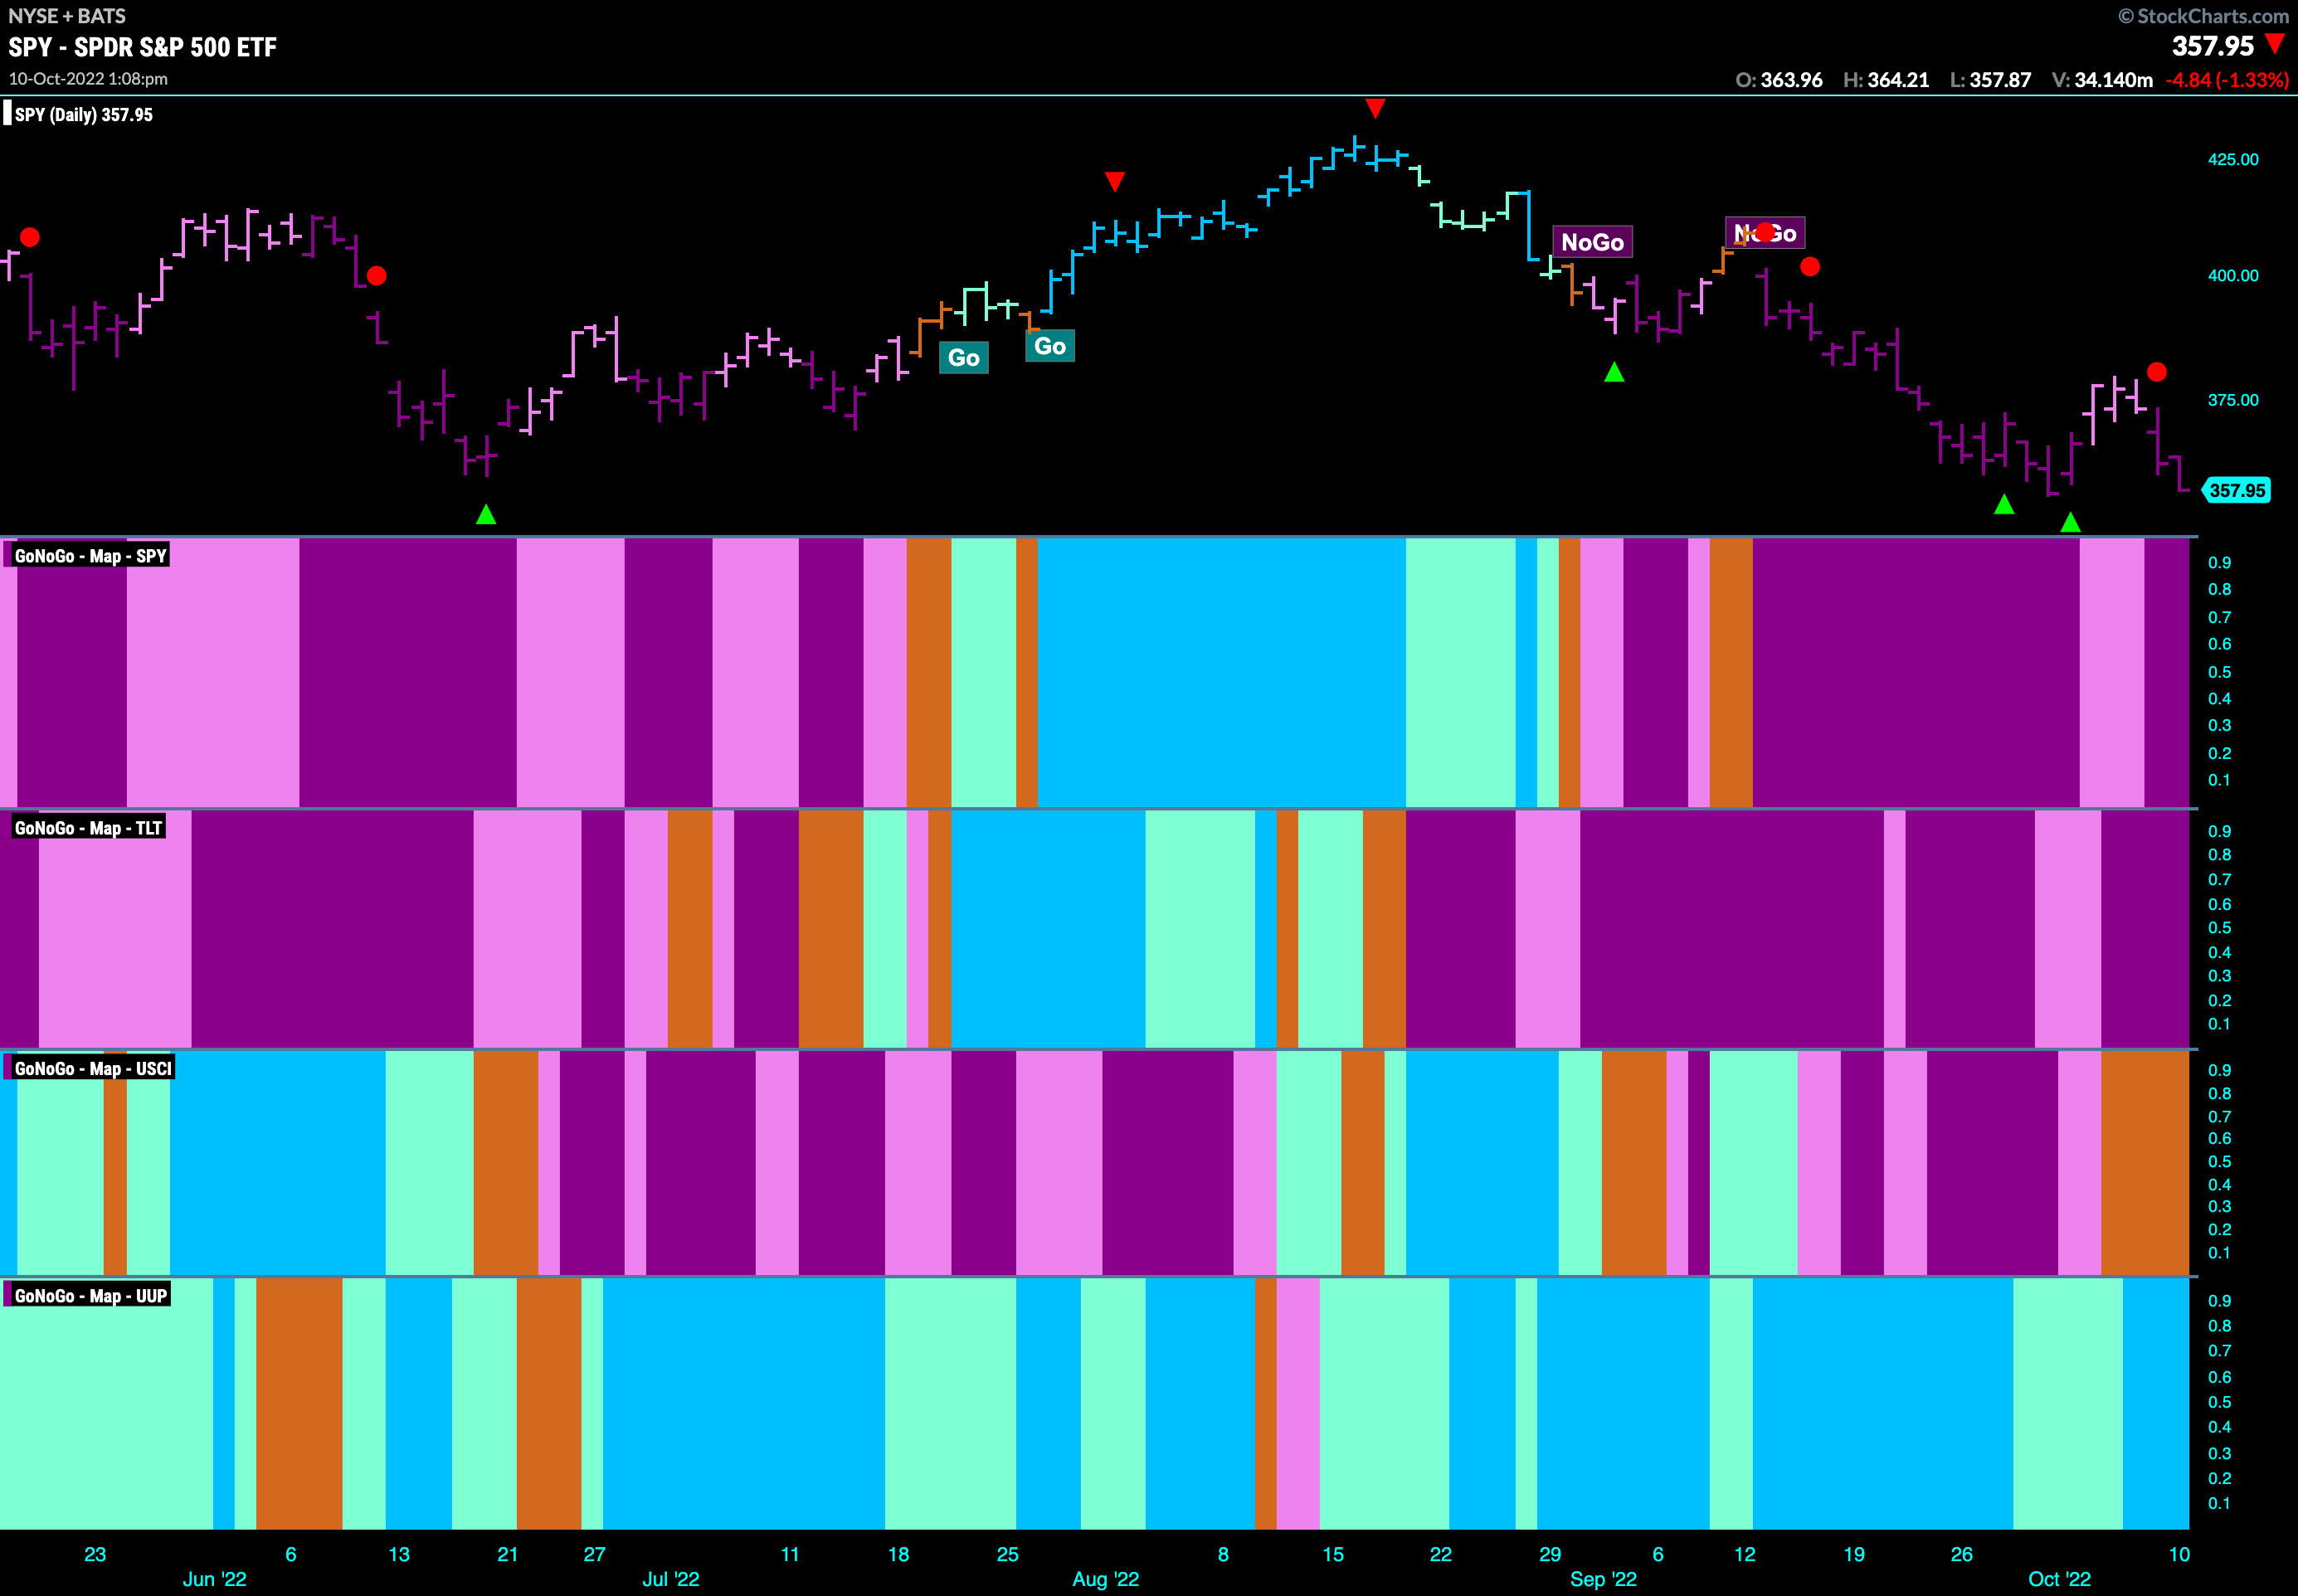
Good morning and welcome to this week’s Flight Path. Let’s take a look at the GoNoGo Asset map below. The brief 3 day relief rally we saw last week turns out to have been brief, but didn’t offer much relief as we are back testing recent lows. GoNoGo Trend shows that we are in a strong “NoGo” trend for U.S. equities. The same is true for treasury bond prices as we continue to see purple “NoGo” bars. Commodities are painting amber “Go Fish” bars as we see trend uncertainty. The dollar, continues to surprise, painting strong blue “Go” bars.
S&P 500 Quickly Returns to Test Lows
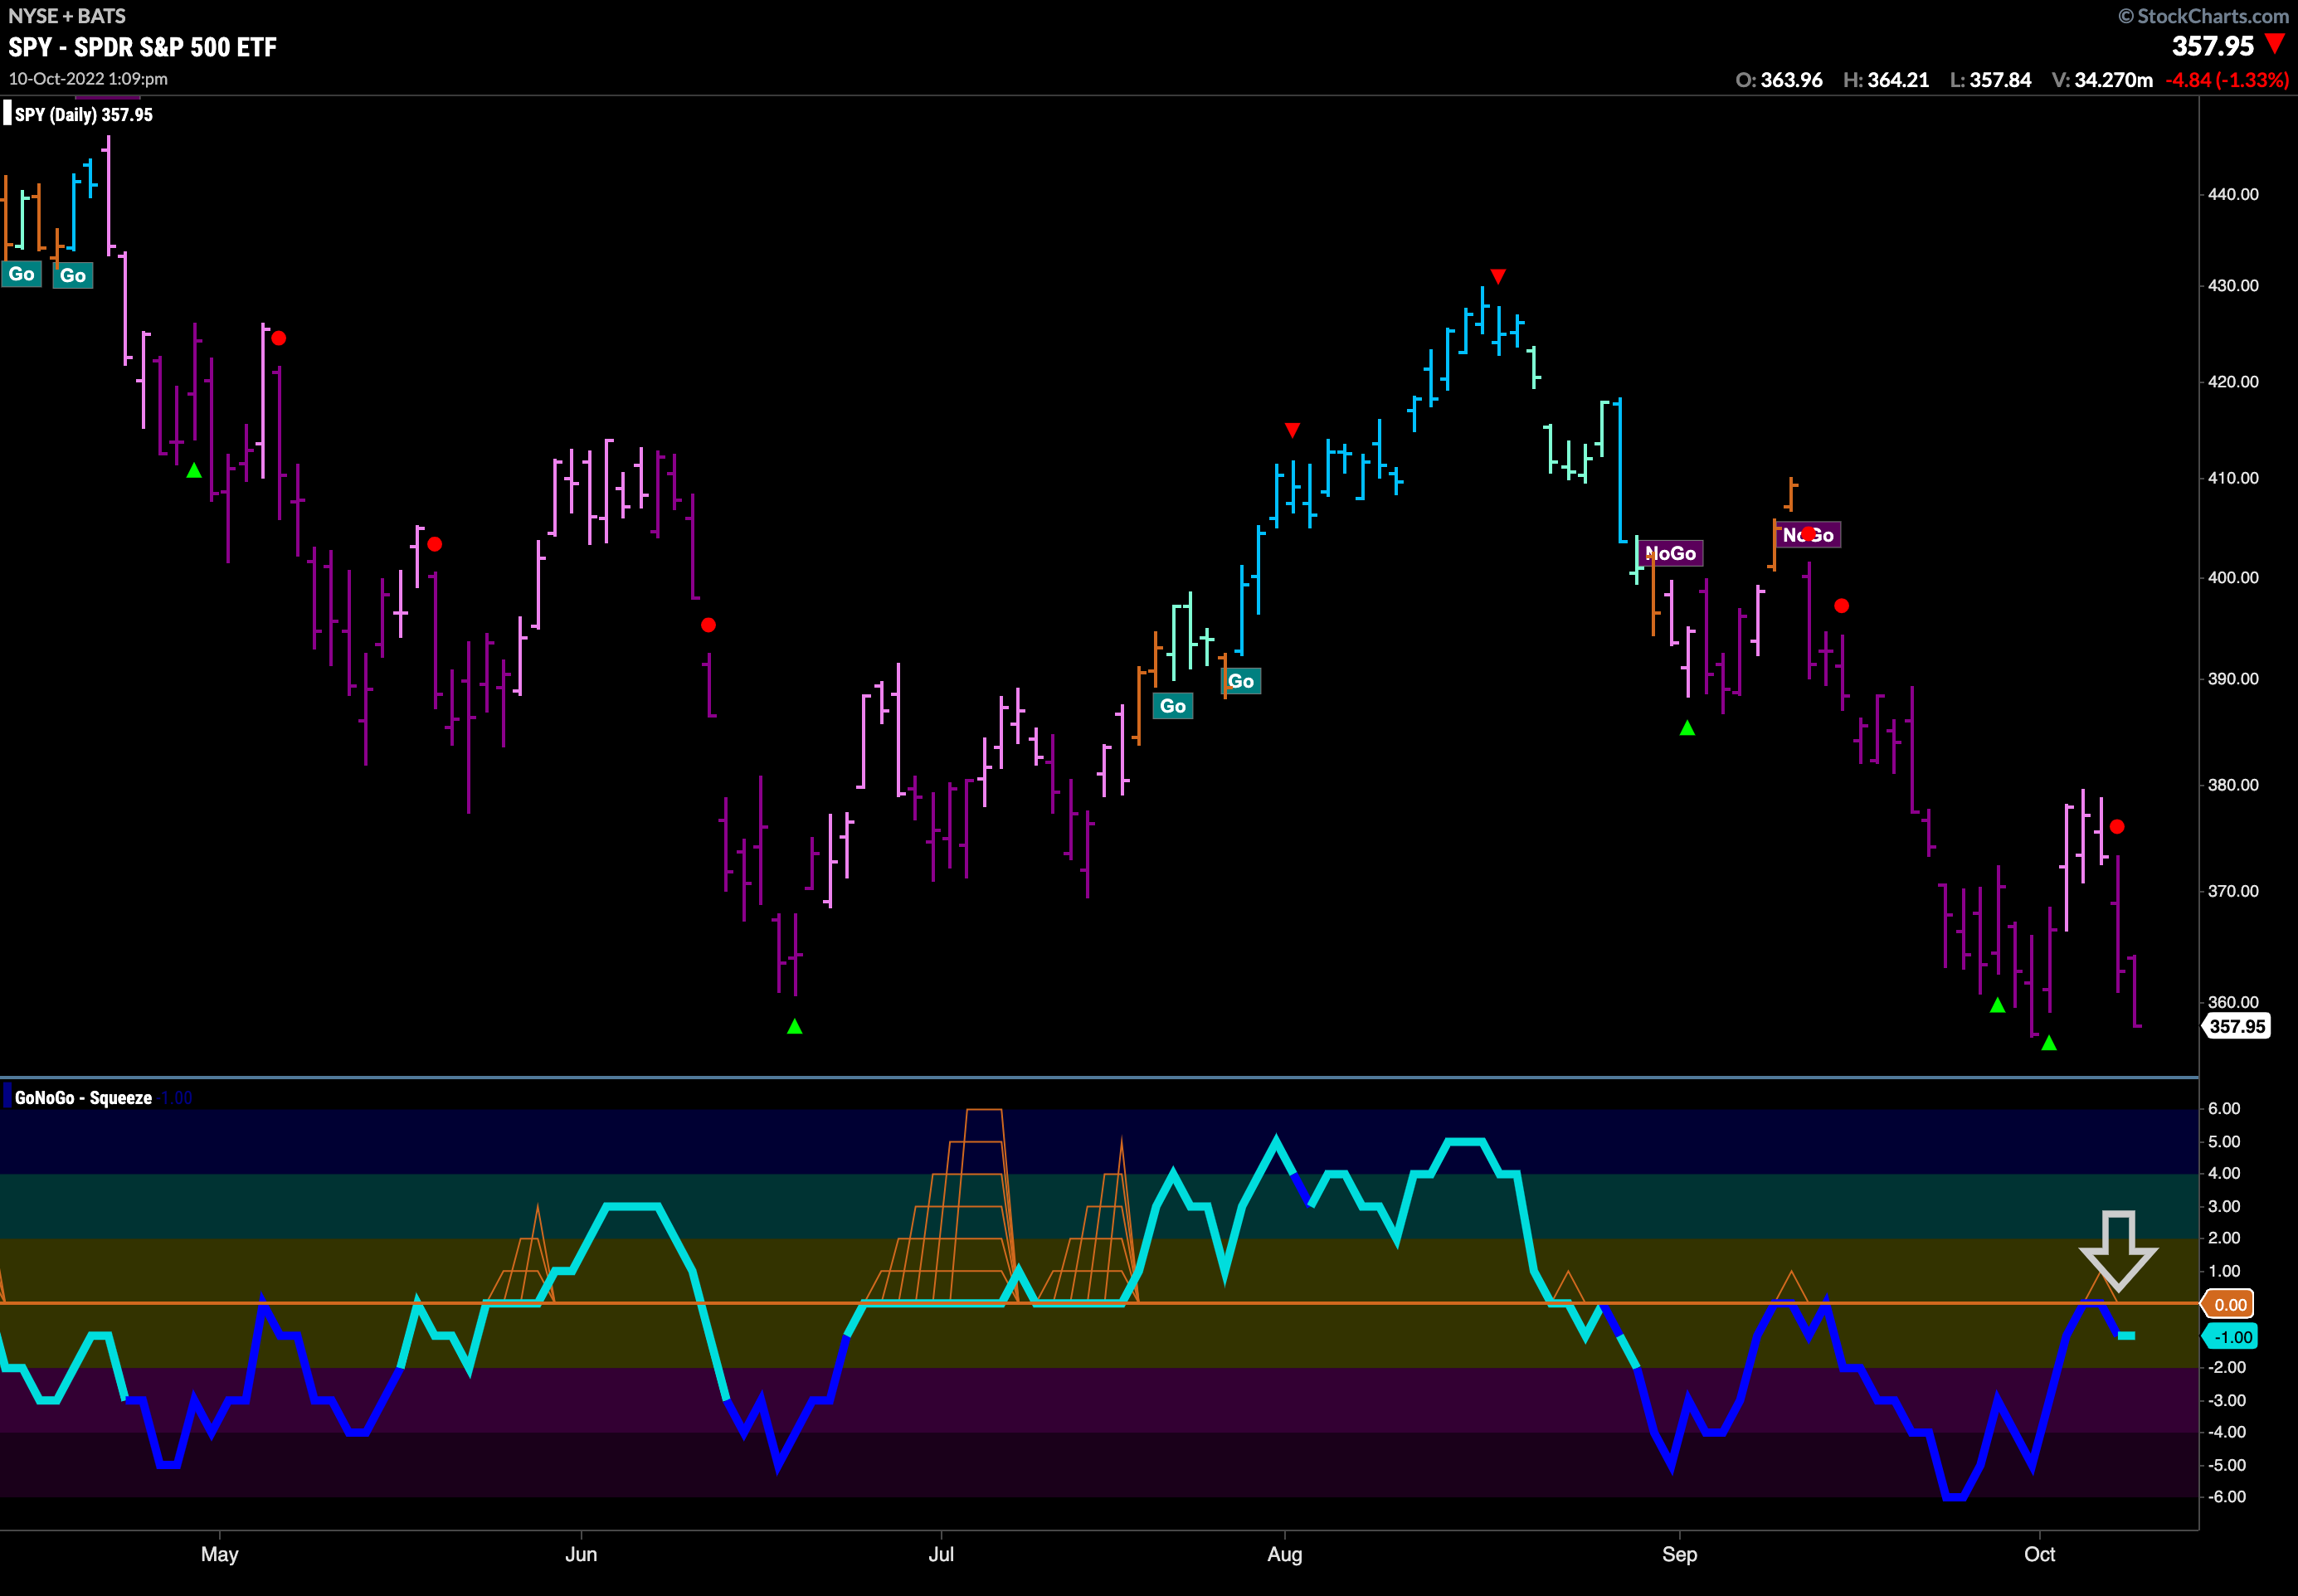
After a strong few days last week equities have succumbed to the pressure of the “NoGo” trend they are in. We have seen a return to strong purple bars over the last two sessions as price tests last week’s lows. This is becoming an important level as it is also the low from June that we are testing. GoNoGo Oscillator has been turned away by the zero line on heavy volume which has triggered a NoGo Trend Continuation Icon (red circle) to appear over Friday’s bar. This tells us that momentum is back in the direction of the “NoGo” trend.
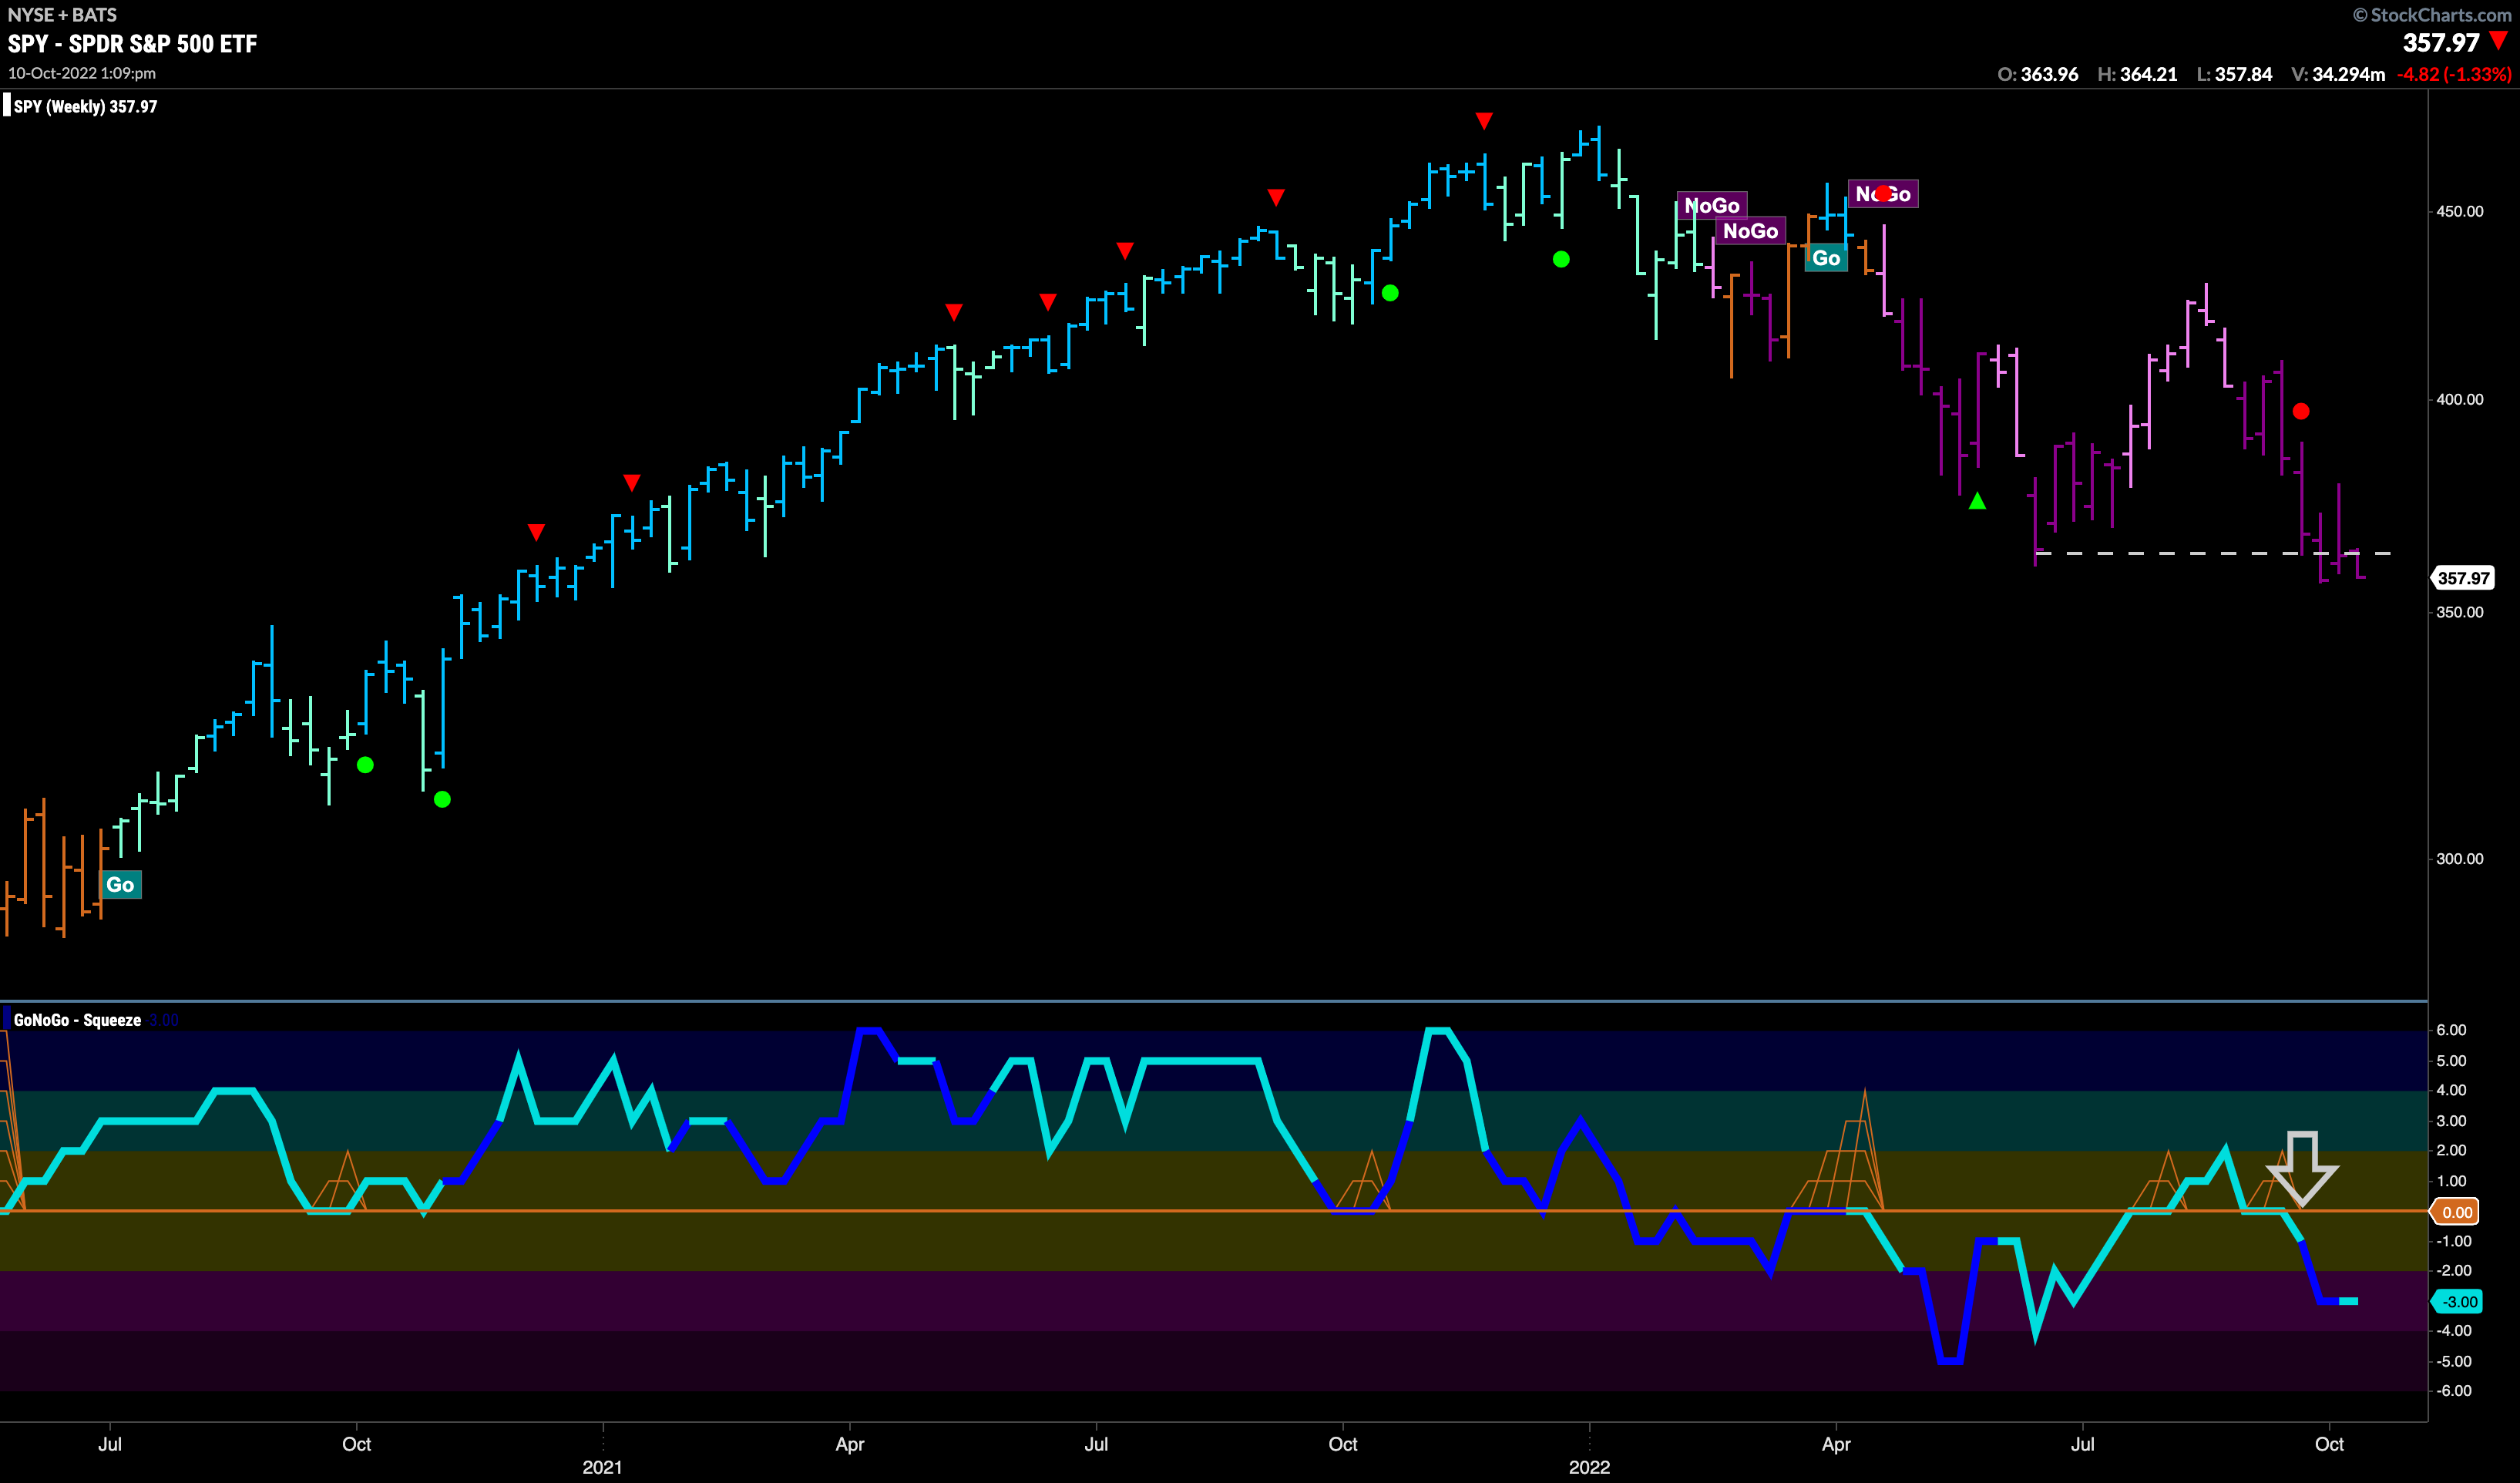
The weekly chart shows that we are in the same boat. GoNoGo Trend paints strong purple bars as we creep under horizontal support from the June low. GoNoGo Oscillator has quickly returned to negative territory. The weight of the evidence suggests that the trend is down and that we are making a new lower low.
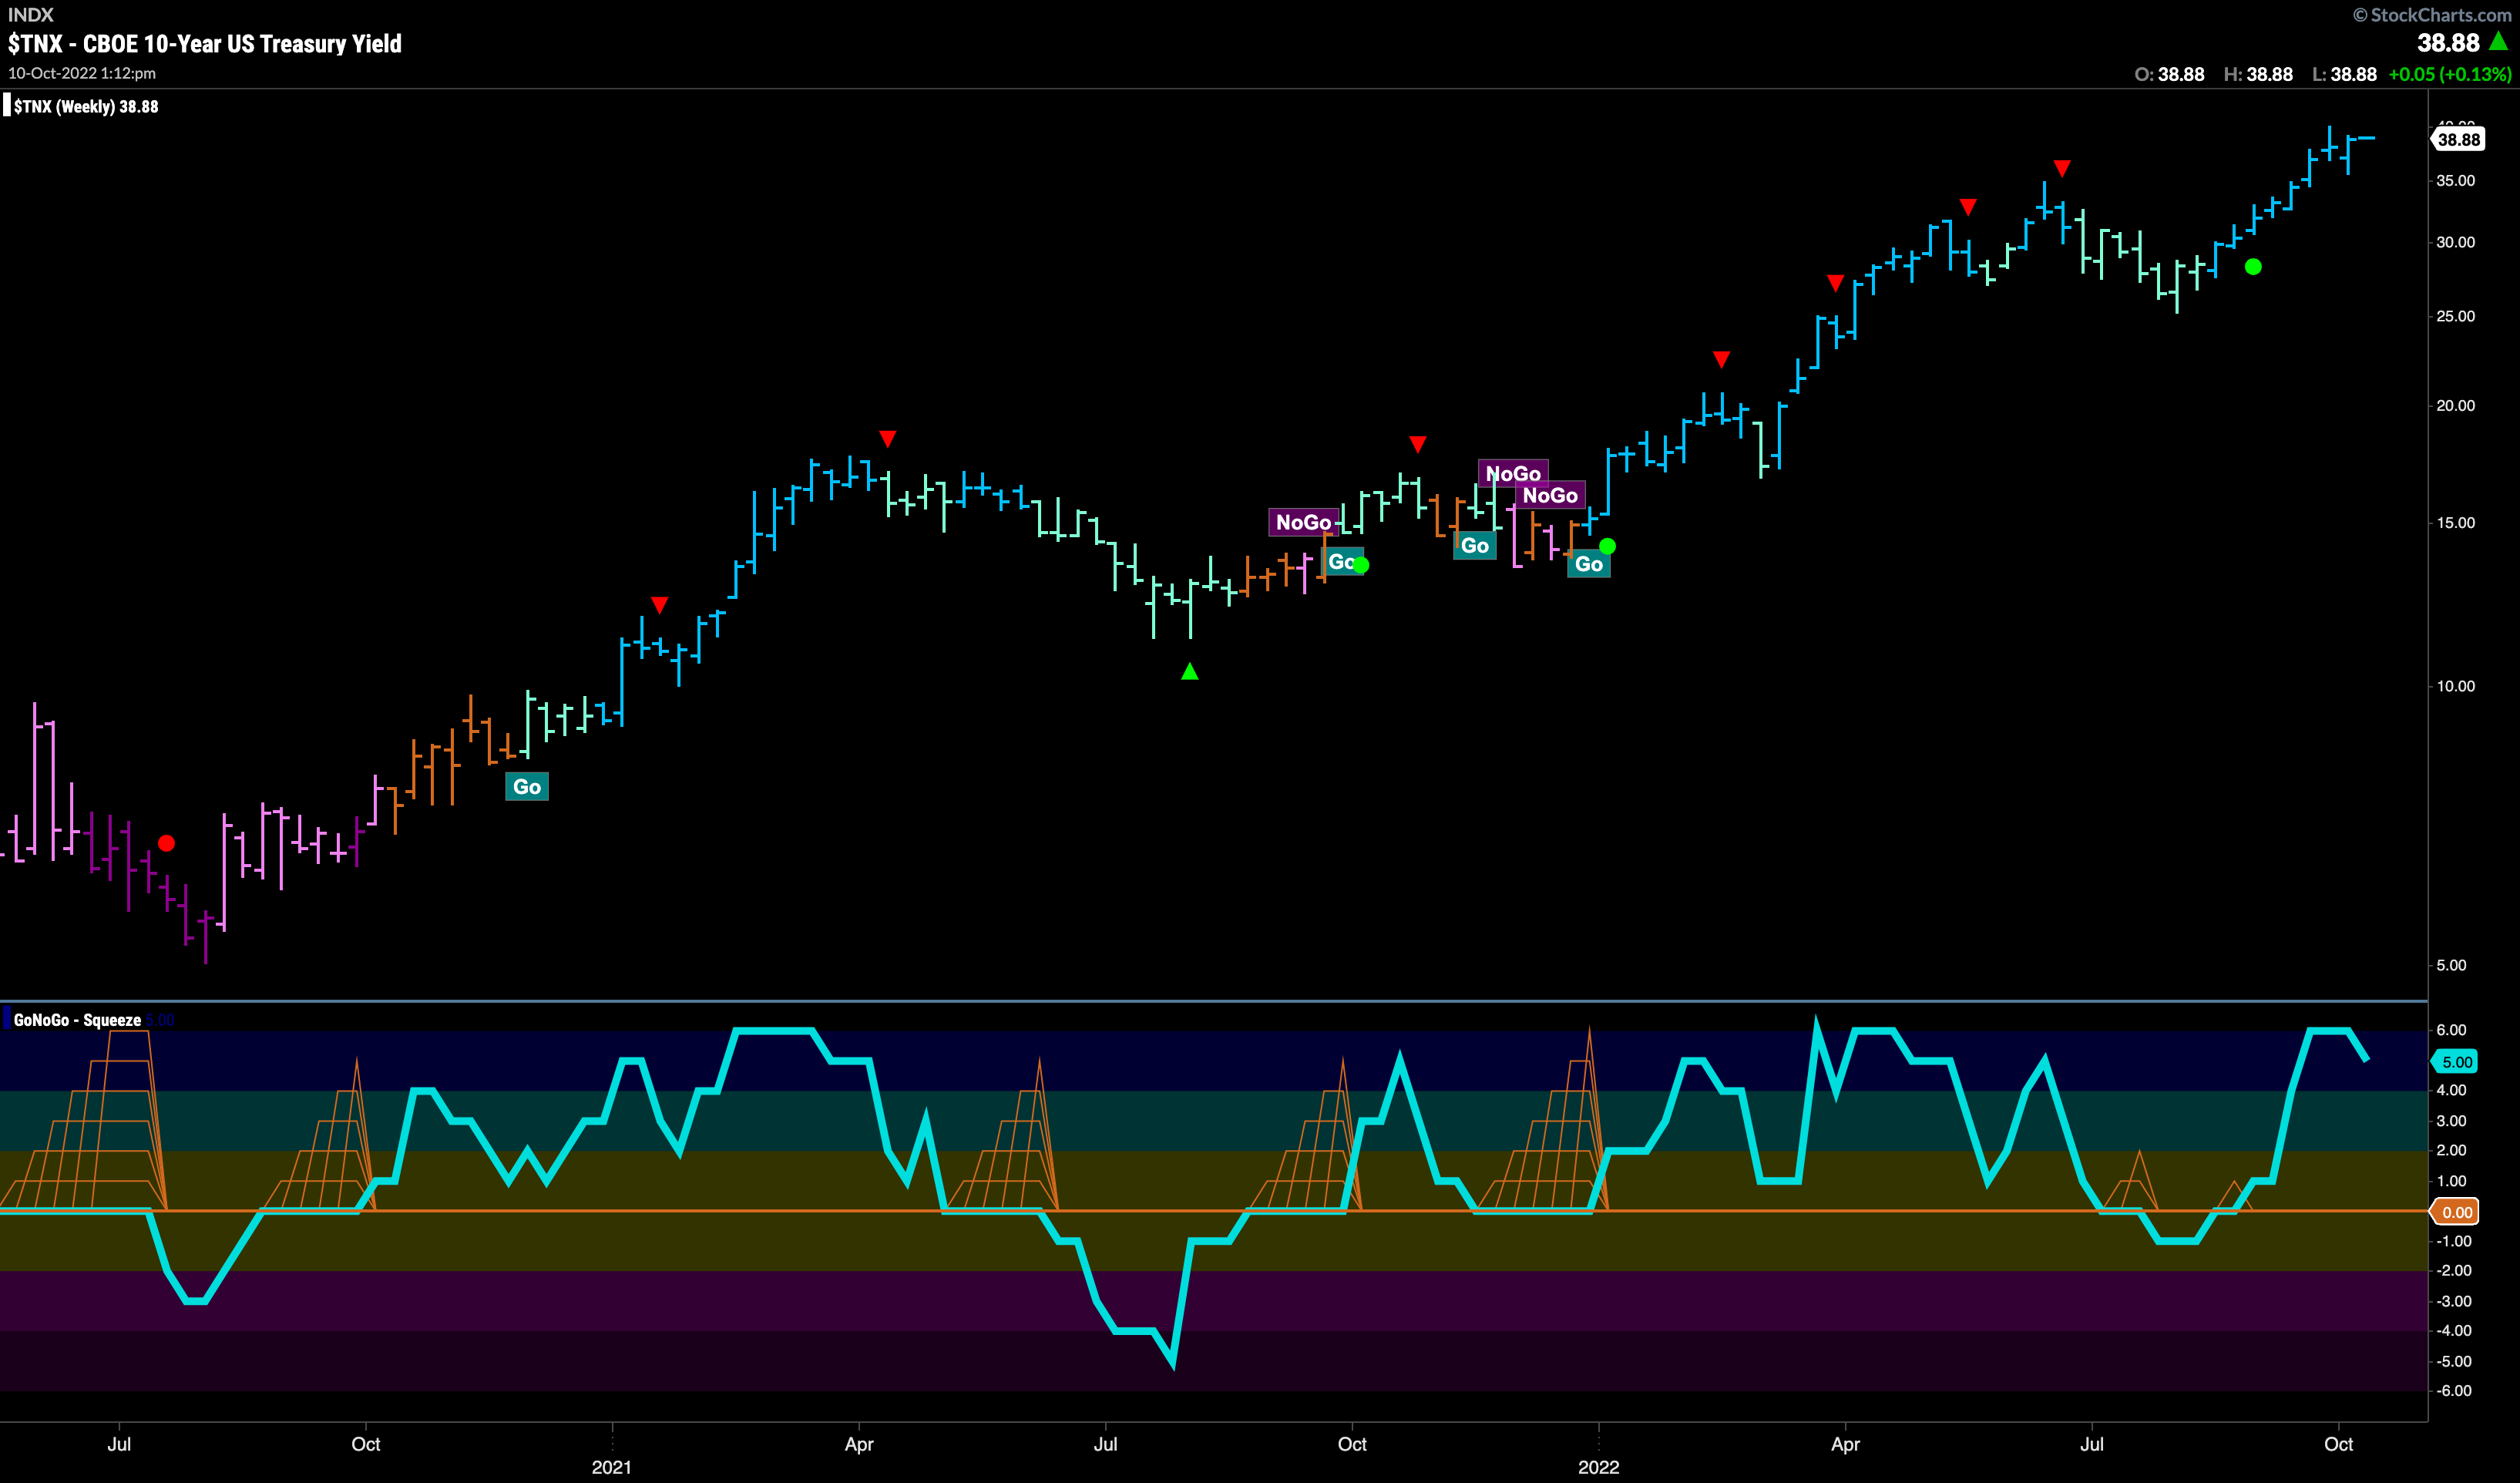
Treasury Rates Hit New Highs as “Go” Firmly in Place
Price raced higher last week as we hit another higher high on a string of uninterrupted blue “Go” bars. GoNoGo Oscillator confirmed moving firmly into positive territory and is now falling from oversold levels. We anticipate a Go Countertrend Correction Icon (red arrow) as the oscillator moves to neutral. This may indicate a short term pause in the speed of price gains.
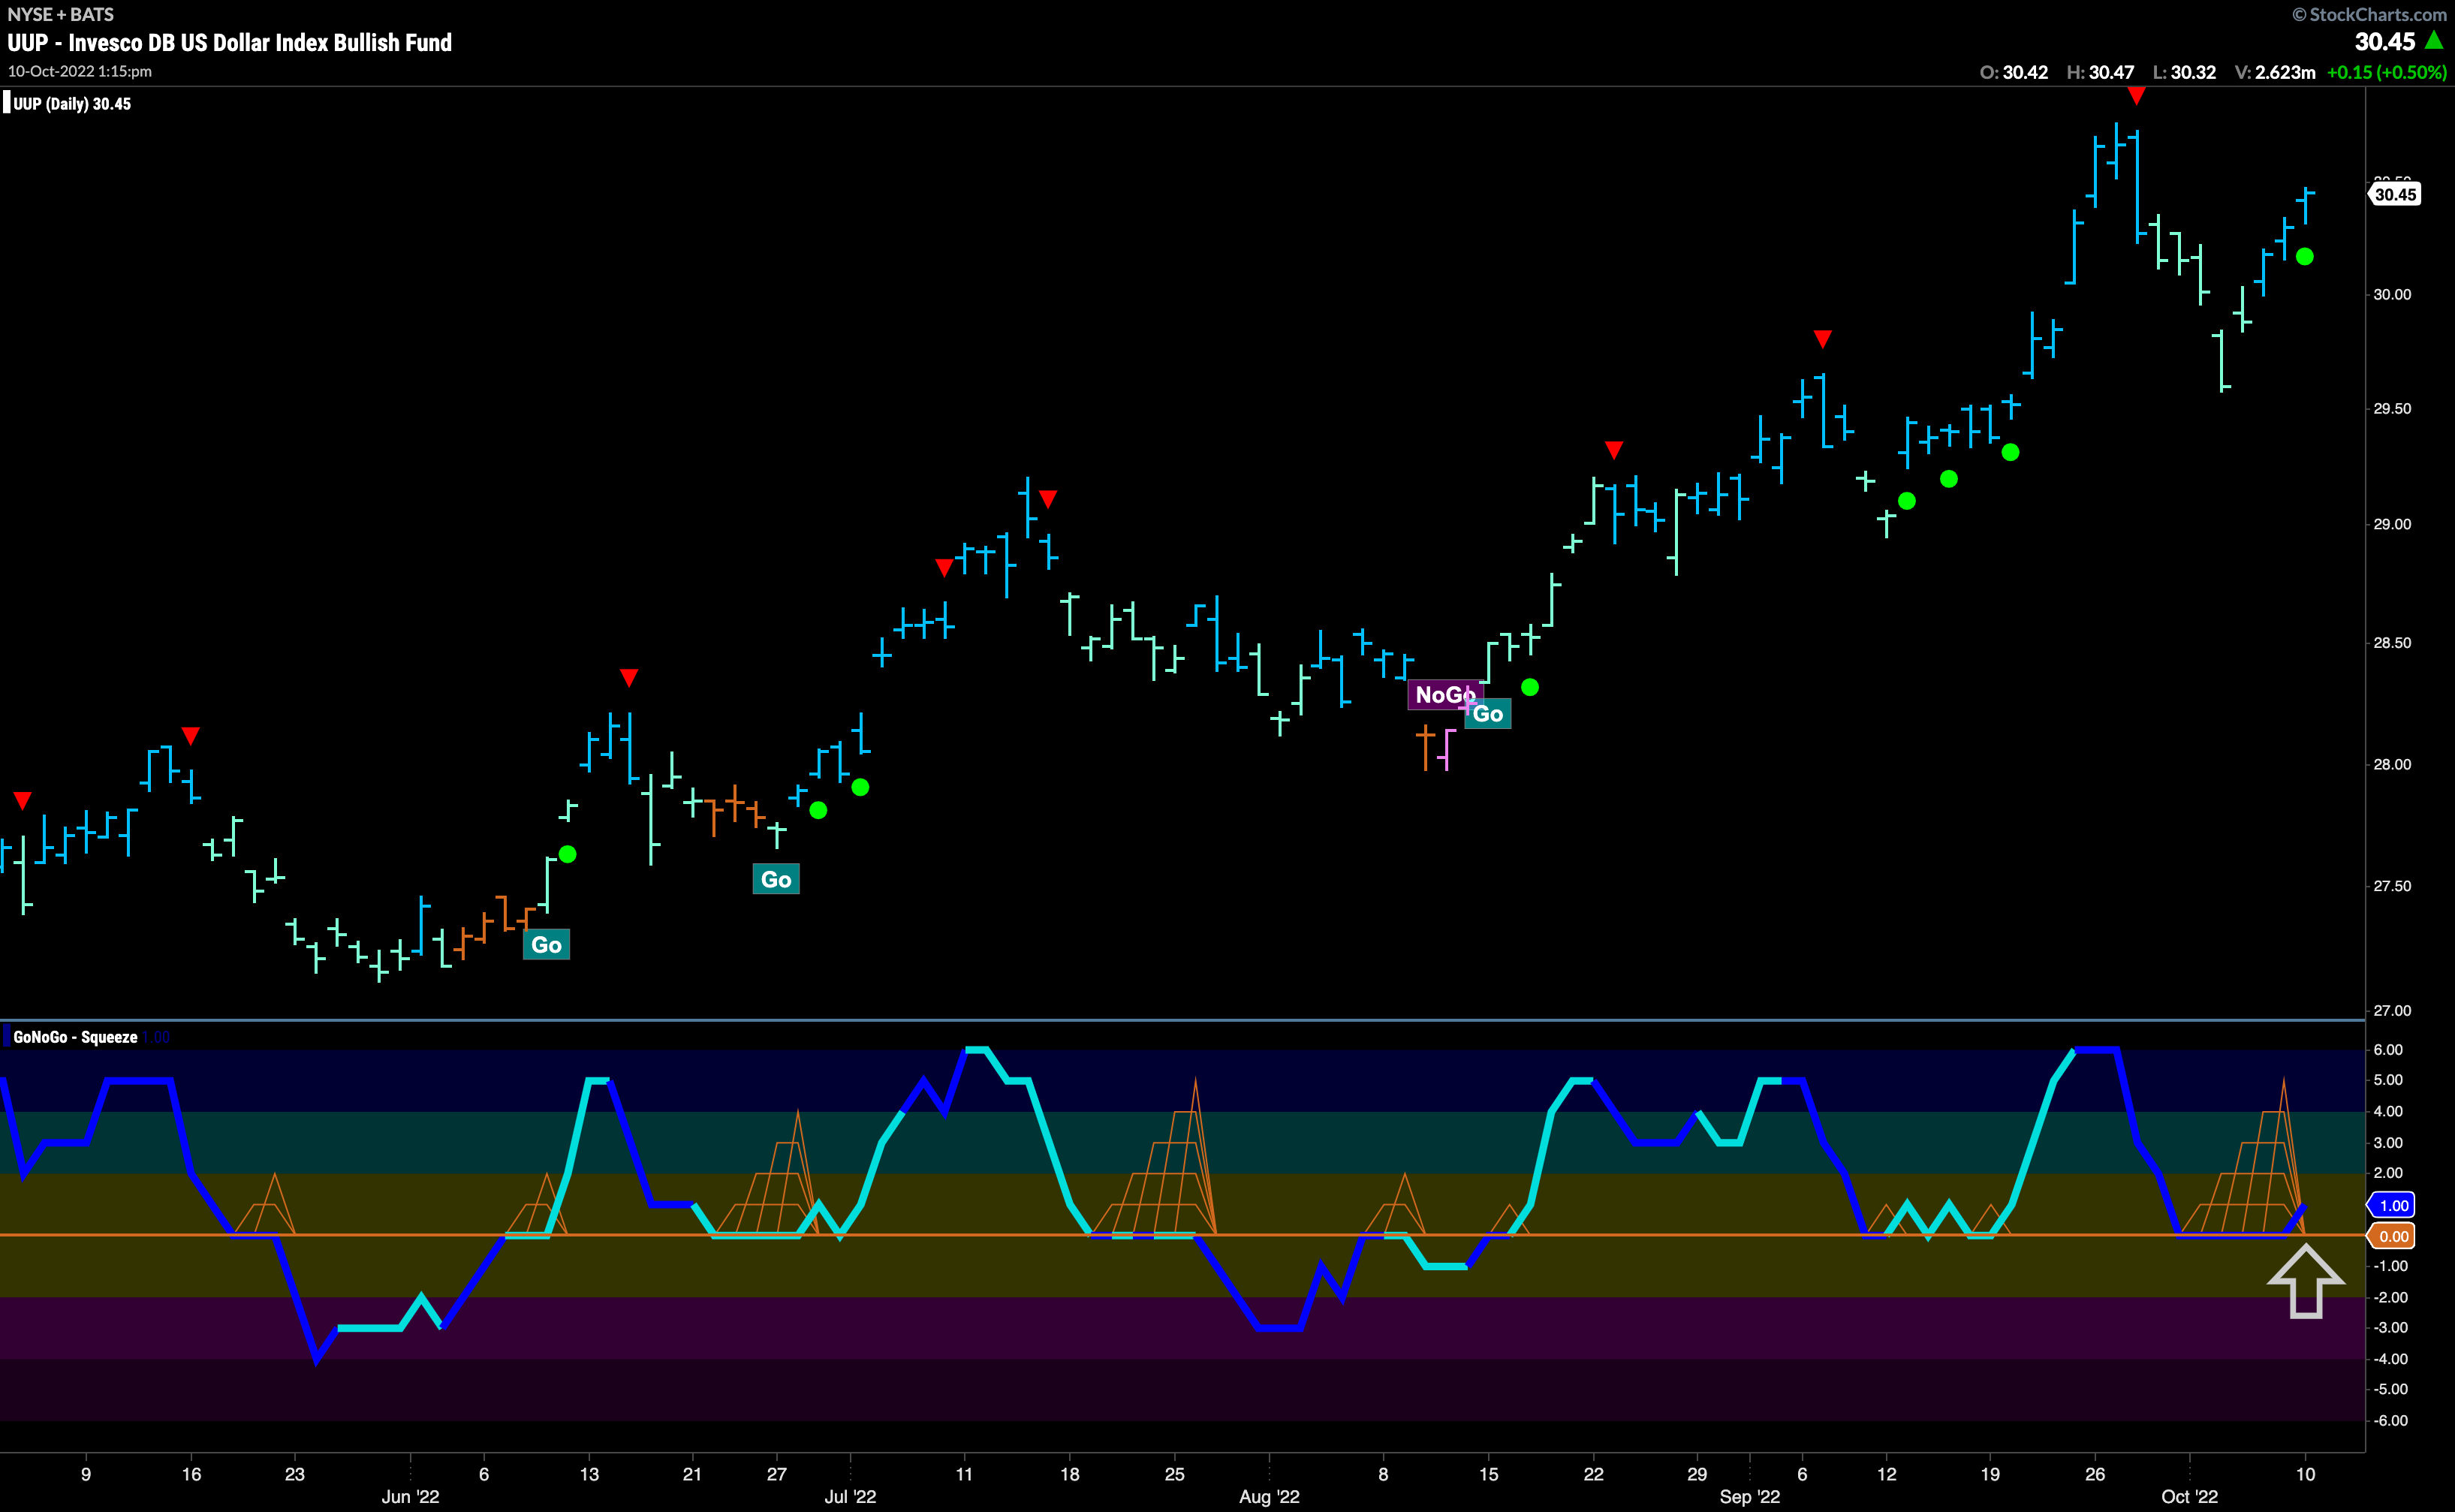
Dollar Found the Support it was Looking For
We saw the dollar retreat from highs last week as the equity market attempted to move higher. We noted, in our Flight Path last week that the dollar was looking for support as the trend weakened. As price painted weaker aqua bars, GoNoGo Oscillator fell to test the zero line on heavy volume. As momentum remained non directional we saw the grid of the GoNoGo Squeeze climb near max levels. Now, we are seeing the Squeeze being broken to the upside as momentum returns in the direction of the “Go” trend. A fresh set of strong blue “Go” bars now sees a Go Trend Continuation Icon (green circle) suggesting we may mount an attack on the prior high.
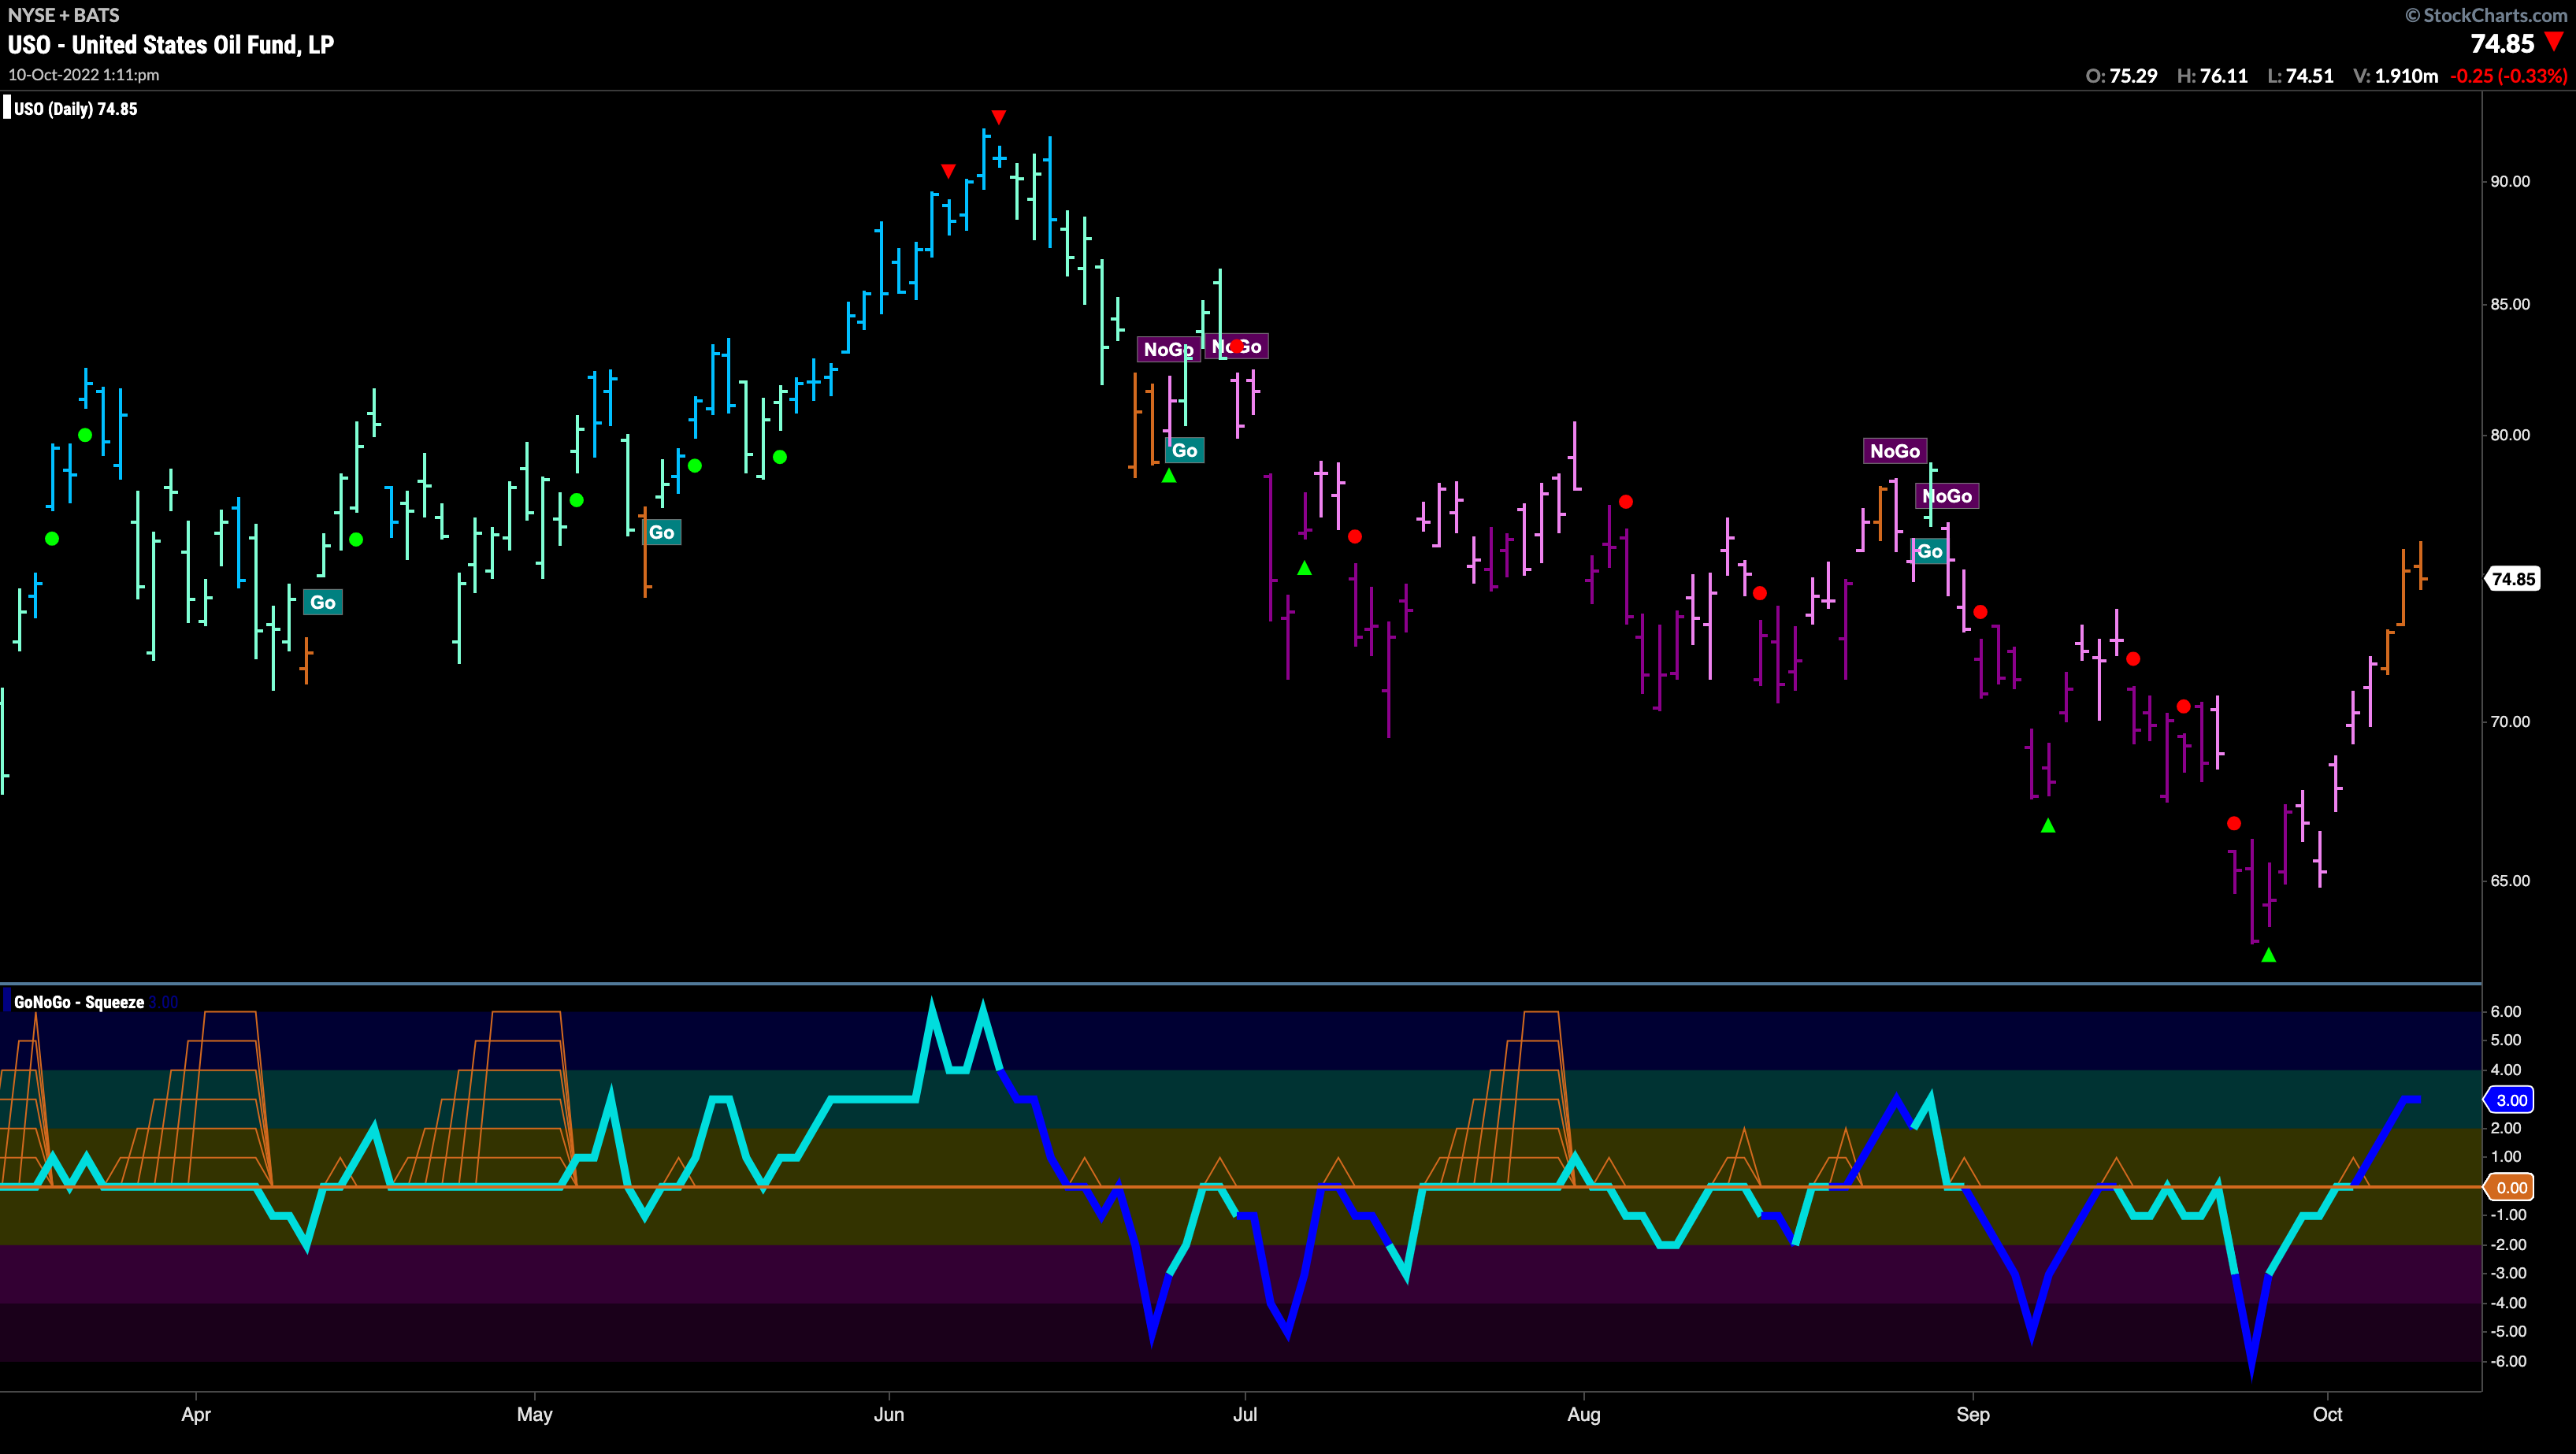
Oil Flashes Uncertain “Go Fish” bars
Below is the daily GoNoGo Chart for $USO. We have seen a strong rally off the lows that has seen GoNoGo Trend move through purple to pink and now to amber “Go Fish” bars. We see this strong price movement confirmed by GoNoGo Oscillator breaking above the zero line on heavy volume. We will look to see if this rally can see the start of a “Go” trend of if the “NoGo” will return.
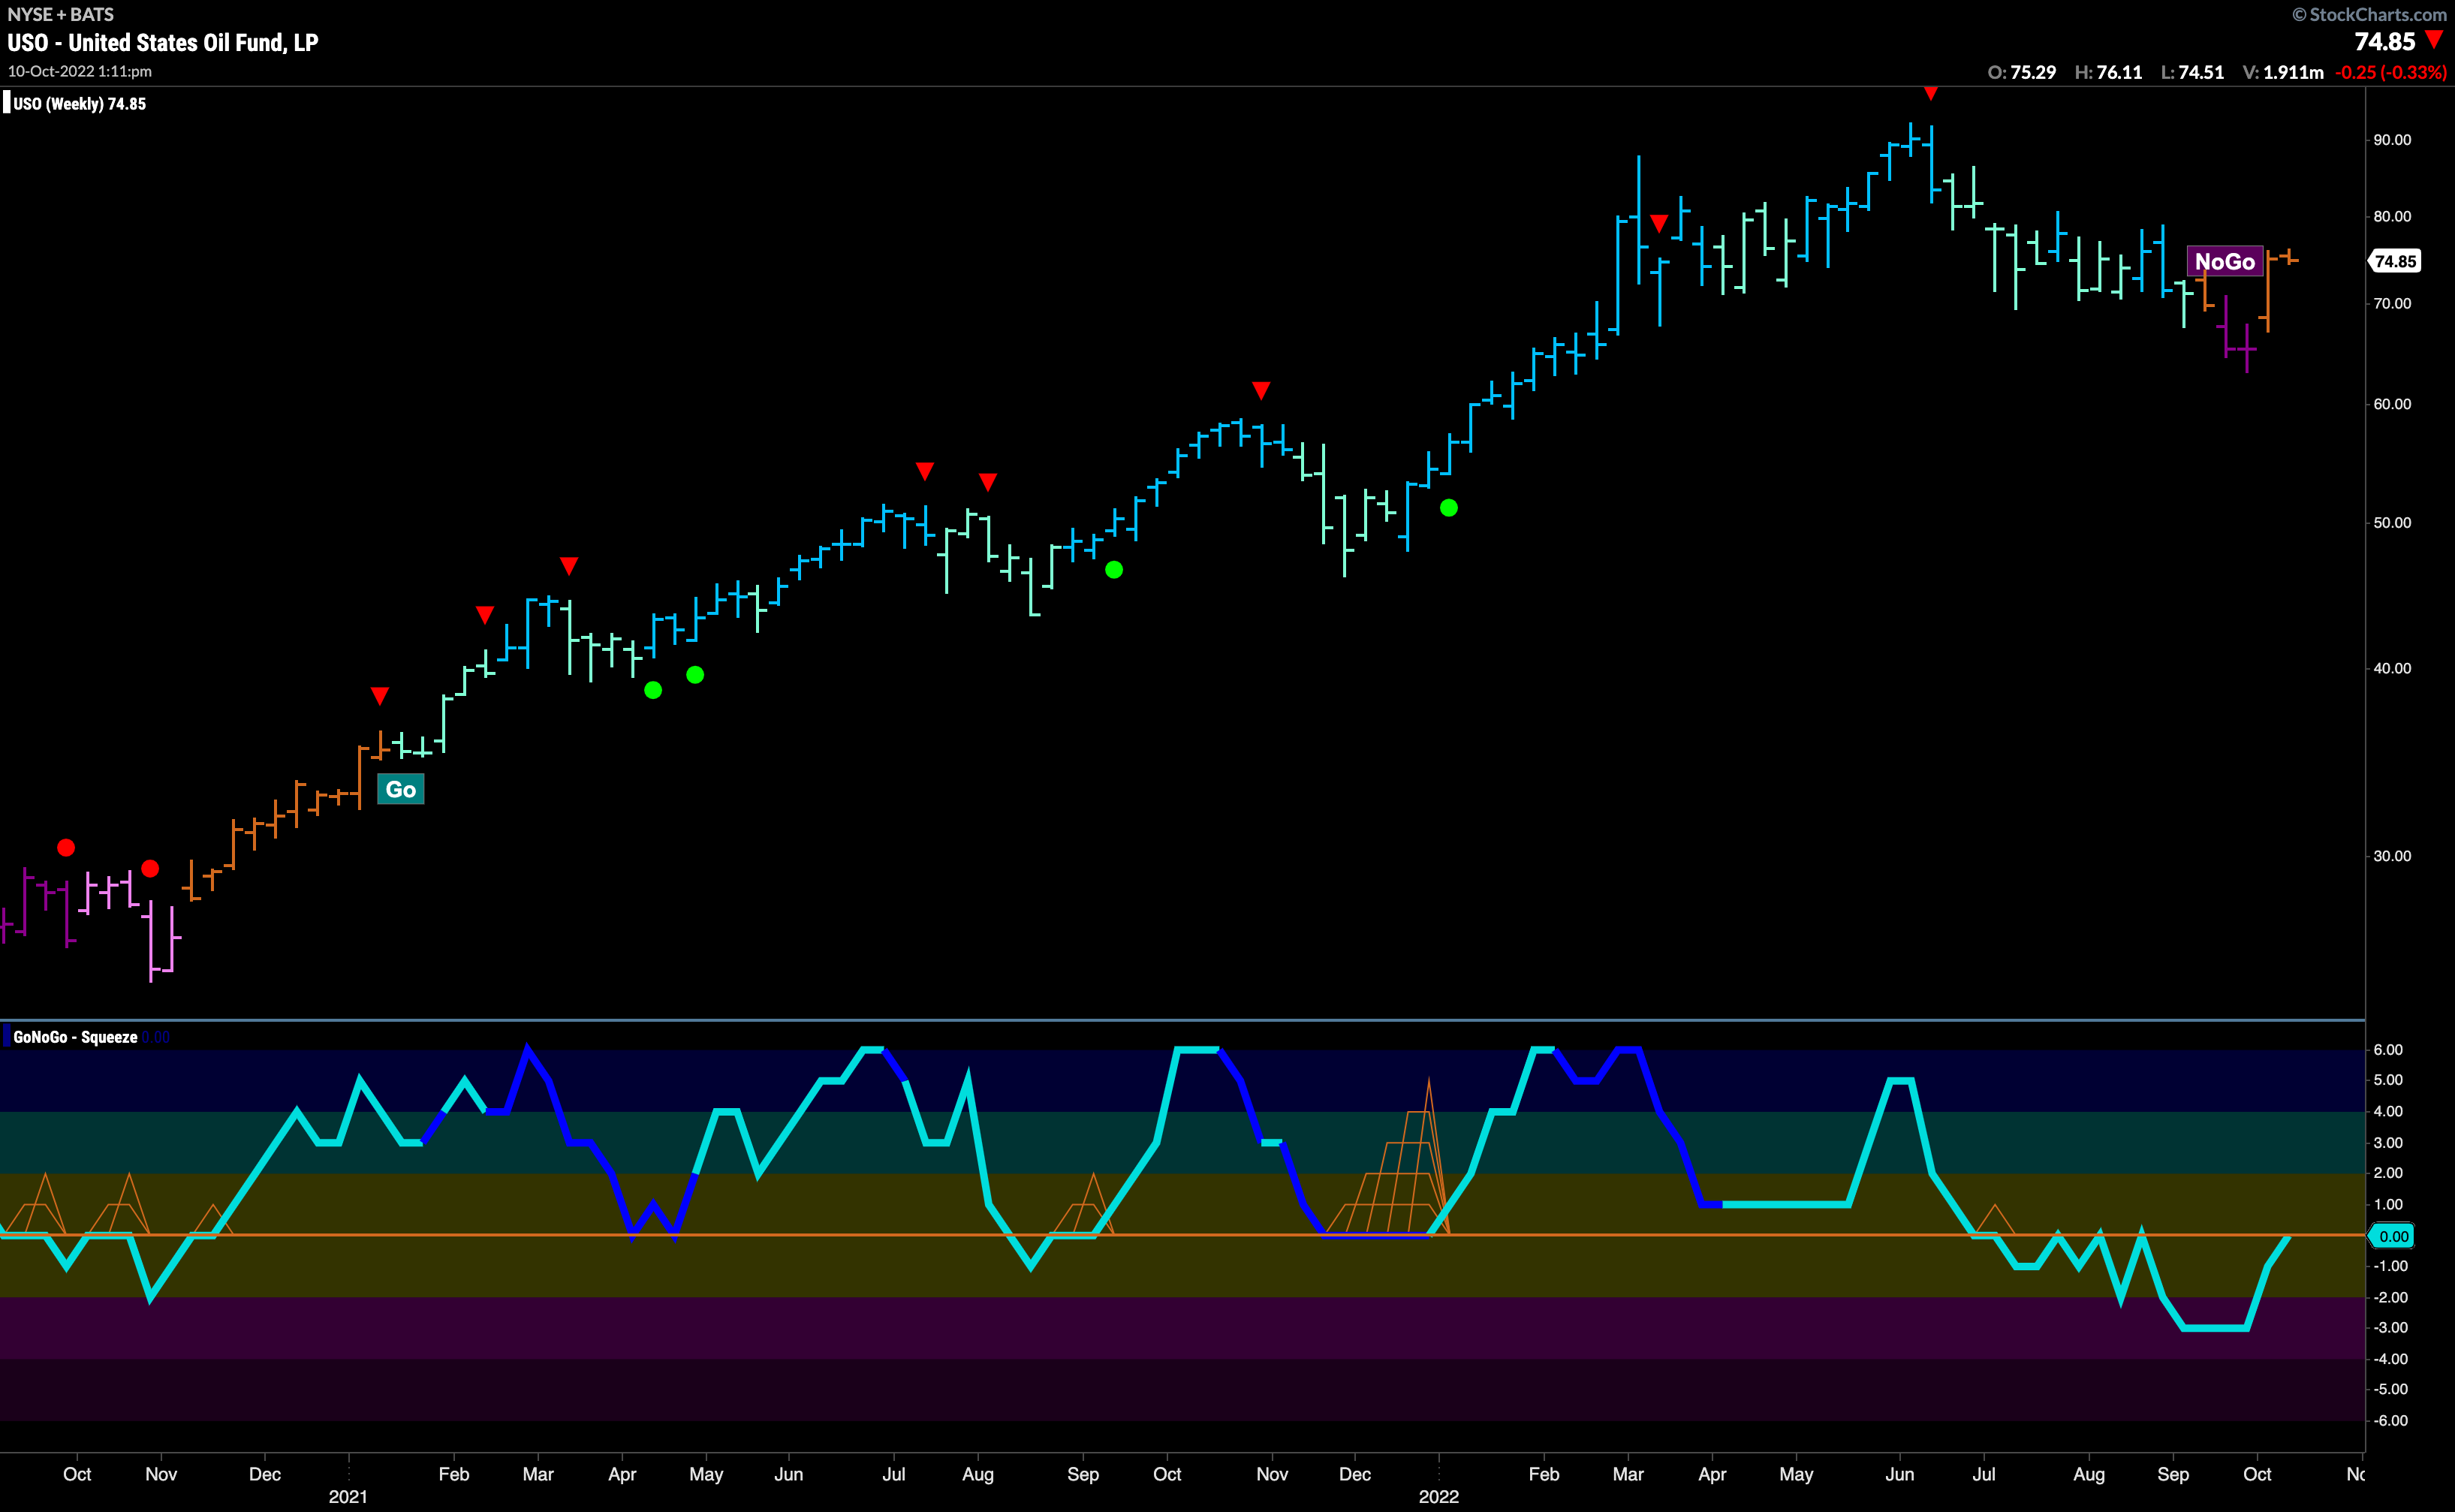
The weekly Oil chart tells a similar story as the new “NoGo” trend is quickly challenged. Last week saw an amber “Go Fish” bar emerge after only a couple of purple “NoGo” bars. We look to the oscillator for clues as it rises to test the zero line from below. If a change in trend back to a “Go” is to happen, GoNoGo Oscillator will need to break back into positive territory here. A rejection by the zero line will likely see a return to “NoGo” bars.
Sector RelMap
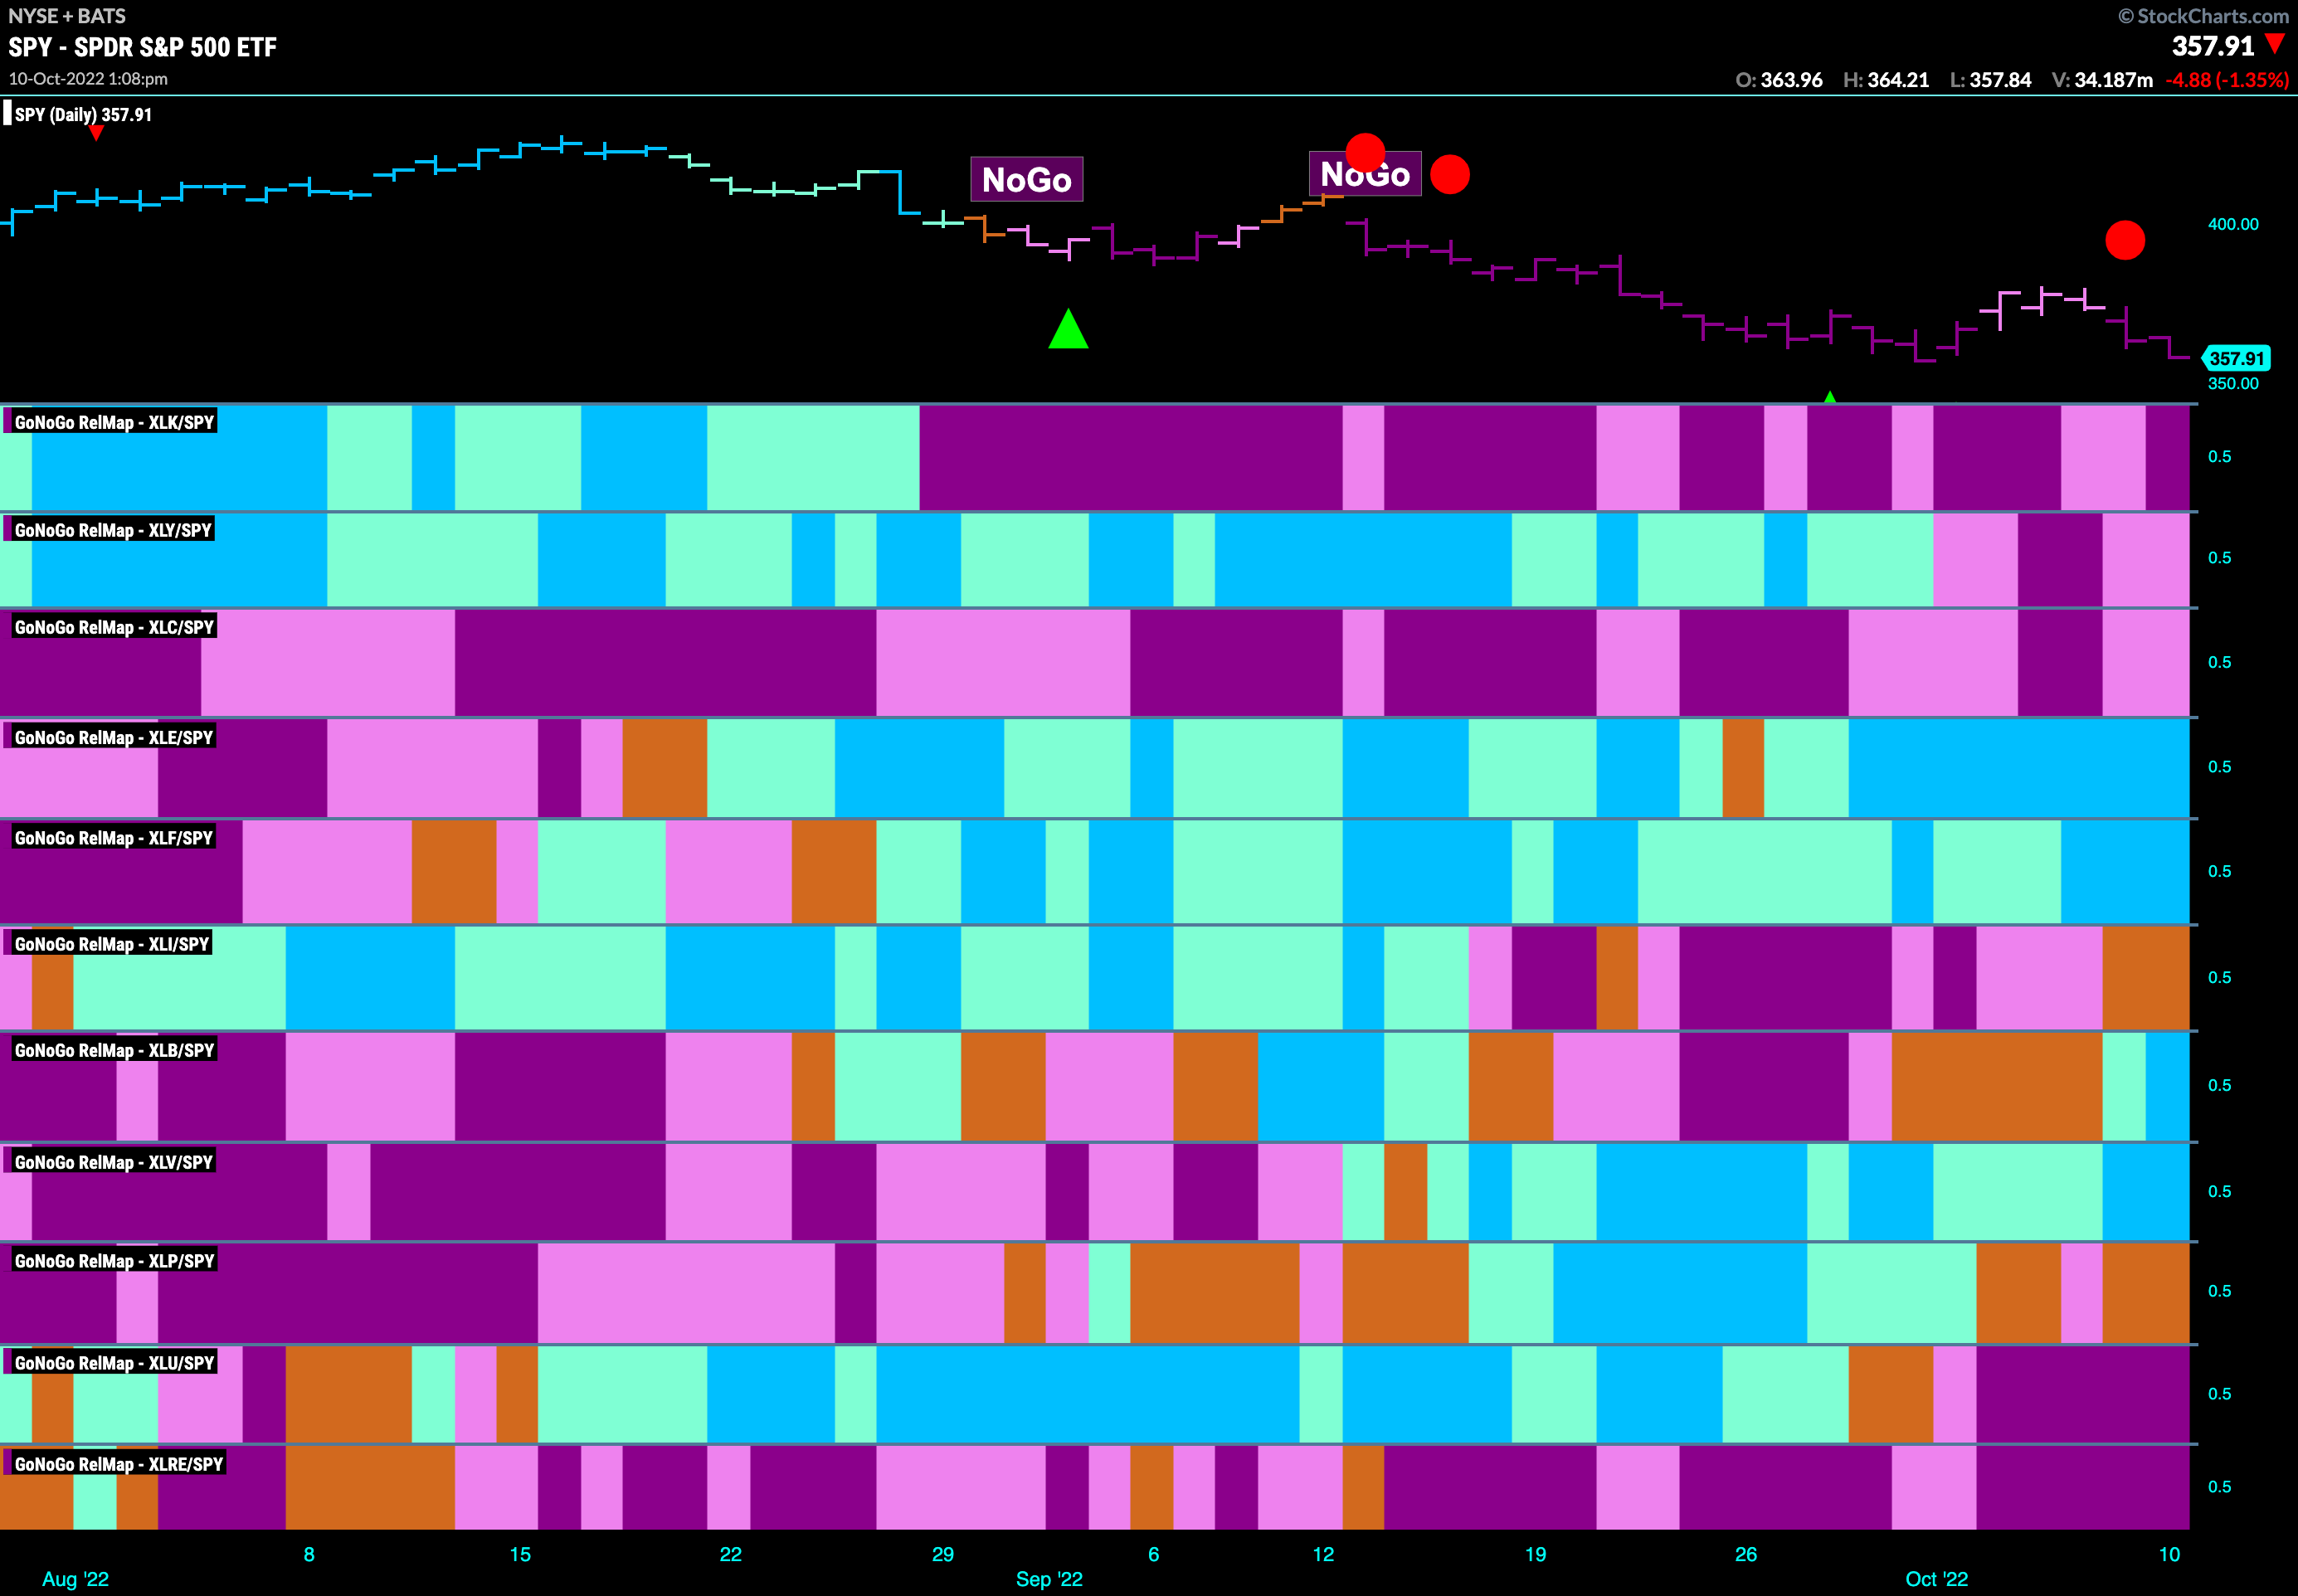
Below is the GoNoGo Sector RelMap. This GoNoGo RelMap applies the GoNoGo Trend to the relative strength ratios of the sectors to the base index. Looking at this map, we can quickly see where the relative outperformance is coming from as well as which sectors are lagging on a relative basis. We see that the growth sectors continue to drag the index lower. Technology in particular remains in a relatively strong “NoGo” trend once more painting purple bars. Energy, financials, and healthcare are joined by materials as the only sectors showing relative outperformance.
Technology Hits New Lows
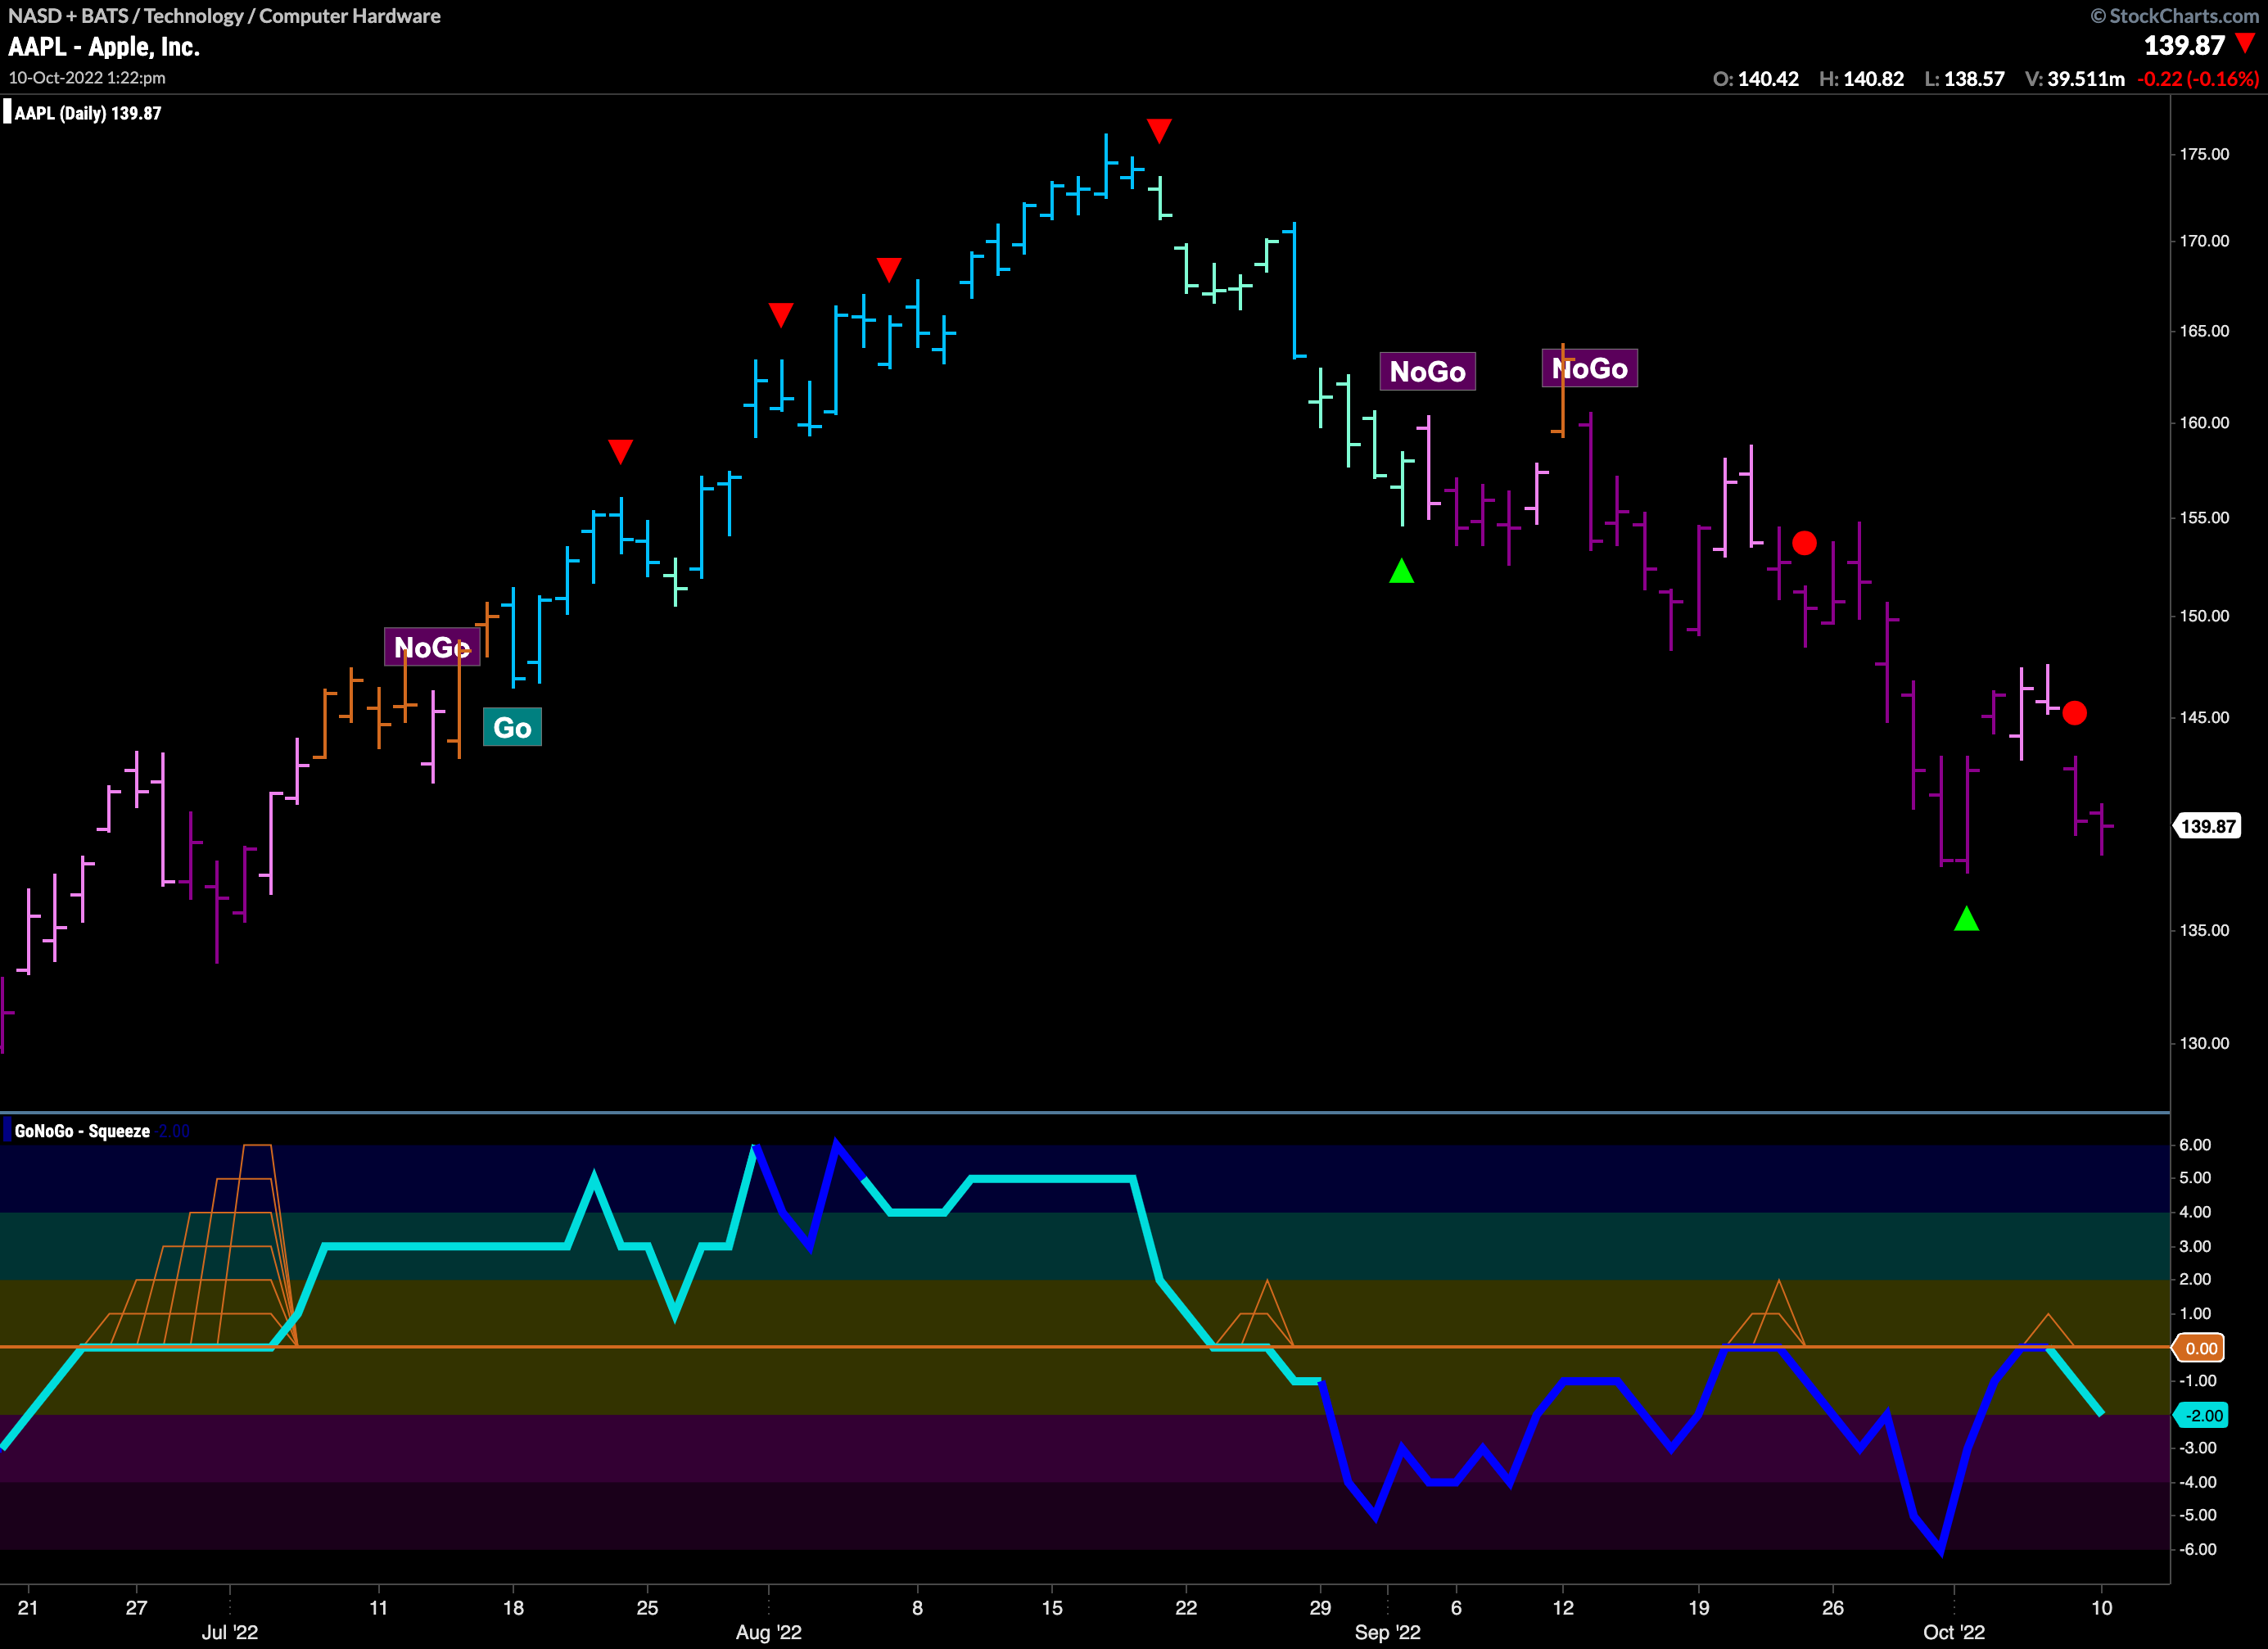
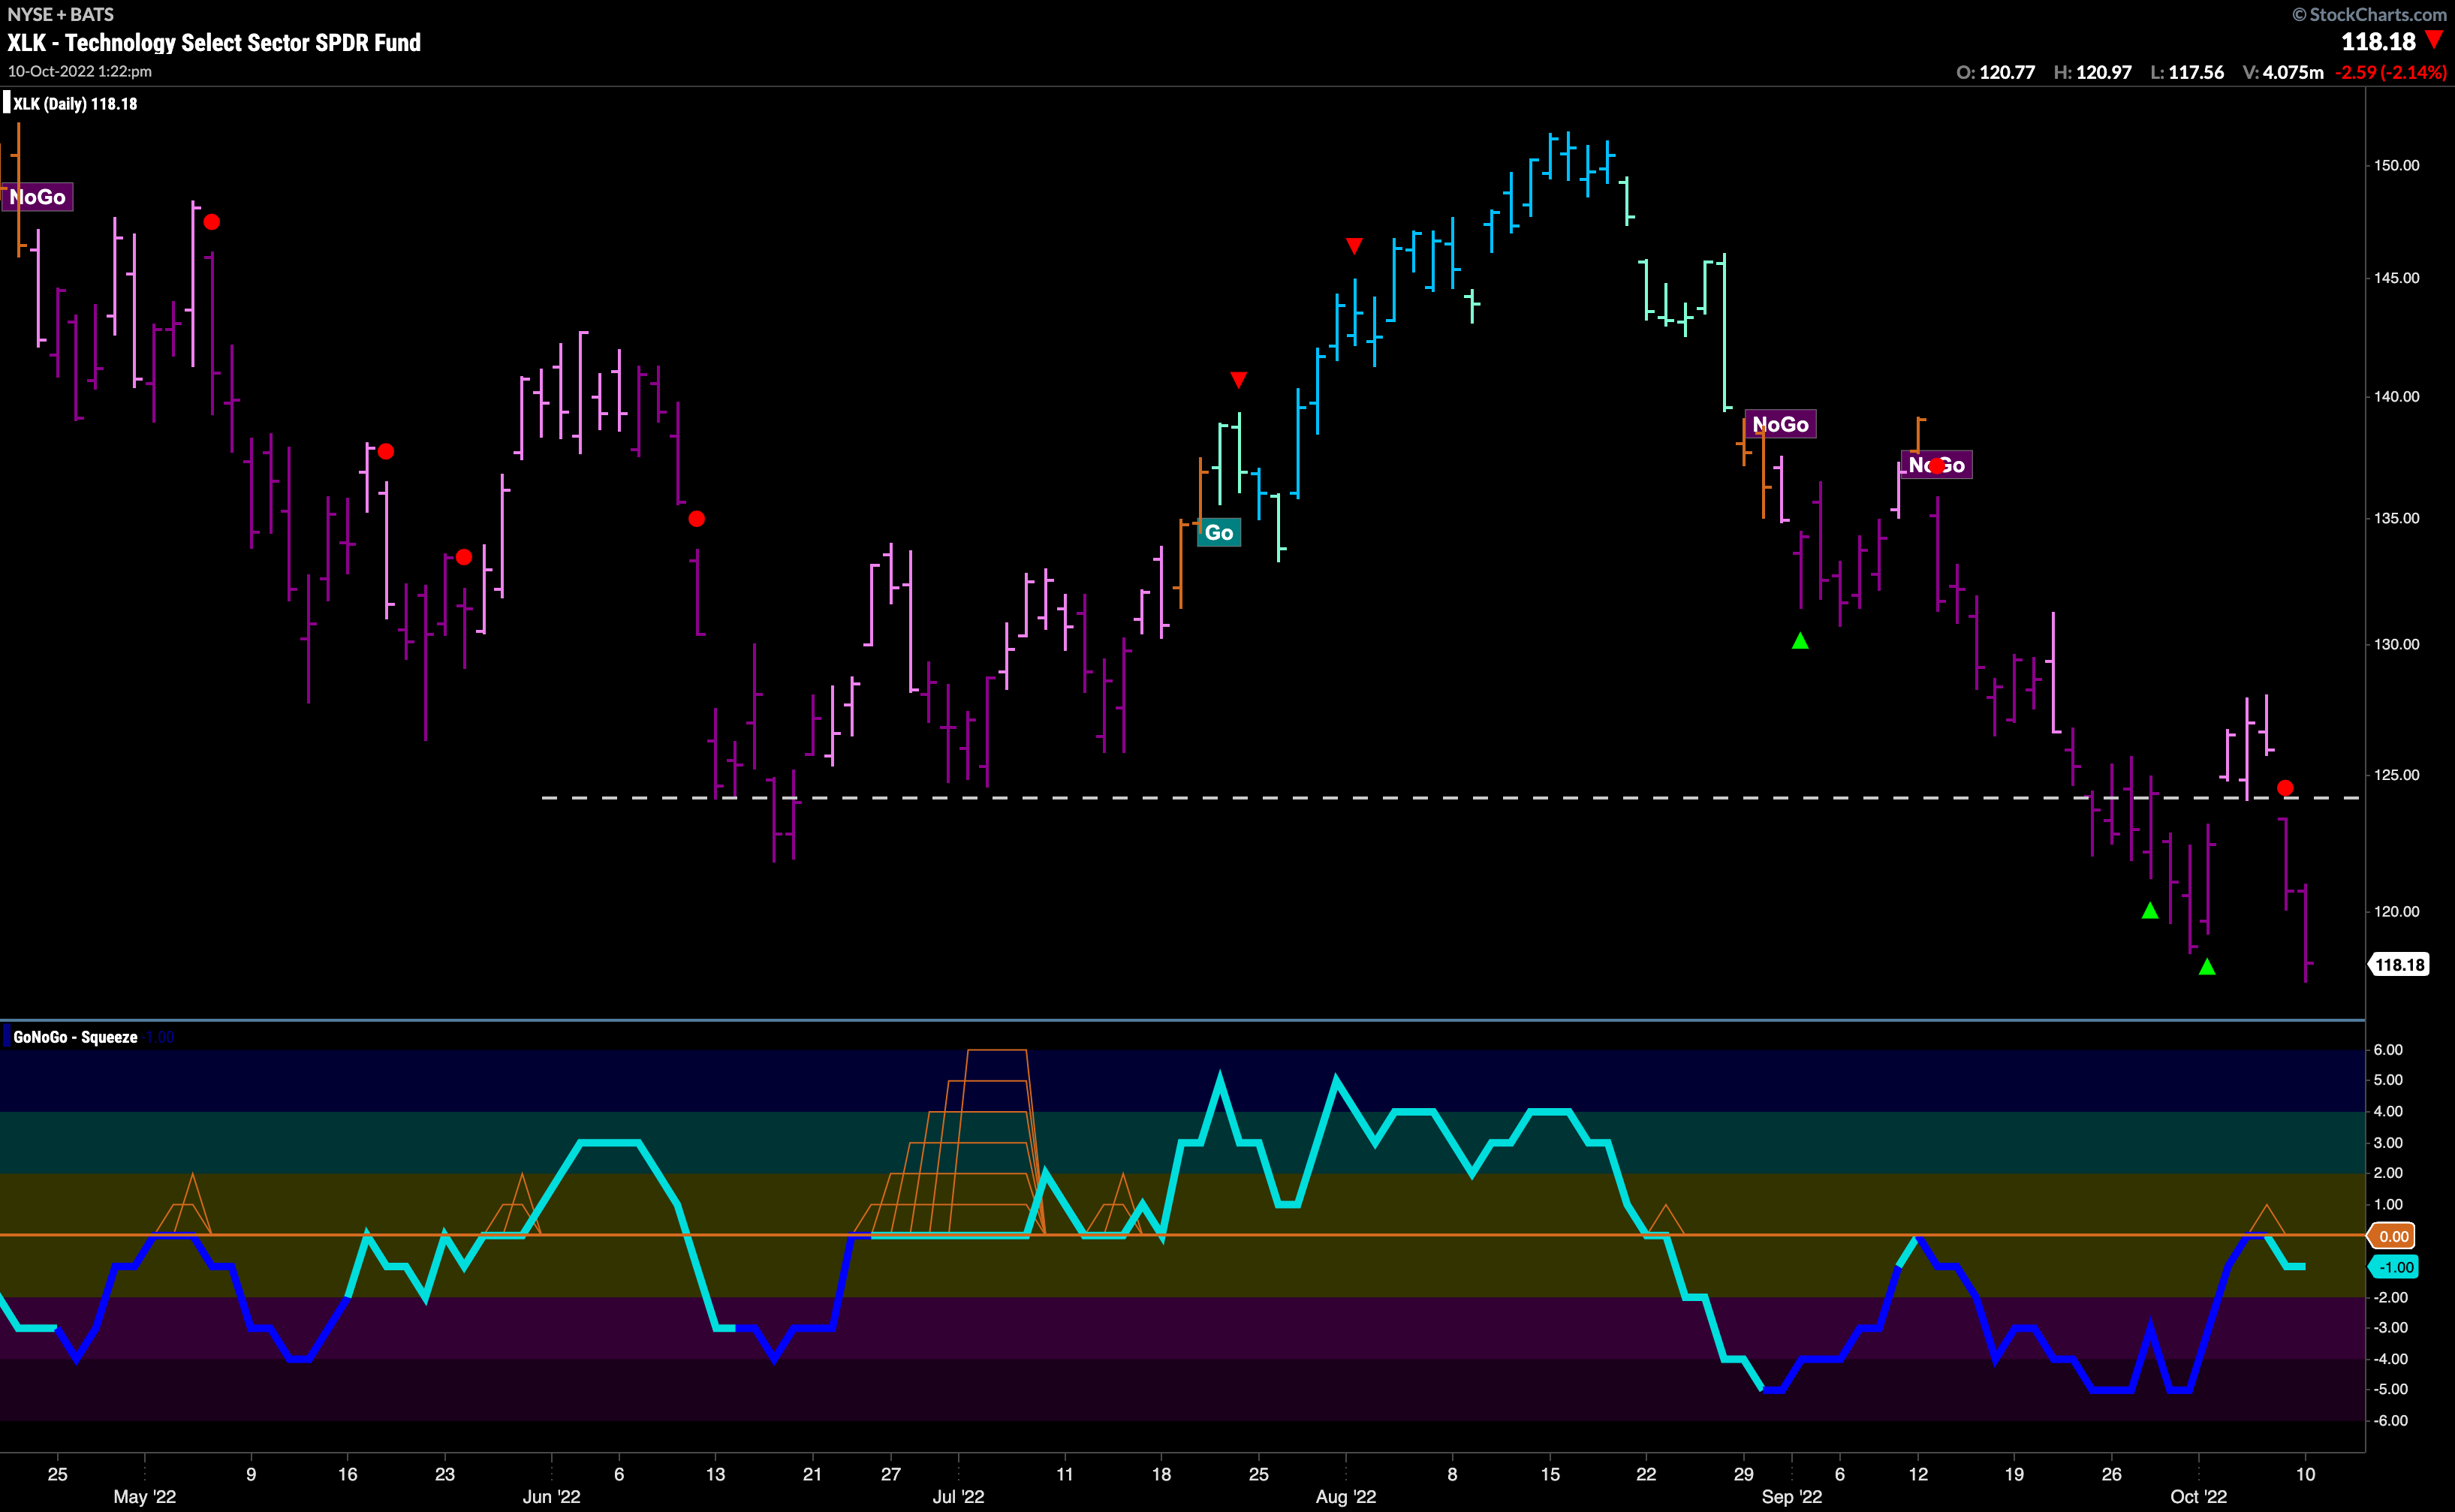
If an investor has the freedom to trade both “Go” and “NoGo” trends, it may make sense to lean into the bearish nature of the equity markets. With daily and weekly S&P 500 “NoGo” trends in place, we can look to one of the leaders within that underperformance. Technology as you can see from the chart below, has fallen below its June lows and has seen a fresh NoGo Trend Continuation Icon, (red circle) appear to indicate resurgent momentum in the direction of the current trend.
$AAPL Not Looking Like the Healthy Option
One of the technology behemoths, $AAPL is in a “NoGo” on the chart below. With GoNoGo Trend painting strong purple bars. We see GoNoGo Oscillator being repeatedly turned away by the zero line. This has triggered a NoGo Trend Continuation Icon (red circle) to appear above price. Look for $AAPL to make an attempt at setting a new lower low this week.
