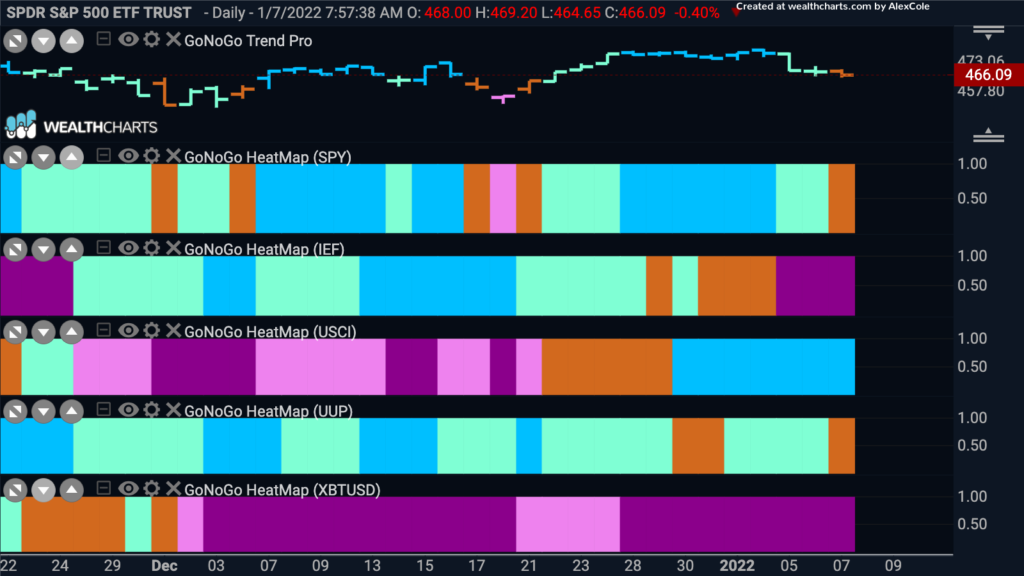
Good morning and welcome to this week’s Flight Path. Let’s take a look at what is happening in the markets after the first full week of trading in 2022. As we can see from the GoNoGo Asset map below, we saw heavy selling pressure in U.S. equities cause GoNoGo Trend to paint an amber “Go Fish” bar on the S&P 500 even after it briefly hit new highs earlier in the week. We also saw a sharp rise in interest rates this week and we can see that play out in the “NoGo” trend in treasury bond prices. This is represented by $IEF in the second panel. Commodities rallied back into a strong “Go” trend, the dollar flirts with “Go Fish” bars as investors see uncertainty and bitcoin remains embroiled in a strong “NoGo” trend.
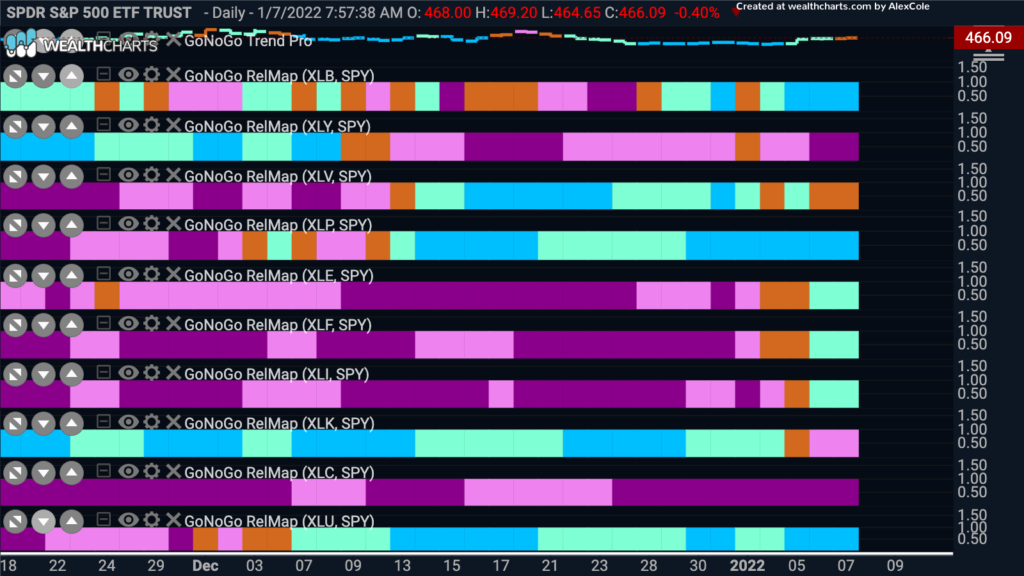
Sector RelMap Shows Strength in Value
The sell off in equities was strong in the first trading week of the year. The Nasdaq Composite dropped 4.5%, the Russell 2000 dropped 2.9%, and the S&P 500 dropped 1.9%. The S&P 500 information technology (-4.7%), health care (-4.7%), and real estate (-4.9%) sectors fell more than 4.5%, while the energy (+10.6%) and financials (+5.4%) sectors rose more than 5.0% and 10.0%, respectively, amid higher oil prices ($78.94, +3.79, +5.0%) and a steepened yield curve.
Large Cap Growth Tumbles after Strong Start
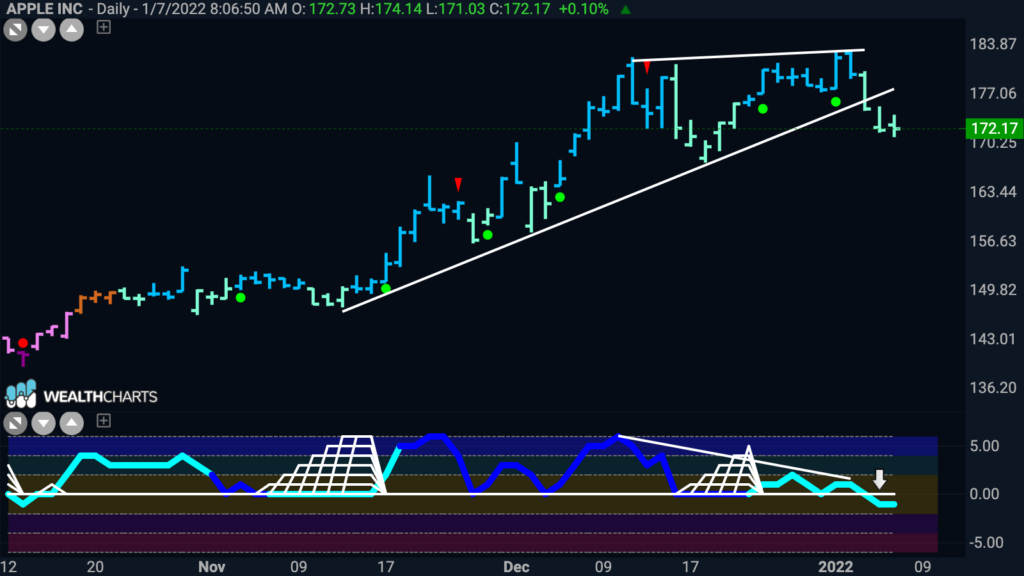
As we see above in the GoNoGo Sector RelMap, large cap growth stocks such as technology ended the week poorly, as a sector down over 4.5%. As rates rose, with the 10 yr yield running up from 1.5 to 1.8% it was too much for large growth stocks to handle, no matter how hard investors tried to avoid the signs. The S&P set another record high early in the week and Apple reached $3 trillion in market capitalization. If we look at the Apple chart below though, we can see the cracks emerging. Breaking below a trend line, price weakened to aqua bars as GoNoGo Oscillator showed bearish divergence and ultimately broke below the zero line.
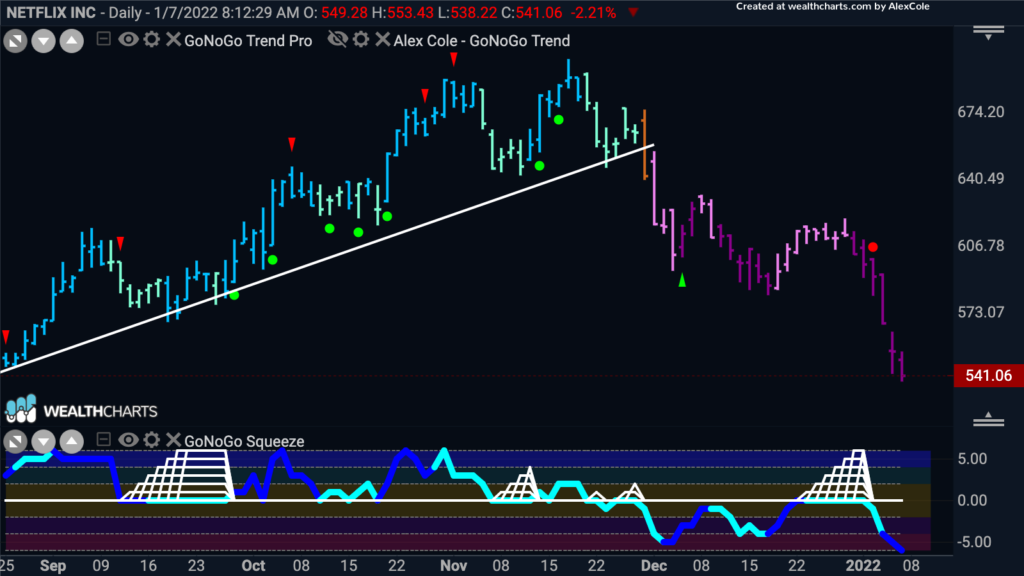
Another large cap growth name, Netflix, hasn’t fared anywhere near so well over the last month and better represents the struggles of technology stocks. Price broke its upward sloping trend line with an amber “Go Fish” bar at the end of November and has since seen a “NoGo” take hold as prices set lower lows. This has been supported by GoNoGo Oscillator which has been below the zero line and recently was rejected again at that level. This triggered a NoGo Trend Continuation red circle to appear above the price bar right before prices rolled over to new lows.
Rotation From Growth To Value
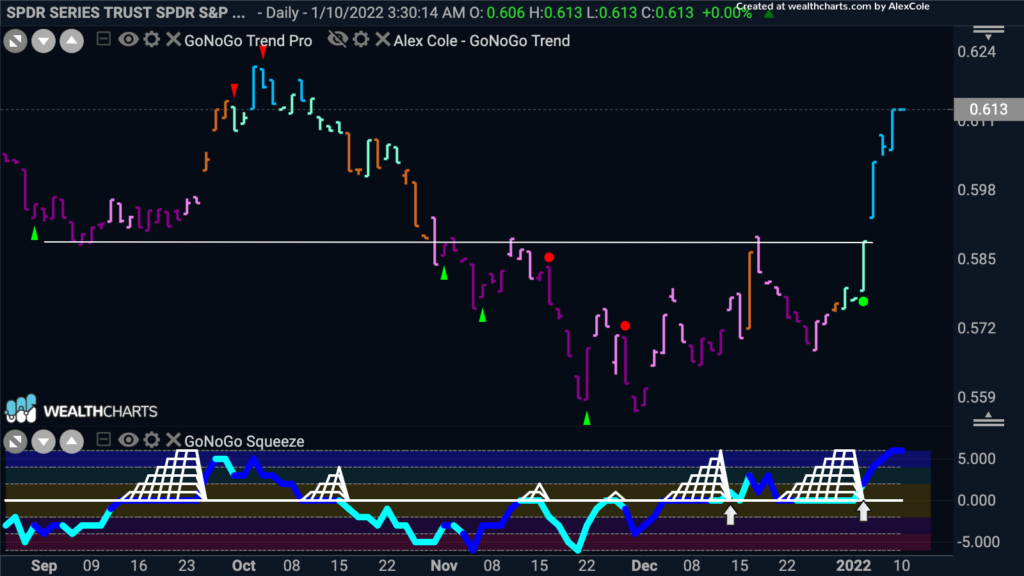
The increased likelihood for a higher interest-rate environment this year contributed to the rotation into value stocks. The chart below shows the GoNoGo Chart of the ratio of $SPYV/$SPYG. You can see how rapid the move was this week as investors processed the sharp rise in treasury yields. GoNoGo Oscillator broke above the zero line in early December and found support there as twice we saw a GoNoGo Squeeze broken to the upside. The most recent occurrence saw a Go Trend Continuation green circle appear under price as the horizontal resistance level was tested and broken on heavy volume.
Higher Oil Prices Contributing to Value Trade
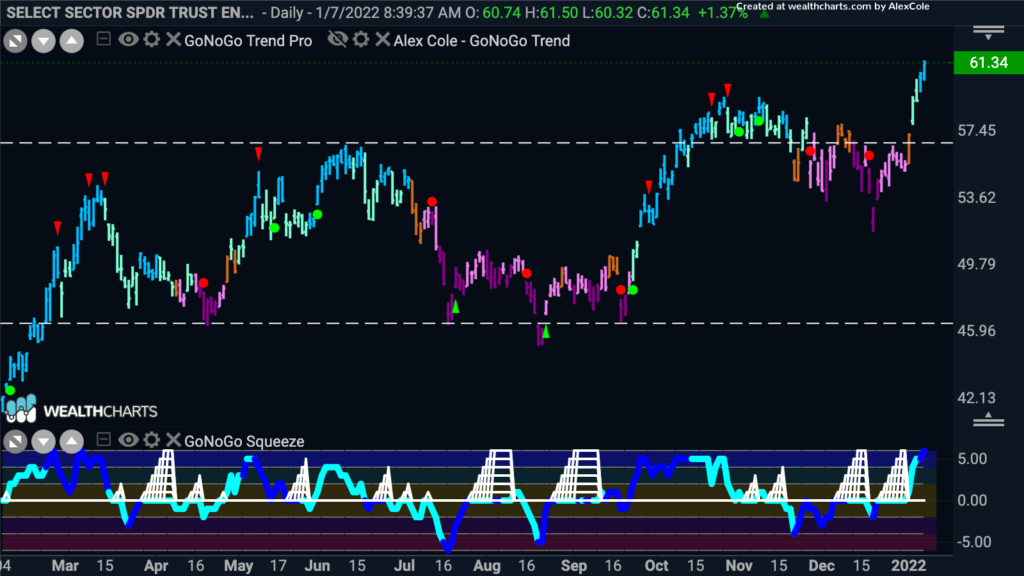
Rising yields and higher oil prices put pressure on large cap growth stocks and allowed value/cyclical sectors to come into favor as we saw in the RelMap above. The perception that a higher interest environment is likely to persist this year drove the rotation into cyclicals such as energy, financials and industrials. Below is the chart of $XLE. We have talked about the failed breakout of the sideways range that energy had been in for much of 2021 but this last week’s price action sees a new “Go” trend and a break higher once again.
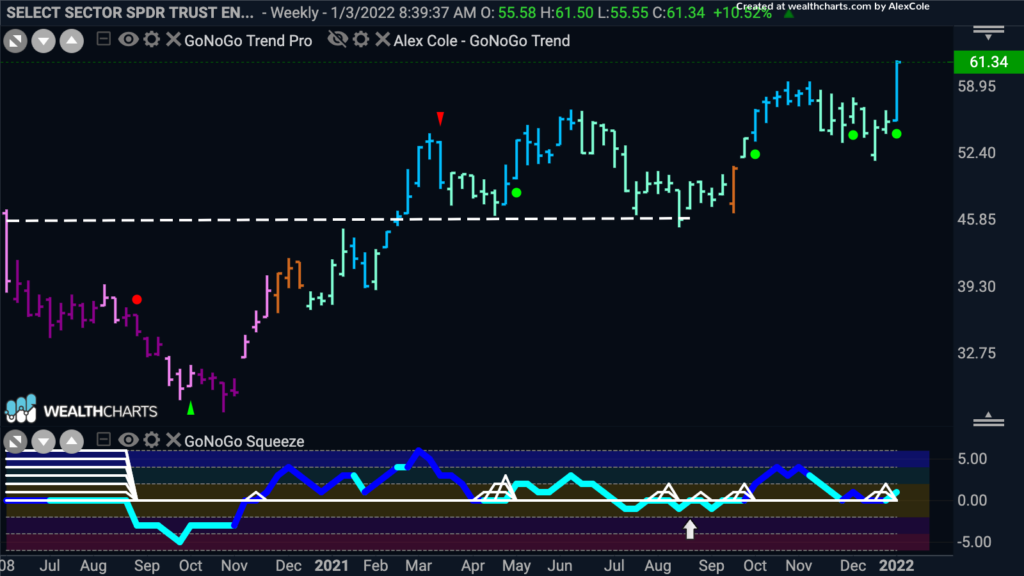
Looking at $XLE on a weekly chart we can see how strong the “Go” trend is for the energy sector on a larger time frame. A series of higher highs and higher lows has been evident since the end of 2020. Now, price has moved higher on strong blue “Go” bar and GoNoGo Oscillator has confirmed as it finds support at the zero line causing a Go Trend Continuation Icon to appear under the price bar.
Rio Tinto to Reach Higher?
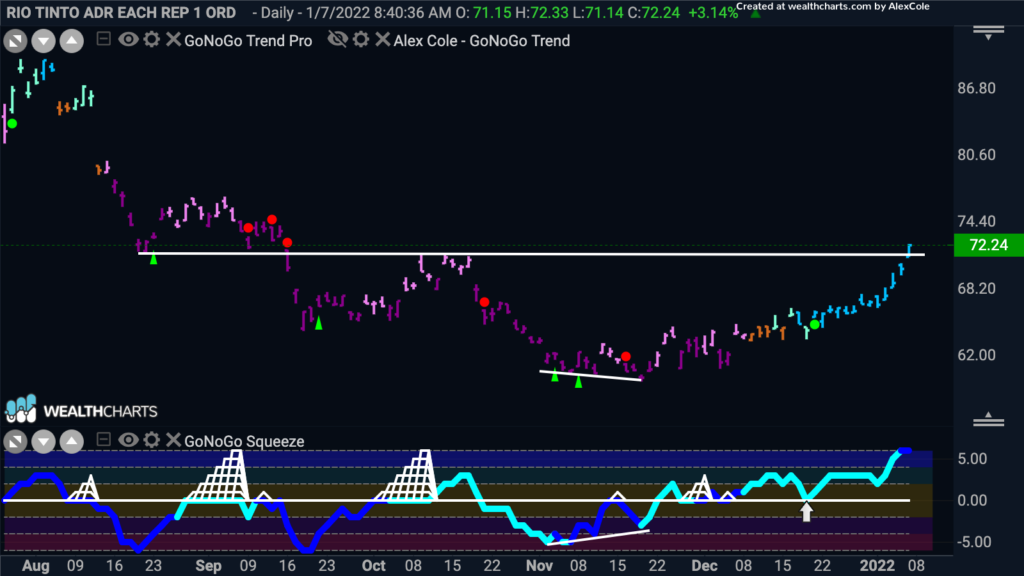
As oil price continue to trend higher this should bode well for large oil companies such as Rio Tinto. The GoNoGo Chart below shows that price has been steadily climbing since GoNoGo Oscillator showed bullish divergence in November ’22. After then crossing above the zero line and finding support, GoNoGo Trend painted a string of amber “Go Fish” bars as the NoGo dissolved and we now see a “Go” trend on strong blue bars testing levels that have been both support and resistance in the past. If prices can consolidate above these levels we can look for price to fill the gap from August 2021.
$JEF to Take Advantage of Rotation
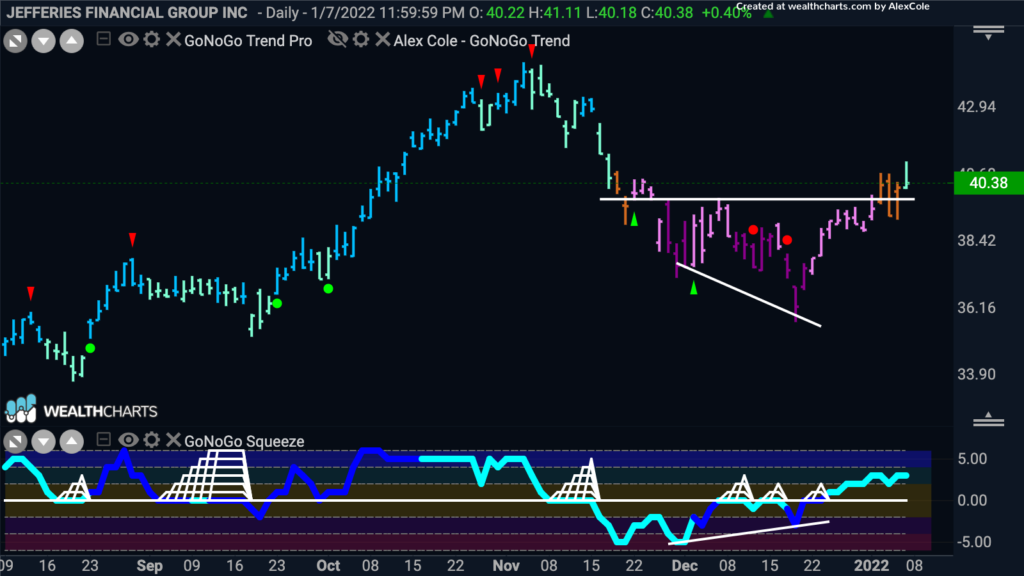
If the move into value is here to stay, then we can look at other cyclical sectors for opportunities. Financials had an incredibly strong week and so below we have a chart of $JEF. This security has been a favorite in our research over the past year and again we see an opportunity. GoNoGo Trend has identified a new “Go” trend above resistance after GoNoGo Oscillator showed bullish divergence and broke above the zero line.
