
Good morning and welcome to this week’s Flight Path. Let’s take a look at the below GoNoGo Asset Map for this week. Another interesting week in the markets! We can see that the trends remain unchanged. “Go” trends persist in Equities, commodities, the dollar and bitcoin. What is of note however is that only the greenback’s trend is painting strong blue bars. There is weakness in the trend of equities as we can see by the paler aqua bars. Price will need to find support over the next several sessions if we are to see a new higher high. The speculation of even more significant rate hikes is having an impact on the dollar as it continues to strengthen.

How high can rates “Go”?
Below is the chart of $TNX with the GoNoGo Trend and Oscillator applied. What a run 10-year yields have been on as we see another new high following the Go Trend Continuation green circle we saw at the beginning of the week. No surprise as discussions abound surrounding the Fed’s actions in terms of raising rates this year to fight inflation.

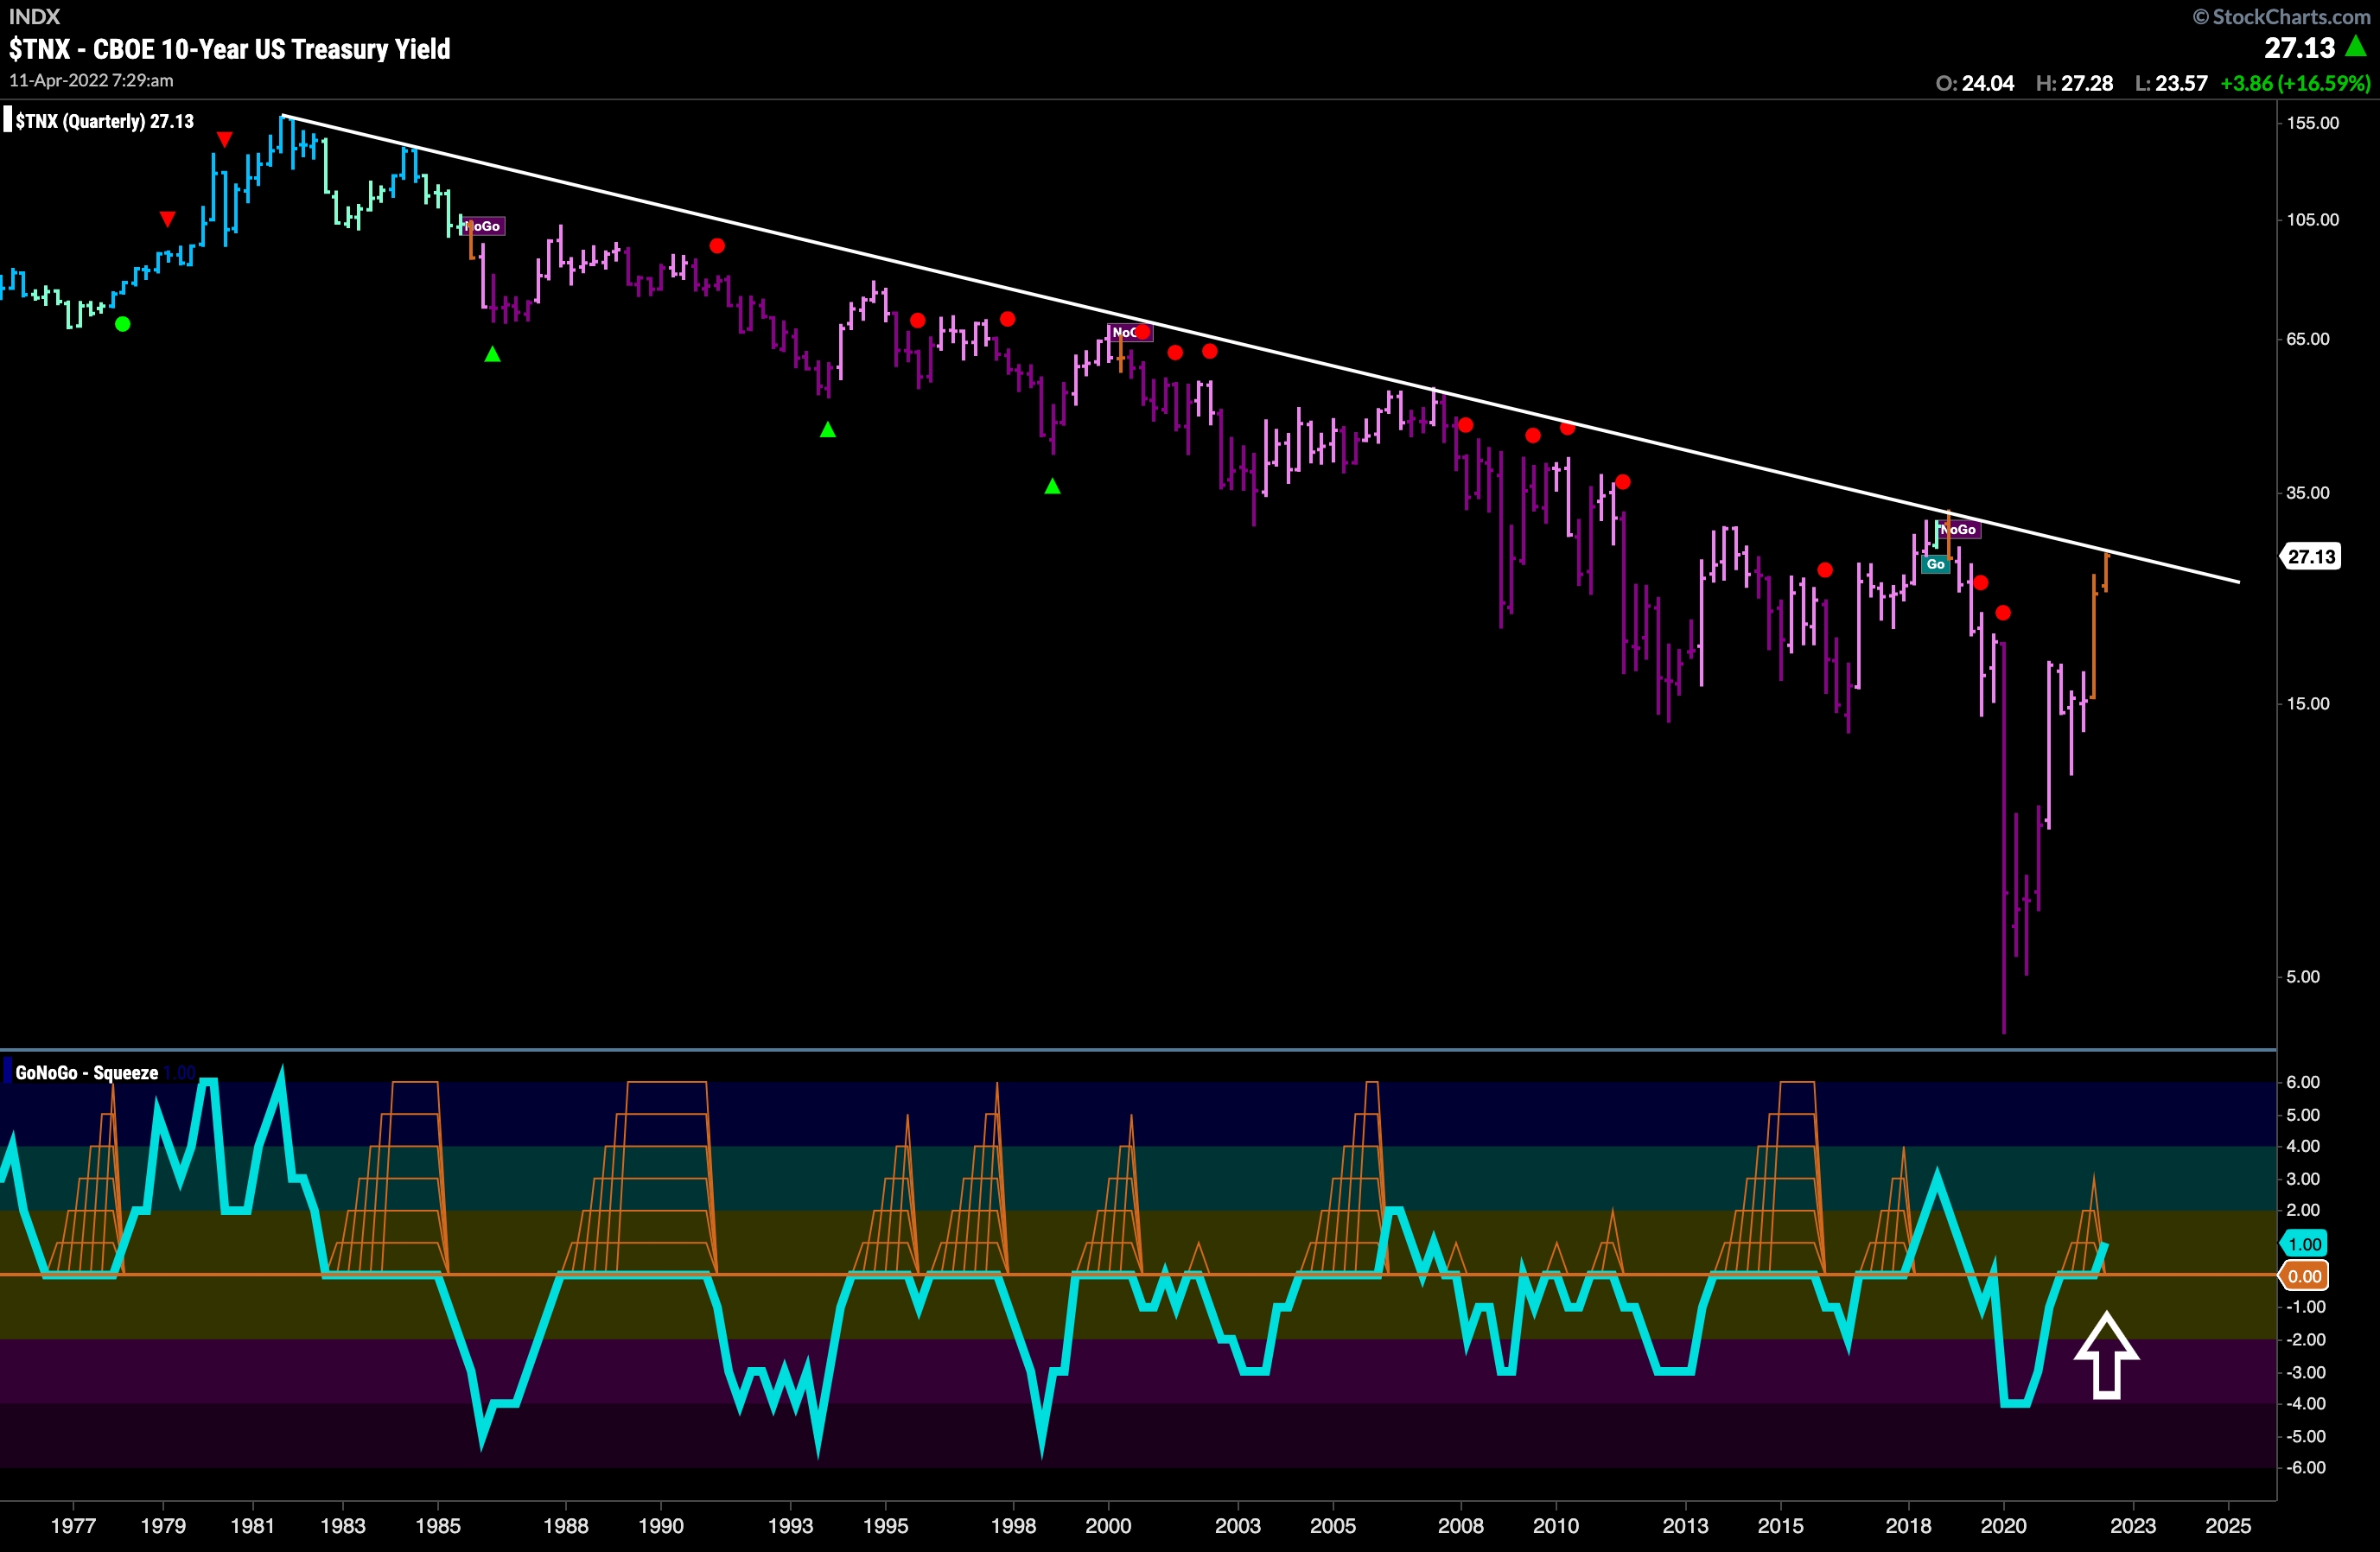
If we zoom all the way out, the picture is fascinating. The chart below shows a quarterly GoNoGo Chart going back to the 70’s. The impressive rally we have seen in rates since the beginning of 2022 could be viewed as a NoGo counter trend correction within a historic downward trend in rates. We are of course, at an important point right now, as prices bump up against this long term resistance. Of note, as prices climbed to test this resistance, GoNoGo Trend has been unable to maintain “NoGo” bars painting a couple of amber “Go Fish” bars and GoNoGo Oscillator is breaking above zero. Is there enough positive momentum to see rates breakout of this longterm trend?

Dollar Strength Impressive
Below is the weekly GoNoGo Chart of $UUP, the U.S. Dollar Index fund. Price has been climbing higher making a series of higher highs and higher lows since the summer of ’21. Currently, GoNoGo Trend paints strong blue bars and the oscillator is overbought on heavy volume. The trend is strong in this one.

If we look at the daily chart, we can see that we recently saw low risk opportunities to participate in the move higher. As a trend was identified late February, we saw Go Trend Continuation Icons (green circles) that told us momentum was in the direction of the new “Go” trend. After that initial move higher, we saw a Go Countertrend Correction red arrow that suggested prices may struggle to move higher in the short term and prices corrected slightly against the trend in a flag pattern. Toward the right half of the consolidation momentum crept back into positive territory and recent Go Trend Continuation green circles pre-empted the breakout to new highs.

Telefonica to Set New High?
With the dollar “Go” trend in place, companies sell goods and services to America could see strong profits as a result of favorable exchange rates. A strong dollar has the potential to be a tailwind for companies outside the U.S. The chart below shows daily prices for Telefonica with GoNoGo Trend and GoNoGo Oscillator applied. A heavy correction saw a “NoGo” in place during March and into April but a new “Go” trend has been identified as GoNoGo Trend paints strong blue bars. Prices are now challenging the high from February. An investor could look for opportunities to enter the trend.

Agriculture Looks to Move Higher Again
The $DBA chart below shows that prices have moved largely sideways since hitting a high in early march. However, the “Go” trend has not faltered in that time as GoNoGo Oscillator continues to find support at the zero line. As momentum remained neutral we saw the climbing grid of GoNoGo Squeeze build twice as investors fought for control. Now, as the price trend strengthens with blue bars, the oscillator is breaking out of GoNoGo Squeeze into positive territory, triggering a fresh Go Trend Continuation green circle to appear under the price bar. We’ll look for prices to mount an attack on that prior high.

Which Way Wheat?
With the war in Ukraine, Wheat futures saw an incredible rally in February. Russia and Ukraine account for more than a quarter of the worlds wheat production. Many believe that the pressure on wheat prices to move higher will not abide soon. That being the case, let’s take a look at the GoNoGo Chart of daily wheat prices below. The trend is a “Go”, but prices have corrected significantly since the high in early March. A red Go Countertrend Correction arrow suggested that prices may struggle to move higher after that swift move. As price volatility shrunk, GoNoGo Oscillator rode the zero line allowing the climbing grid of GoNoGo Squeeze to climb to its max. Interestingly, the Squeeze was broken to the downside as the oscillator moved into negative territory. However, the trend held, and now GoNoGo Oscillator is once again stuck at zero as a new Squeeze builds. We will watch to see if this time it can break into positive territory which would suggest another leg higher in price.

Weekly Wheat is Wonderful
Looking at the larger timeframe chart for wheat, we can see the strength of the trend that has been in place for over a year. On this chart, we see a Go Trend Continuation green circle appearing under the current bar as GoNoGo Oscillator once again found support at the zero line. This multi time frame analysis would suggest that an investor could look for “Go” opportunities on the smaller time frame chart.

Archer Daniels Midland Continues to Outperform
Given the trend in Wheat may continue, let’s take a look at the chart of $ADM. This is a beautiful “Go” trend. As prices climbed higher making higher highs and higher lows since the end of last year, each low pushed GoNoGo Oscillator to the zero line where it found support. Recently, we see the same situation play out. The objective zero level provided support as a new Go Trend Continuation green circle was flagged on the chart before prices raced to another new high. If we were to zoom out we would see the trend is also strong on the weekly chart. It would seem that a “buying the dips” strategy remains a good one. To get an entry, one could look at a shorter time frame chart and find Go Trend Continuation signals.


