
Good morning and welcome to this week’s Flight Path. It was a fantastic experience to attend the CMT 2022 Symposium IN PERSON last week in Washington DC. A brilliant event put on by the organization with incredible content and opportunities to reconnect with old friends. So with fresh enthusiasm for the health of technical analysis as a discipline and its ability to help us navigate these markets let’s take a look at the below GoNoGo Asset Map for this week. The crack turned into a crevasse in the equity markets this week. We painted strong purple “NoGo” bars most of the week with the S&P 500 down over 3.5% on Friday. “NoGo” trends continued in treasury bonds and bitcoin as commodities and the dollar proved that they could maintain “Go” trends. In this rising rate environment, the trends are visible.

S&P 500 one last chance of support perhaps too hopeful?
Below is the chart of $SPY with GoNoGo Trend and GoNoGo Oscillator applied to weekly price bars. We are looking at a significant level of support being tested now. Many analysts are concerned that if we fall through this then there is nothing to stop a more serious decline. We saw the first signs of trouble on the weekly chart in January when GoNoGo Oscillator failed to find support at zero and broke into negative territory on heavy volume. This was after bearish divergence as price made a slightly higher high but the oscillator made a lower high. Since then, GoNoGo Trend has been unable to maintain “Go” bars and now the “NoGo” trend strengthened again on purple bars as GoNoGo Oscillator has been rejected once more by the zero line from below.

Below is the daily chart. We can see that Friday’s bar took price all the way down to the lower bound of the channel we had drawn on the weekly chart. The next few days could prove pivotal. As price bars have painted strong “NoGo” bars we see the oscillator close to oversold territory and on heavy volume indicating strong market participation.

Sector Performance
Below is the GoNoGo Sector Relmap. This GoNoGo Relmap applies the GoNoGo Trend to the relative strength ratios of the sectors to the base index. Looking at this map, we can quickly see where the relative outperformance is coming from as well as which sectors are lagging on a relative basis. The overall message here is defensive and getting more so. Technology and communications have been rejoined by discretionary in “NoGo” trends. Consumer discretionary tried to break away over the last few weeks but fell this past week to join its growth sector friends in the struggle relative to the S&P 500. The value sectors continue to outperform on a relative basis. Energy, materials, healthcare, staples, utilities, and real estate are joined by industrials this week.

Discretionary Sector Resumes its Rightful Place Beside Technology and Communications
It was always going to be hard for the discretionary sector to maintain its “Go” trend as rates continue to rise. Rising rates are traditionally a headwind for growth stocks as it makes the cost of borrowing heavier. The chart below is a weekly GoNoGo chart and it shows that the temporary relative strength we saw on the daily chart was always going to struggle. On the larger time frame chart we see a series of lower highs and lows as the “NoGo” has been in place for a few months. GoNoGo Oscillator crossed below the zero line after failing to find support and breaking out of a GoNoGo Squeeze on heavy volume in January. The most recent bar caused the oscillator to break out of a new GoNoGo Squeeze as it got rejected again by the zero line. This caused a NoGo Trend Continuation icon (red circle) to appear above the price telling us that momentum is resurgent in the direction of the “NoGo” trend.

Amazon Falls Fast
The chart of Amazon shows just how bad a day it was on Friday. After find support at the horizontal trend line for some months, it was brutally taken out by the last bar. This moves price to new lows in the “NoGo” trend.

Below is the weekly chart of Amazon. this chart shows just how strong the support level was that was obliterated. The history of buyers at this level goes back to the summer of ’21. As GoNoGo Oscillator was turned away by the zero line the weekly bar crashed to new lows.

Energy to Accelerate?
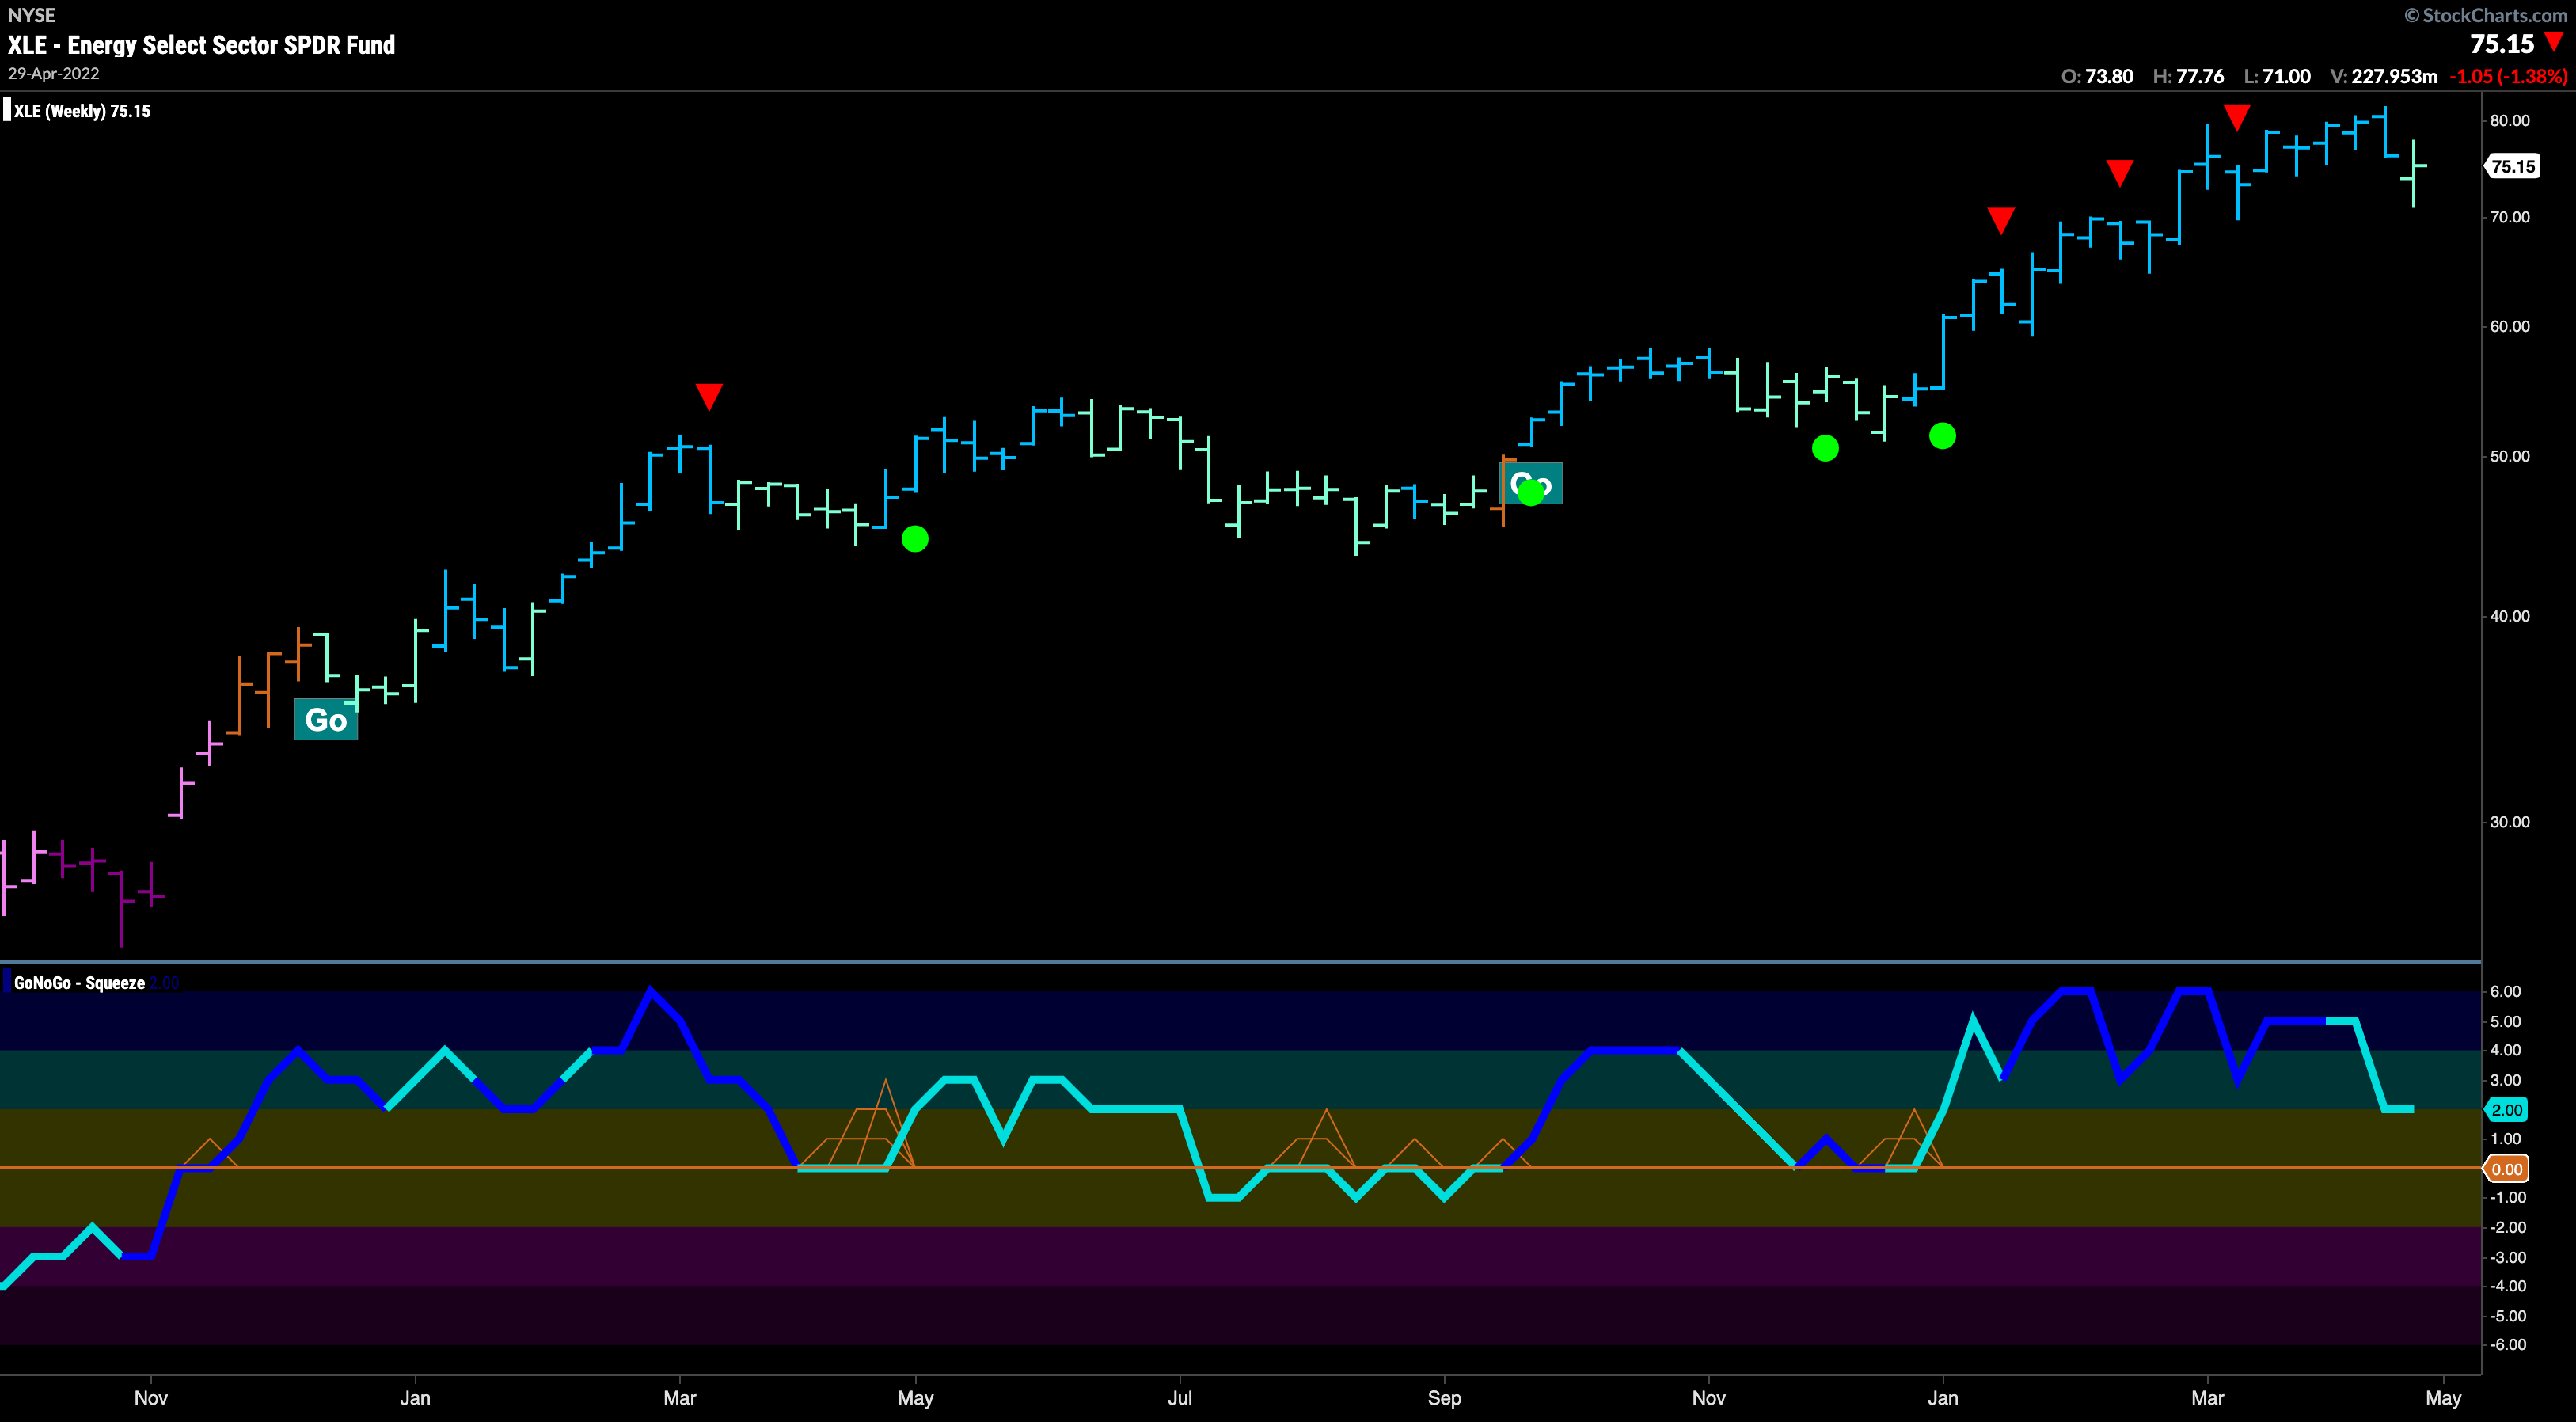
Energy remains the leader in these markets. The weekly chart below shows that the “Go” trend is in place and looks healthy. As we see a pull back on an aqua bar GoNoGo Oscillator has fallen from overbought levels but still in positive territory. Given the trends that are in place, could this be setting up for a move higher? If a buy the dip opportunity is coming we’ll keep an eye on the zero line and look at the daily chart for opportunities.

On a daily chart the slight pullback we saw above looks a little more severe. However, two “Go Fish” bars never gave way to “NoGo” bars and the “Go” bars quickly came back. What we need to watch on this chart in order to be confident in a move to new highs and a leg higher is GoNoGo Oscillator as it tries to recapture positive territory. If it can break back above zero that would trigger a Go Trend Continuation Icon (green circle) to appear under the price bar and we’d know that momentum is back in the direction of the “Go” trend. That would give us a relatively low risk opportunity to increase position in the energy sector or enter the trend if we haven’t already.

How is the Race Playing Out for Marathon?
Looking at an equity in the space, Marathon Oil has a chart similar to the chart of the energy sector above. The “Go” trend is still in place with price making higher highs and lows. In this case, GoNoGo Oscillator dipped into negative territory but is already back at zero where a GoNoGo Squeeze is beginning to build. If we see a break out of the Squeeze to the upside that would be a good sign that we will try to set a course for new highs.

Valiant Valero Looking Strong
Another oil company, Valero Energy Corp looks even stronger than Marathon or even the sector. The chart below shows the daily prices of $VLO and We can see that GoNoGo Oscillator found support at the zero line recently as volume increased and has now surged back into positive territory after displaying a Trend Continuation green circle. Price has already reached new highs on strong blue “Go” bars.


