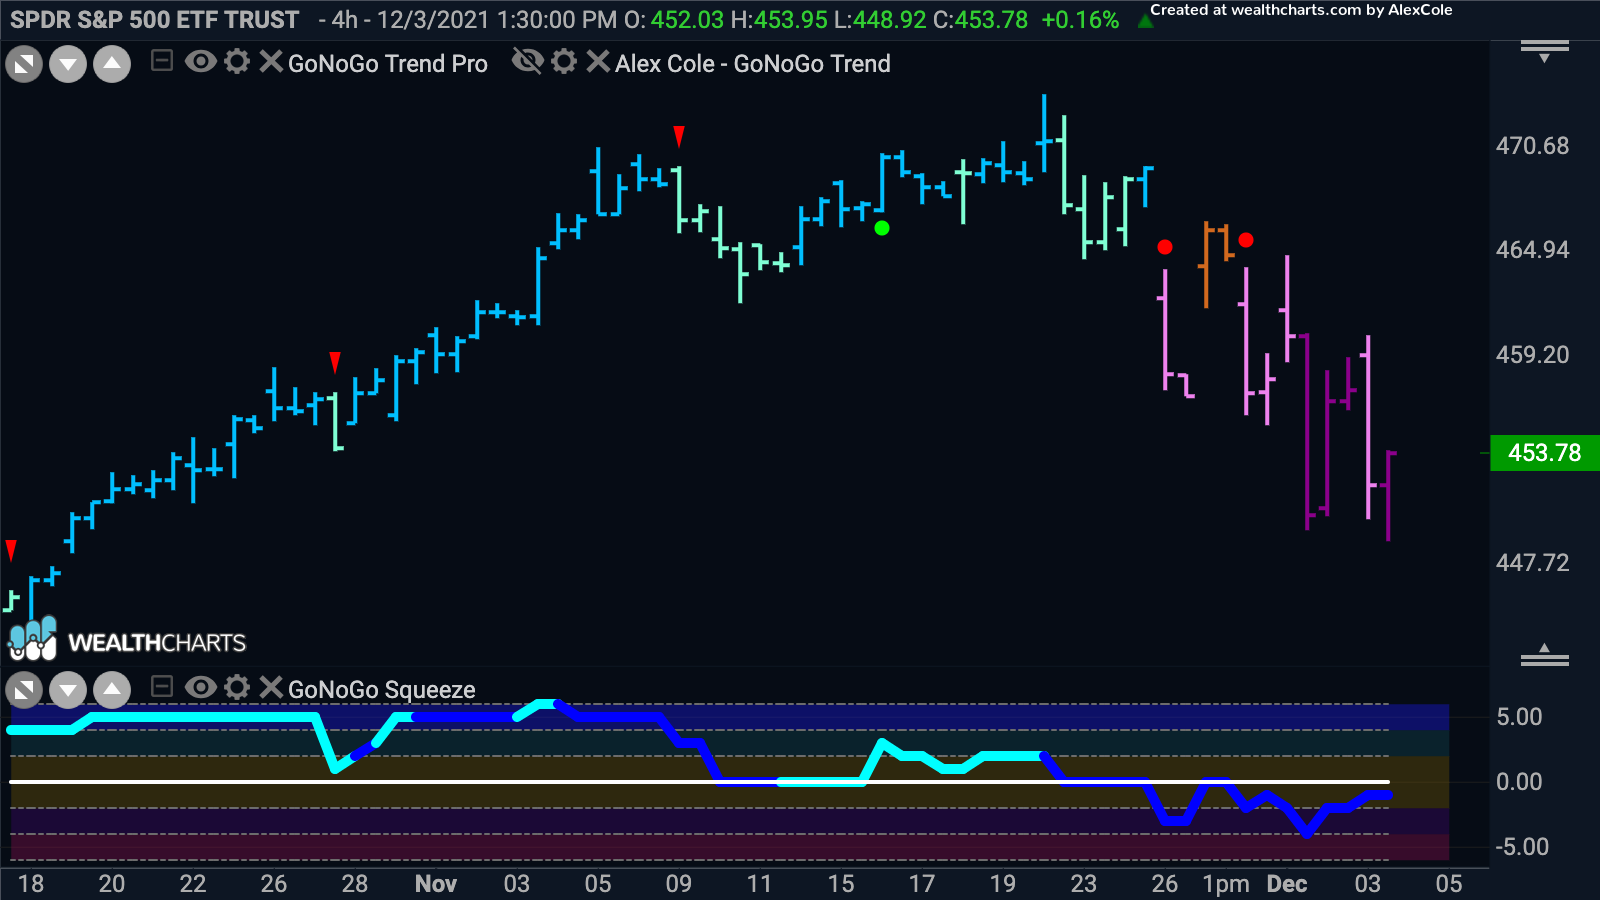

Markets are moving, no doubt. Fears of change to the dovish US monetary policy and concerns about the Omicron variant led global markets negative for the second week in a row. The NASDAQ was hit hardest last week falling 2.6%. The S&P 500 has fallen 3.4% over the past two weeks. See the 4hour chart below of the S&P 500:

What looked to many analysts as another “buy-the-dip” opportunity on Monday’s rebound, was short-lived. GoNoGo Oscillator rallied to the zero line as the index gapped up only to be rejected on heavy volume back into oversold territory as the NoGo trend conditions resumed. The risk-off move was confirmed as selling pressure continued through the trading week. The VIX jumped to as high as 35 in Friday afternoon trading – the highest intraday level in more than 10 months – extending a recent surge that dates to the emergence of the Omicron variant in late November.
S&P 500 Weekly Chart = “Go”
From the weekly perspective though, the “Go” trend is holding. Notice in the chart below how GoNoGo Oscillator® fell to the zero line. If momentum breaks down below the zero line, then we have a higher probability of a deeper decline for the S&P. If it finds support at zero, then the “Go” is likely to continue higher.

Sector Summary
Nine out of eleven sectors ended the week negative. See the GoNoGo Heat Map® below which displays the trend conditions of each individual sector on an absolute basis. It is inherently “risk-off” behavior when investors generate more demand for Utilities $XLU – up 1% last week – than any other sector.

Opportunities on the short side have been pronounced. Communications $XLC stands out amongst the sectors under pressure:

Inflation Stays, Bond Yields End
Yields of government bonds fell sharply in response to concerns about the Omicron variant and the outlook for potential acceleration in the U.S. Federal Reserve’s moves to tighten its monetary policies. On Friday, the yield of the 10-year U.S. Treasury bond fell as low as 1.36% in afternoon trading; just nine days earlier, it had been as high as 1.69%.
The demand for T-bills spiked Friday, Nov 26th, as prices gapped up sending yields plummeting and the “Go” trend continued through last week on strong blue bars as GoNoGO Oscillator rose to extreme overbought levels. (Remember, yields move inverse to bond prices.) See the chart of $TLT below:

Factors ‘n Styles
Growth stocks were among the weakest performers through last week’s trading. However, if we look at the longer-term perspective mega-cap growth equities have kept the narrow rally afloat. Most importantly risk assets are one of the only hedges against inflation risk, and growth equities have shown relative performance against cyclical and value stocks through much of this year.
Assume for a moment that the constituents in the $SPYG and $SPYV ETFs properly represent the Growth and Value components of the SS&P 500 index accurately (we can quibble about index construction another day). Apart from the brief rotation toward cyclicals in late September, growth equities have roundly outperformed value stock in the 2nd half of 2021. See the daily ratio of $SPYG/SPYV below:

Shorting Persistent NoGo Trends
As noted above, the communications sector has deeply underperformed the index recently. Despite the name change to “Meta Platforms,” Facebook carried all its problems with it see the daily GoNoGo Chart of $FB:

Another persistent “NoGo” of the top 10 holdings in $XLC is Verizon with the steady and persistent “NoGo” trend since May. GoNoGo Oscillator has not broken above the zero line even once in six months!
“Can you hear me down here? How about lower? Still no good?”
However, investors with the ability to concentrate on individual names with positive trend conditions and relative strength have been rewarded. See the chart below of Alphabet (Google) another top holding in the communications sector relative to the XLC sector $GOOG/XLC:

On an absolute basis, Google has flirted with neutral to weak go bars through the recent volatility. These are leadership qualities within a beaten-down sector.
A Stock Pickers Market
As breadth deteriorated across major indices in November, managers must narrow in on outlying leadership. Despite the flight to “safe haven” assets like US Treasuries and defensive sectors such as Utilities last week, the performance in tech and consumer discretionary was narrowly holding up the” Go” trend of the S&P 500 since the start of November.
See the ratio of the NASDAQ 100 against the Russell 2000 daily GoNoGo Trend® chart below which shows the breakout from a 5-month trading range in late November as the market became more concentrated on mega-cap growth equities.

Within the information technology sector $XLK, there are also leaders that have fared better than their peers. If you drill into the top holdings of $XLK, the sector, you see selling pressure in Adobe $ADBE, Salesforce $CRM, Amazon, $AMZN, Microsoft $MSFT, and others. There are only a few leaders within the leading sector. Apple Inc. $AAPL and NVIDIA Corporation $NVDA are standouts on an absolute and relative basis.

The GoNoGo Chart above shows the trend conditions of NVIDIA Corp.’s relative strength against the tech sector $XLK. Unlike $APPl which has a choppy relative trend, $NVDA has steadily outperformed the sector. In turn $XLK has outperformed other sectors in the S&P of late. With 84% outperformance of the technology sector since the “Go” was flagged in May, NVIDIA Corporation is checking boxes for both absolute and relative performance.
Note, GoNoGo Oscillator(R) is testing the zero line where we will look to find support if this trend is meant to continue. GoNoGo Squeeze(R) is beginning to build the grid. The longer momentum is at neutral the greater the likelihood for a high vol move in the direction of the break.
Better Charts. Better Decisions.


