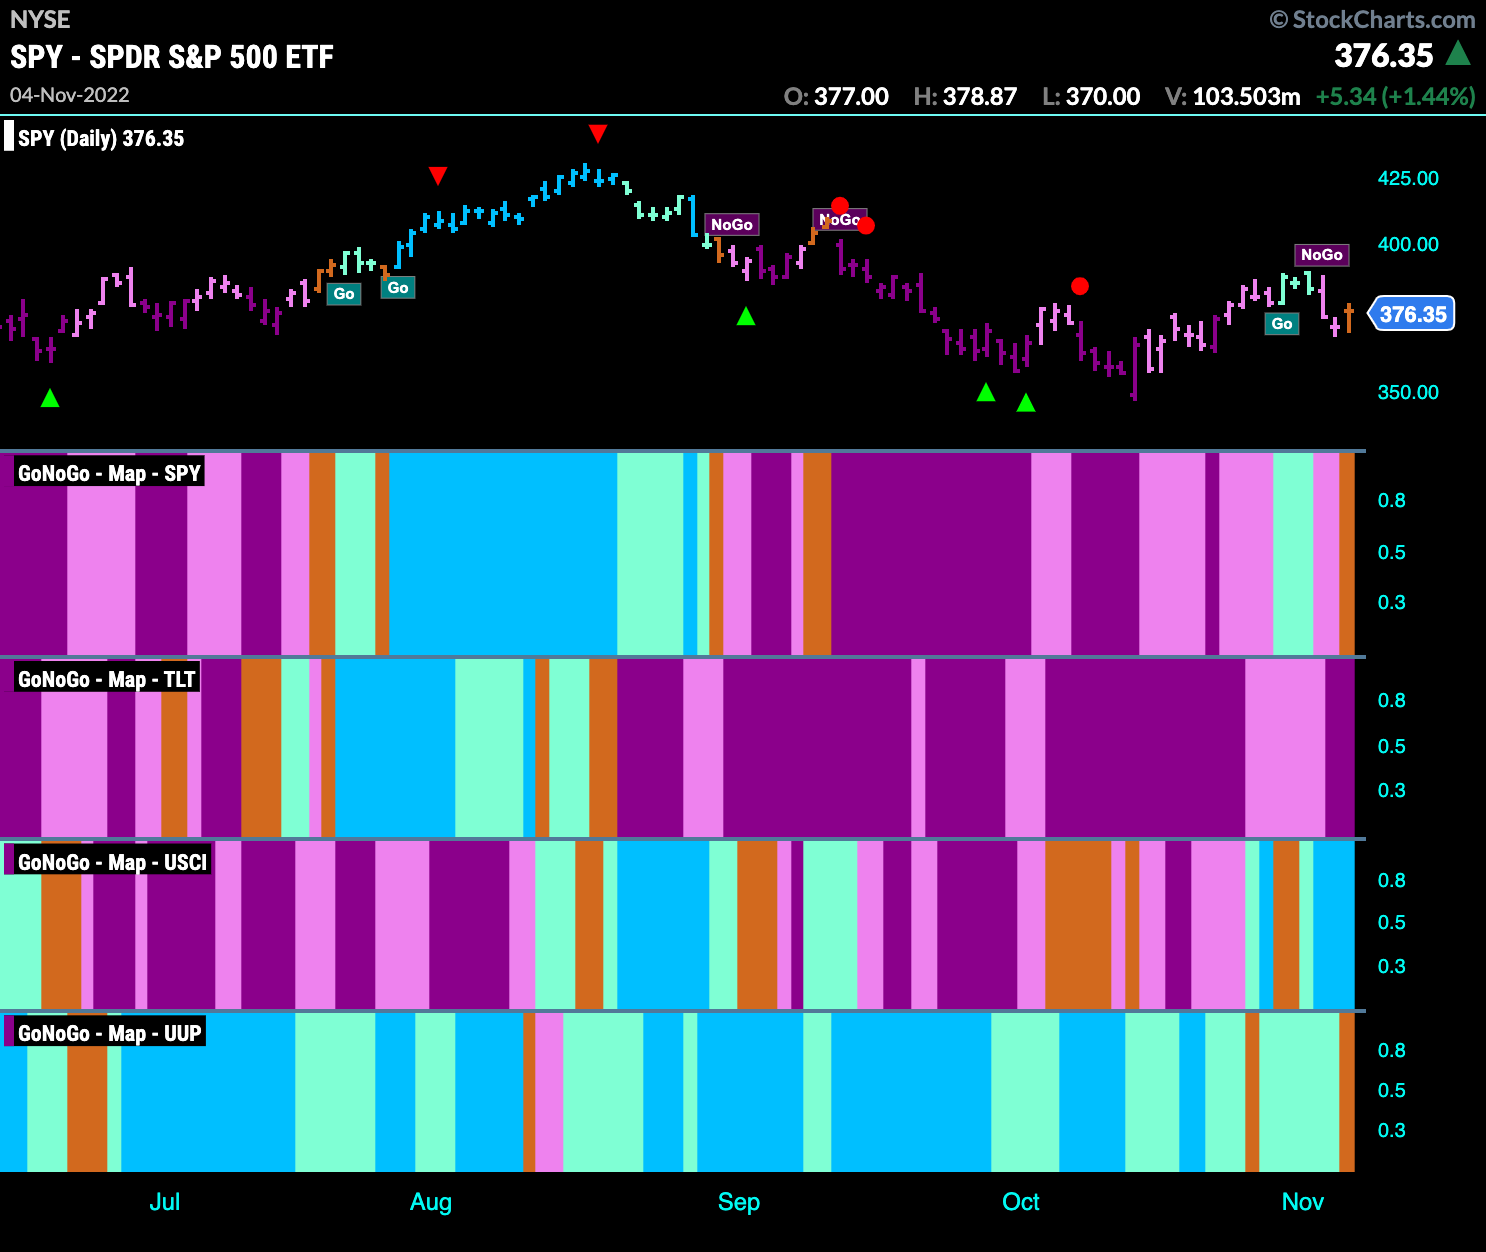
Good morning and welcome to this week’s Flight Path. Let’s take a look at the GoNoGo Asset map below. The chop continues as U.S. equities tries to turn right around from the “NoGo” to paint an amber “Go Fish” bar. Commodities look strong as we see bright blue “Go” bars to end this week. The dollar falters again, painting an amber “Go Fish” bar. Is this the moment the trend in the greenback crumbles?
S&P 500 Shows Uncertainty
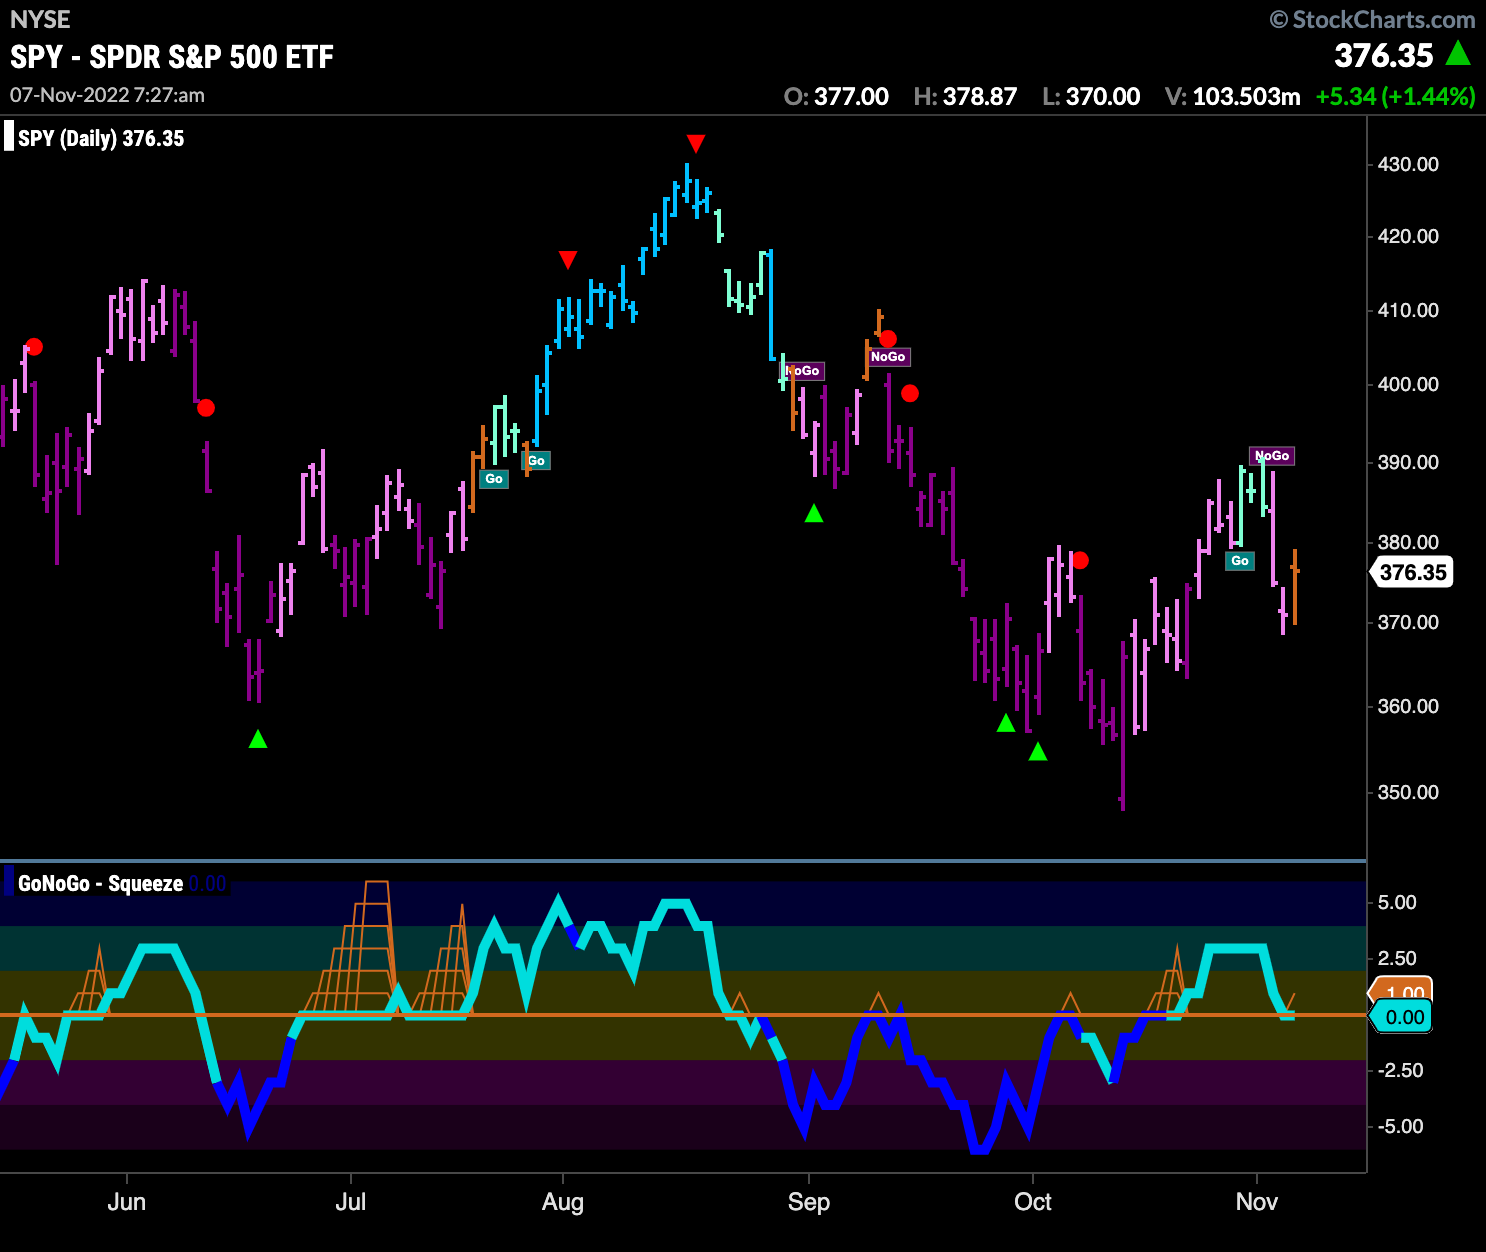
What a week for the U.S. domestic markets. Beginning the week in a “Go” trend we saw a strong down day mid week that painted a weak pink “NoGo” bar, but a rally on Friday saw an amber “Go Fish” bar. This week we will look to see in which direction the trend resolves. GoNoGo Oscillator is back testing the zero line from above and if we find support here that will help give price the push it needs to start painting “Go” bars.
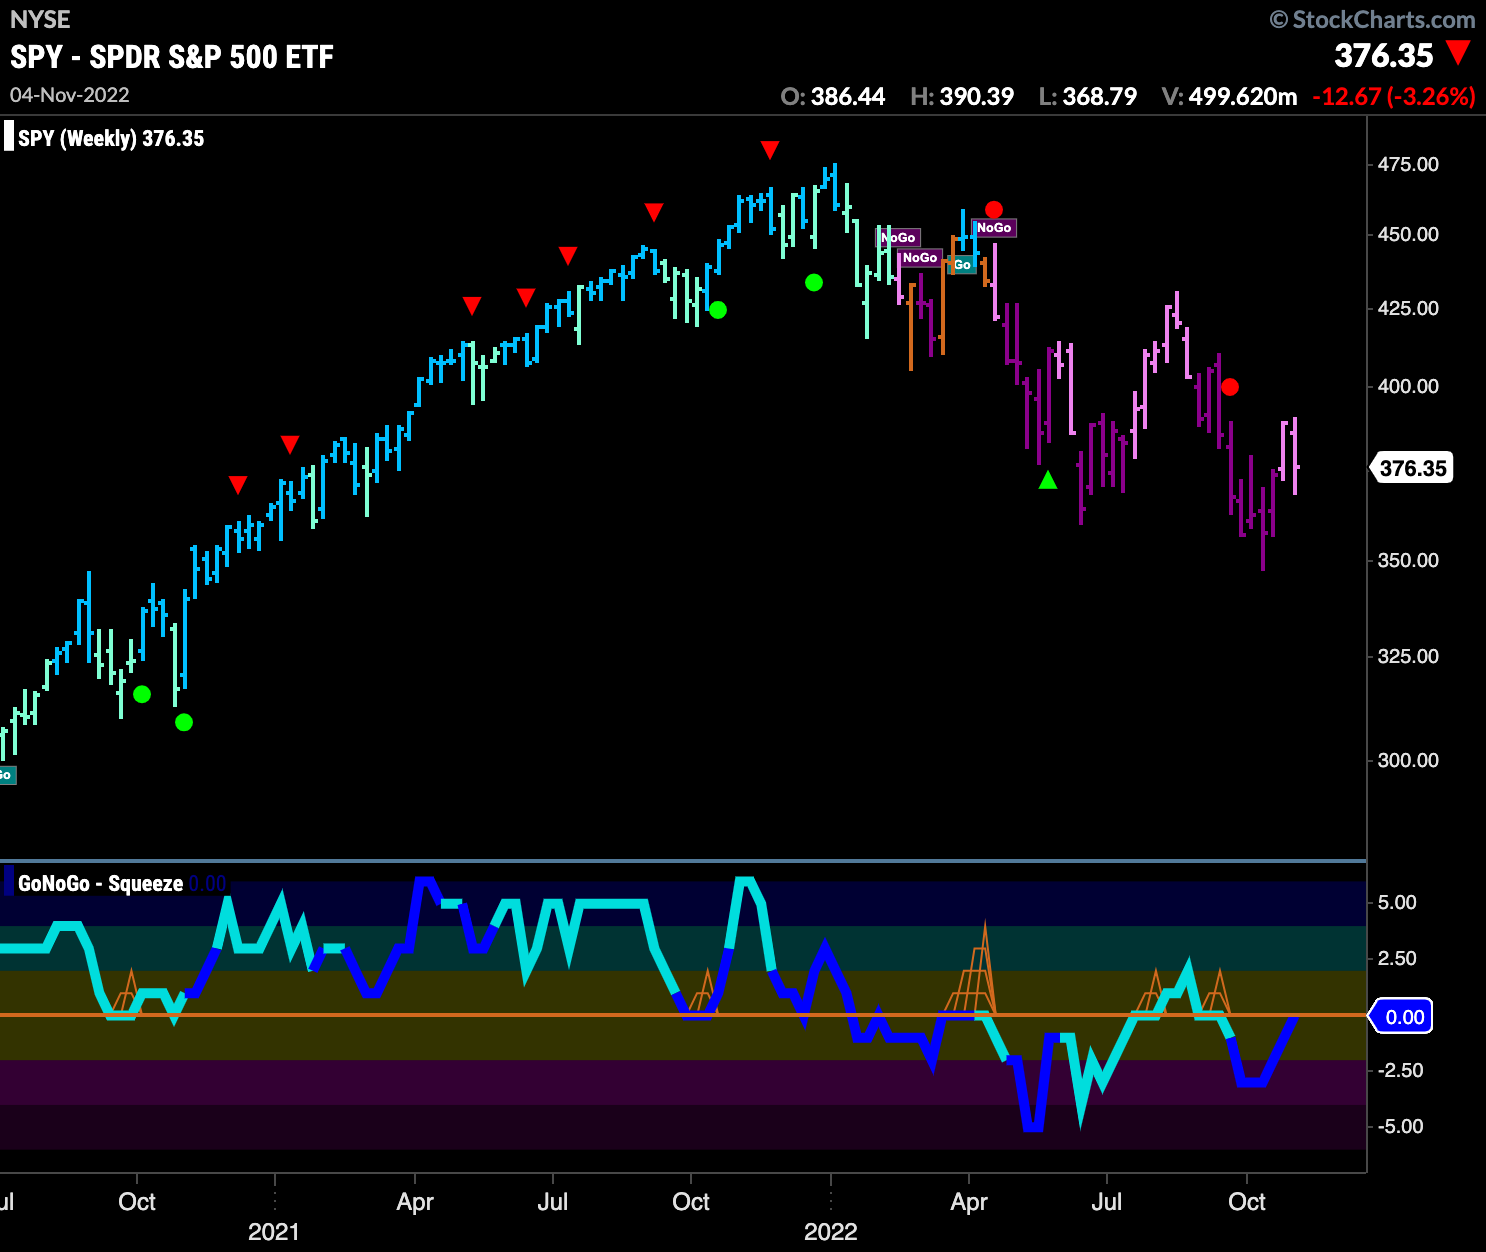
We mentioned it last week, the year has been defined by lower highs and lower lows, and seductive relief rallies that offer the hope of something more constructive. The price action we have seen over the last few weeks on the daily chart has caused many to be optimistic. On the weekly, it looks a lot like another lower high. GoNoGo Oscillator is testing the zero line from below and we will look to see if that provides resistance.
Treasury Rates Re-enter Strong “Go” trend
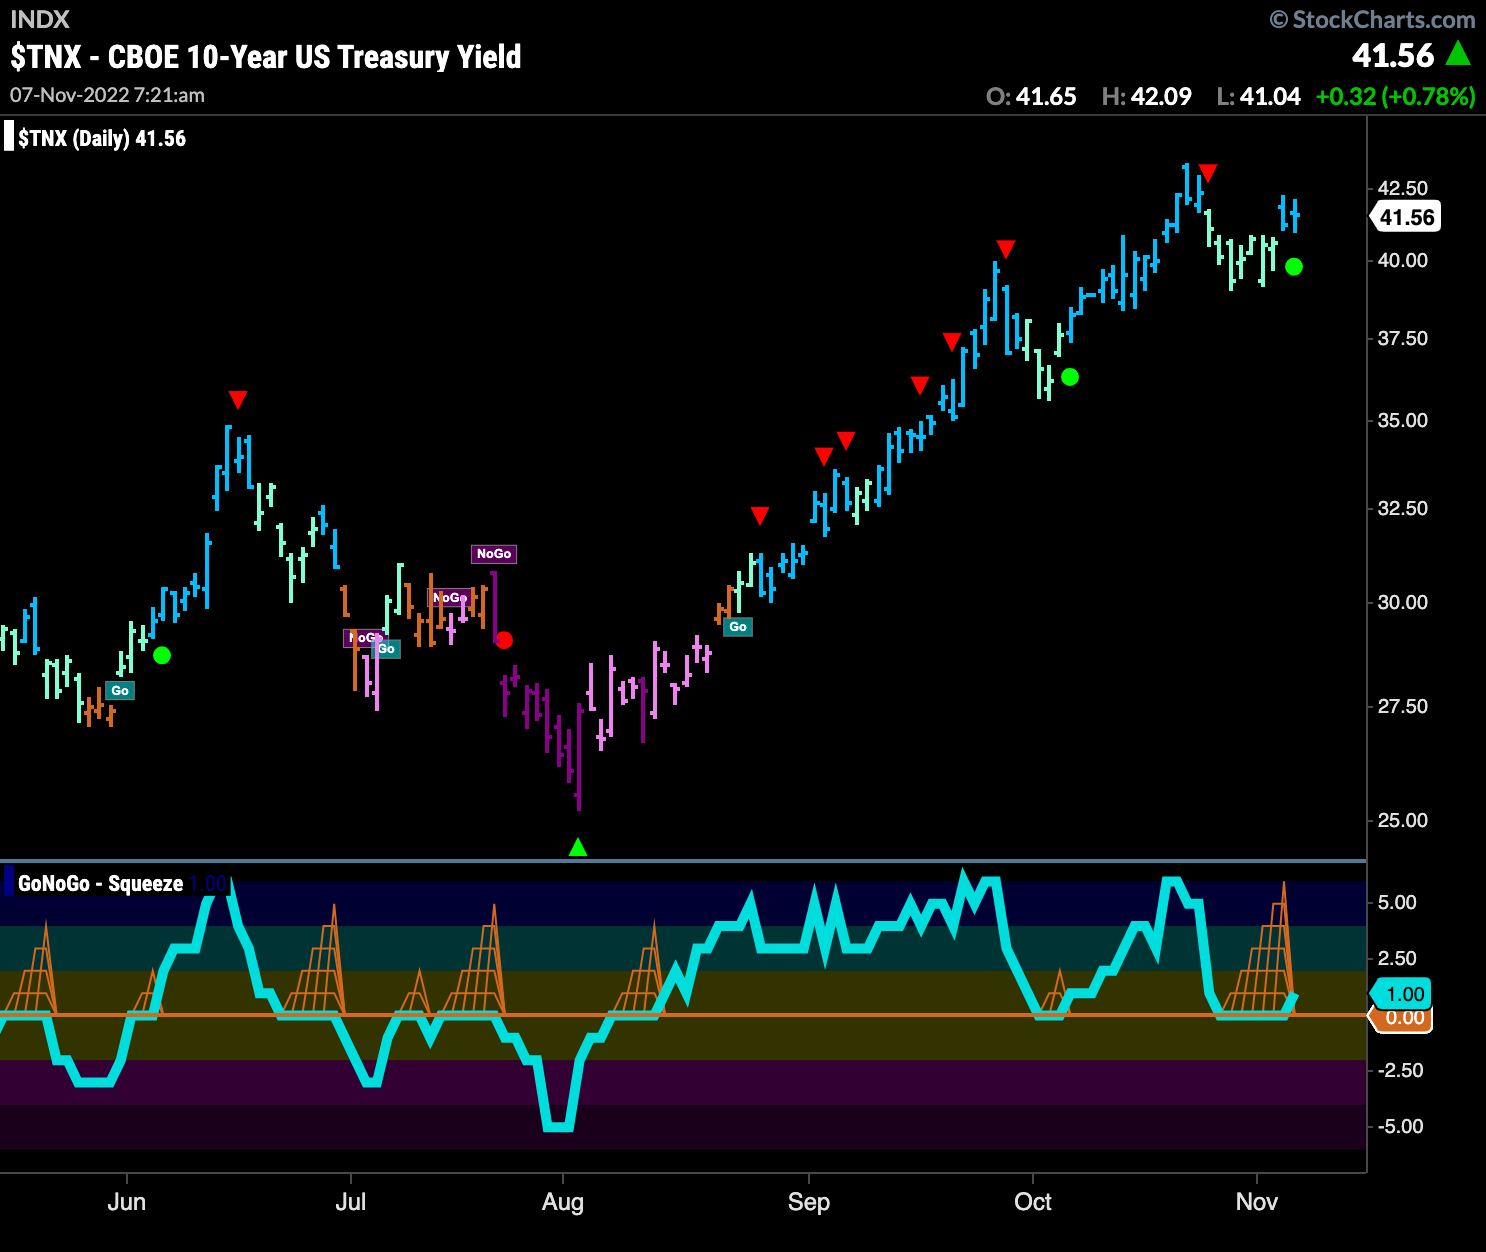
After falling away from the last high at the end of October price painted weaker aqua “Go” bars. Hinting at this likelihood we saw Go CounterTrend Correction Icon (red arrow) shortly after the high. GoNoGo Oscillator fell to test the zero line and as it remained there, a GoNoGo Squeeze formed. Finding support, GoNoGo Oscillator has broken out of the Squeeze into positive territory and GoNoGo Trend is once again painting strong blue bars as we see a Go Trend Continuation Icon (green circle) under price.
Uncertainty Abounds in the Dollar
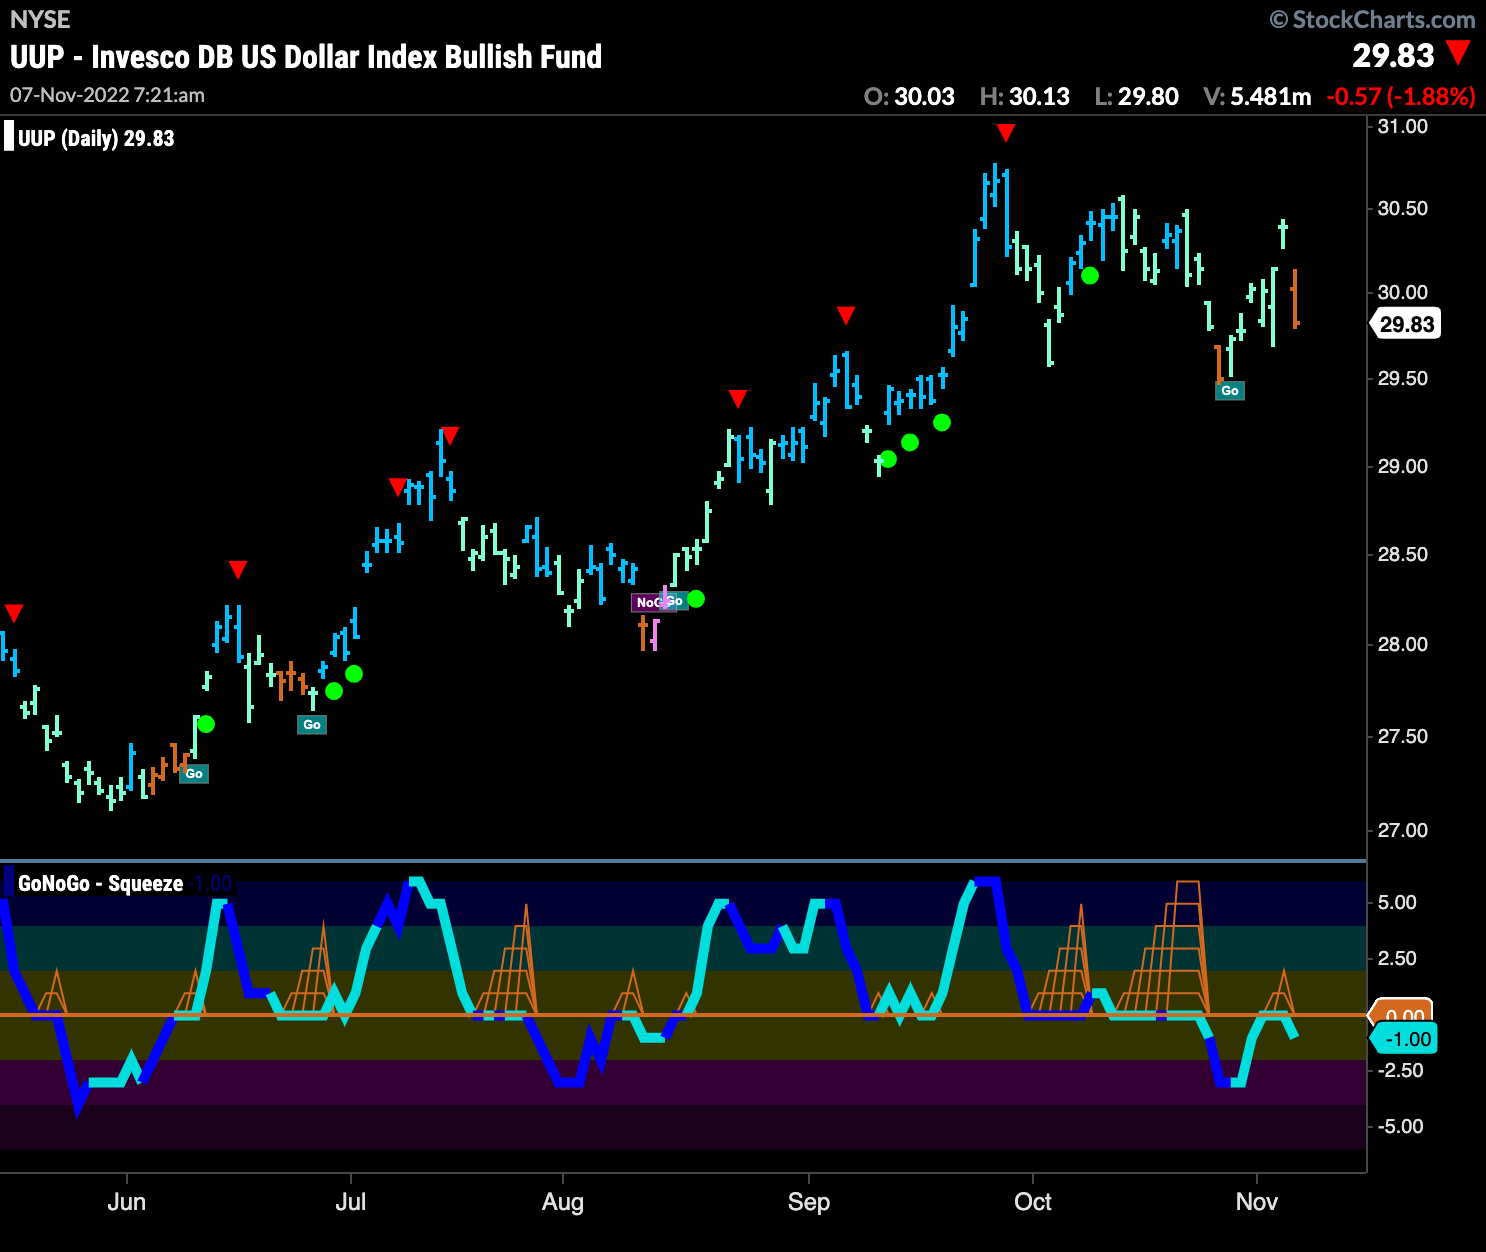
We are really seeing the dollar struggle to continue it its “Go” trend. This correction from the high in September has been longer and more destructive than previous corrections in this “Go” trend. A second amber “Go Fish” bar appeared on Friday as price opened and traded lower. GoNoGo Oscillator has been in negative territory and has now found resistance at that level.
Taking a look at the weekly chart we can see that we are at an important inflection point on the larger time frame chart as well. Coming off the recent high in the persistent “Go” trend has caused GoNoGo Oscillator to fall to test the zero line. We will watch closely now. If the oscillator can find support at the zero line it is likely the trend will continue. A break into negative territory would be a real concern. 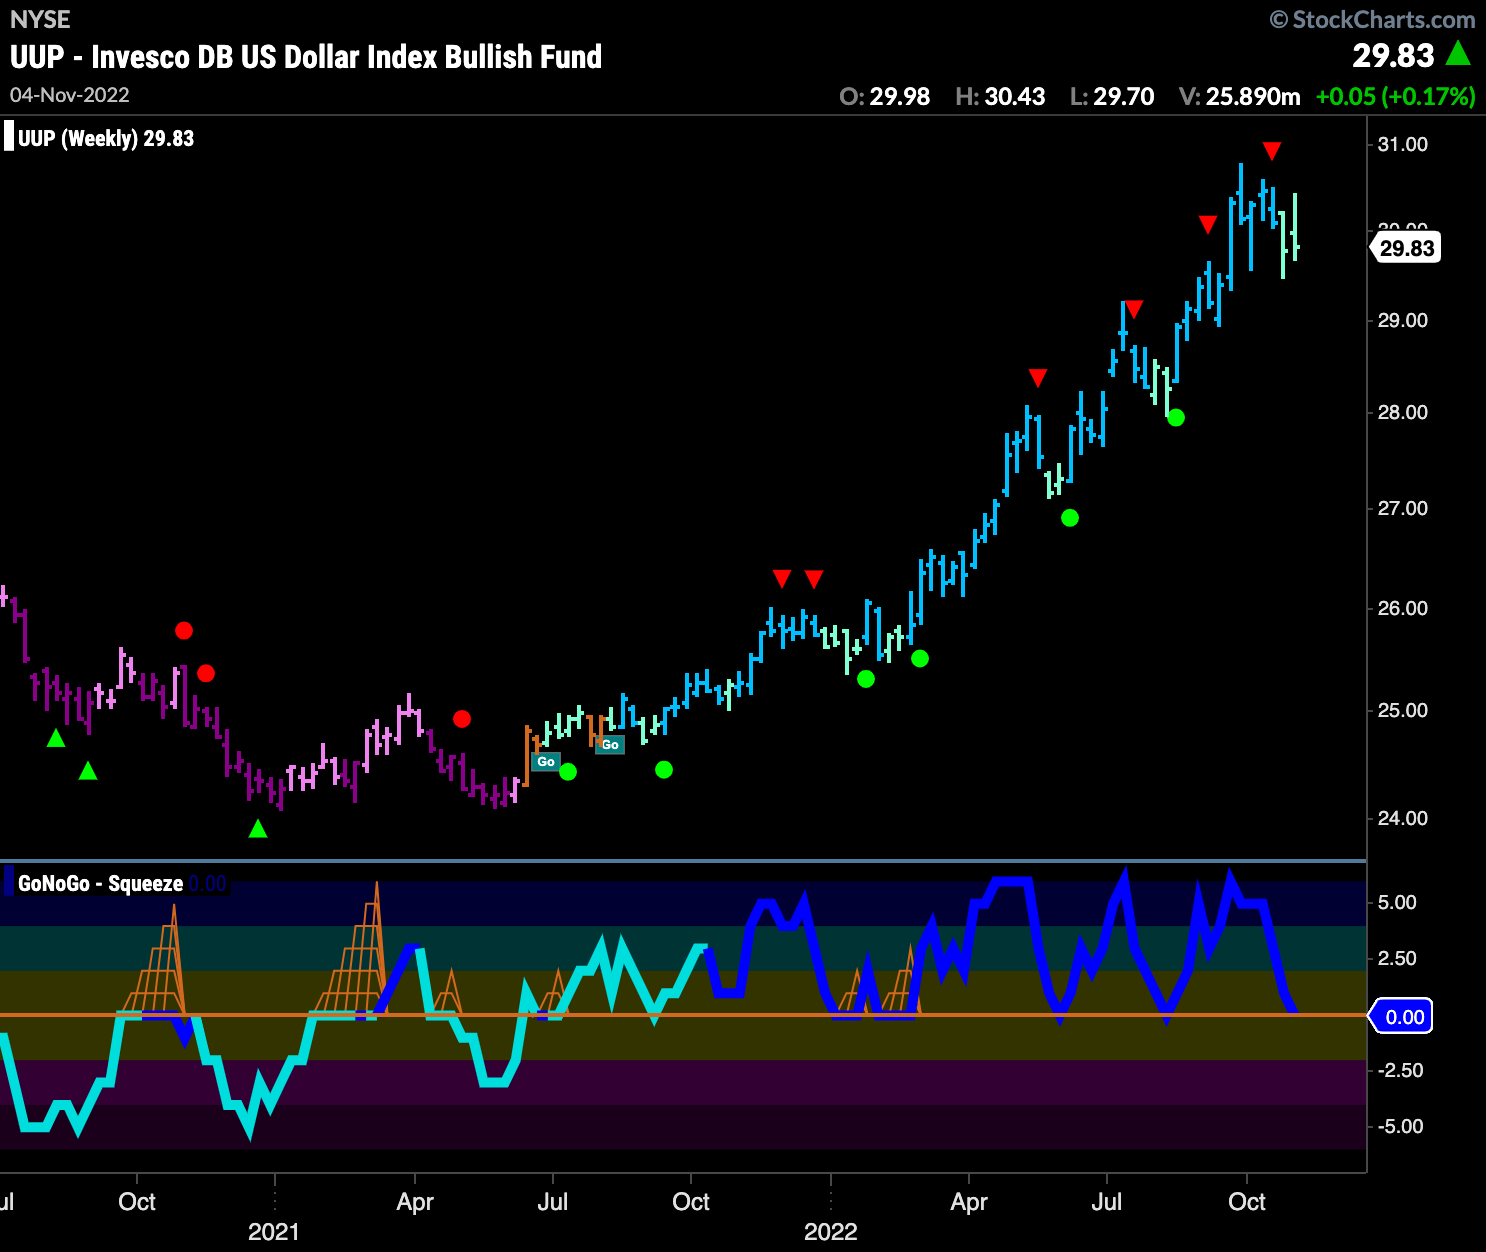
“Go” trend in oil Continues
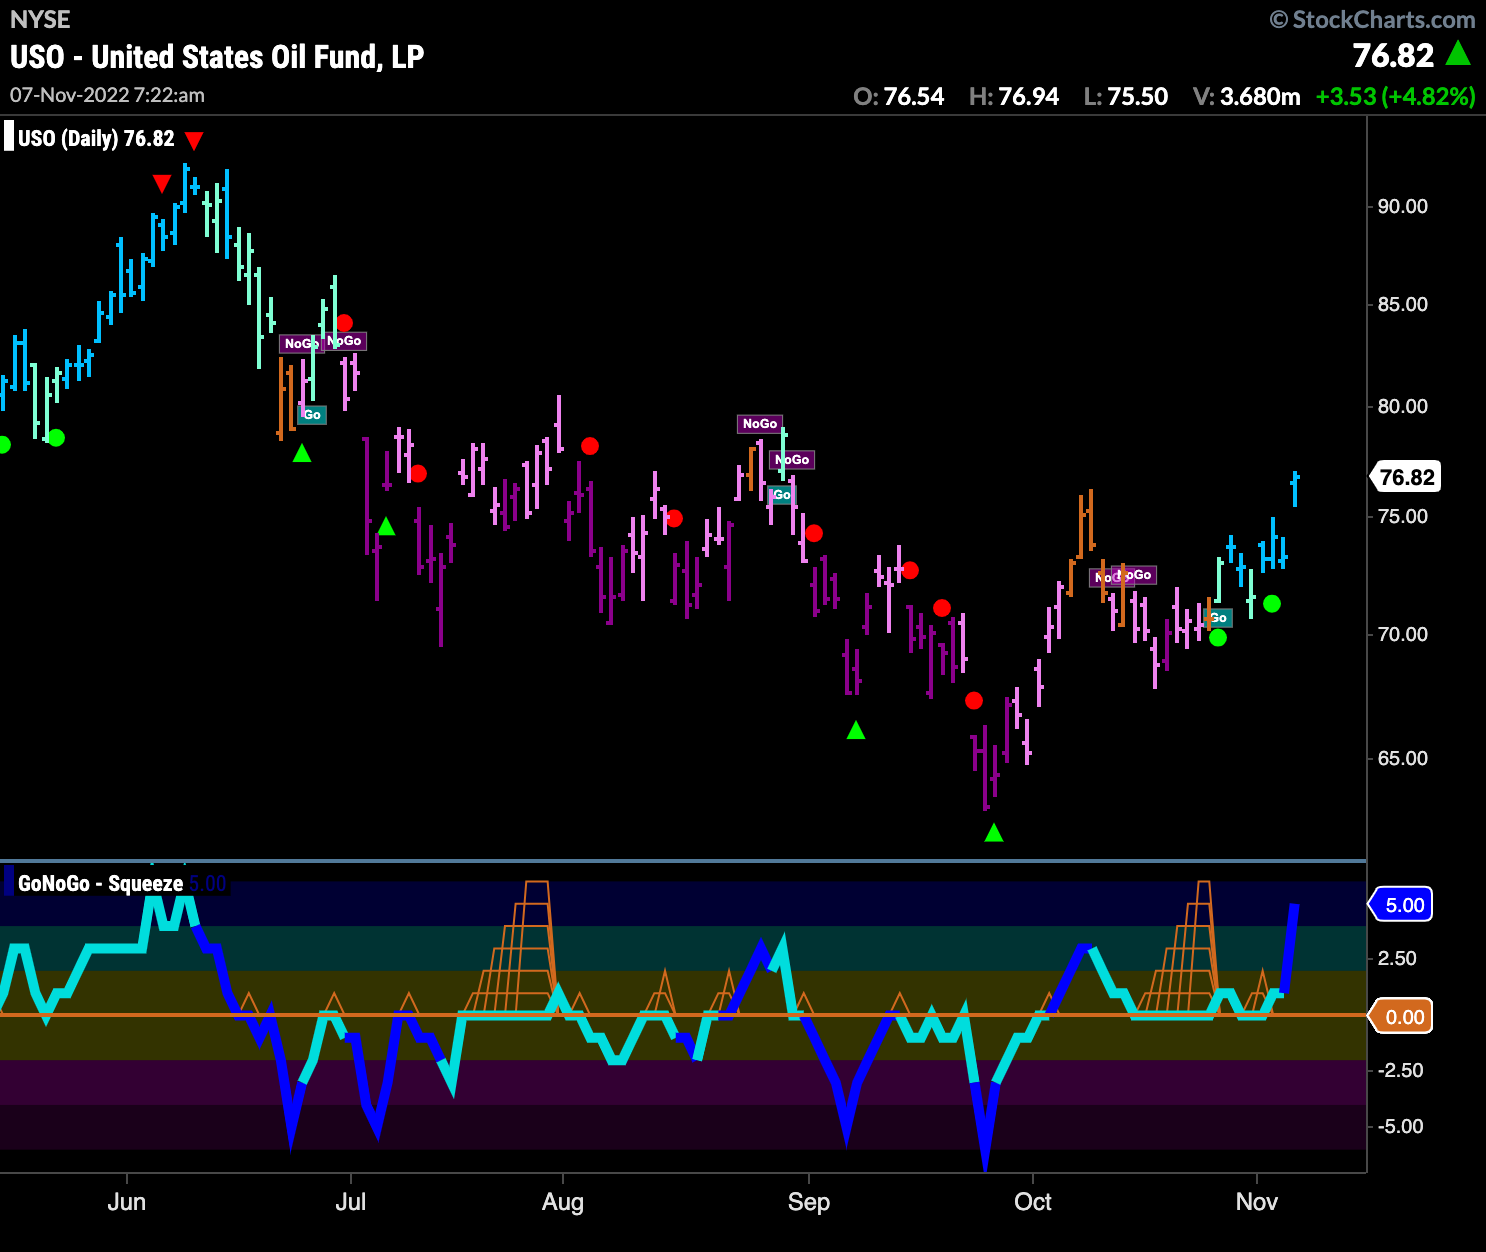
GoNoGo Oscillator found the support it was looking for at the zero line and has raced into overbought territory. GoNoGo Trend sees the “Go” trend continue and price climb to an intermediate high. This is now a strong looking chart for U.S. Oil.
Sector RelMap
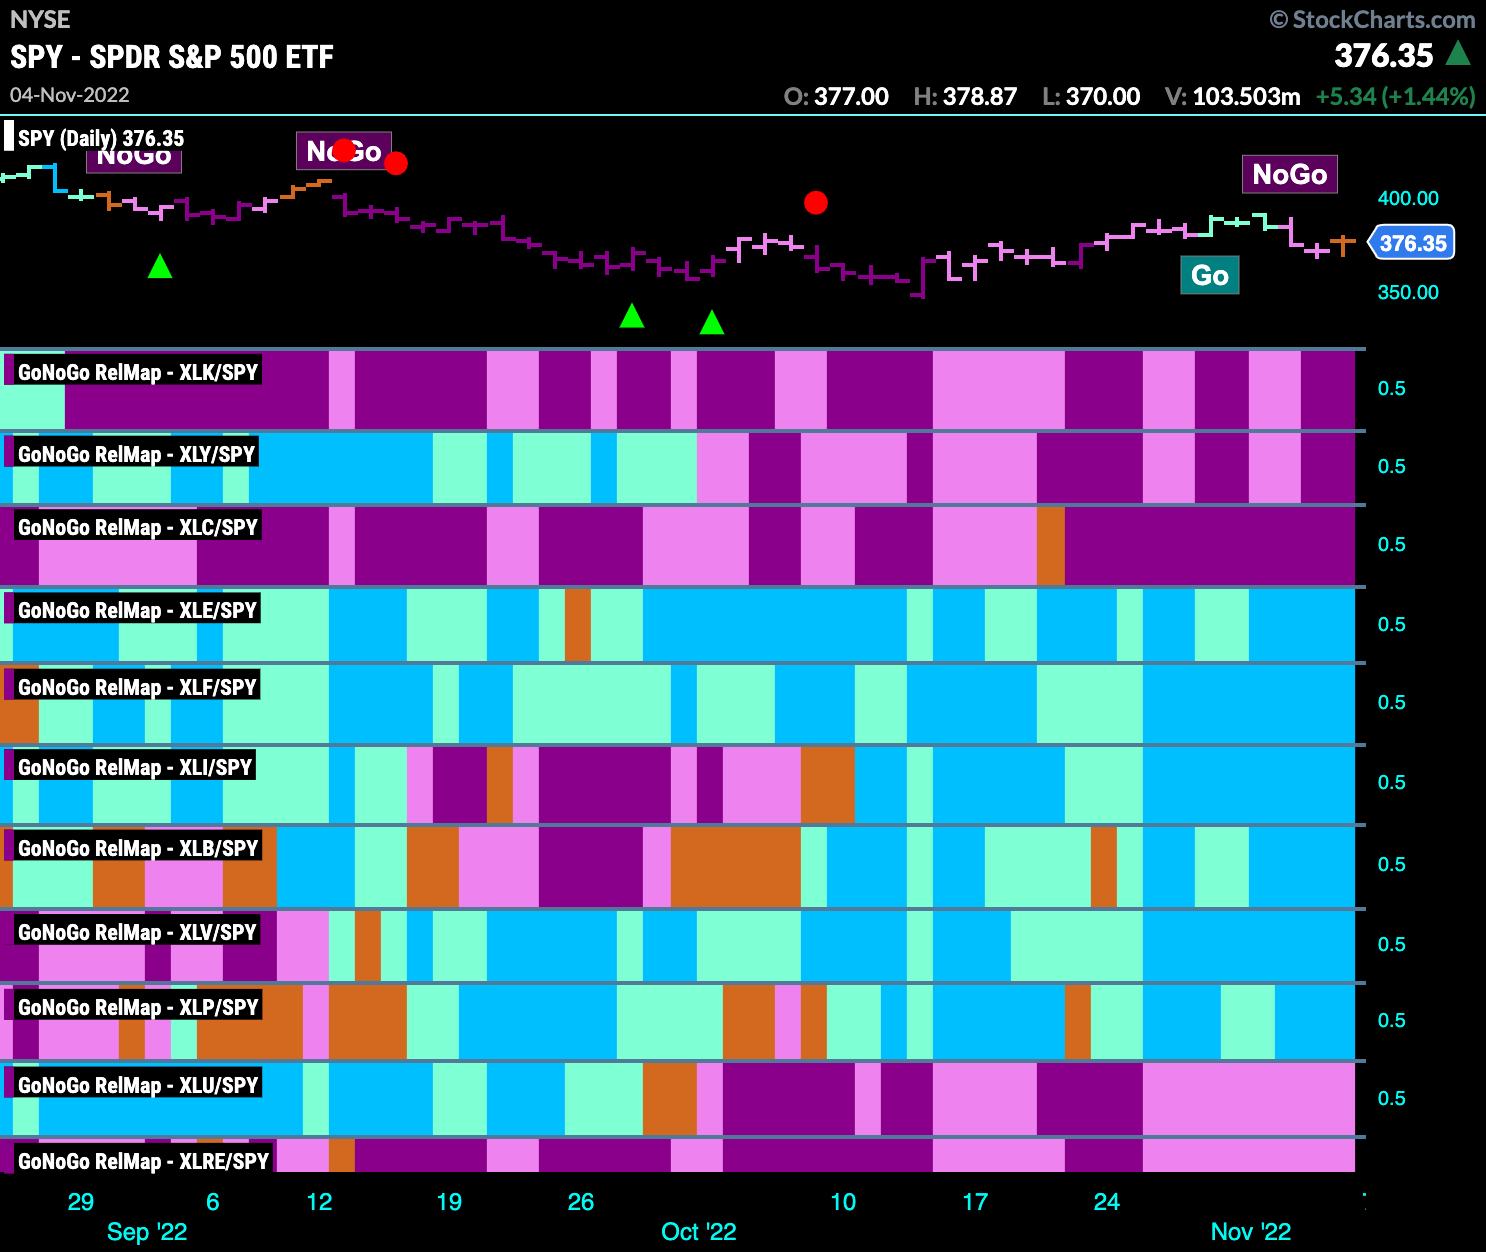
Below is the GoNoGo Sector RelMap. This GoNoGo RelMap applies the GoNoGo Trend to the relative strength ratios of the sectors to the base index. Looking at this map, we can quickly see where the relative outperformance is coming from as well as which sectors are lagging on a relative basis. Again, it remains a “NoGo” for growth. Technology, communications and discretionary are in “NoGo” trends. A clear pattern has emerged, with the sectors in the middle of the map leading in terms of relative performance. Energy, financials, materials, industrials, healthcare and staples are in relative “Go” trends.
Materials Looking to Move Higher
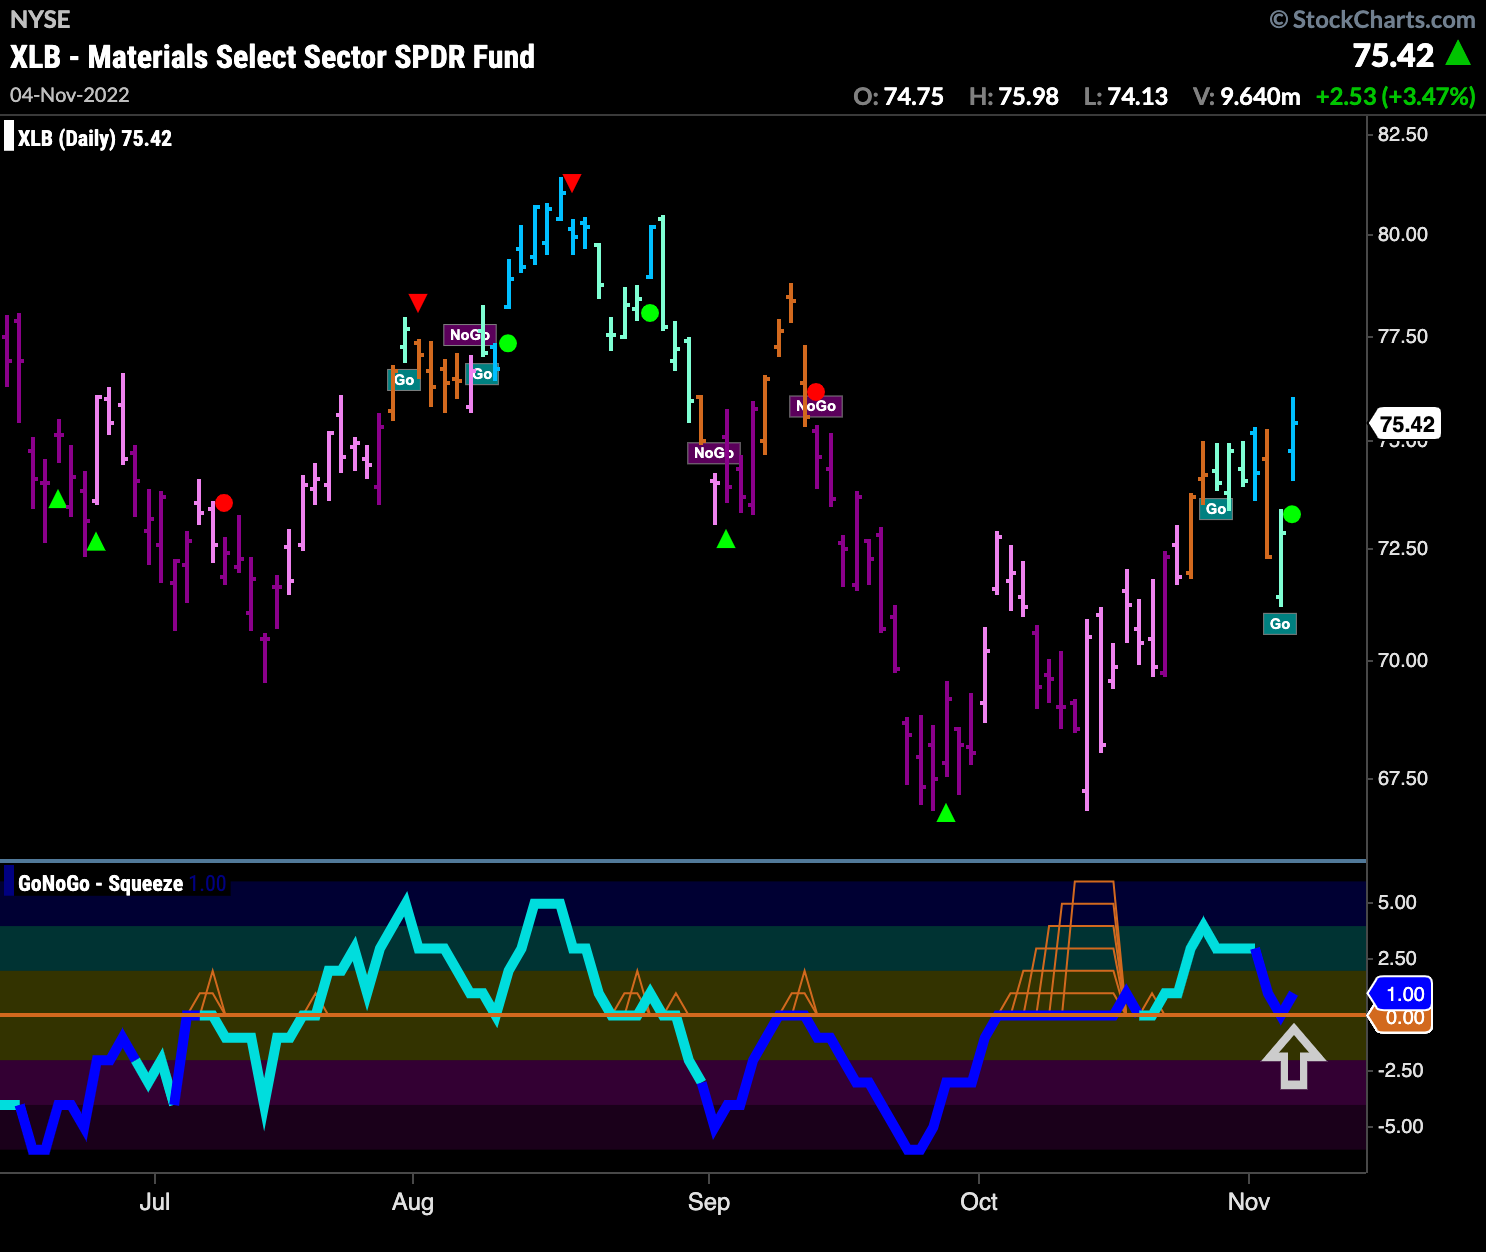
$XLB finished the week on a strong blue “Go” bar as price made a higher high. After price found support at the lows in mid October, we saw GoNoGo Oscillator break into positive territory as it broke out of a max GoNoGo Squeeze. This positive momentum saw GoNoGo Trend able to start to paint “Go” bars. As GoNoGo Oscillator successfully retested the zero line we see a Go Trend Continuation Icon (green circle) appear under the current price bar.
Steel Dynamics Looks for Bull Flag Breakout
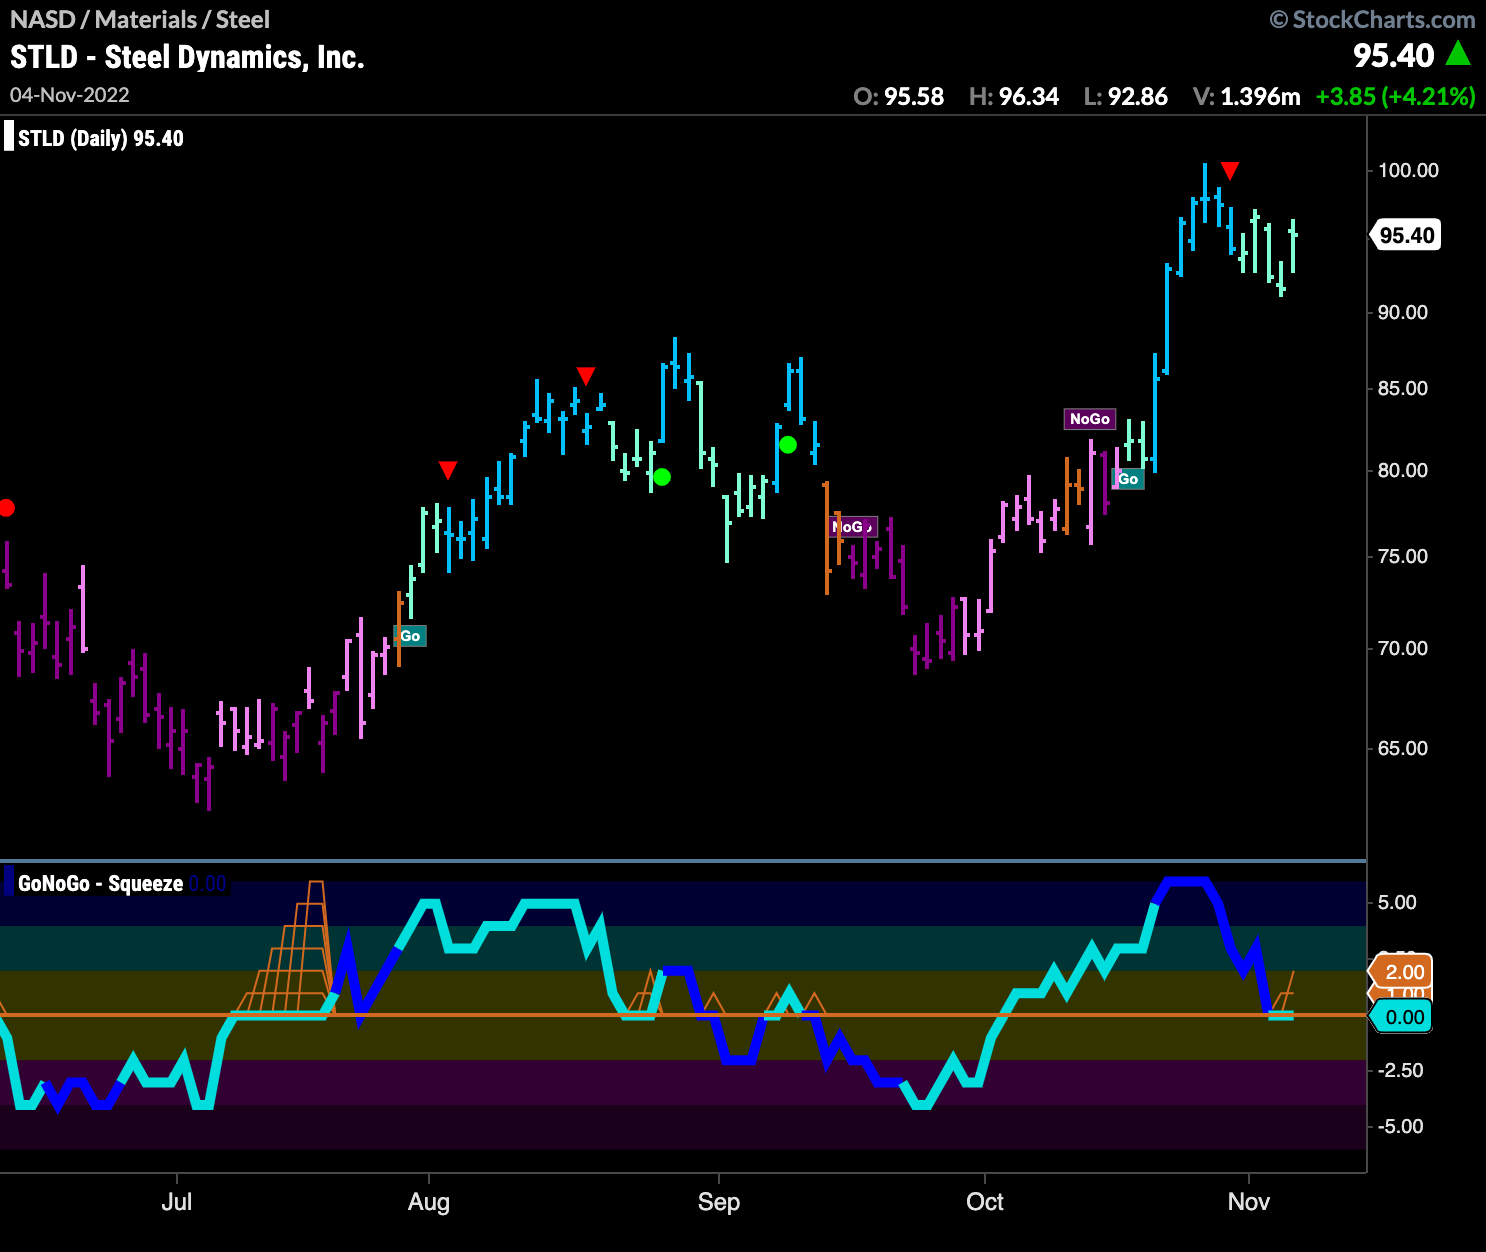
Within the materials sector, $STLD looks strong. After a new “Go” trend was identified we have seen price race higher before a Go CounterTrend Correction Icon (red arrow) signaled the start of what could be a Bull Flag pattern. With price moving against the trend, GoNoGo Oscillator has fallen to test the zero line. We will look to see if it can find support here. If it does, and rallies back into positive territory we will see a Go Trend Continuation green circle appear under the price bar which may give price the push it needs to break higher.
Staples Looking for Support in “Go” trend
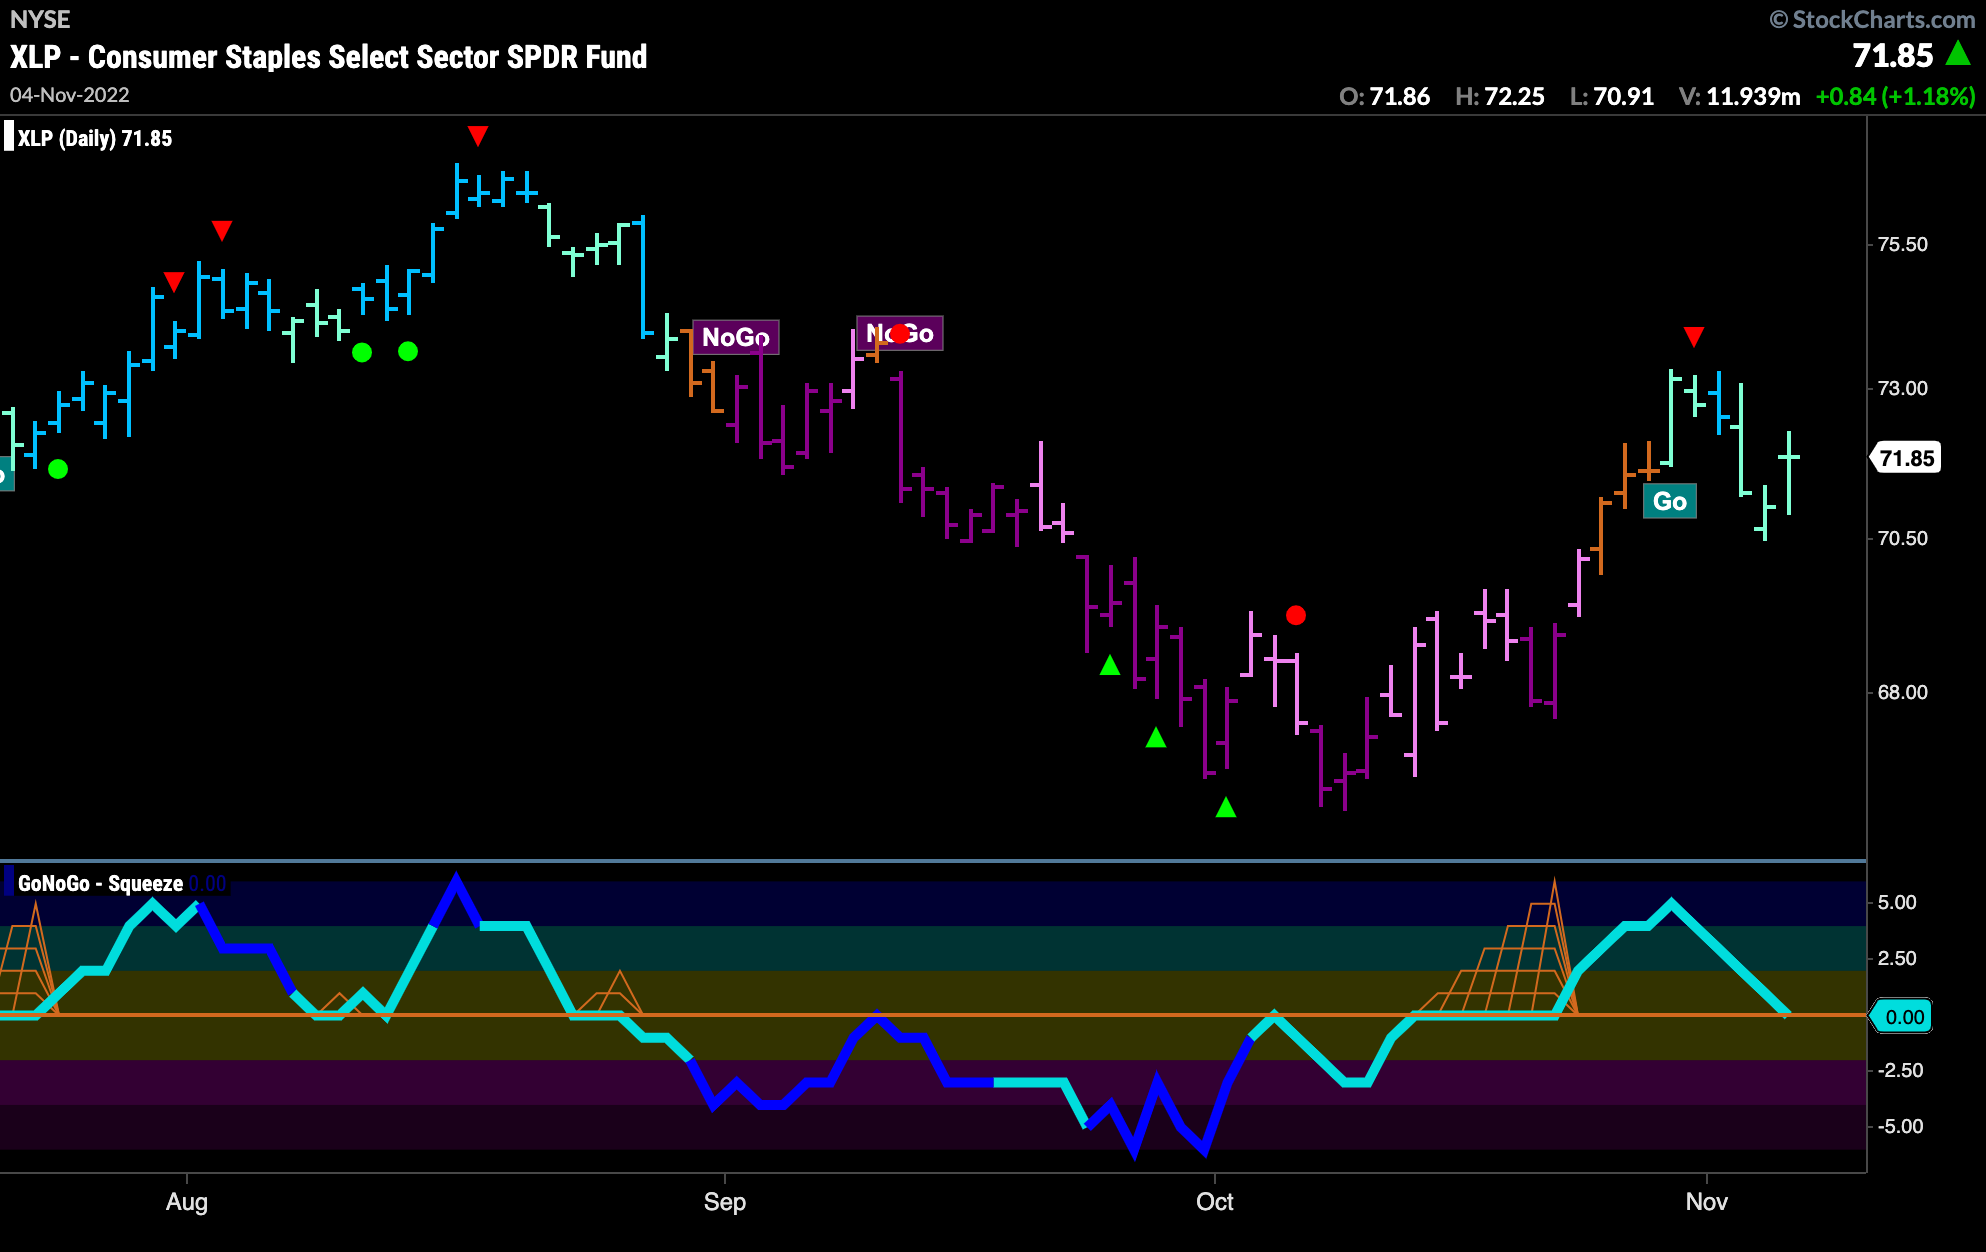
We have been seeing relative outperformance in staples for months and we see the pure “Go” trend in place on the chart below. After coming out of a basing “NoGo” pattern we saw GoNoGo Oscillator ride the zero line and ultimately break out of a max GoNoGo Squeeze. This led to a new “Go” trend emerging. Now, as price consolidates, we see GoNoGo Oscillator testing the zero line from above. If that level holds as support, look for price to make a new high.
Albertsons Companies Flags Go Trend Continuation
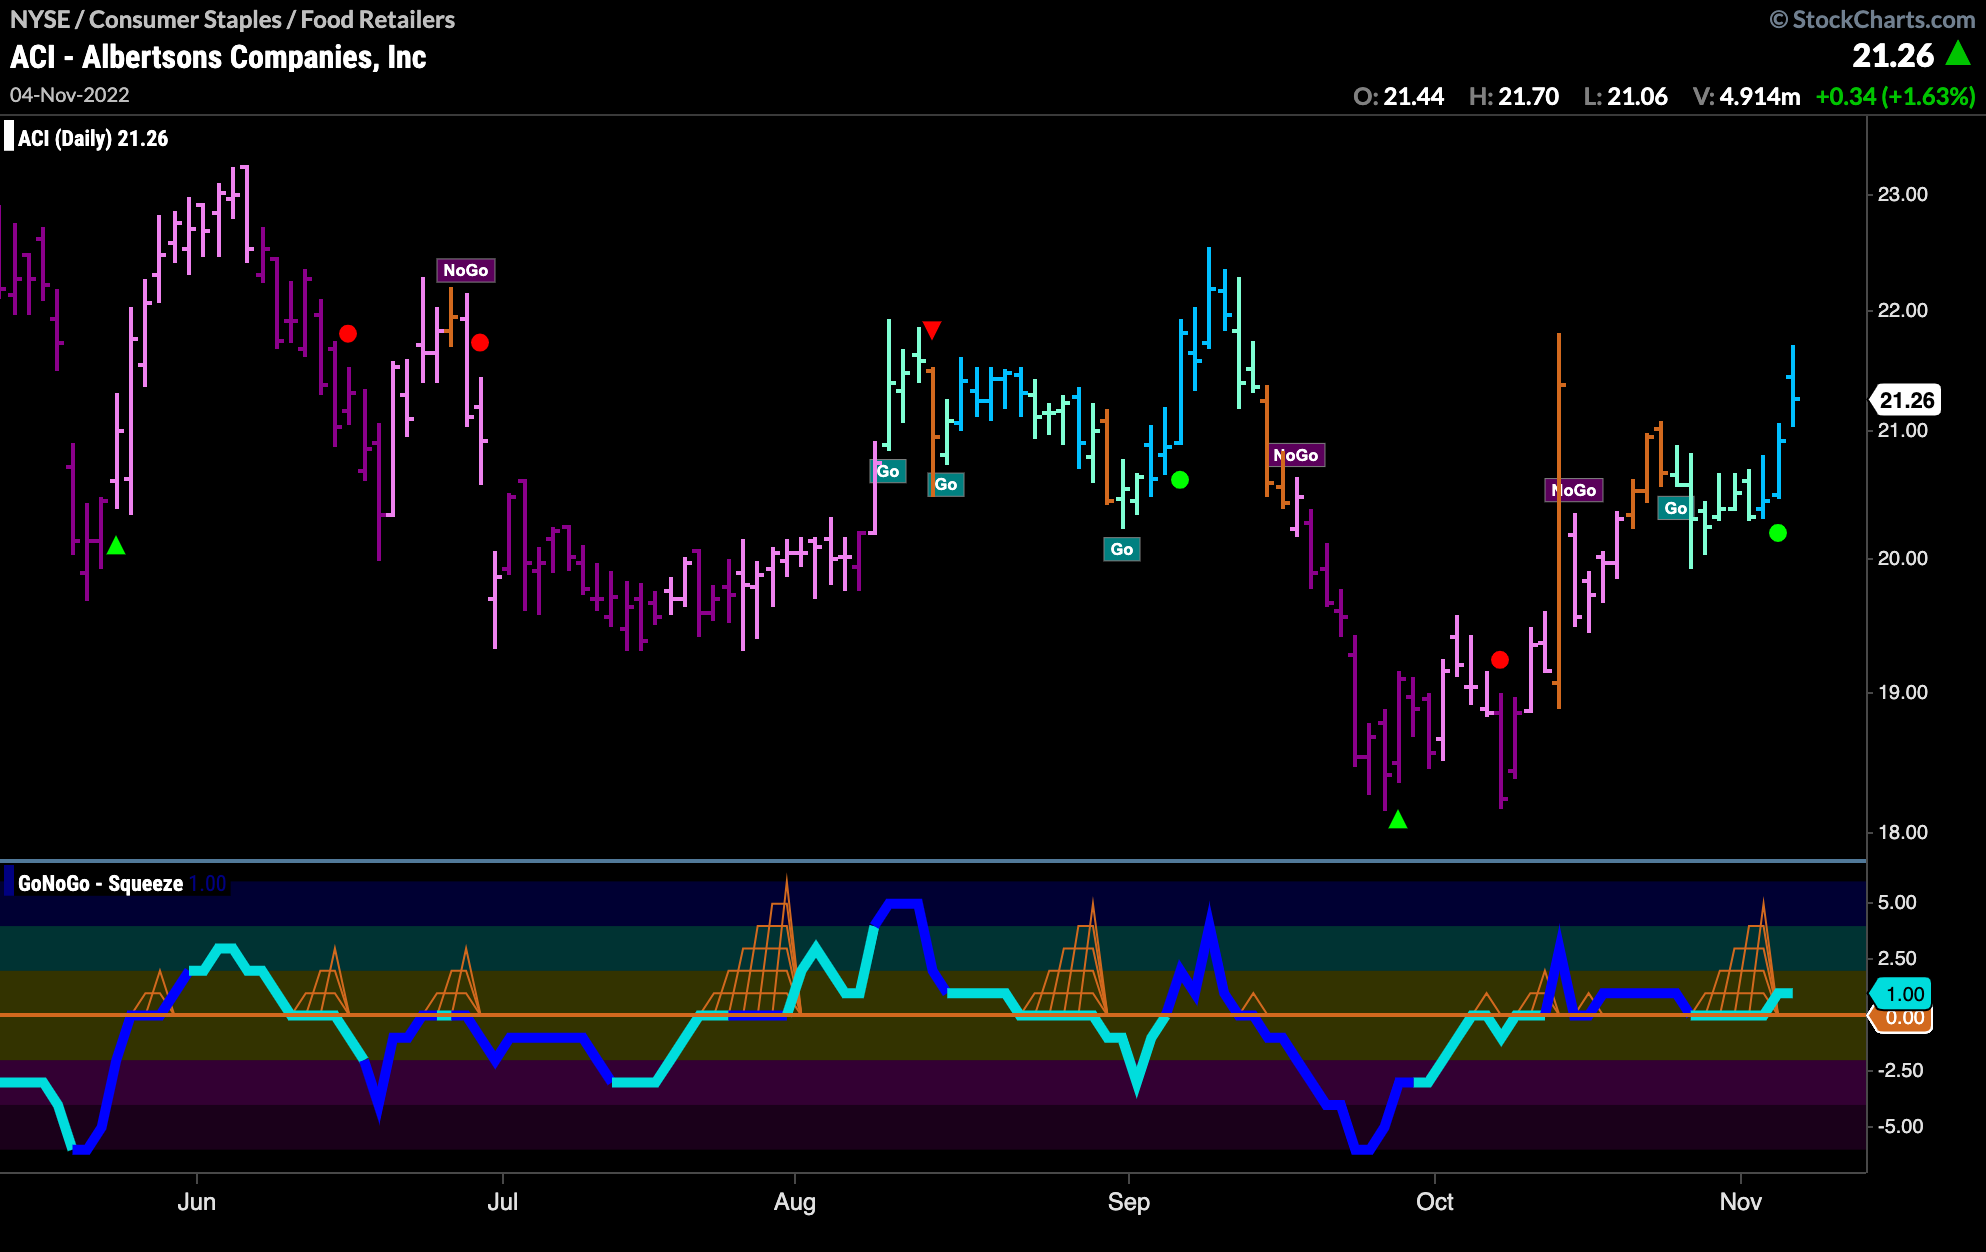
With the staples sector holding its own, the below chart shows $ACI, a food retailer setting up nicely. After GoNoGo Oscillator was able to break above the zero line in early October, we have seen follow through as GoNoGo Trend paints “Go” bars this month. Having retested the zero line again and finding support, we see a Go Trend Continuation Icon (green circle) appear under the penultimate price bar telling us that momentum is once again in the direction of the “Go” trend. Look for price to make an attempt at a new high.
