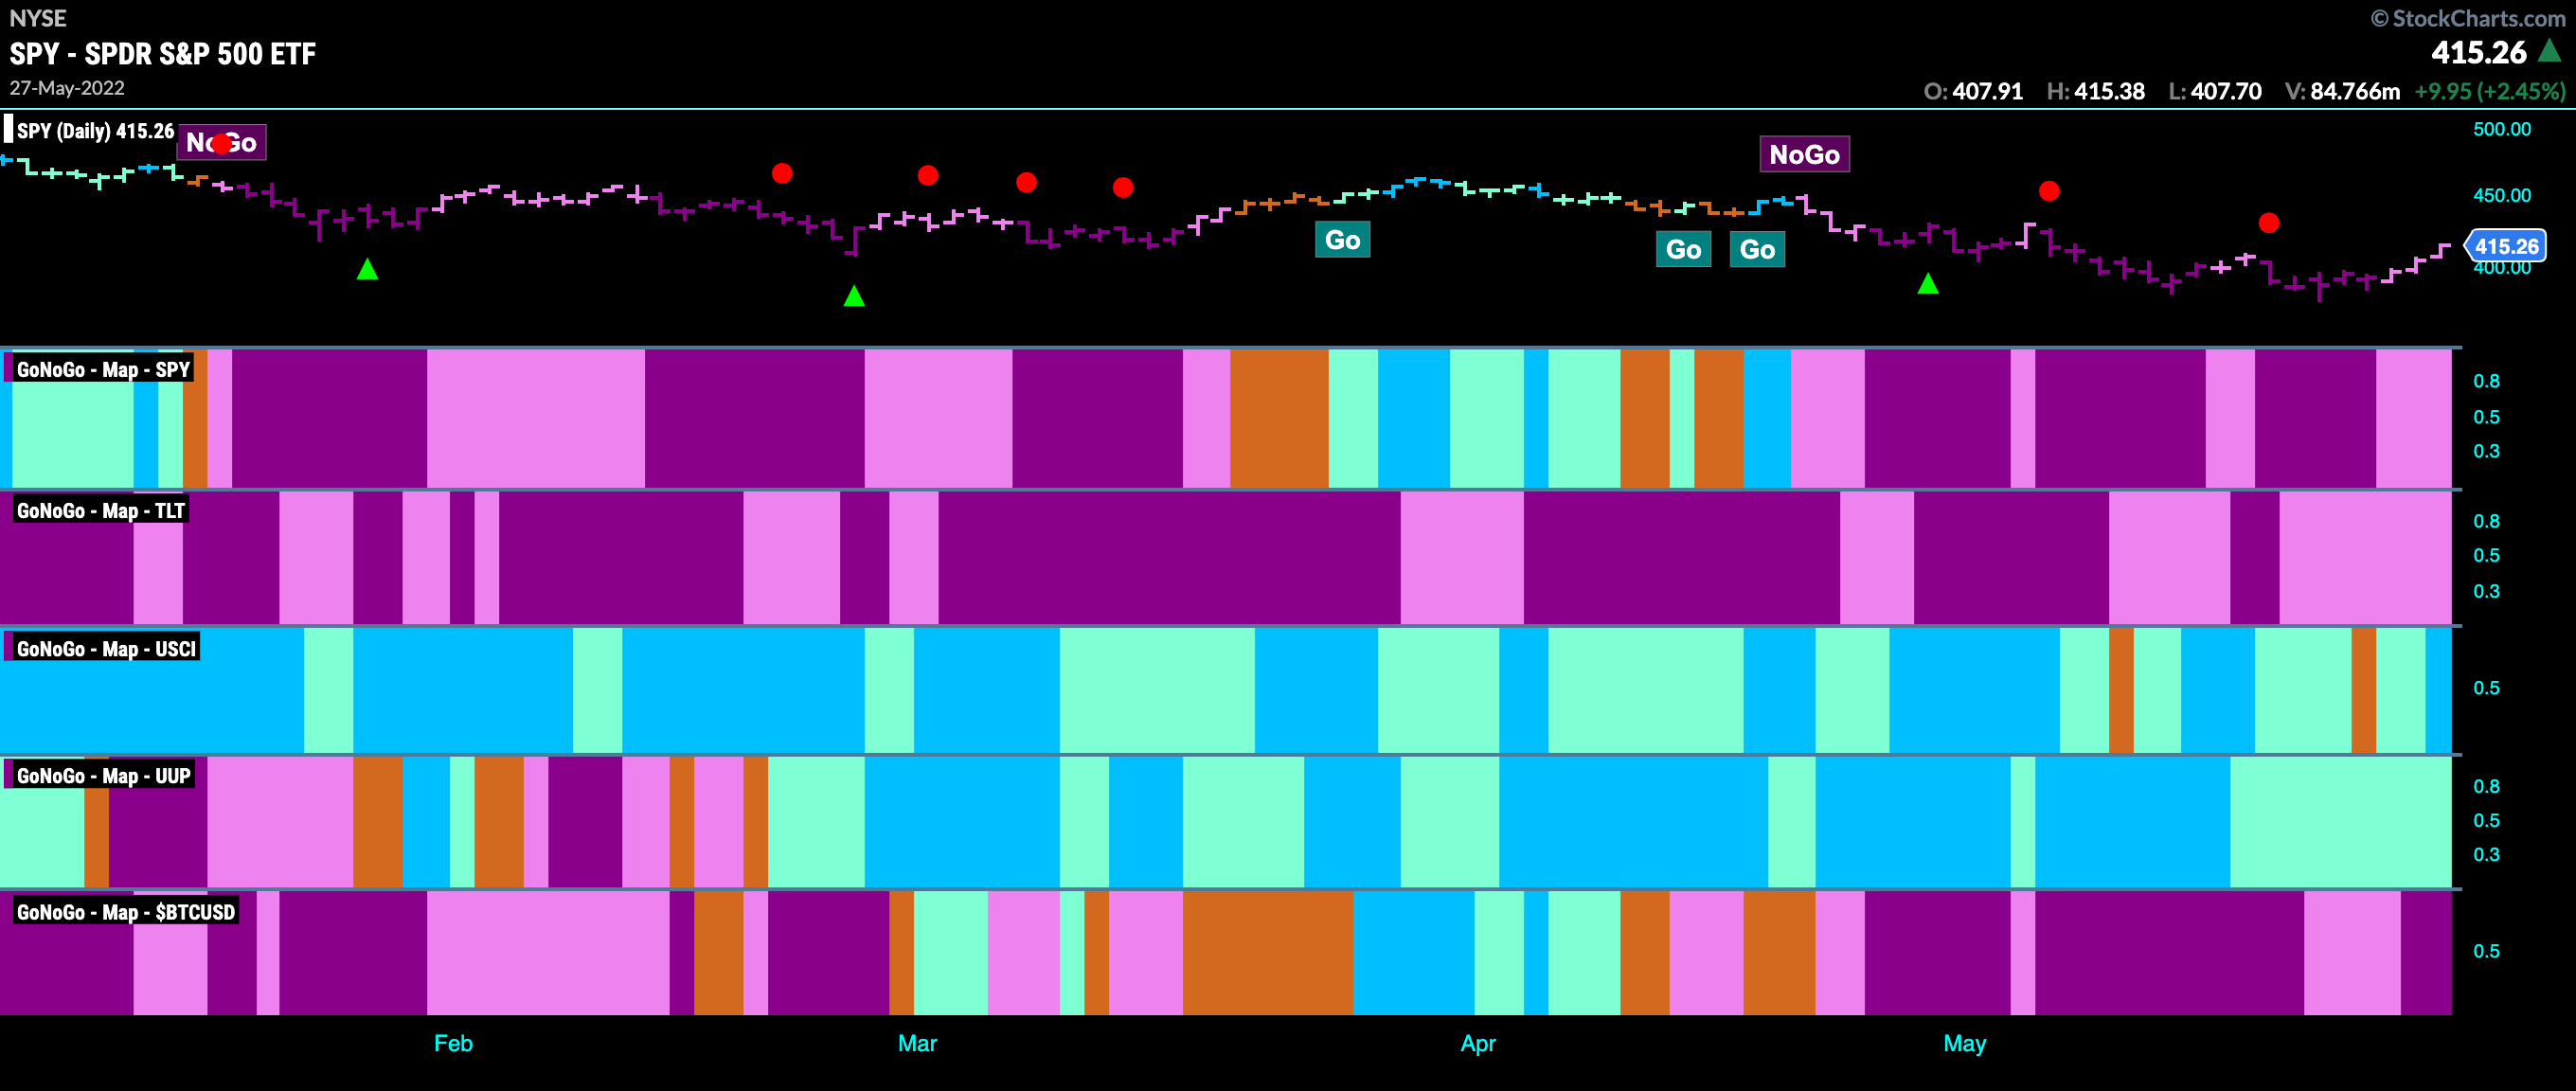

Good morning and welcome to this week’s Flight Path. Let’s take a look at the GoNoGo Asset map below. Equities saw some strength this week as prices rallied late. GoNoGo Trend shows that the trend weakened as it now paints pink “NoGo” bars. Treasury bond prices likewise have been in a weaker pink “NoGo” trend for a couple of weeks. The trend in the dollar is threatened by a string of aqua “Go” bars as prices come off the highs but commodities as a group saw a return to strong blue “Go” bars as the week ended.

Sector Performance
Below is the GoNoGo Sector Relmap. This GoNoGo Relmap applies the GoNoGo Trend to the relative strength ratios of the sectors to the base index. Looking at this map, we can quickly see where the relative outperformance is coming from as well as which sectors are lagging on a relative basis. The outperformers remain mostly the same, with the value sectors this week being joined by financials as the sector finally breaks out of the relative “NoGo” trend that it has been in. Energy, industrials, materials, healthcare s taples and utilities continue to outperform. In terms of relative underperformance, we still see “NoGo” trends in communications and discretionary as well as real estate. Technology, interestingly is painting an amber “Go Fish” bar this week.

SPY
Below is the daily chart of $SPY. There are signs that the “NoGo” is losing a little of its grip. Last week we noted the bullish divergence between the lower lows in price and the higher lows in the GoNoGo Oscillator. This week, we saw the oscillator ride the zero line for a few bars then break out of the squeeze at the end of the week and dip its nose into positive territory. As this happened, price has moved higher, above short term resistance. We will wait to see if this is enough to trigger a change in the GoNoGo Trend.

On a weekly basis, we can see that price has pushed back into the channel that we have on the chart. Having broken below this level in preceding weeks, this was a good sign as price rallied strongly late in the week. We must bear in mind that the weight of the evidence on the longer time frame chart still suggests that we are in a strong “NoGo” trend, with purple bars and GoNoGo Oscillator below zero on heavy volume. However, bouncing back into that channel of supply and demand is somewhat encouraging.

If an investor thinks this price action constructive enough to look for a long entry, we can step down a timeframe to the 4hour chart. Here you can see the same trendlines that we had on the daily chart and GoNoGo Trend painted a “Go” bar as price broke above resistance. GoNoGo Oscillator burst into positive territory out of a GoNoGo Squeeze a few bars earlier. Of course, we would be wary, as the larger time frame trends remain a “NoGo”, but with tight stops this could have been a sensible early entry should price move higher in the short term.

Dollar Dancing with the Dark Side
Last week we wondered if the dollar would find support at the gap as GoNoGo Oscillator was testing the zero line. It didn’t. GoNoGo Oscillator crashed through that level on heavy volume as price traded lower. Now, GoNoGo Trend is painting weaker aqua “Go” bars as price remains below the resistance of the gap and GoNoGo Oscillator is in negative territory but not oversold. We will look to see if price can rally from here or if there will be a change in trend in the price panel above.

On the 4hr chart below the “NoGo” is already in place. If looking to get bearish on the dollar then this presented a good opportunity as price moved through amber “Go Fish” bars before entering a “NoGo” as price traded through the gap. On this smaller time frame, the trend is a strong “NoGo” and GoNoGo Oscillator is in negative territory but not yet oversold. Given that the weight of the evidence on the daily and weekly charts still suggest the trend is a “Go”, a tight stop at the lower bound of the gap would be sensible. Alternatively, a trader could play this differently, and wait for the shorter term chart to offer up something bullish to take advantage of a possible buy the dip. Charts do not predict, they help us responsibly react.

Treasury Rates Resting
Rates have been rising all year but they took a pause last week. As we write this note pre market, we see that a return to the “Go” trend is perhaps imminent. There is certainly uncertainty as we saw a string of amber “Go Fish” bars after GoNoGo Oscillator broke below the zero line a few weeks ago. Now, the trend is in place but weak, painting an aqua “Go” bar and GoNoGo Oscillator is in negative territory but rising toward the zero line. We will watch this closely to see if this leads to trend continuation and an attack on prior highs.

This Company Seeing a $CHNG in Trend
We highlighted $CHNG a few weeks ago as it was testing the support from the bottom of a large gap. Change Healthcare seems to be benefitting from the relative outperformance we saw in the GoNoGo Sector Relmap earlier in this note. After the Oscillator climbed to test the zero level from below we saw a max GoNoGo Squeeze build and this has been broken to the upside. Thursday of last week saw a return to a “Go” trend and we saw strong follow through on Friday. We are up against a level that has been strong resistance in the recent past so we will watch to see if this surge in momentum will be enough to see new highs.

Bitcoin Rangebound
The worlds largest crypto currency is stuck in a rut. The chart below shows the weekly prices with the GoNoGo suite of tools applied. We can see the level from 2021 that has provide strong support over the last few weeks. For a time, it looked as though price was through that level but on a weekly basis we can see that it never closed below. To be clear, the trend is still a strong “NoGo” with the indicator painting purple bars, and GoNoGo Oscillator is in negative territory on heavy volume, but there is significant support that would need to be broken for price to drop lower.

On a daily chart, we can see the same range and how price again didn’t close once below the support level. This now should be an even stronger level of support should price react lower as it hits resistance from the upper bound of the channel. We see that GoNoGo Oscillator is now in positive territory on the daily chart and this suggests that momentum is slightly bullish. We will watch to see if price can climb above the resistance level and will watch for any change in the GoNoGo Trend.


