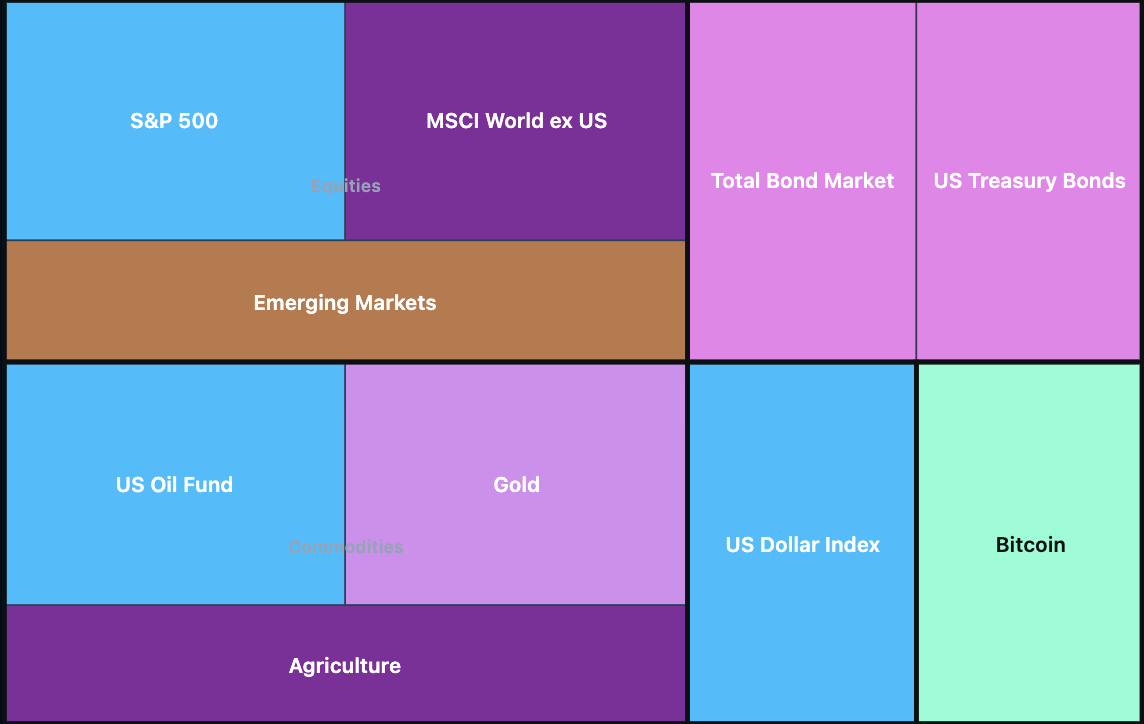
Good morning and welcome to this week’s Flight Path. The equity trend in the U.S. remained for another week and we see strength with bright blue “Go” bars. Within global equities, we see that World ex US is painting strong purple “NoGo” bars while emerging markets fall into amber “Go Fish” bars of uncertainty. Treasury bond prices remained in a “NoGo” and GoNoGo Trend paints pink bars. Commodities show disparity as oil remains in a “Go” trend while Gold paints “NoGo” bars. The dollar remains in a strong “Go” trend while bitcoin, the world’s largest cryptocurrency, paints weaker aqua bars.
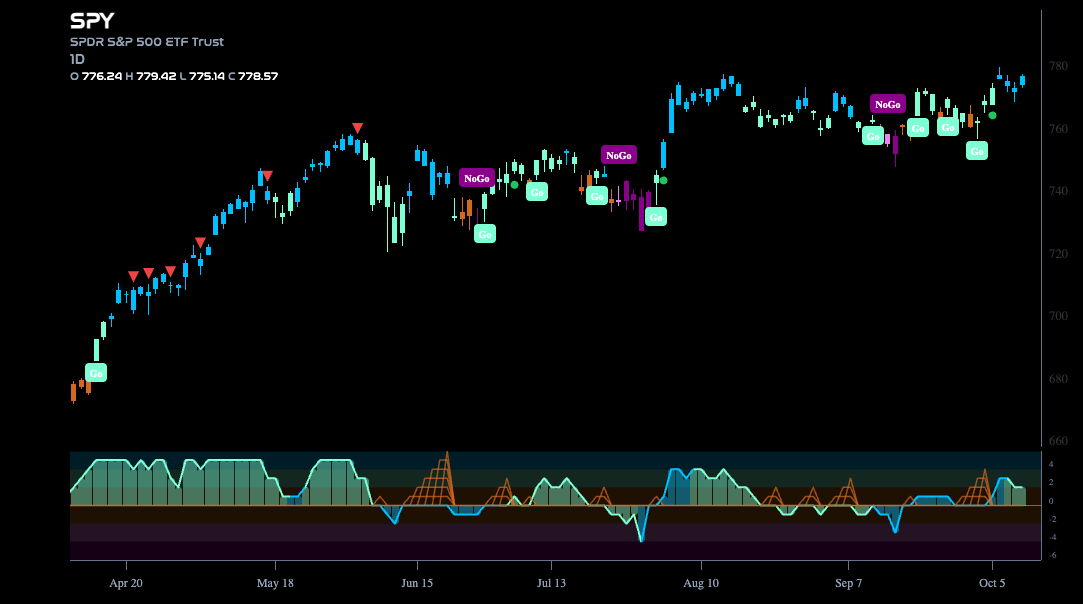
$SPY Sees Strength Return in “Go” trend
The GoNoGo chart below shows that the “Go” trend continues this week and we see strength return as GoNoGo Trend paints bright blue bars and price edges higher. GoNoGo Oscillator is in positive territory at a value of 2 and not yet overbought. We will watch to see if price has room to run this week and if it can consolidate at these new higher highs.
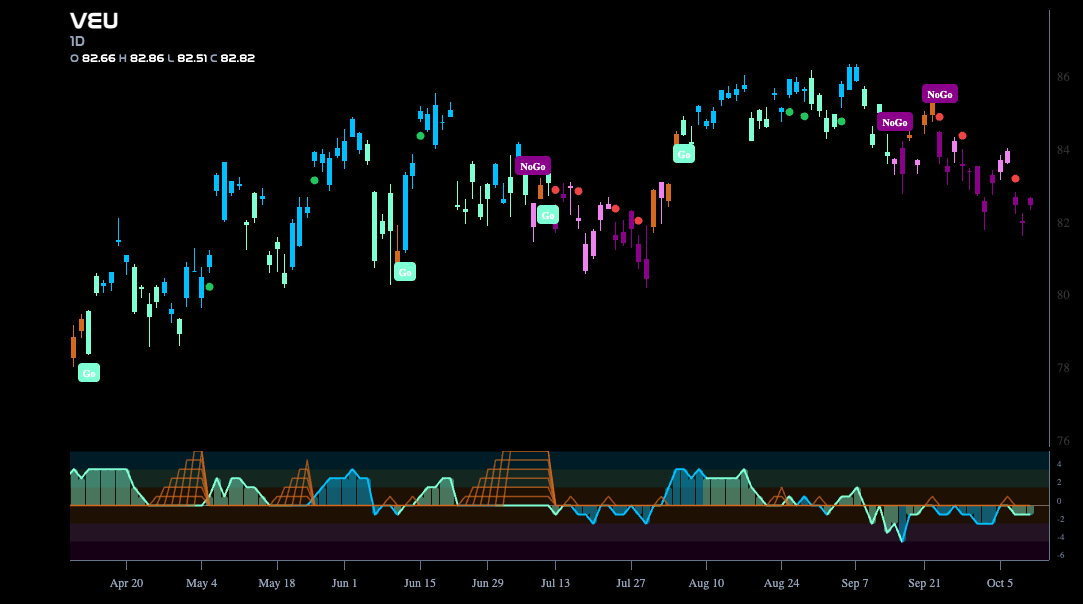
World ex US ($VEU) Remains in Strong “NoGo”
The GoNoGo chart below shows that the “NoGo” trend for world equities ex U.S. has remained in a “NoGo” having set another lower low this past week. GoNoGo Trend paints strong purple bars after we see signs of NoGo Trend Continuation (red circle) above price. This tells us that momentum is resurgent in the direction of the “NoGo” trend and we will watch to see if there is more downward pressure on price this week.
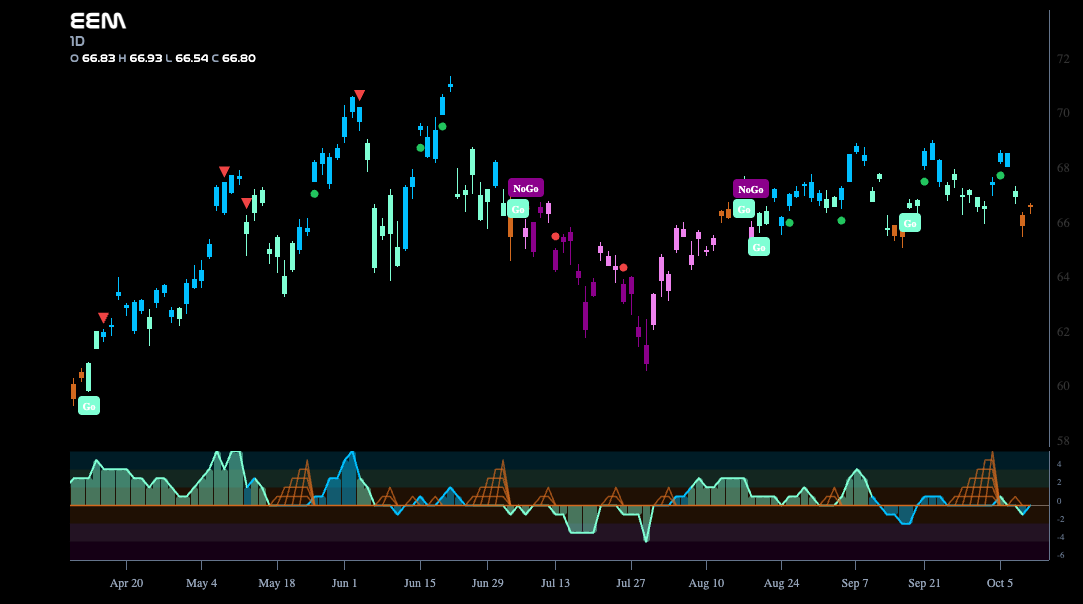
Emerging Markets ($EEM) Sees Trend Falter
GoNoGo Trend shows that the market is uncertain regarding the trend for emerging markets as price paints a couple of amber “Go Fish” bars following an inability to set new higher highs. GoNoGo Oscillator remains fluctuating around the zero line and is now testing it from below.
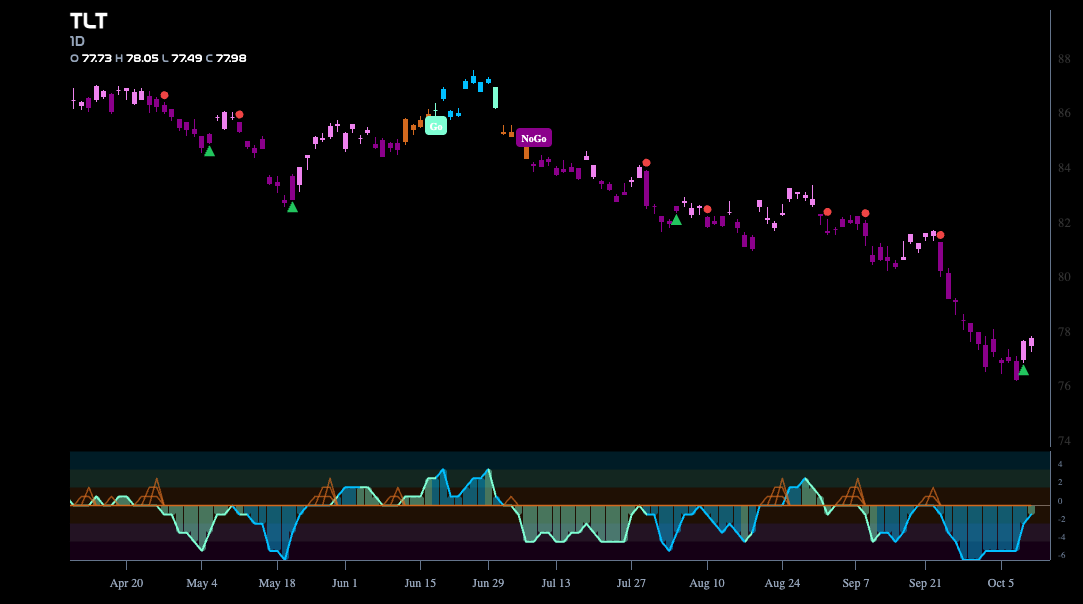
Treasury Bond Prices ($TLT) Show Weakness in “NoGo” Trend
GoNoGo Trend shows that the trend remains in place for treasury bond prices. After another lower low this past week we saw a NoGo Countertrend Correction Icon (green arrow) indicating that price may struggle to go lower due to waning momentum. Indeed, GoNoGo Trend now paints pink bars as price tries to rally off the low. GoNoGo Oscillator is now testing the zero line from below where we will watch to see if it finds resistance.
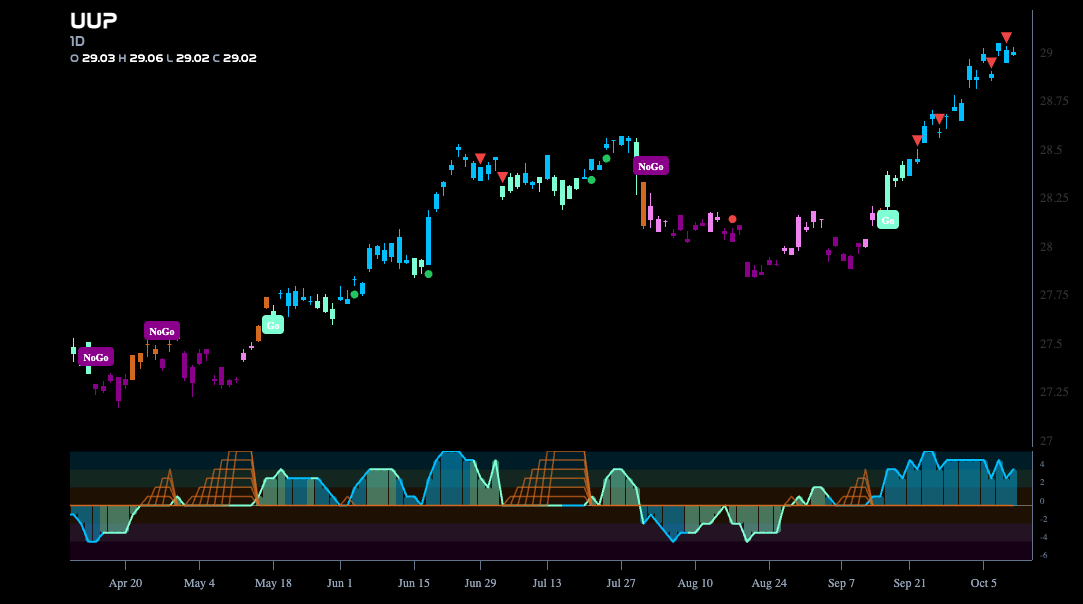
Dollar ($UUP) Continues Higher in “Go” Trend
The chart below shows that the “Go” trend shows no signs of slowing down as it hits new higher highs this week on another string of strong blue “Go” bars. We do see another Go Countertrend Correction Icon (red arrow) at the highs suggesting that momentum is waning and we will watch to see if price pulls back from the latest high.
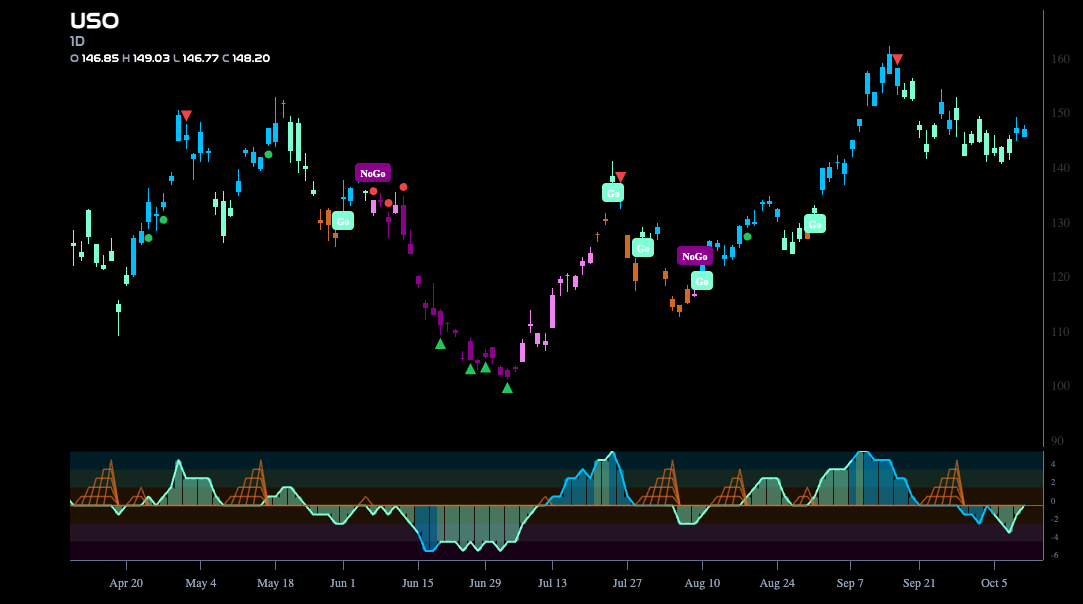
$USO Stays in Trend and Finds Support
GoNoGo Trend shows that the “Go” trend found its feet this week after price found support the indicator is once again painting strong blue “Go” bars. GoNoGo Oscillator has risen to challenge the zero line from below and we will watch to see if it can regain positive territory in the coming days.
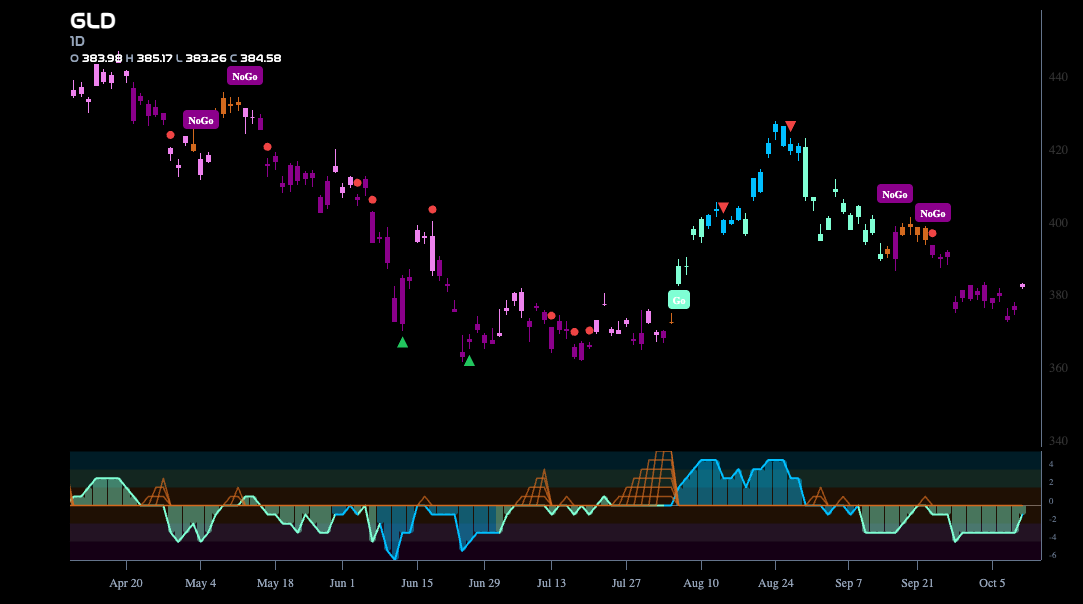
Gold ($GLD) “NoGo” Weakens Slightly
The “NoGo” trend remains in place for the precious metal but we see a first pink bar as price gaps higher at the end of the last week. GoNoGo Oscillator is rallying toward the zero line and we will watch to see if it finds resistance if it gets there. Should momentum remain at or below the zero line then we will expect the “NoGo” trend to continue for gold.
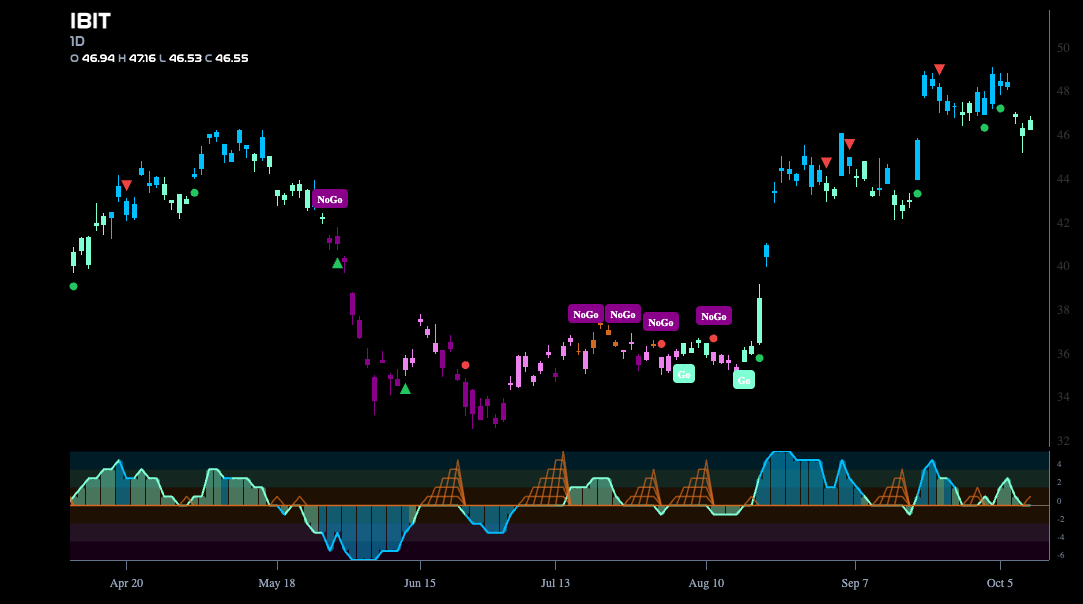
Bitcoin ($IBIT) Falls from High and Paints Weakness
The “Go” trend survived the week but shows weakness after price was unable to climb to a new higher high. With that, GoNoGo Trend paints weaker aqua bars and we see GoNoGo Oscillator testing the zero line from above. We will watch to see if it finds support here and if it does we can expect price to remain in a “Go” trend.
Sector Analysis
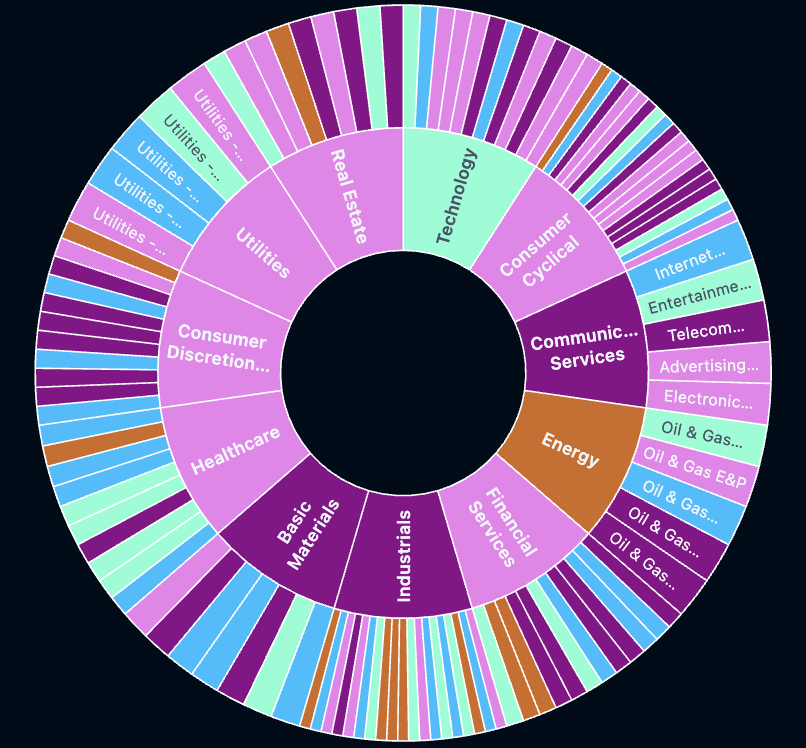
Below is the GoNoGo Sector Relative Sunburst Chart. This GoNoGo Sector Relative Sunburst Chart applies the GoNoGo Trend to the relative strength ratios of the sectors to the base index. With this view we can get a sense of the relative out performance and relative underperformance of the sectors. 1 sector is in a relative “Go” trend. $XLK is painting blue relative “Go” bars.
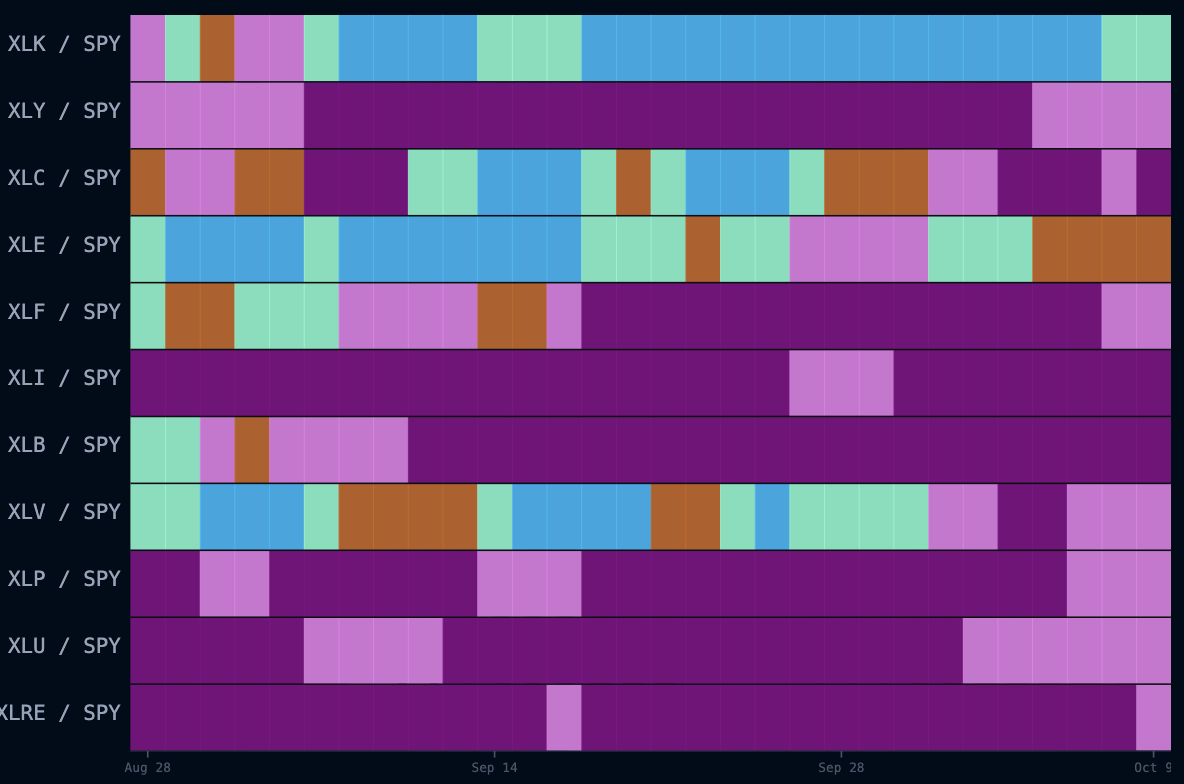
We can use a historical GoNoGo Relative HeatMap to ascertain that technology ($XLK, top panel) has been in a “Go” trend on a relative basis for several weeks although the trend has weakened.
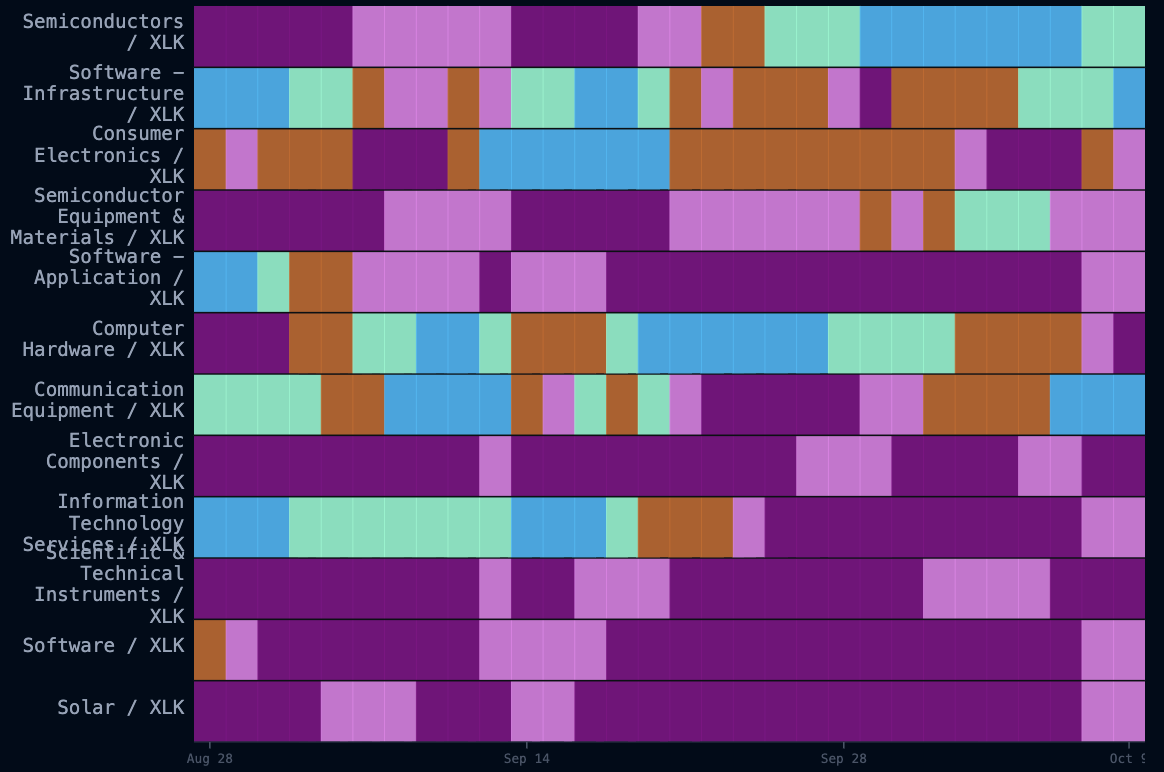
If we drill down into the technology sector, we see new relative strength in Software-Infastructure and Communication Equipment, with both industry groups painting bright blue relative “Go” bars.
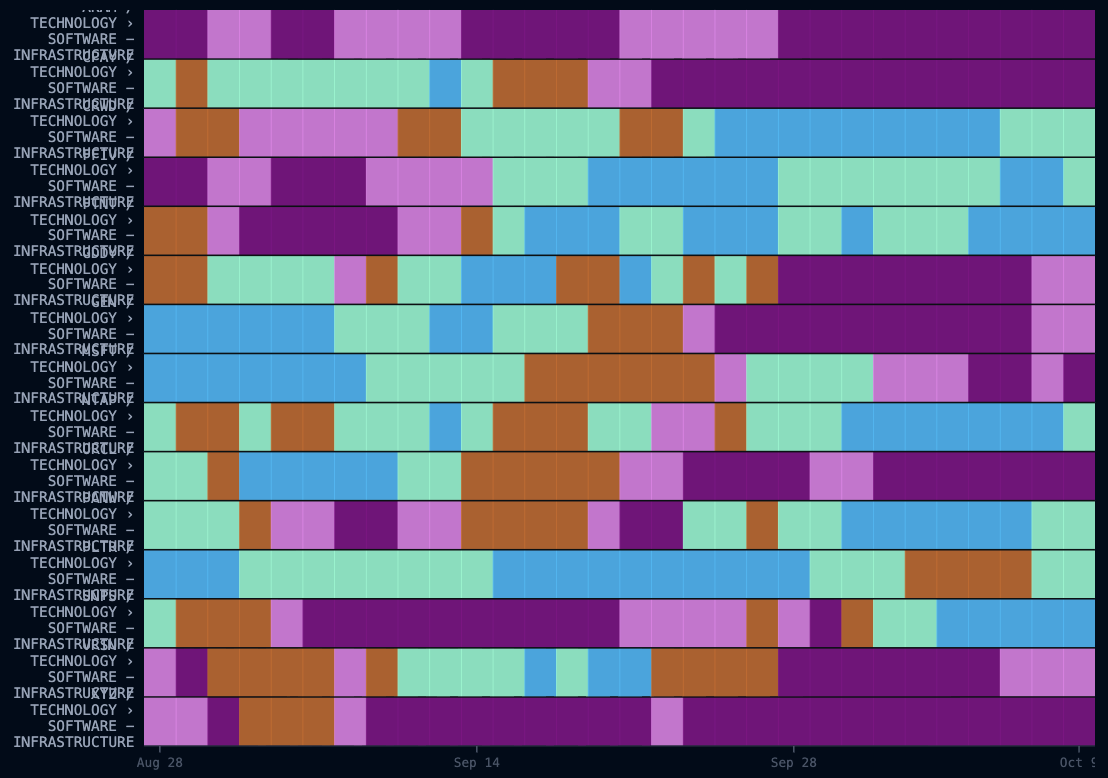
Clicking through into the software-infrastructure index, we can see the individual securities that are driving the out-performance. Here we see that $FTNT (5th panel), and $SNPS (3rd from bottom) are showing strong relative strength to the software space.
GoNoGo Market Breadth
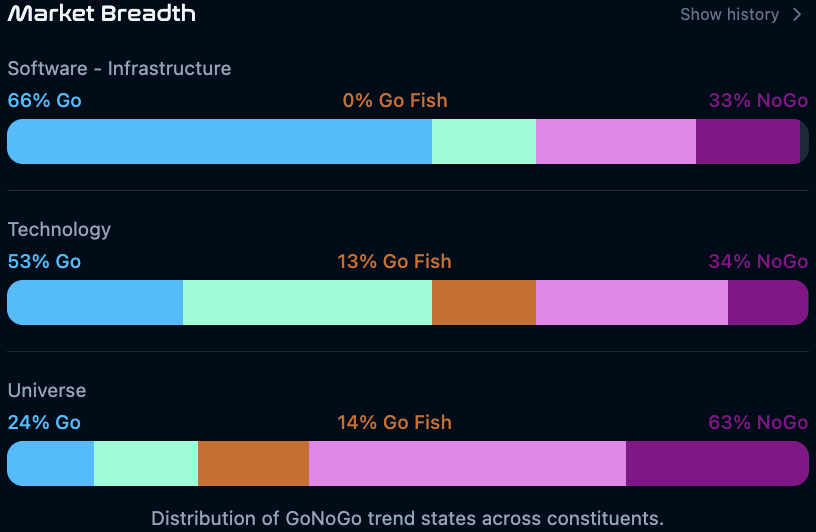
GoNoGo Breadth visualizations help paint the picture described above. In the lowest panel, we see the universe of the S&P 500 and the distribution of GoNoGo Trend states across its constituents. 24% of S&P 500 securities are in “Go” Trends. As we look at the middle panel, we see that 53% of technology securities are in “Go” trend. Within Software-infrastructure, a larger 66% of securities are in “Go” trends. Below we will look at GoNoGo Charts for some examples.
$FTNT Soars in “Go” Trend
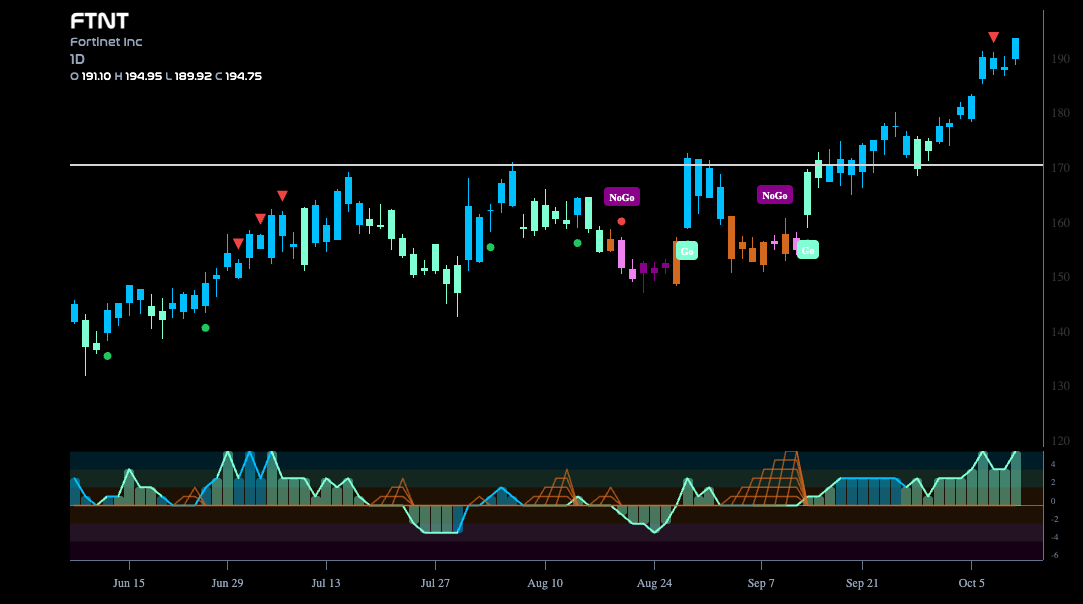
The GoNoGo Chart below shows that $FTNT is in a “Go” trend and last week painted a string of uninterrupted bright blue “Go” bars. We saw a Go Countertrend Correction Icon (red arrow) signaling that price may struggle to go higher in the short term due to waning momentum but this has so far been ignored. This reflects strong market support for rising prices.
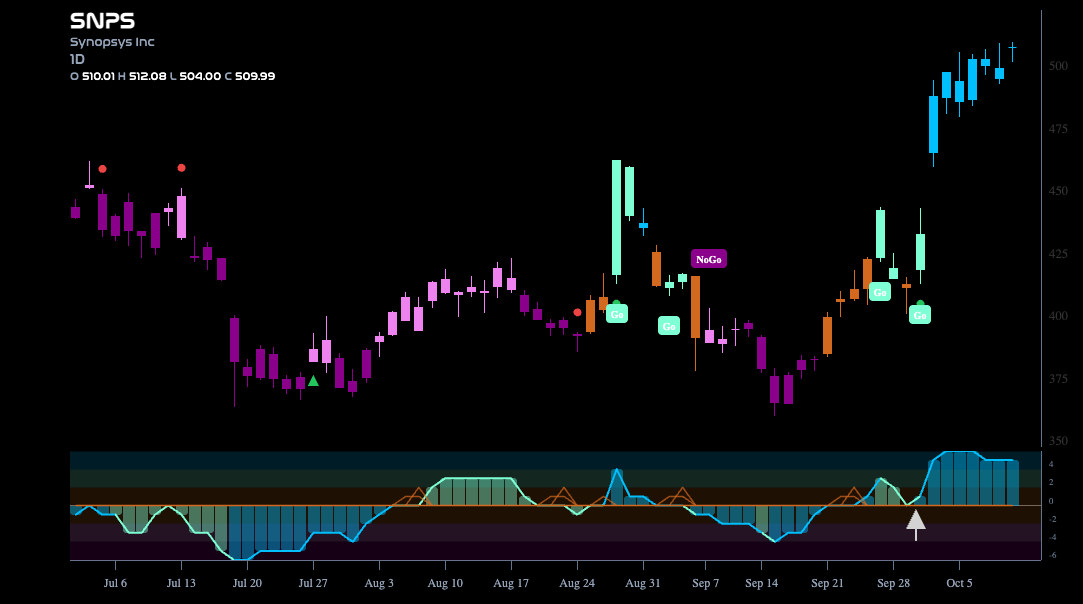
$SNPS Looks To Consolidate New Highs
The chart below shows $SNPS gapped higher just over a week ago and since then GoNoGo Trend has painted nothing but strong blue “Go” bars. This came after GoNoGo Oscillator bounced off the zero line into positive territory. Now, we see that GoNoGo Oscillator is remains elevated in oversold territory. We will watch to see if price takes a pause as momentum falls back to neutral. It will be important for the oscillator to remain at or above the zero line to provide support for the price trend.