
Good morning and welcome to this week’s Flight Path. Let’s take a look at the GoNoGo Asset map below. Equities have rolled over as we thought they might. The GoNoGo Trend is painting strong purple bars as the “NoGo” resumes in force. Treasury bond prices have also painted strong purple “NoGo” bars this week as has bitcoin which broke to new lows. The United States Commodity Index and the dollar remain in “Go” trends.

Sector Performance
Below is the GoNoGo Sector Relmap. This GoNoGo Relmap applies the GoNoGo Trend to the relative strength ratios of the sectors to the base index. Looking at this map, we can quickly see where the relative outperformance is coming from as well as which sectors are lagging on a relative basis. Not much to report here. the culprits dragging the index down remain the growth sectors, technology, discretionary and communications. The relative “Go” trends remain in energy, industrials, materials, healthcare and utilities. Of note, financials which had attempted to enter a “Go” over the last few weeks has fallen back into a relative “NoGo” to the index as a whole.

Treasury Rates Rising Again
Below is the daily chart of $TNX. We have looked at this chart over the past few weeks to try to understand whether the trend would continue or if the pull back from the highs was more significant. As GoNoGo Oscillator broke below the zero line we paid attention to the GoNoGo Trend as it entered amber “Go Fish” bars. Importantly, “NoGo” bars were never painted and we returned to the aqua weak form “Go” trend quickly. This was quickly confirmed by GoNoGo Oscillator breaking back into positive territory and since then we have seen a string of strong blue “Go” bars as price challenges prior highs.

Zooming out to the incredible long term chart of $TNX that has showed the decades long down trend we have been in, we see that this price action on the short term continues to represent a break of the trend line and a “Go” bar. If the quarter were to end today, we would be in a “Go” trend above resistance. Continued rising rates could have a significant impact on the markets. We will of course continue to watch this chart.

The Dollar Turned it Around
As with rates, we saw the dollar cool off over the last several weeks. In much the same way though, we saw GoNoGo Oscillator fall into negative territory and GoNoGo Trend paint a string of amber “Go Fish” bars of uncertainty. Also, “NoGo” bars never arrived, and the greenback was able to find once again a “Go” trend as the oscillator pushed its way back into positive territory. More headwinds for stocks it seems.

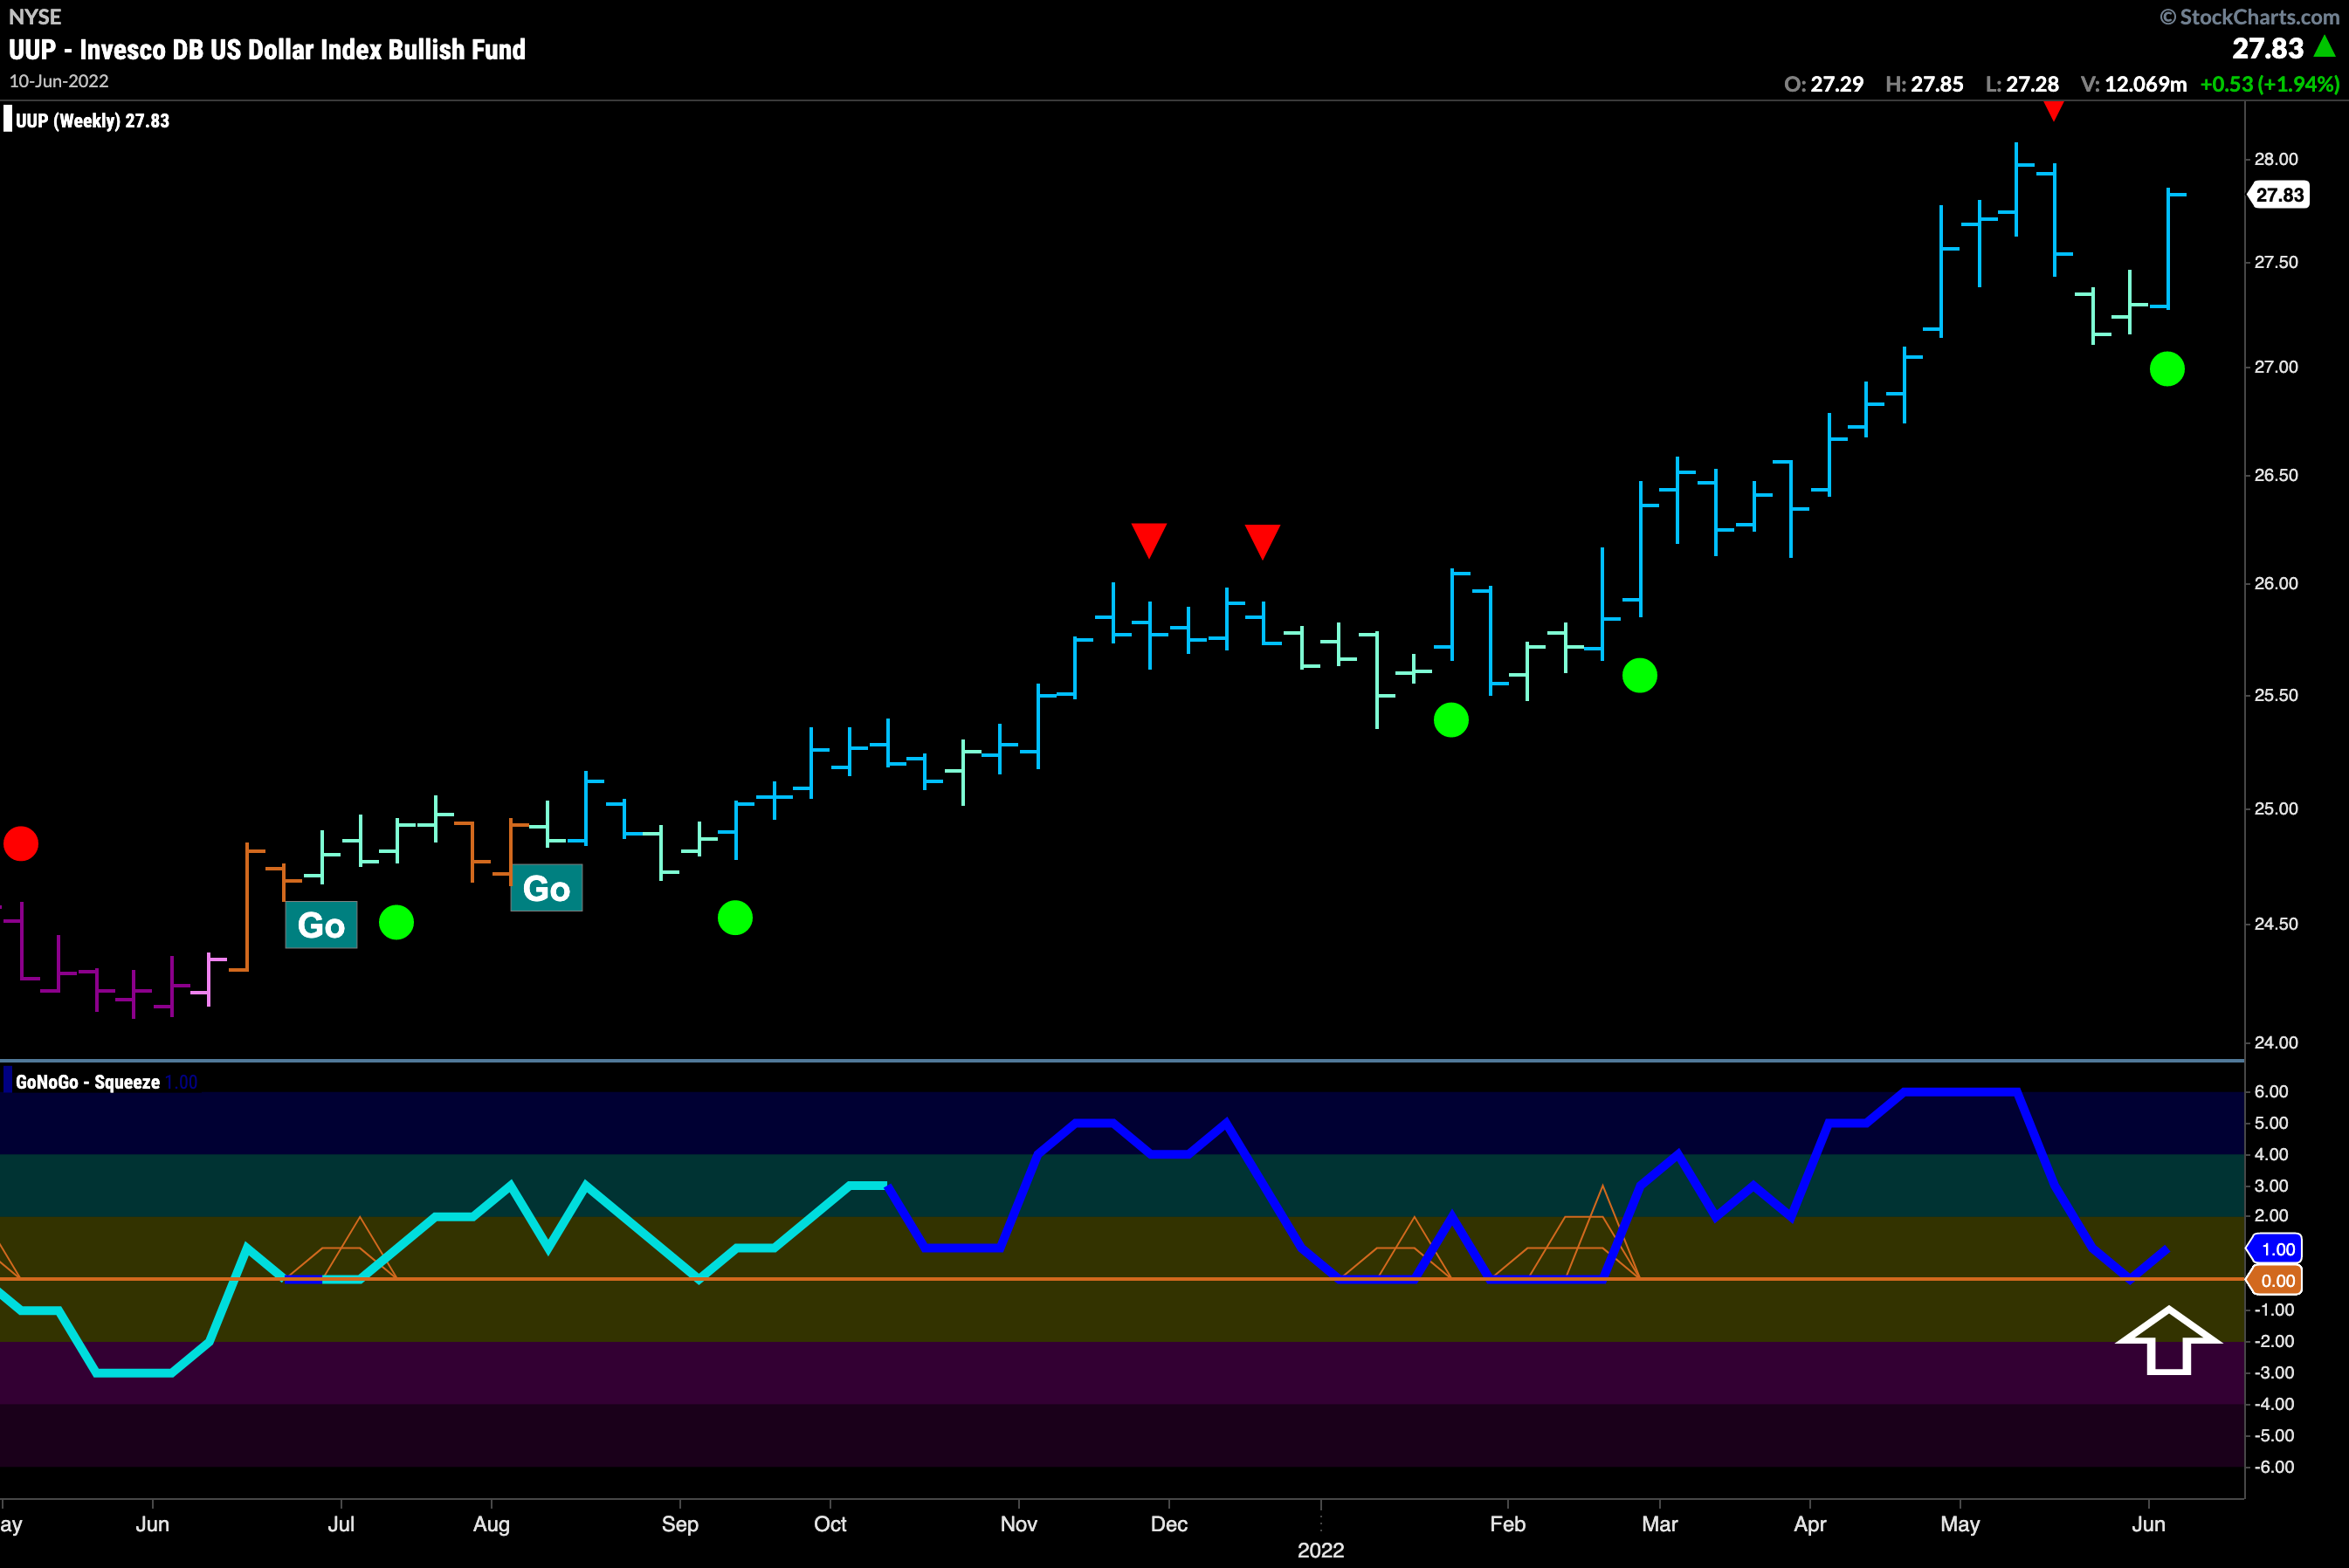
Looking at $UUP on a weekly chart we can see that we were at an important inflection point with GoNoGo Trend painting a couple of weaker aqua “Go” bars and GoNoGo Oscillator crashing to zero after the Go Countertrend Correction red arrow suggested short term struggles. $UUP has met the challenge however, as GoNoGo Oscillator finds support at zero, triggering a Go Trend Continuation icon (green circle) as GoNoGo Trend paints a strong blue “Go” bar.

S&P 500 Sustains Struggles
Where does this leave equities? … Floundering. Equities fell hard at the end of last week. Price action showed the trend was a strong “NoGo” with purple bars most of the week. Confirming the move in price, GoNoGo Oscillator fell to and through the zero line indicating that momentum was once again in the direction of the “NoGo”. This triggered a NoGo Trend Continuation Icon (red circle) above Friday’s price bar as we can expect price to move lower still and challenge the lows from a few weeks ago.

$USO Sets New High
Trends remain in place until they aren’t and that is certainly the case with oil. After months long consolidation that saw GoNoGo Trend paint two amber “Go Fish” bars but never a “NoGo”, we saw price break above resistance and has taken out the March high. While we see Go CounterTrend correction red arrows telling us that there may be a pause in the short term, we would be looking for opportunities in this space as the rest of the market shows weakness.

Energy Excells
Within the sectors of the S&P 500, energy stands out. We saw when we took a look at the GoNoGo Sector Relmap earlier that it was outperforming with strong relative “Go” bars. Below is the GoNoGo Chart of $XLE and we can see that the trend has been strong since the beginning of the year, with a series of higher highs and lows clear. With GoNoGo Trend painting “Go” bars predominantly (a couple of amber “Go Fish” bars during consolidation) and GoNoGo Oscillator finding support at the zero line, we still see a healthy “Go” trend. As price comes off the recent high, we could be looking within the sector for buying opportunities.

It’s Still a Marathon Not a Sprint!
Buy the dip? $MRO has been a GoNoGo Charts favorite all year, and we are looking at this chart as we have all year. Ready to buy. The “Go” trend is in place, but price has fallen with the market over the last few days and caused GoNoGo Oscillator to fall to the zero line. We will watch now to see if that level serves as support. If it can bounce off zero and get back into positive territory then we would see a Go Trend Continuation Icon (green circle) under price, offering a relatively low risk opportunity to buy back into the trend.

Bye Bye Bitcoin?
This chart doesn’t look good. We have seen the world’s largest crypto currency trading in a range for several weeks now and then the last few bars have seen that range obliterated. With the digital asset trading below 24,000 at the time of writing, we are seeing a new low being set. It is entirely possible we will see significant price deterioration in the coming weeks. A weekly chart suggests a break down from a double top that has serious implications!


