
Good morning and welcome to this week’s Flight Path. Let’s take a look at the GoNoGo Asset map below. The picture looks bleak for equities as well as bonds and the world’s largest digital asset. Strong purple bars show the “NoGo” trends are very strong for S&P 500, treasury bonds and bitcoin. Looking for the “Go” trends, we see them in commodities still, and the dollar. Have the markets made up their mind? It would seem that the rebound many hoped for mid week last week will not pan out.

Sector Performance
Below is the GoNoGo Sector Relmap. This GoNoGo Relmap applies the GoNoGo Trend to the relative strength ratios of the sectors to the base index. Looking at this map, we can quickly see where the relative outperformance is coming from as well as which sectors are lagging on a relative basis. As we have seen for a few weeks, the overall message here is defensive and getting more so. Technology, communications and discretionary sectors are in “NoGo” trends. The value sectors continue to outperform on a relative basis. Energy, materials, healthcare, staples, utilities, and real estate and industrials show relative outperformance this week.

U.S. Domestic Stocks Going Down
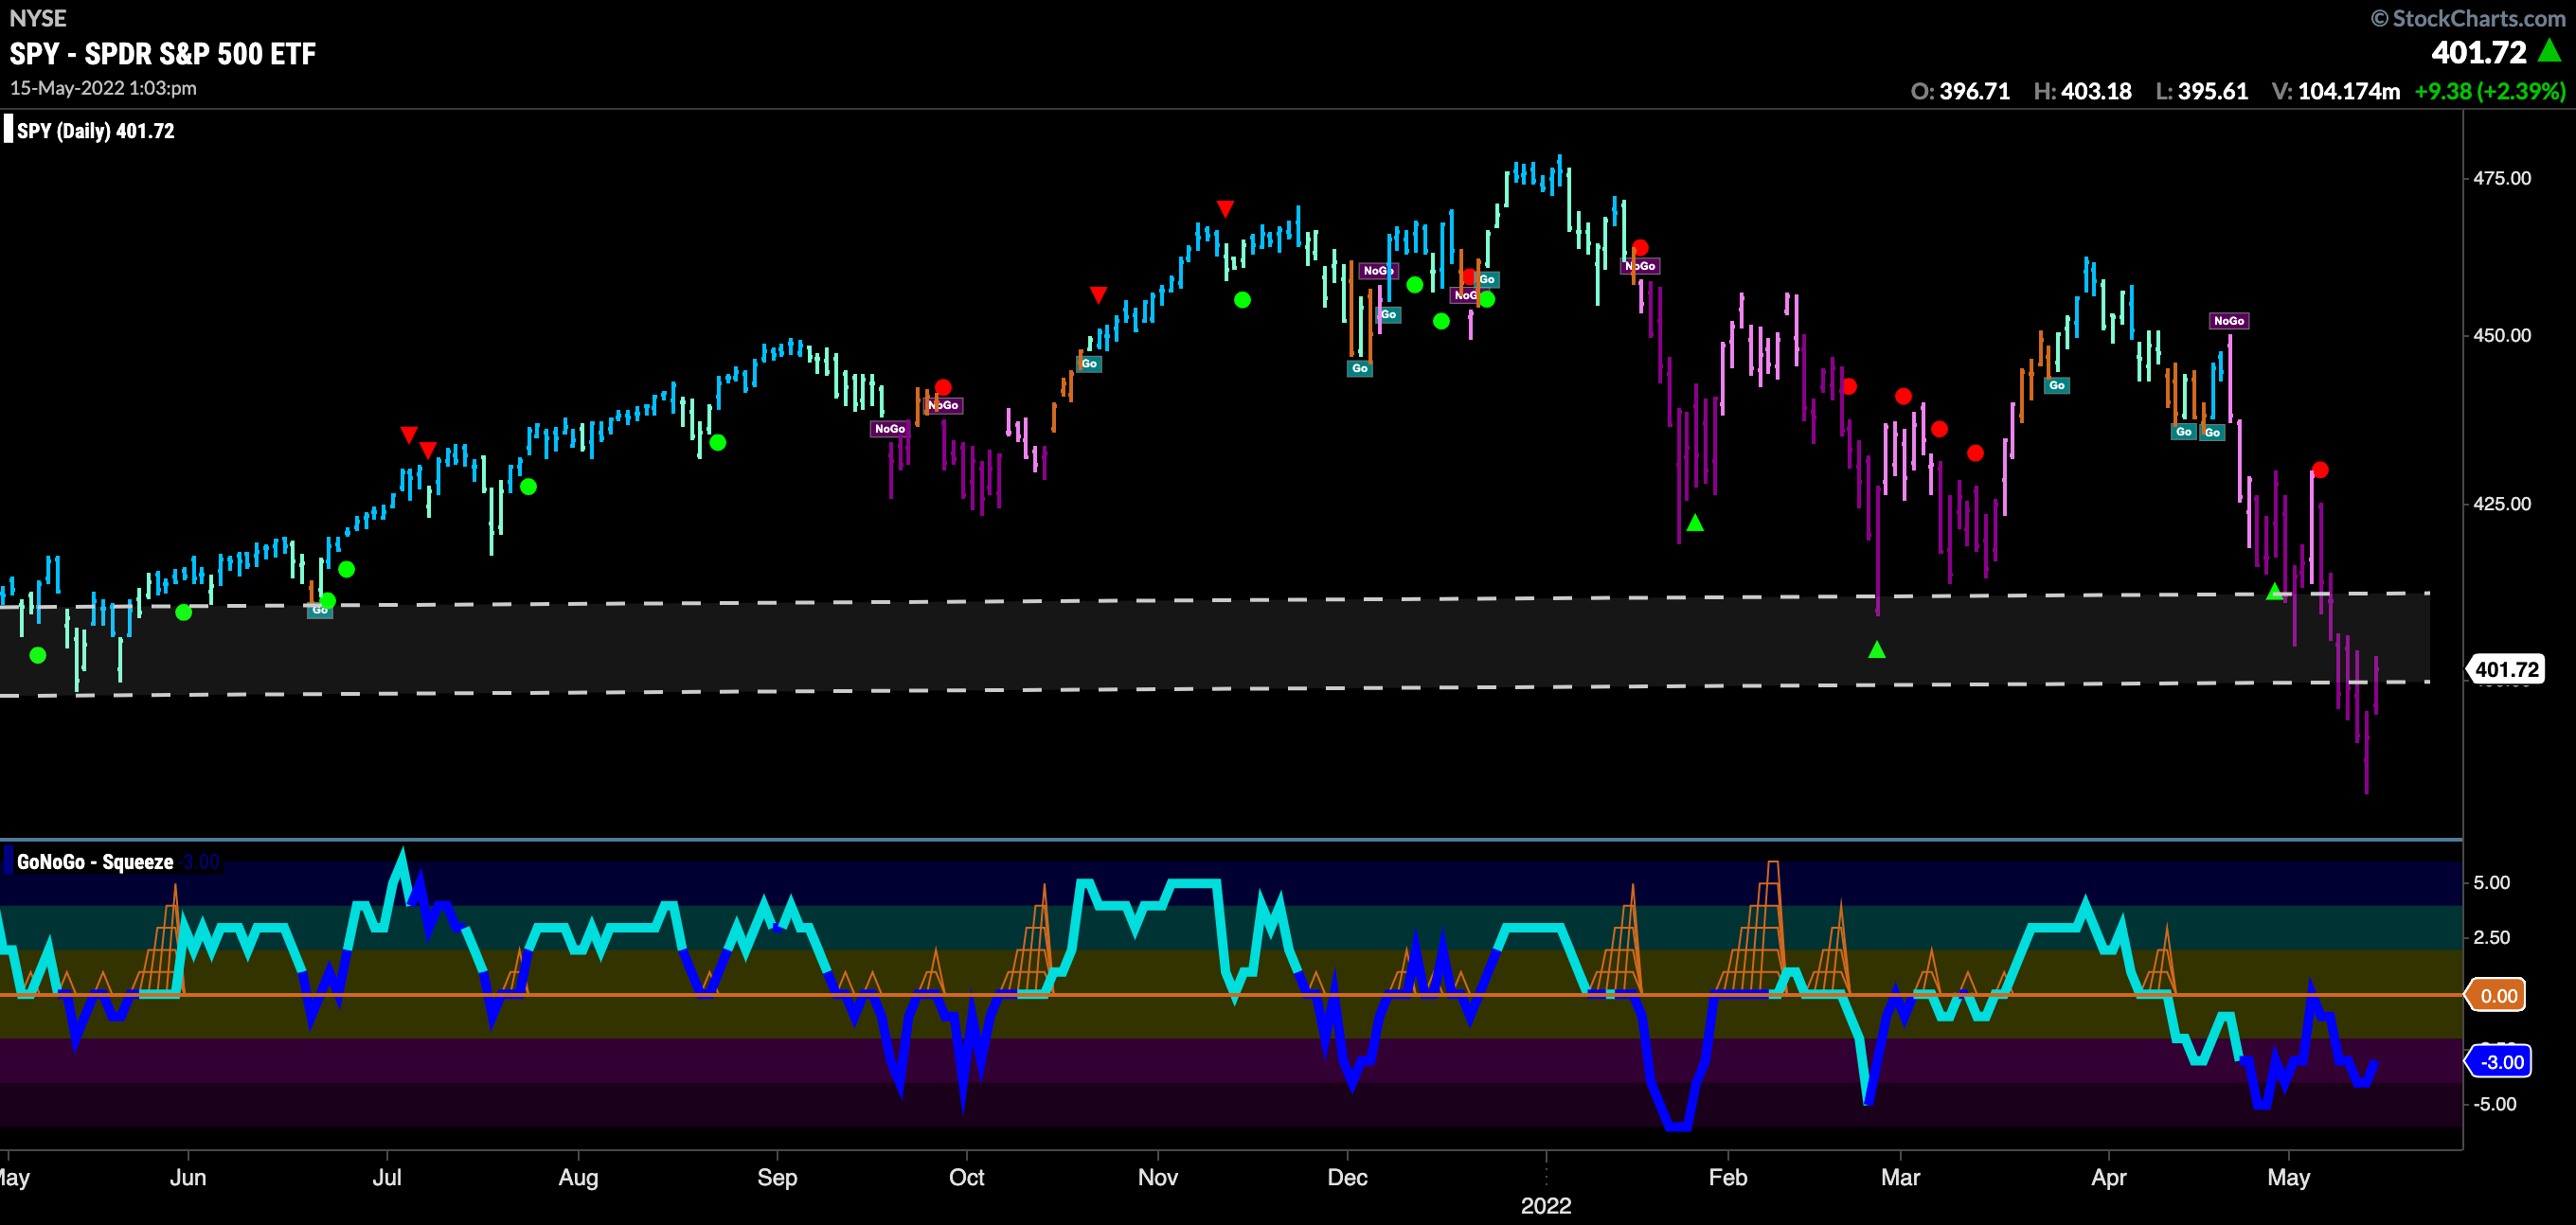
Below is the daily chart of $SPY prices with GoNoGo suite of tools applied. The channel we have on the chart is one that we have been paying close attention to over the past few weeks. The week ended with price testing the lower bound. GoNoGo Oscillator got rejected again by the zero line at the end of the week on heavy volume. This suggests that momentum is back in the direction of the “NoGo” trend. It would be no surprise to see price trade lower this week.

Below is the weekly GoNoGo Chart of $SPY. You can see just how significant the channel support is here. The “NoGo” trend is well and truly in place with strong purple “NoGo” bars and GoNoGo Oscillator has again been rejected by the zero line as volume increases. We are in negative territory on the oscillator but not yet oversold. A break below this level could see a lack of demand push prices significantly lower.

Bonds Also Going Down
Below is the daily GoNoGo Chart of $TLT. What a “NoGo” trend this has been! Prices last week cratered to new lows on strong purple “NoGo” bars and GoNoGo Oscillator fell to extreme oversold levels on heavy volume. The chart demonstrates well the way that GoNoGo Oscillator will stay below zero and find resistance at that level when in a healthy “NoGo” trend.

Bitcoin Also Plunging
The world’s largest digital asset is not safe from falling prices either. This week has seen a sharp drop in prices as we see levels that provided support earlier in the year. Many analysts see this as significant and we will watch to see if the level is broken to the downside. As it stands, price bars paint strong purple “NoGo” bars and GoNoGo Oscillator is oversold on heavy volume.

Below is the weekly chart of Bitcoin prices. We can see that below the current price level of 33,000 there is another level of very significant support sitting at just under 29,000. Should daily prices fall through current levels that would be an obvious next target. Below that… there seems to be nothing. Bitcoin holders will want to see a strong rally at that level. The weekly GoNoGo Chart picture is not good though, as wee see a NoGo Trend Continuation Icon (red circle) above recent price bar indicating that momentum is back in the direction of the “NoGo” after the oscillator broke out of a GoNoGo Squeeze to the downside.

Where Can Investors Turn? … Commodities
Investors confused by the concurrent downtrends in equities and bonds would be advised to remember the trend of the year so far in the commodity markets. Below is the weekly GoNoGo Chart of $USCI, the United States Commodity Fund. This is a strong “Go” trend that has been in place through all of 2021 and into 2022. We now see strong blue “Go” bars and the GoNoGo Oscillator in positive territory but not yet overbought as we test a recent high.

On a daily chart we can see that it has taken a few months for price to climb back near the highs from early March. Importantly, throughout that time GoNoGo Oscillator has found support at the zero line and recently we have seen a cluster of Go Trend Continuation Icons (green circles) underneath the price bars as the zero line continues to act as support. Perhaps this will give price the momentum it needs to test that March high.

Chevron Poised to set new high?
We have highlighted several oil stocks this year in our GoNoGo Research. Another that has caught our attention this week is $CVX. This chart is interesting because we are seeing a fresh “Go” trend after prices corrected a little. GoNoGo Oscillator was broken to the downside as the GoNoGo Trend struggled to maintain “Go” bars. Now, GoNoGo Oscillator has rallied back to the zero line where it remains, allowing the grid of the GoNoGo Squeeze to climb. We will look for a break out of the Squeeze into positive territory which would suggest momentum returning in the direction of the “Go” trend and we would target a new high.

Its Not All About Oil! $CORN Continues to Grow
While the oil trade has been the talk of the year, commodities in general have flourished. Below is the GoNoGo Chart of $CORN, the Teucrium Corn Fund using daily prices. What a trend this has been. As prices have remained in a “Go” trend all year, GoNoGo Oscillator has found support time and again at the zero line as it should when the trend is healthy. Now, after a Go CounterTrend Correction red arrow toward the end of April suggested a short term correction/consolidation, we see GoNoGo Oscillator at, and riding, the zero line. We will look for support here. If GoNoGo Oscillator can bounce back into positive territory we will expect a leg higher in price and an attack on prior highs.


