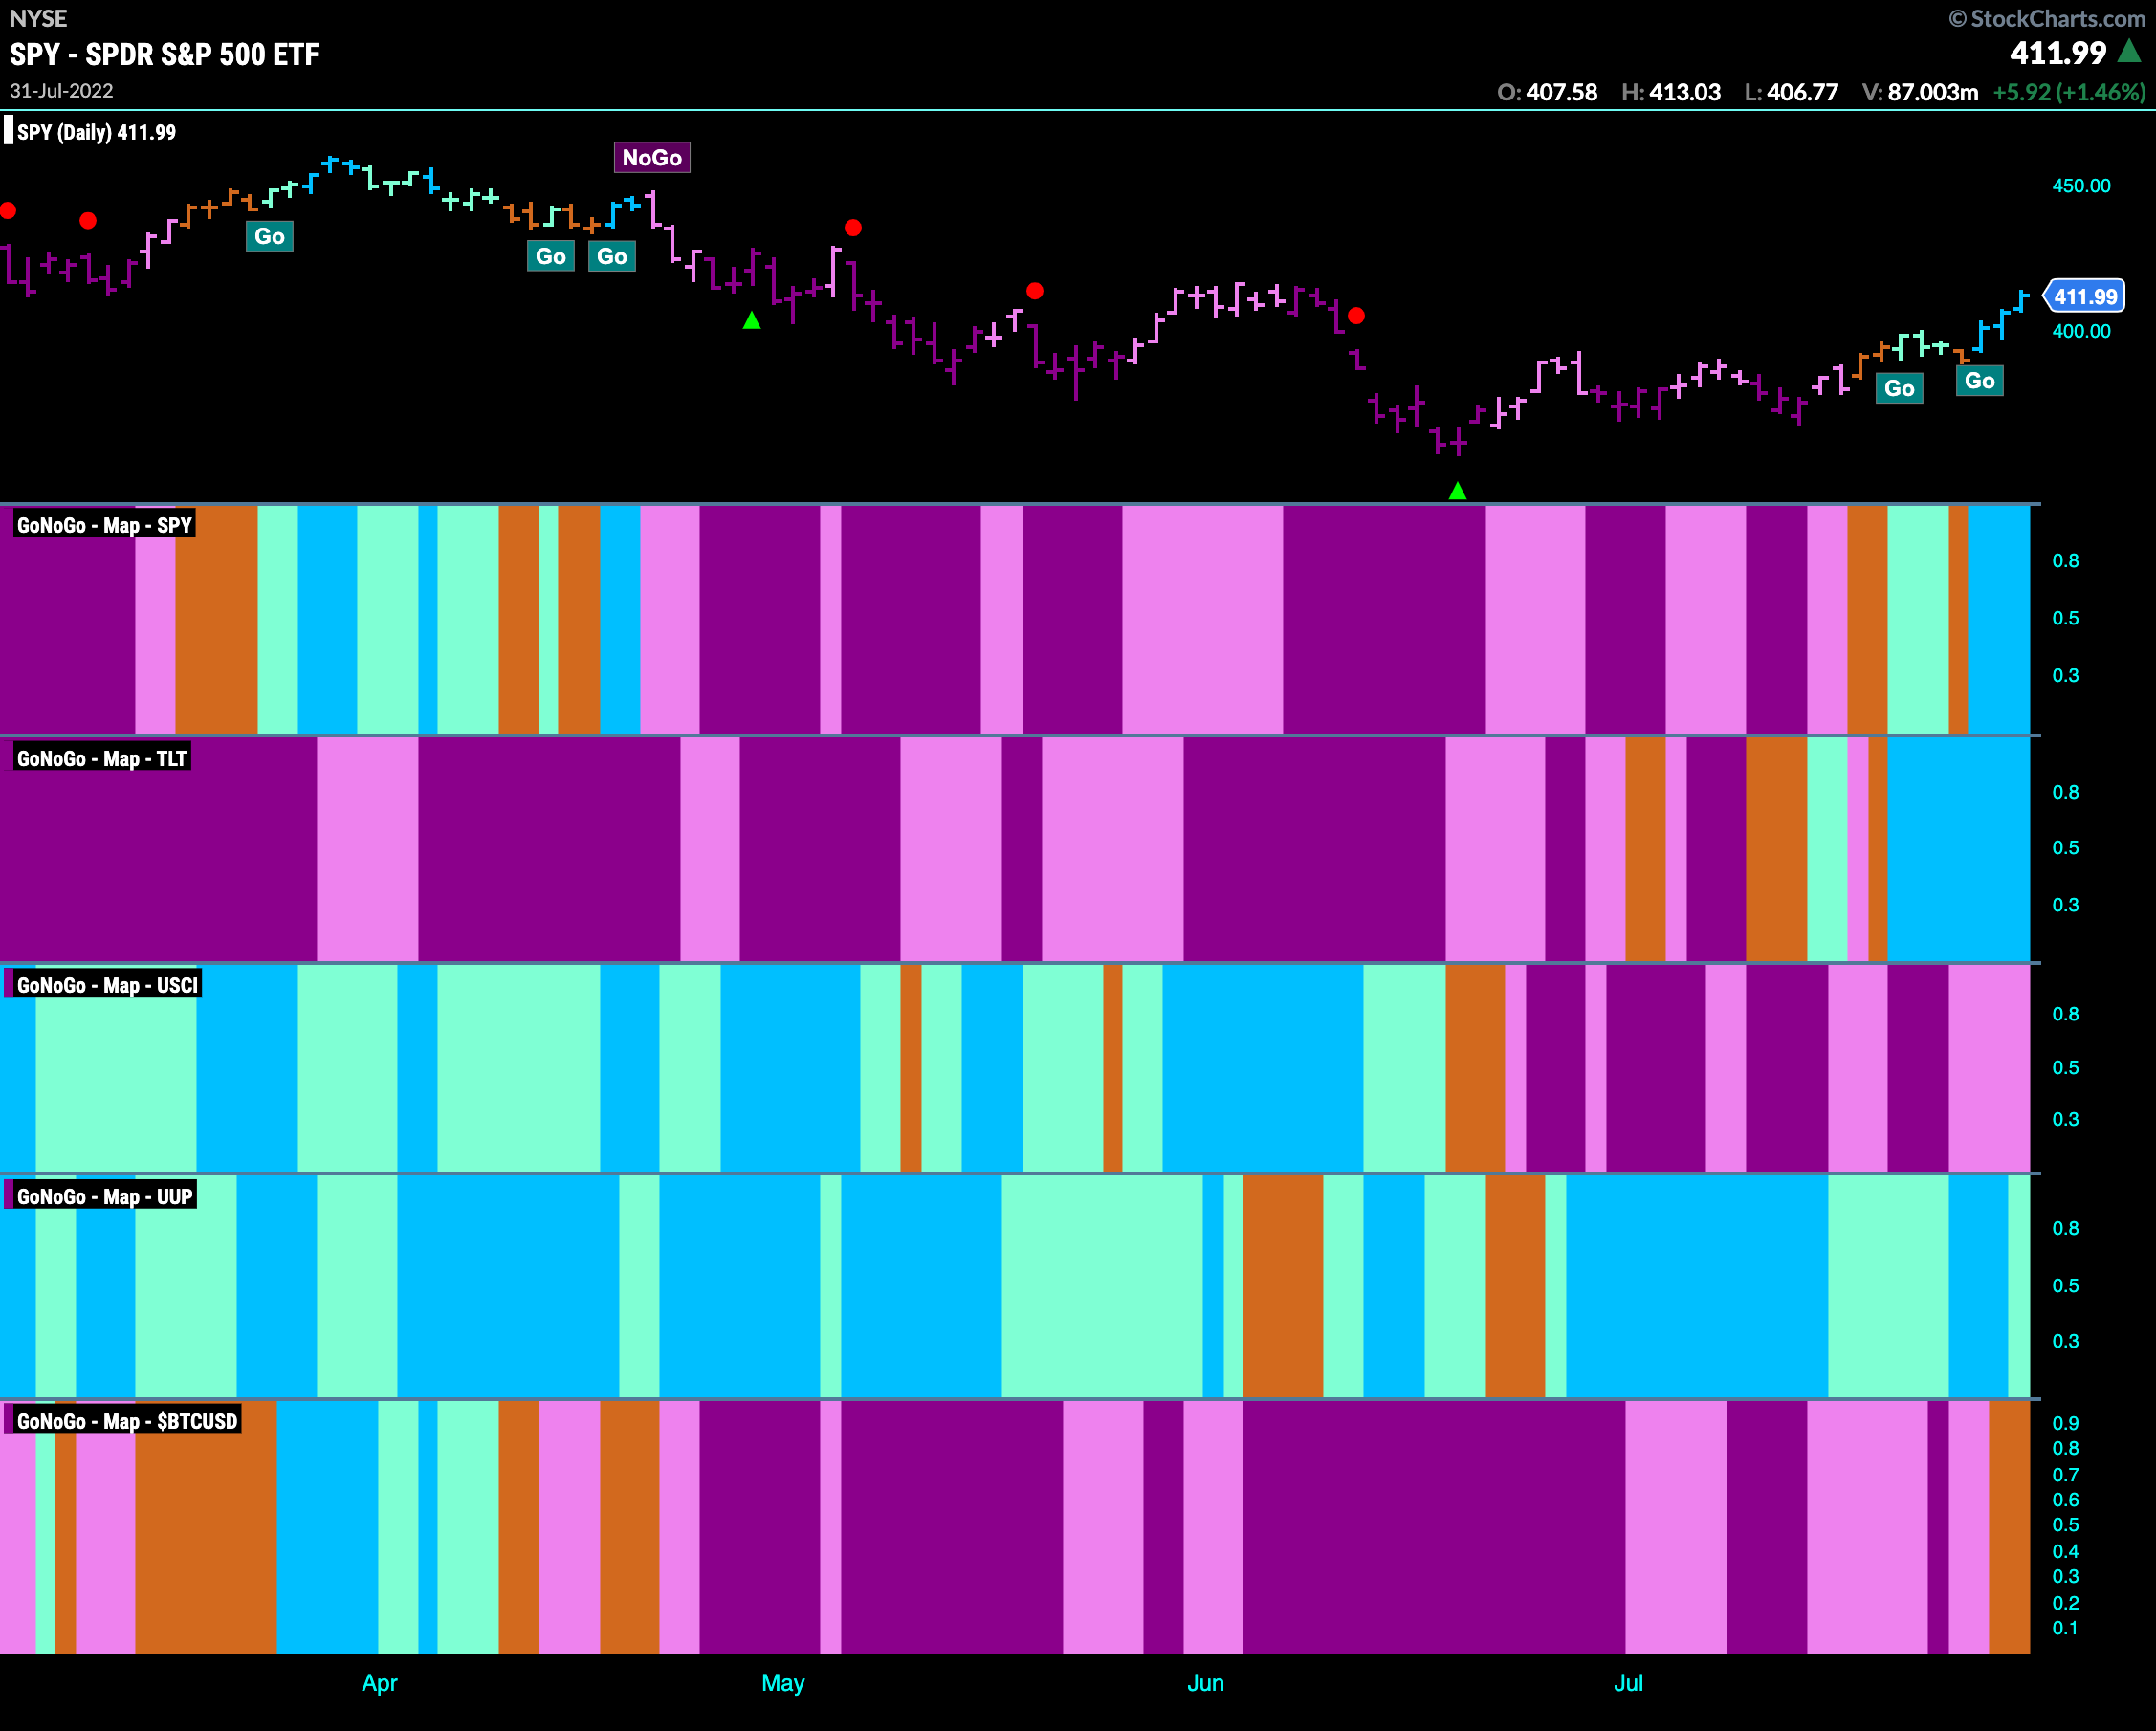
Good morning and welcome to this week’s Flight Path. Let’s take a look at the GoNoGo Asset map below. Equities have been able to continue and even strengthen the “Go” trend that we saw last week. After an amber “Go Fish” bar we saw a string of bright blue bars to end the week. Treasury bond prices also show strength as the trend conditions combine to paint strong blue “Go” bars. Commodities see the “NoGo” persist albeit on weaker pink bars and the dollar is hanging on to a weak “Go” trend.
Sector RelMap
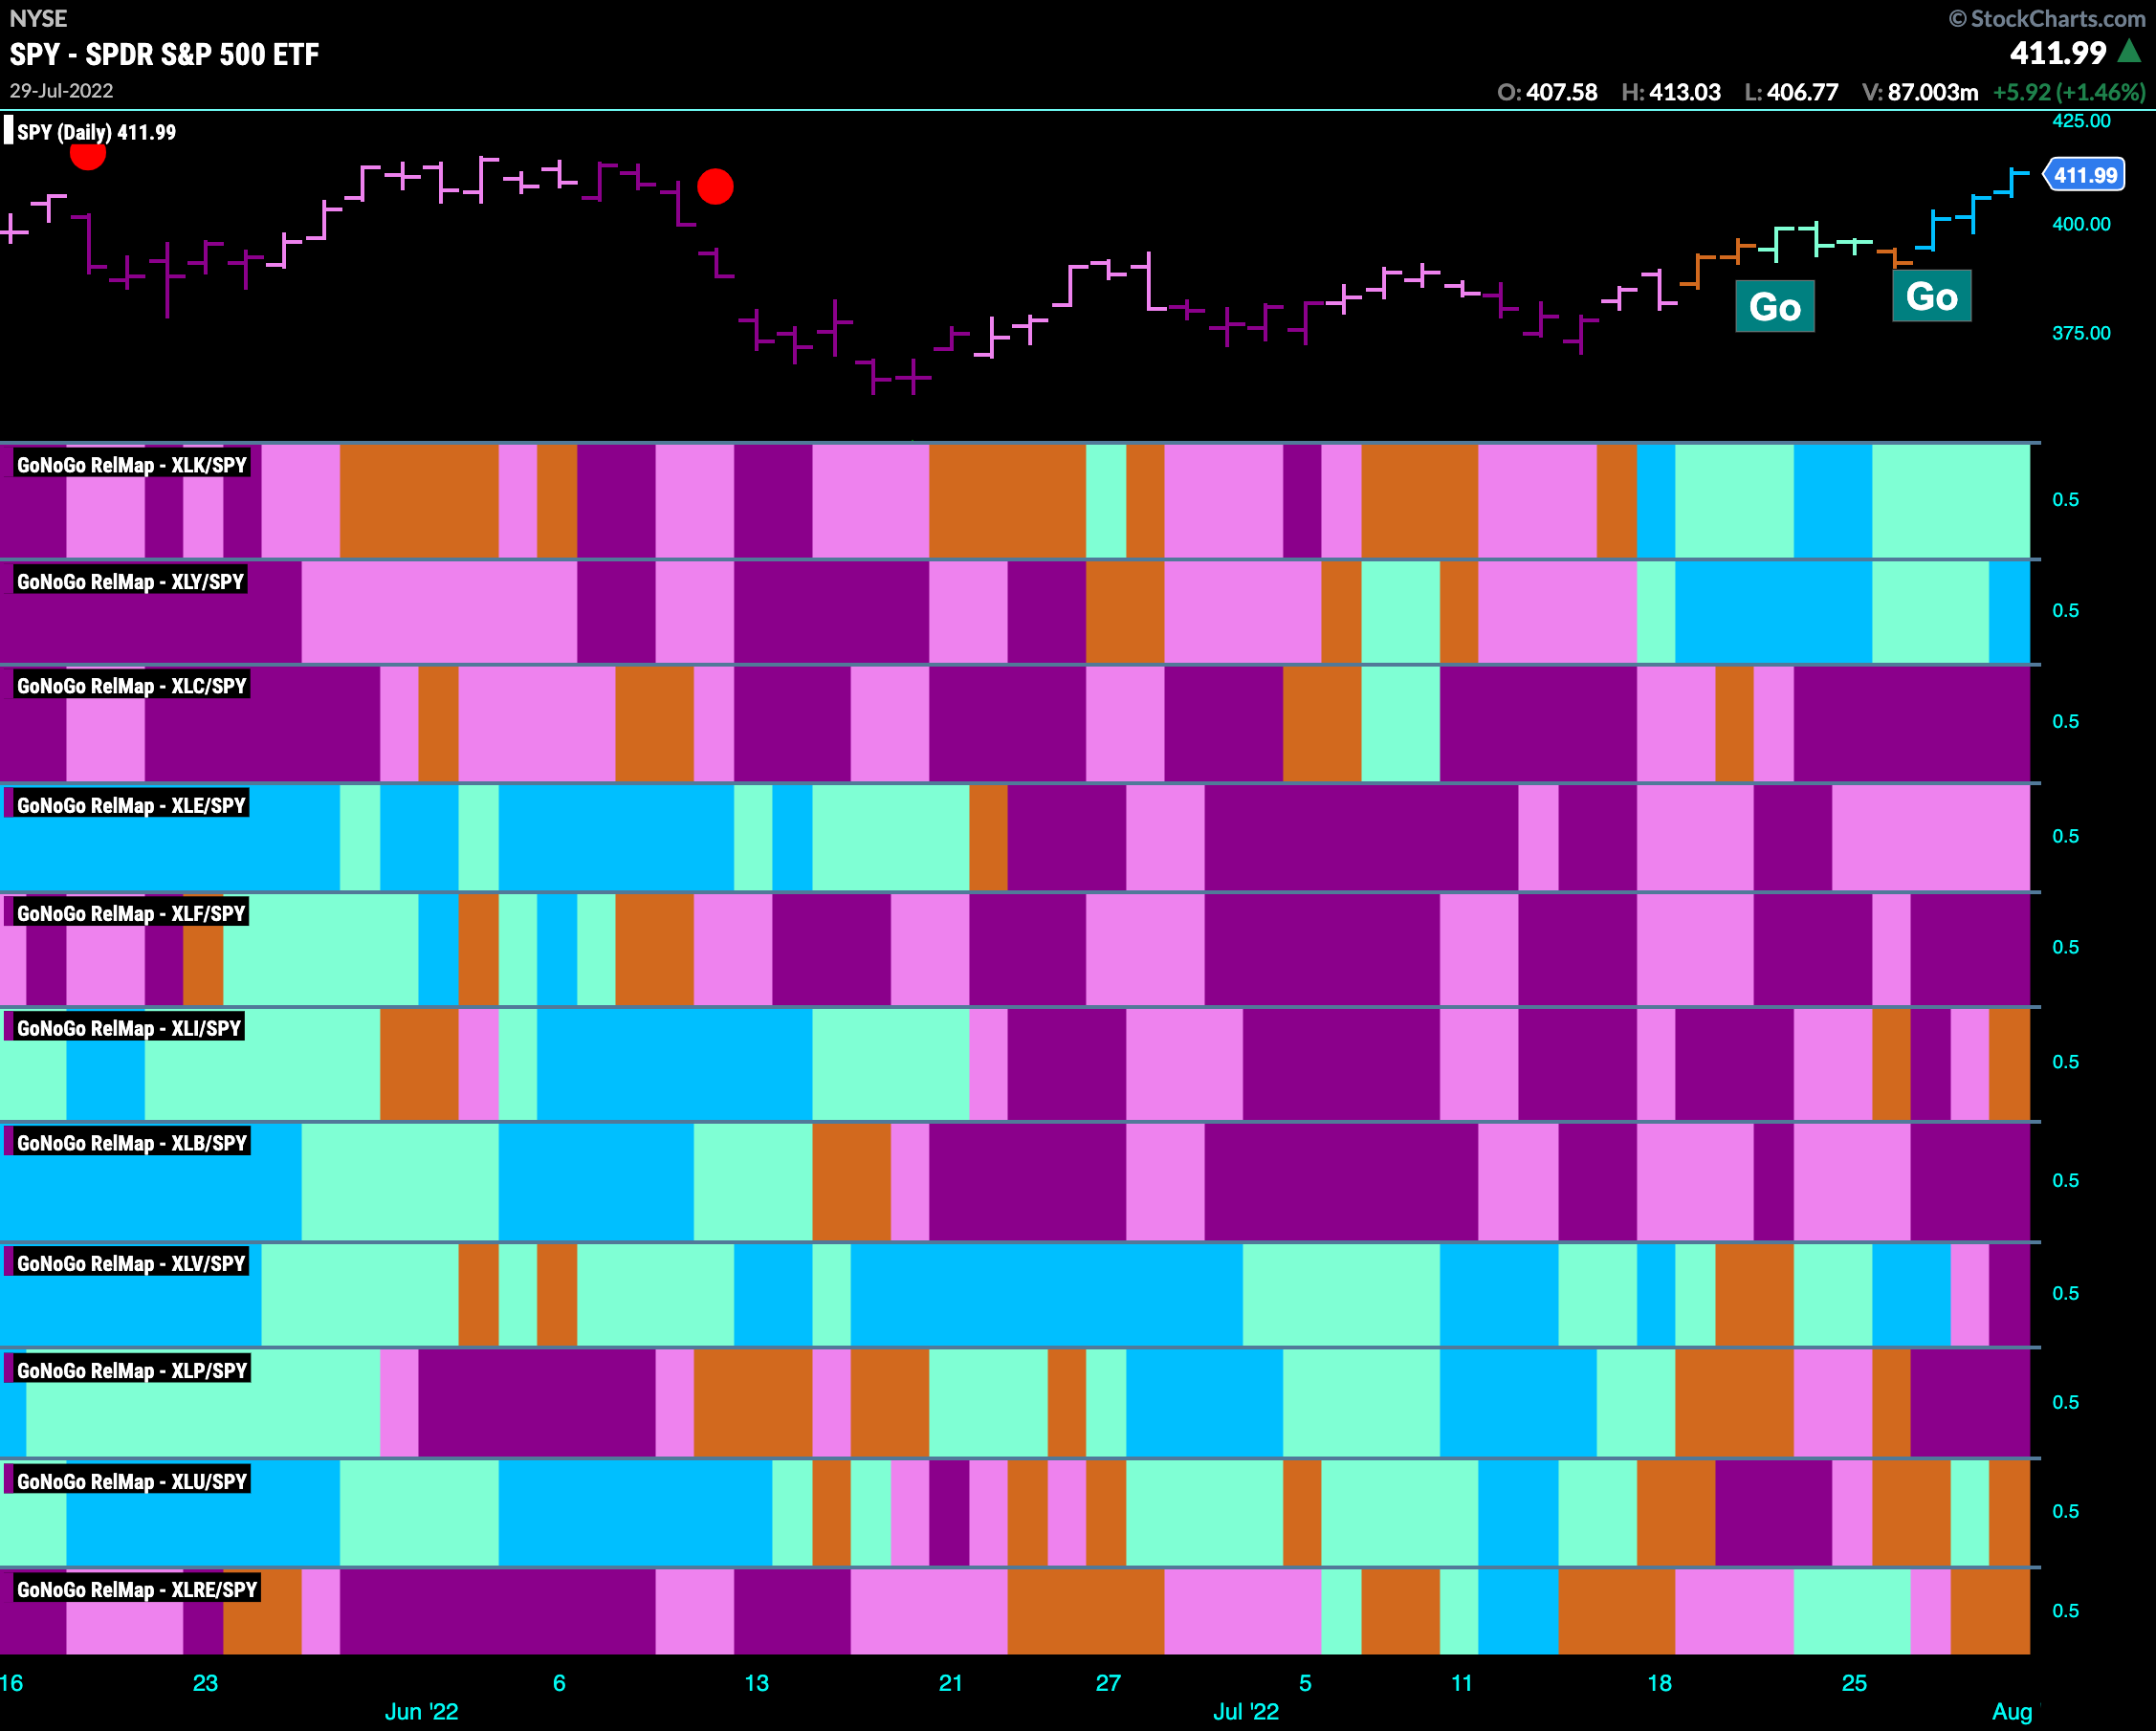
Below is the GoNoGo Sector Relmap. This GoNoGo Relmap applies the GoNoGo Trend to the relative strength ratios of the sectors to the base index. Looking at this map, we can quickly see where the relative outperformance is coming from as well as which sectors are lagging on a relative basis. The GoNoGo RelMap this week shows the rotation into risky growth assets on a sector basis continue as the “Go” trends survive in the technology and discretionary sector.
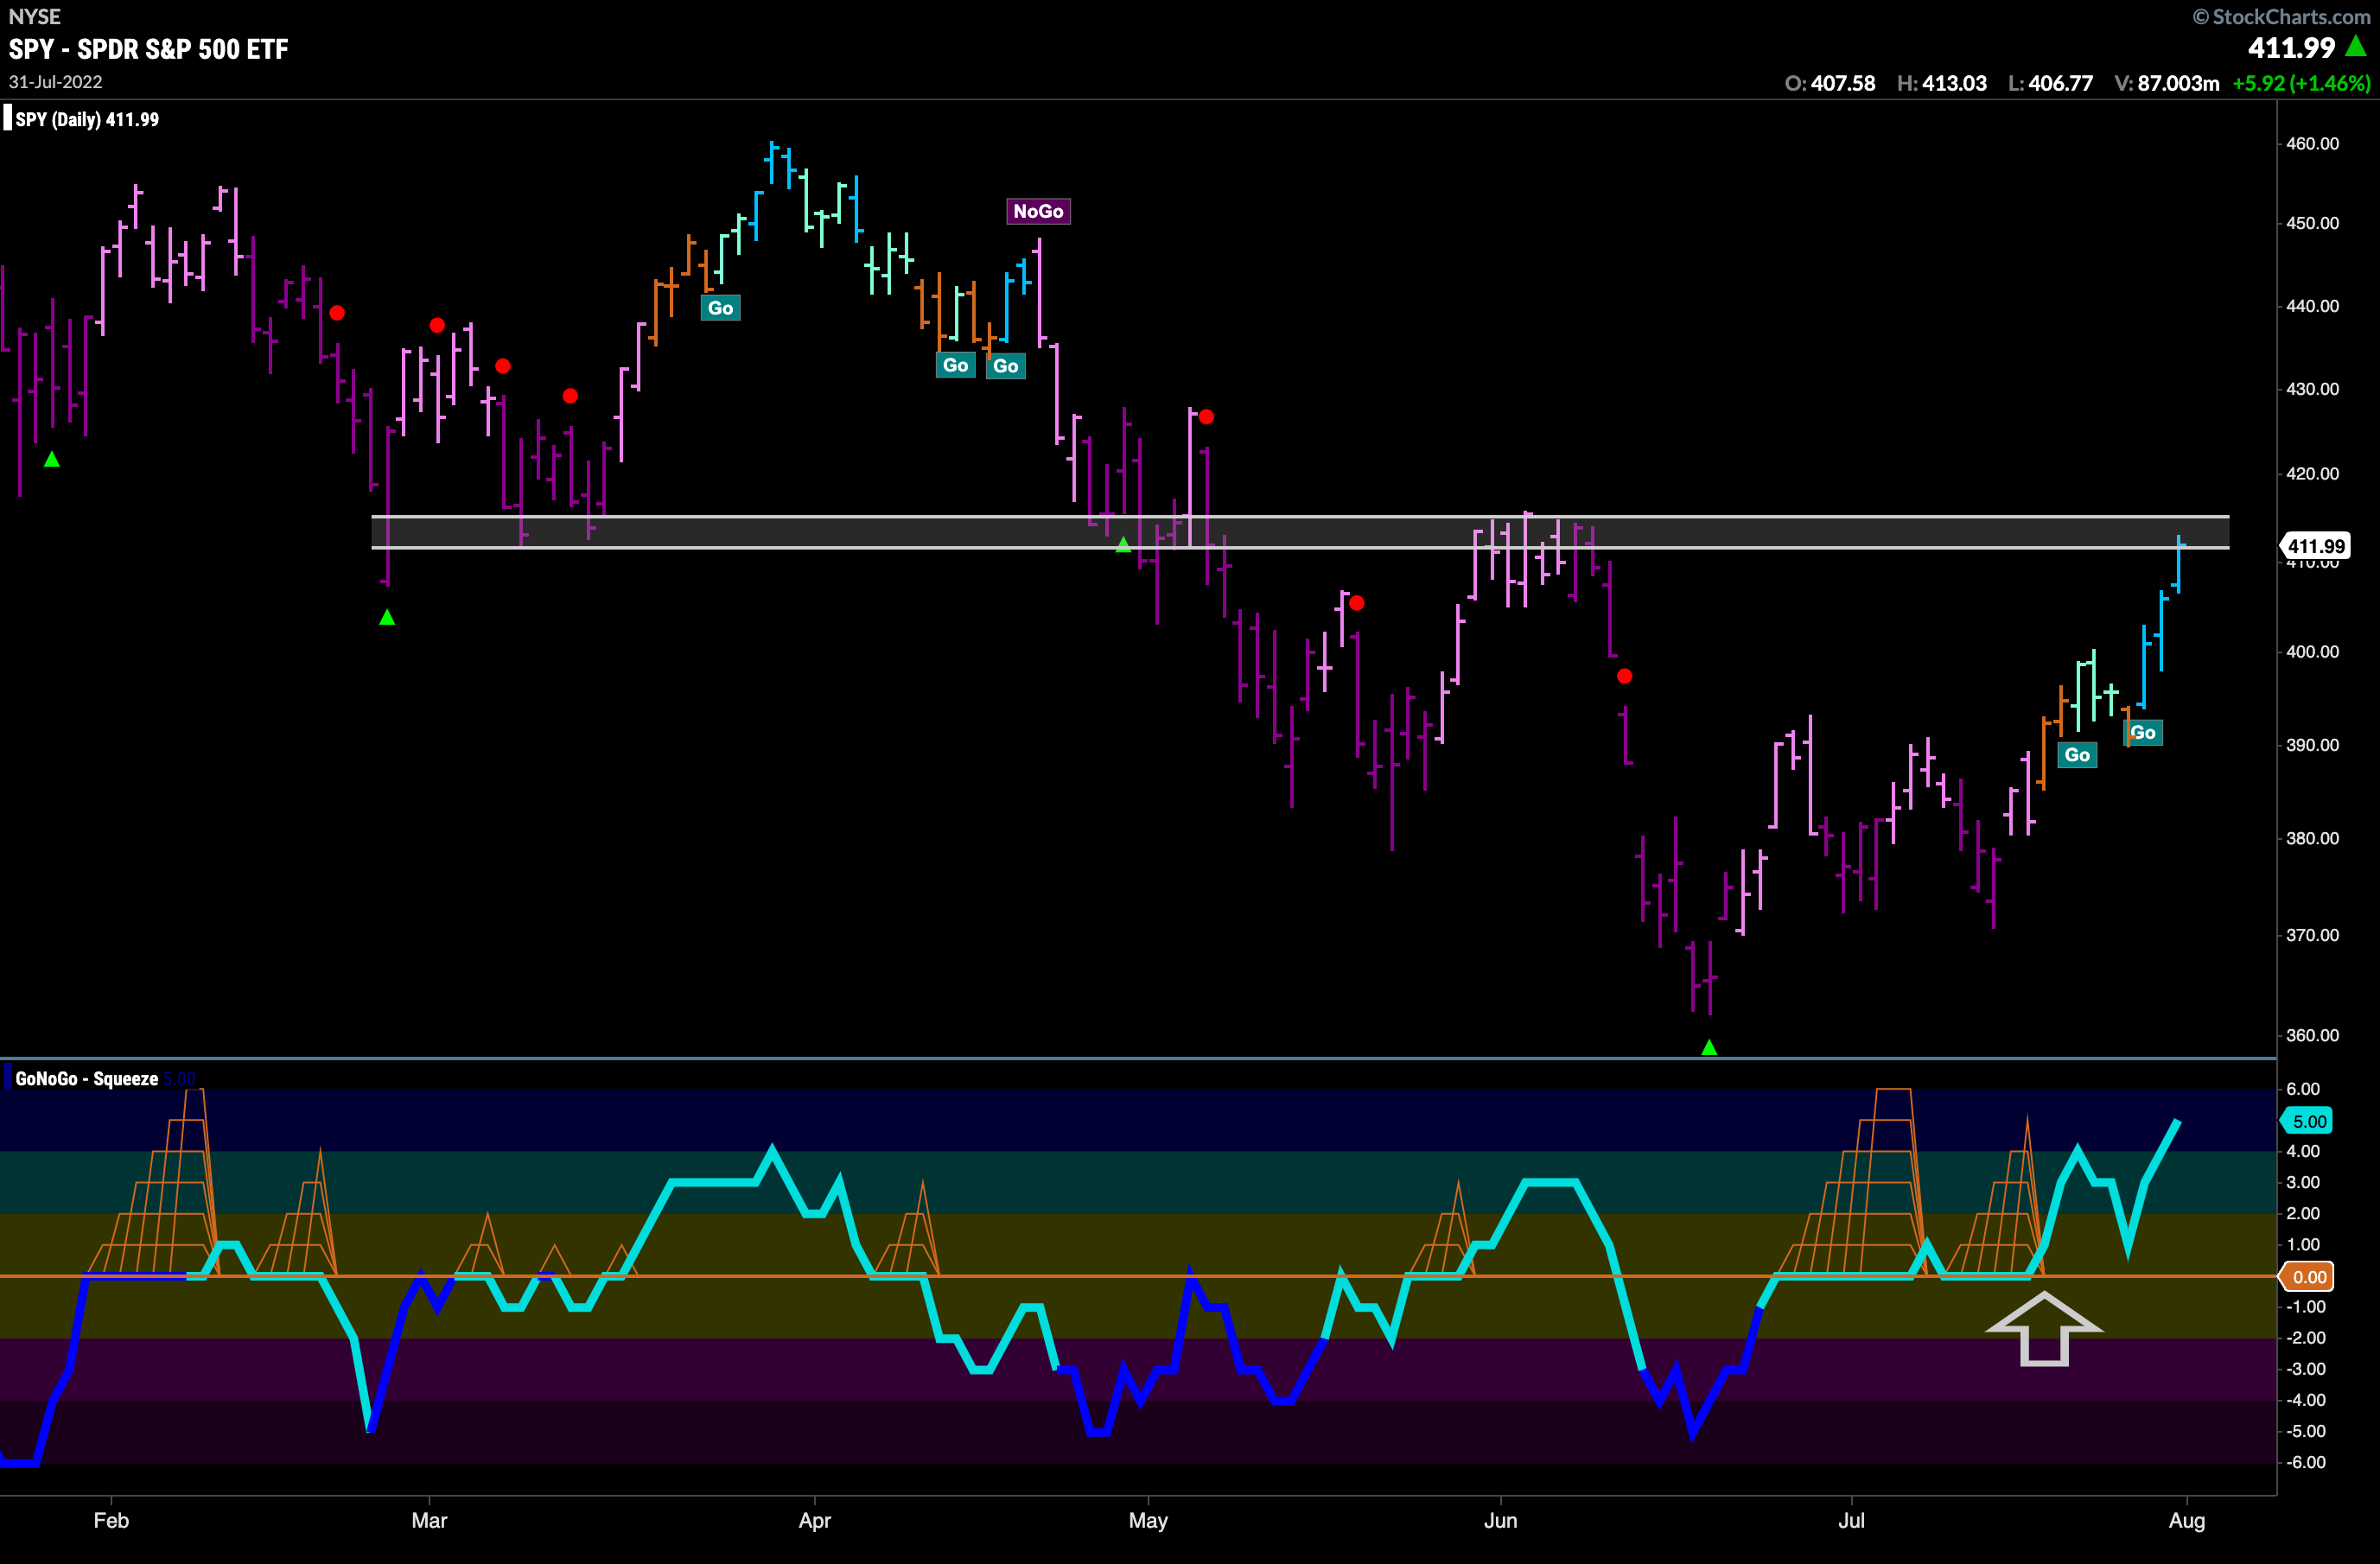
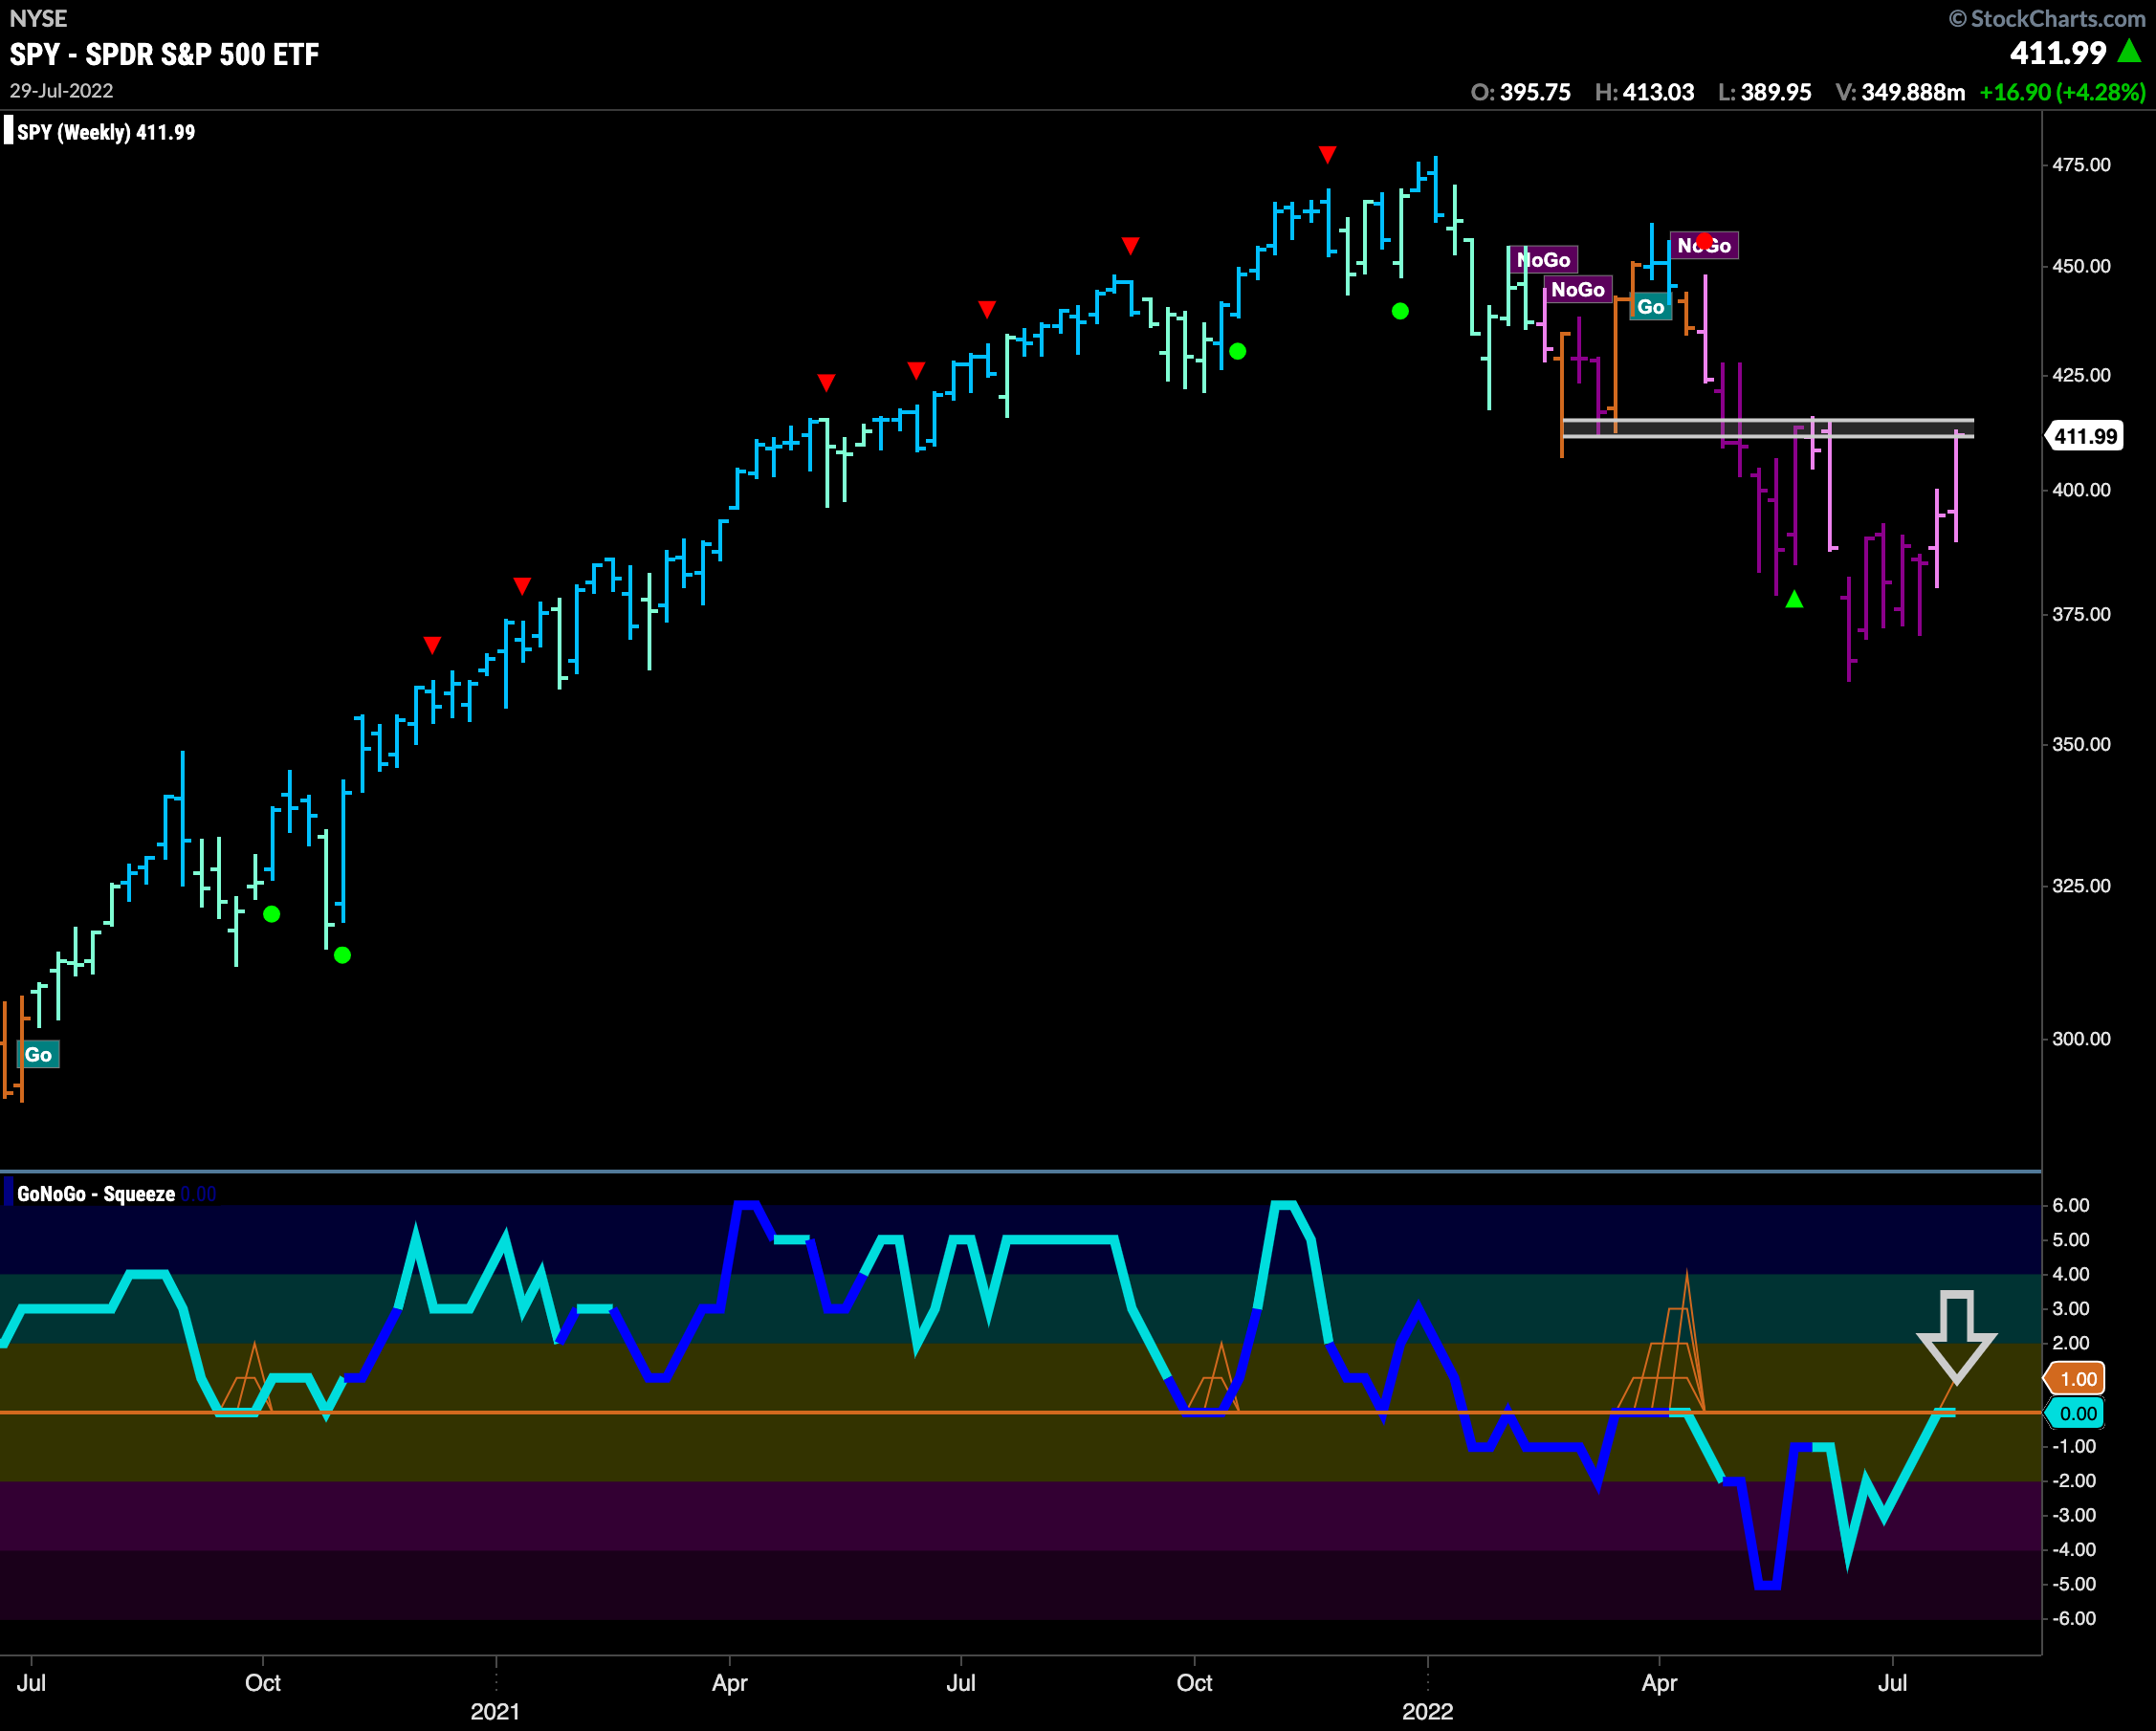
Will the “Go” trend in S&P 500 survive?
We saw strength this week. After an amber “Go Fish” bar the week ended with a string of strong blue “Go” bars. GoNoGo Oscillator broke out of a second GoNoGo Squeeze into positive territory and as it headed back for the zero line it found support. We must note that we are at a price level that could act as resistance and so we will look to see if price can consolidate here.
The weekly chart below shows a longer term perspective. From a trend perspective the weight of the evidence says we are not out of the woods yet. As we bump up to levels of congestion that we saw on the daily chart we can see that we are still painting a “NoGo” bar, albeit a weaker pink one. GoNoGo Oscillator is at zero, testing that level from below. GoNoGo Oscillator will need to break into positive territory if the “NoGo” trend on the weekly perspective is to be challenged. Of course, trends show up first on smaller time frames, so it will be important to see if the weekly chart can follow suit.
Rates to Fall Further?
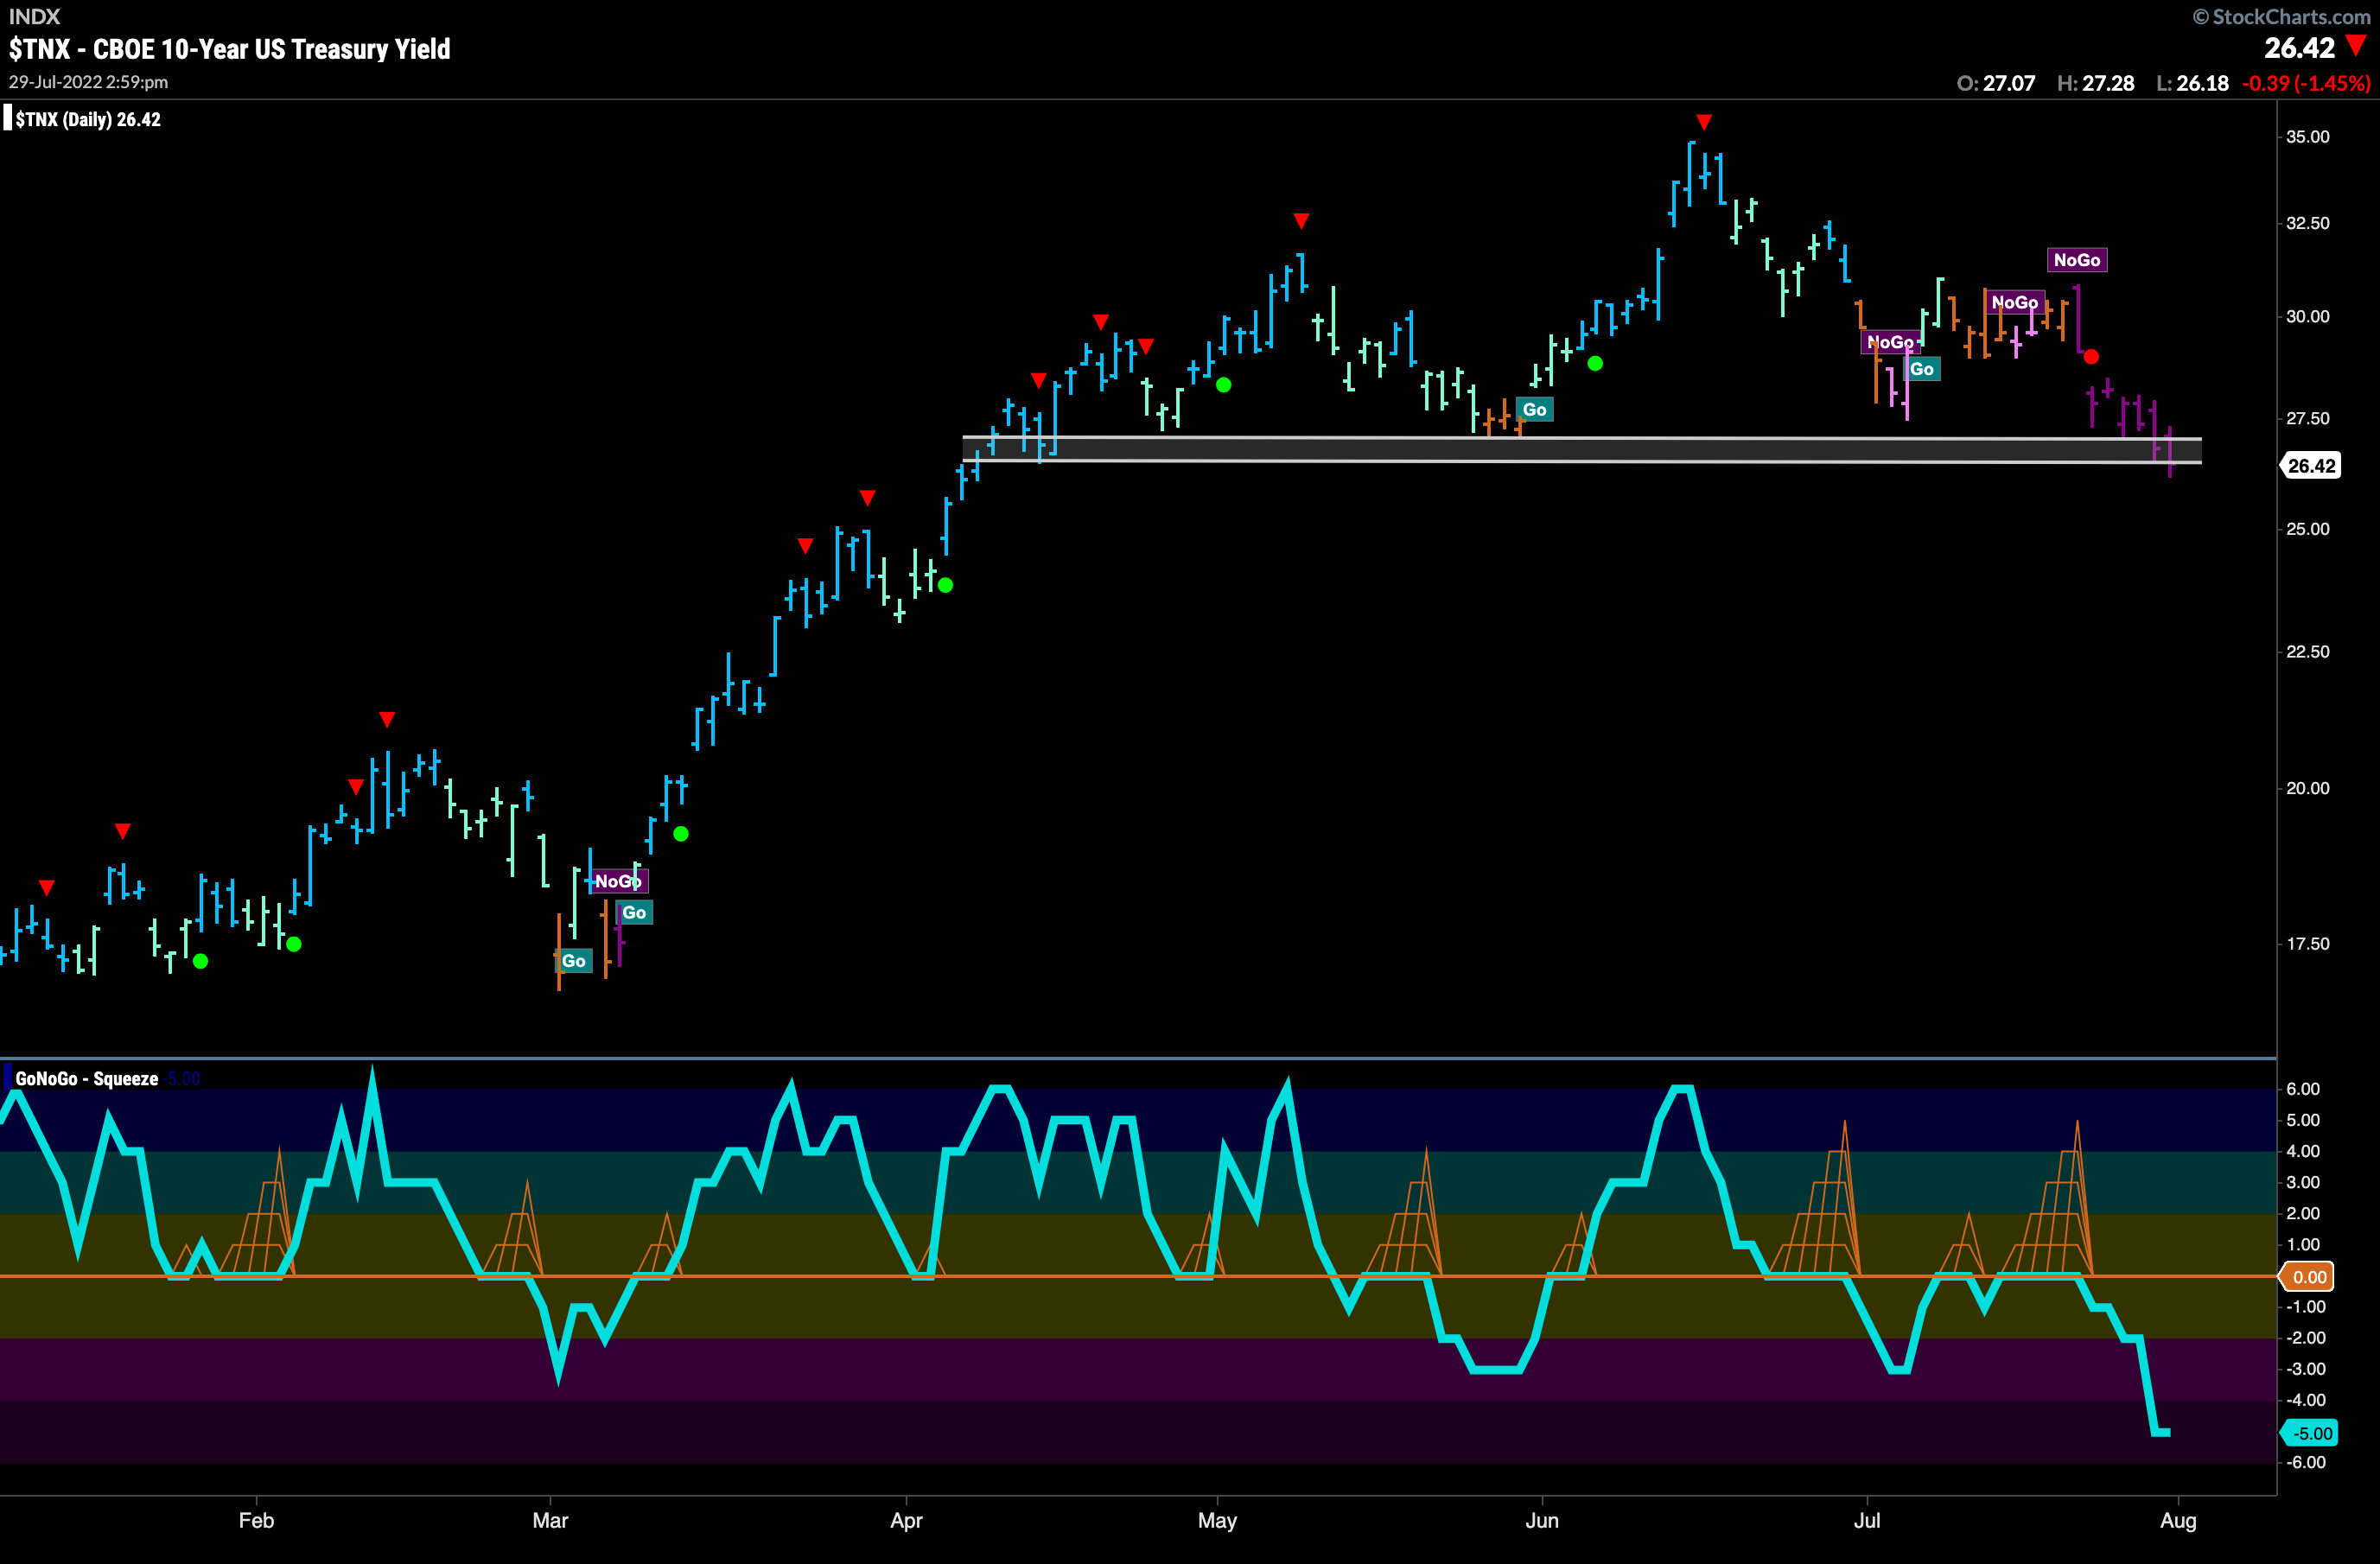
We saw the “NoGo” trend in rates remain strong this week painting all purple bars. We see price now testing levels that have been support over the last 4 plus months. If this level doesn’t hold then we could see rates fall further in the short term. GoNoGo Oscillator has fallen quickly into oversold territory since breaking down out of a GoNoGo Squeeze a week ago.
Keeping it in Perspective
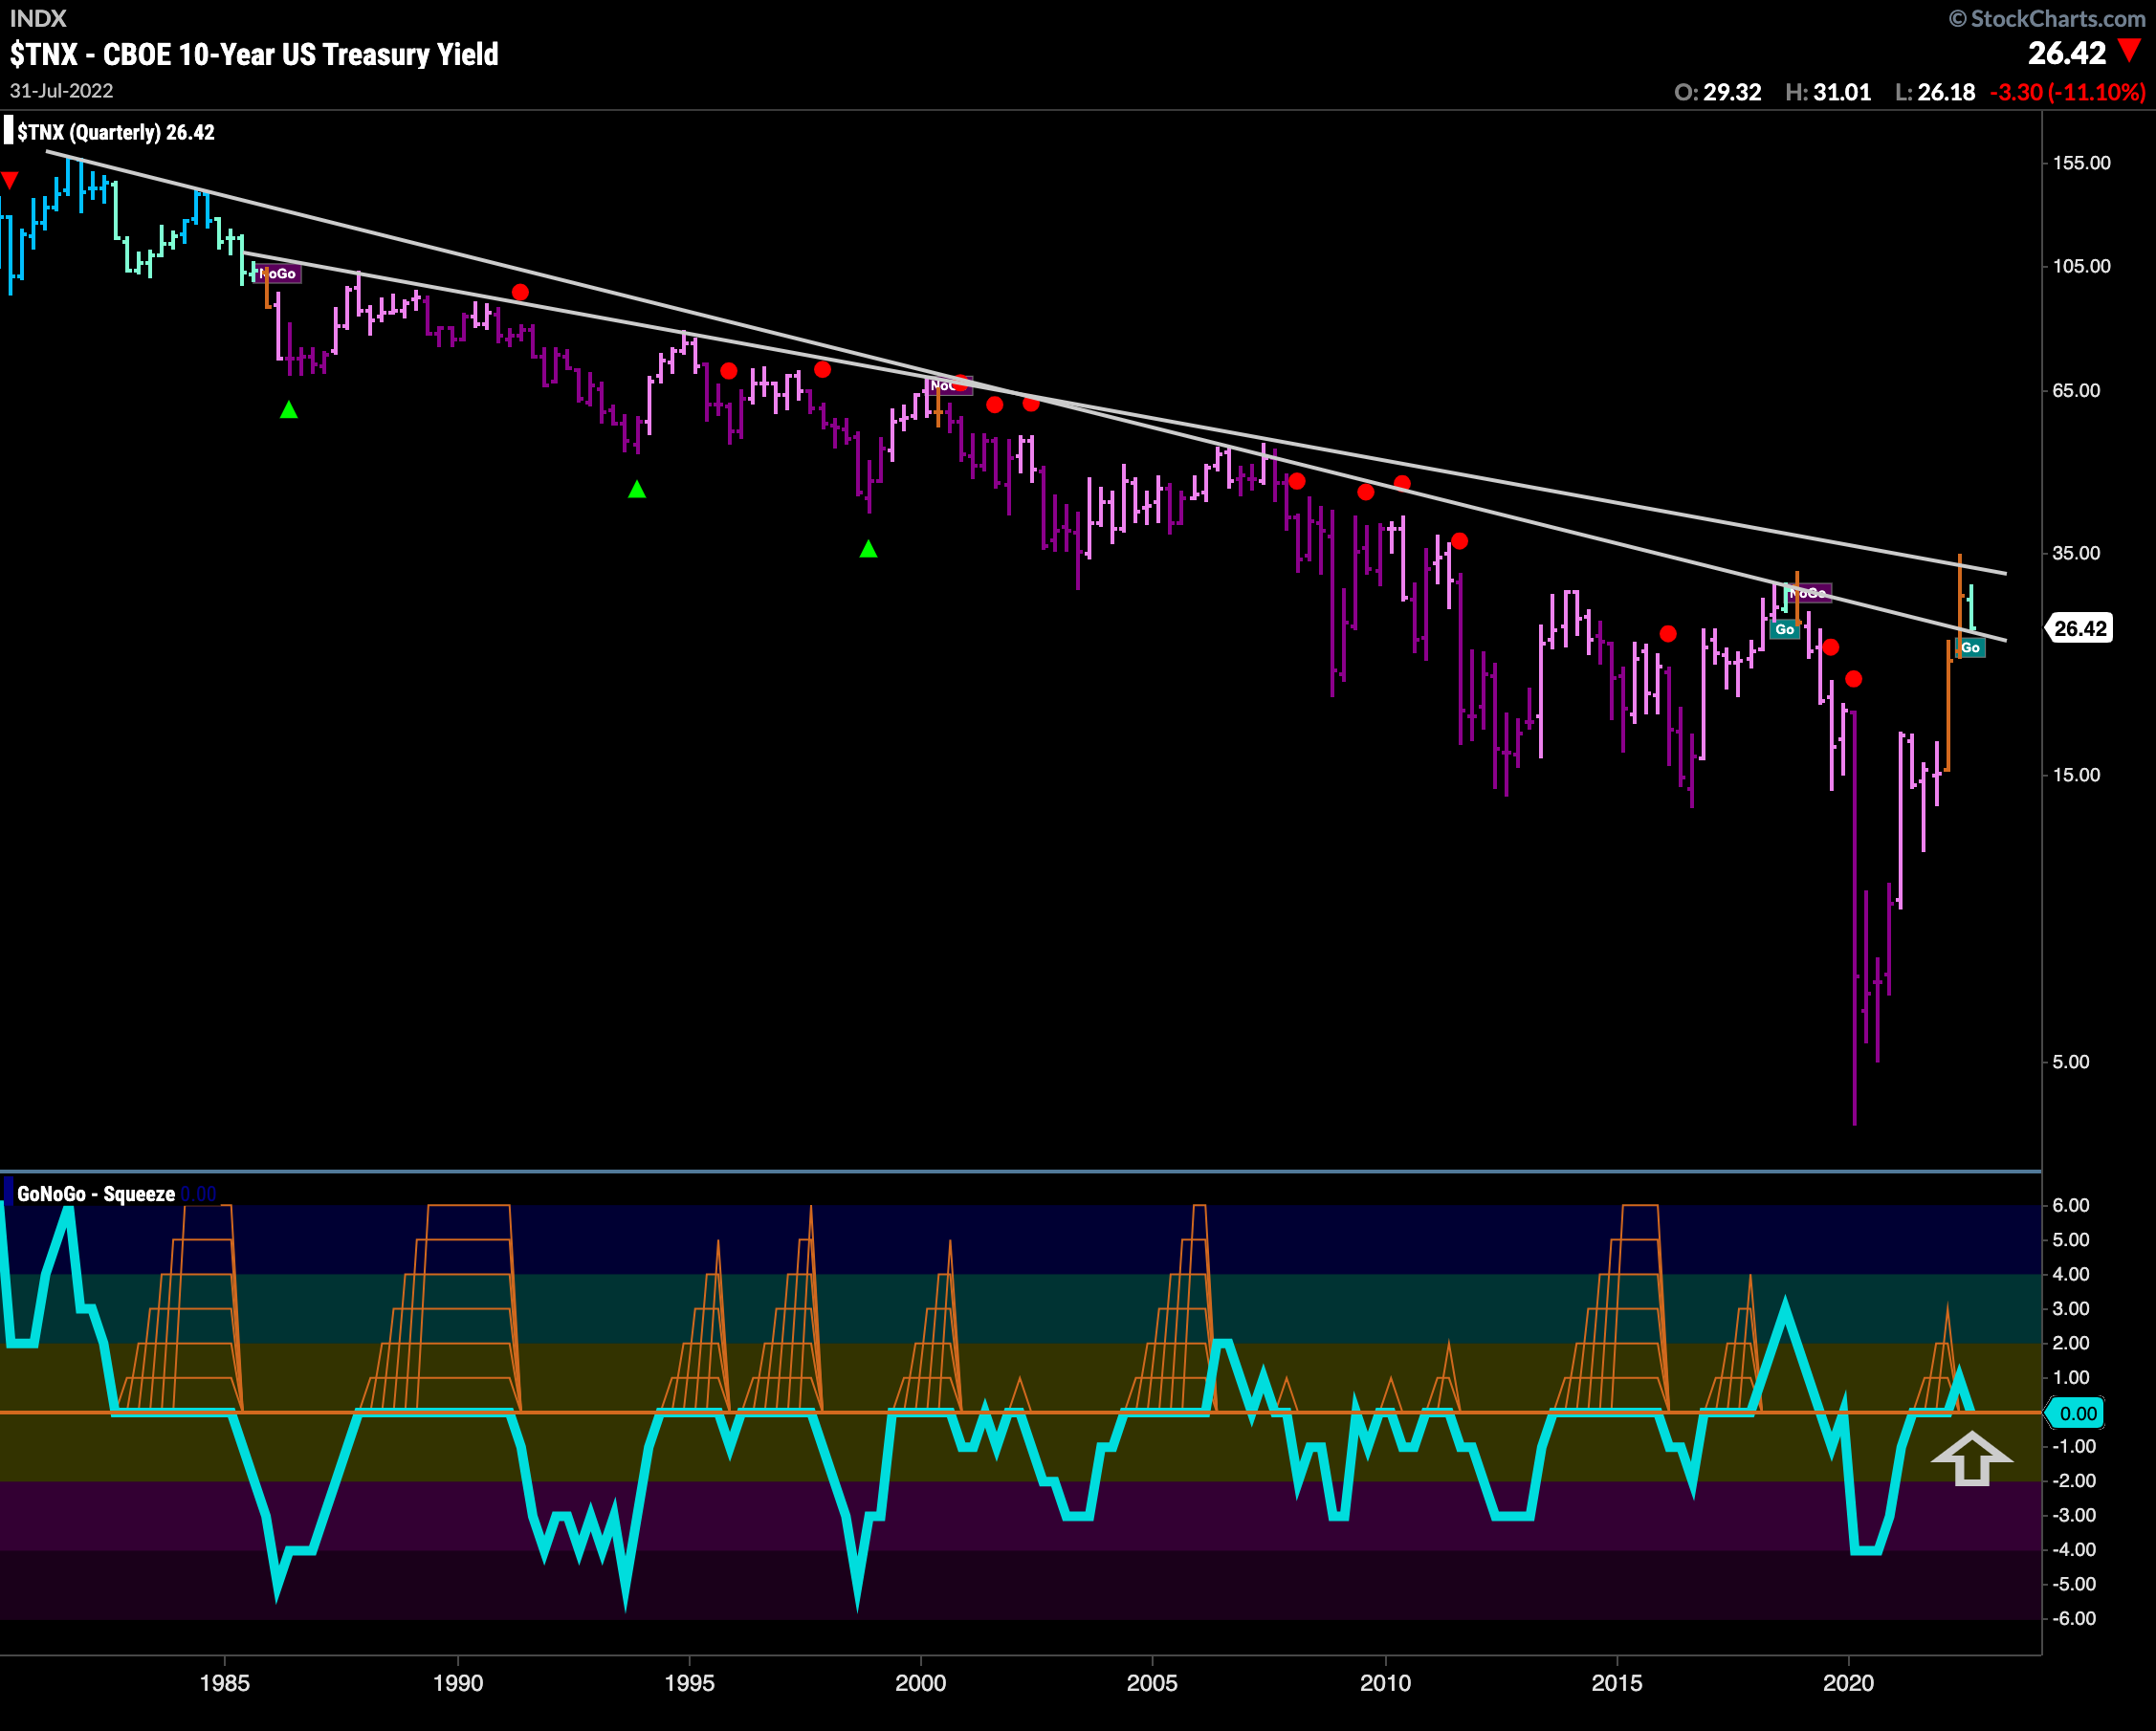
We’ve shown this chart several times over the last year as the rising rates environment has seen prices challenge a multi decade down trend. This quarter sees GoNoGo Trend paint a first “Go” bar in several years and price is above a key downward sloping trend line. As rates have fallen recently we see that this is retesting these significant levels. The GoNoGo Oscillator is also at zero, testing support from above. We will watch this chart closely as we move into the second half of the year.
Gasoline at Inflection Point
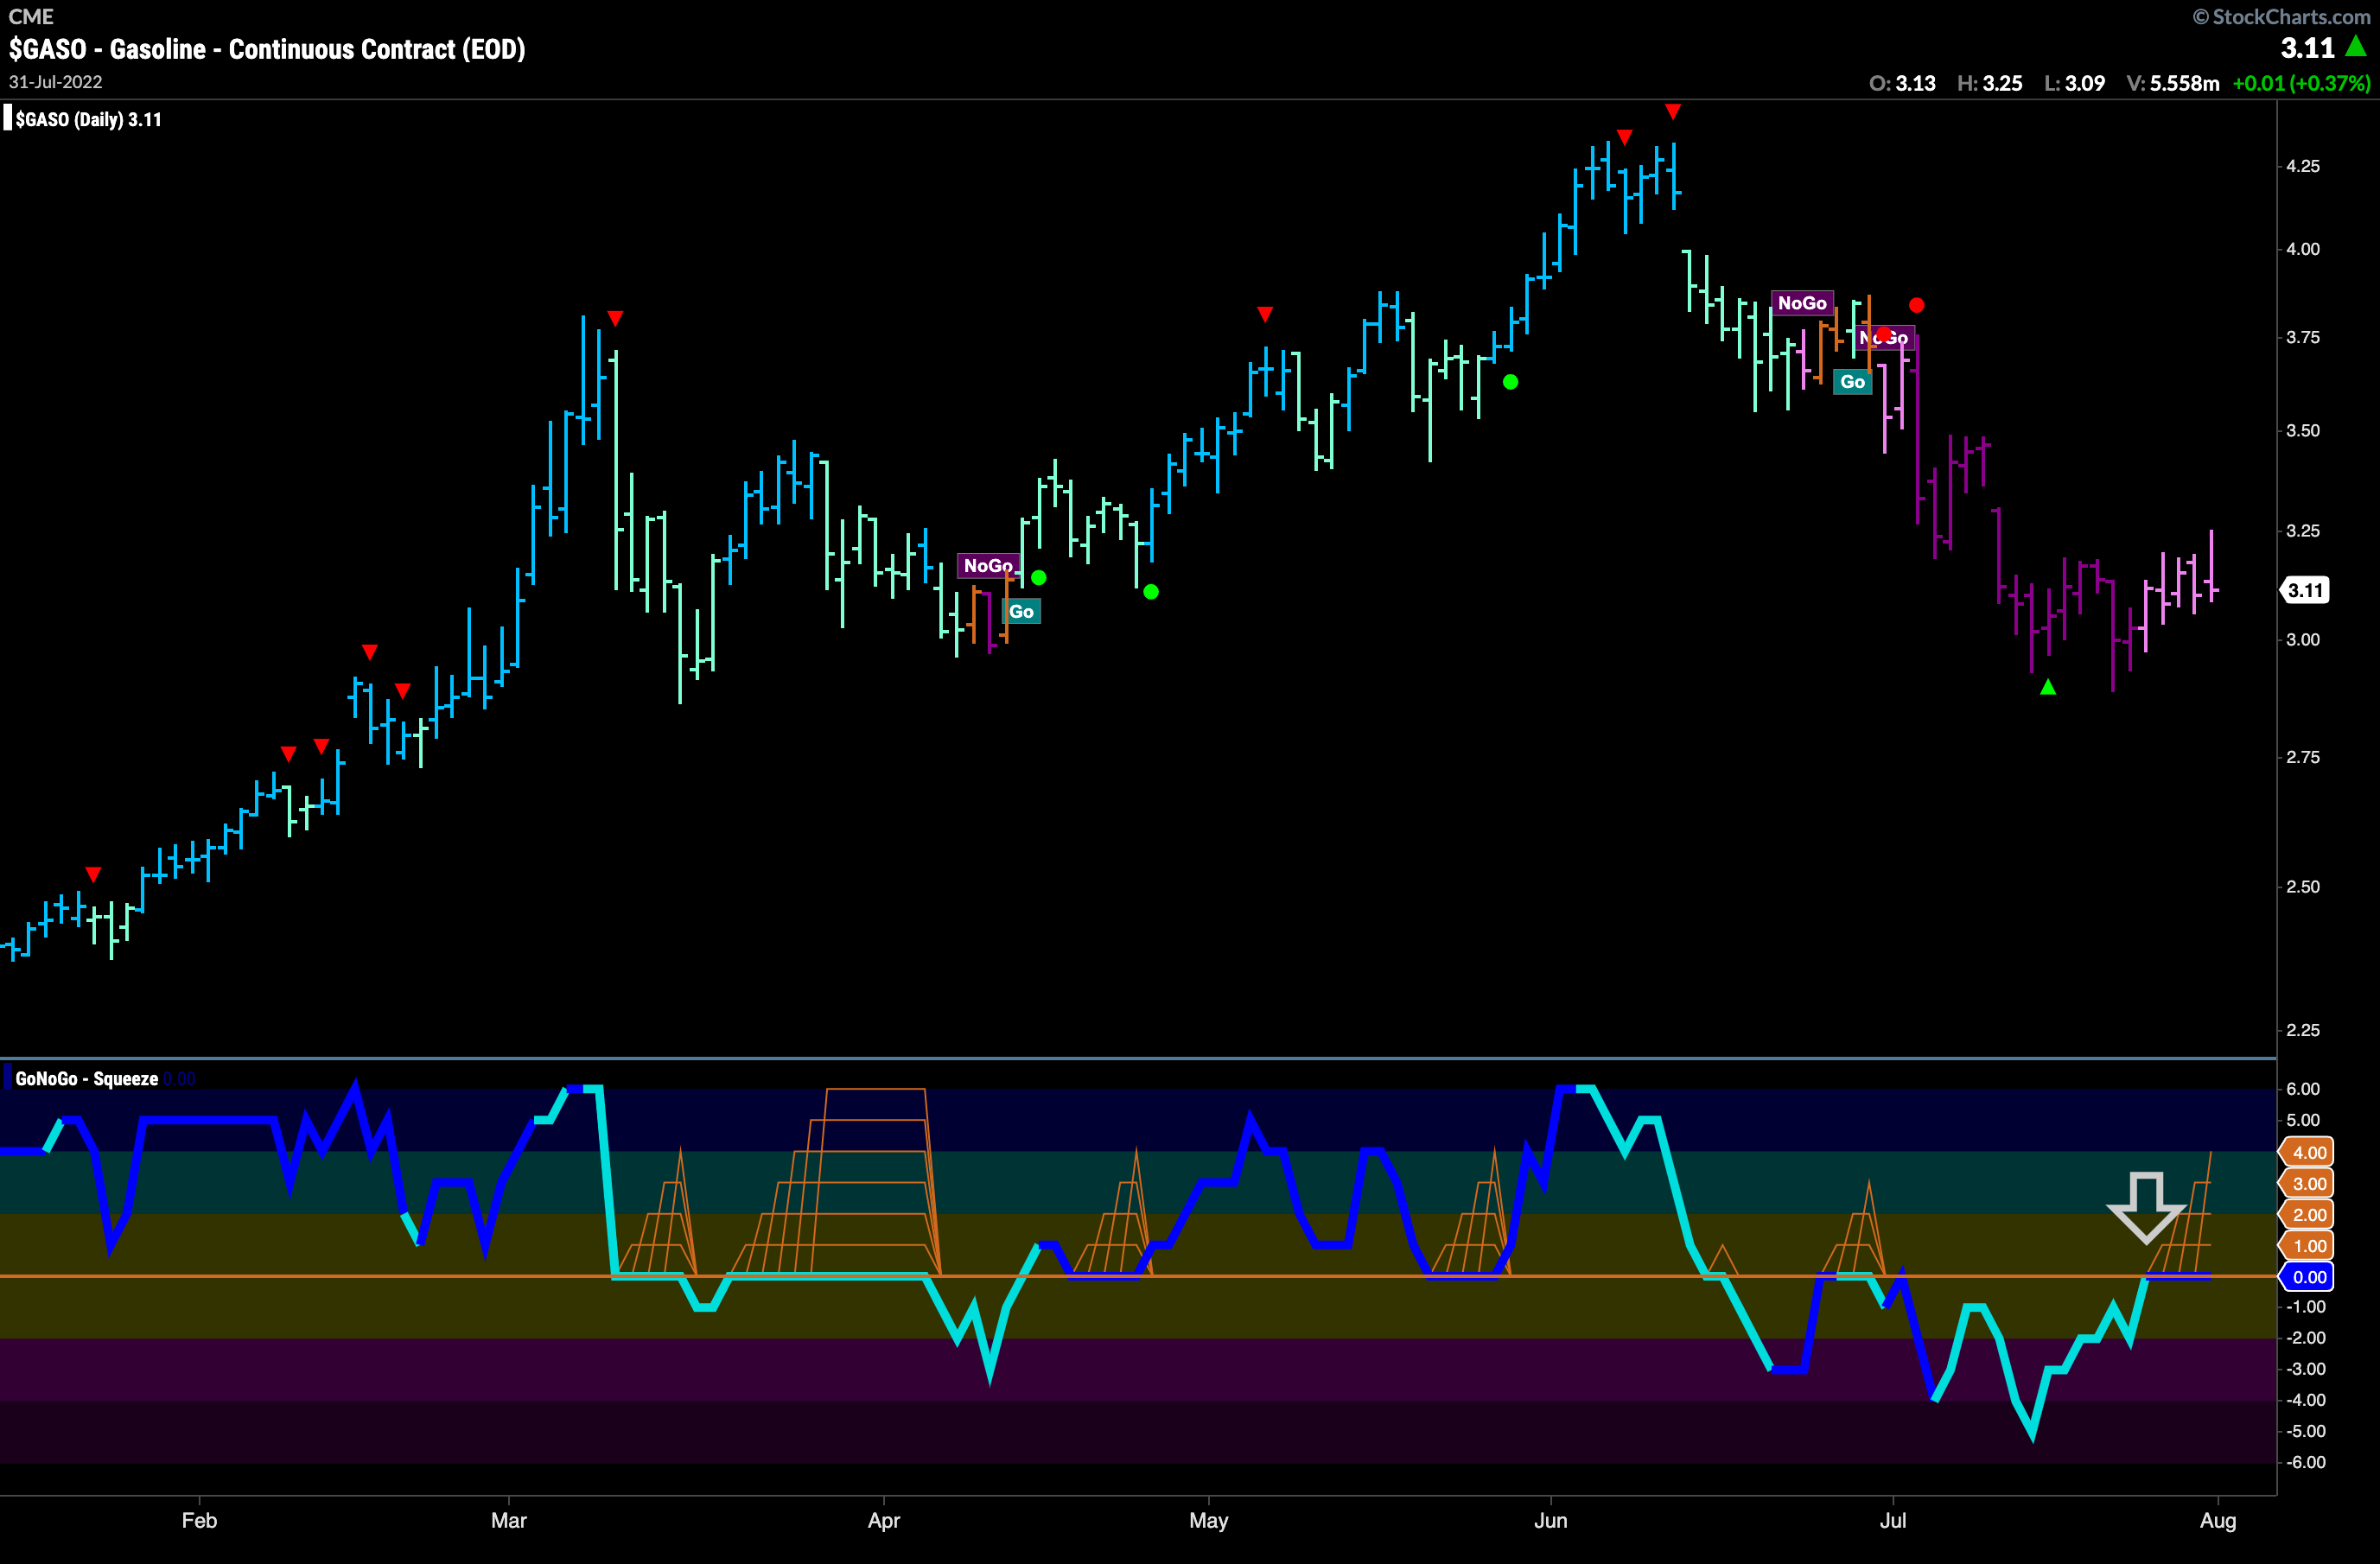
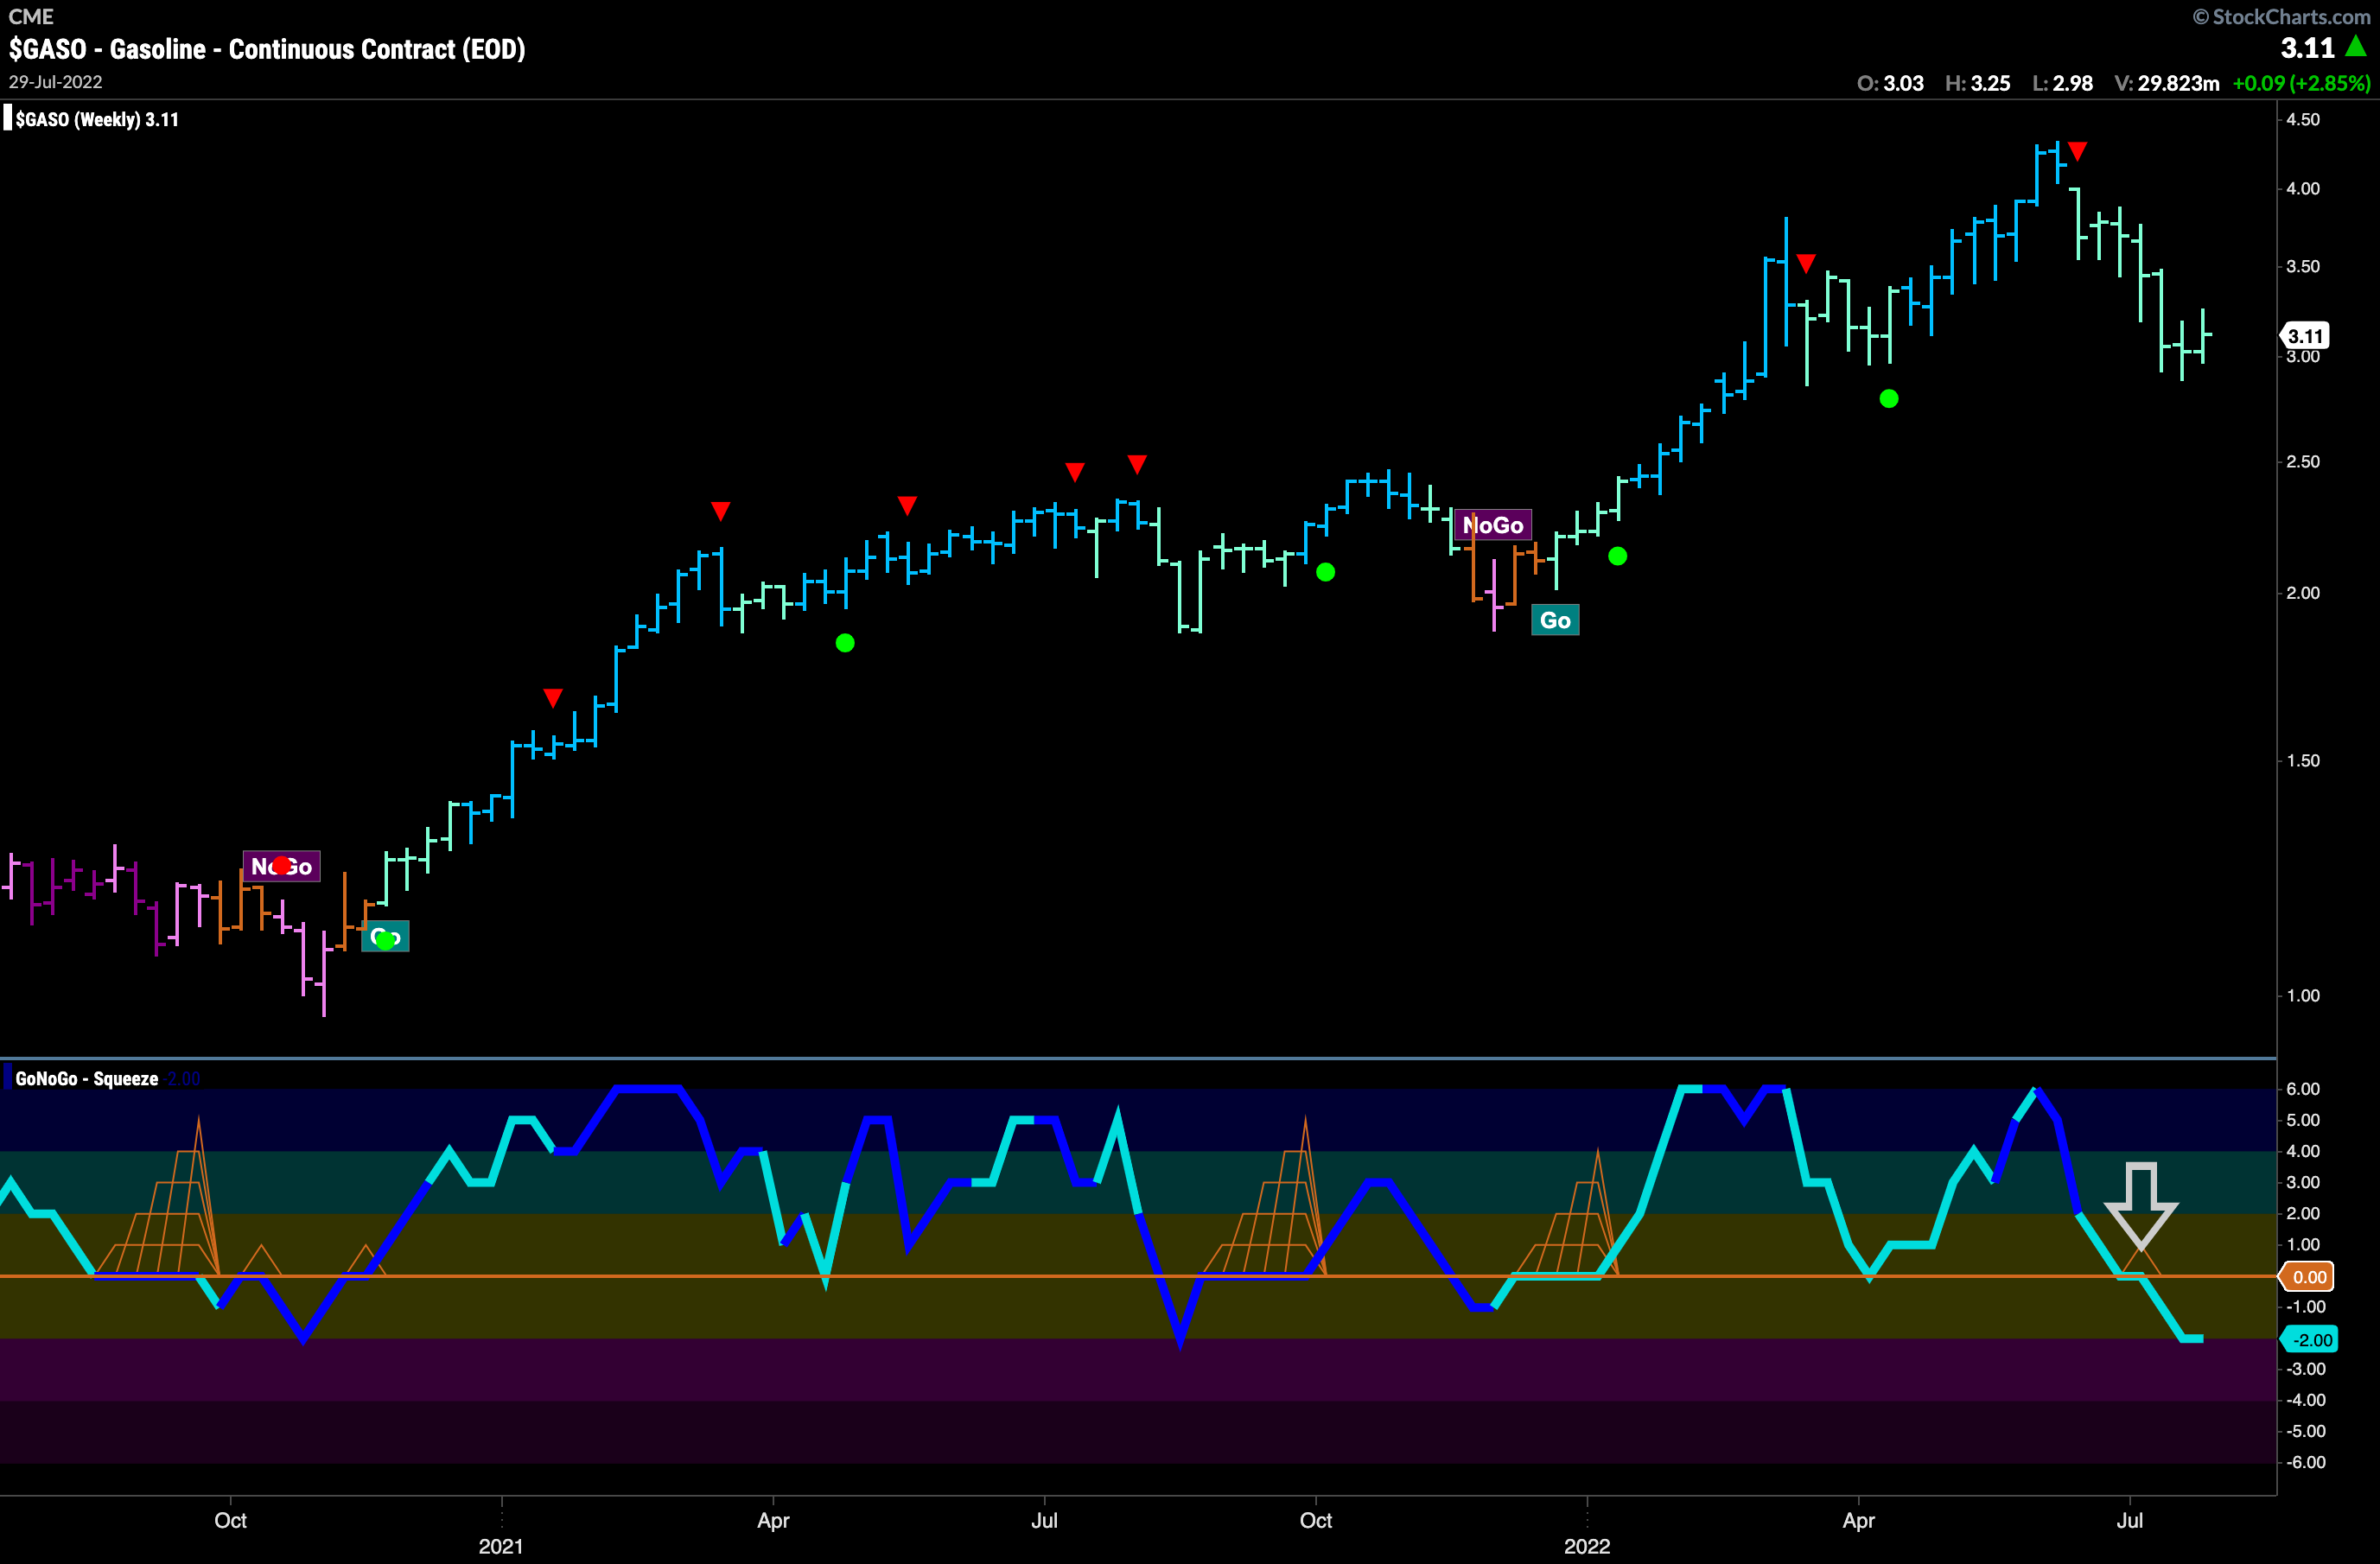
It’s fair to say that the consumer has been feeling it at the pump for most of the year. However, since the highs in June (highlighted by the Go Countertrend Correction red arrows), price has fallen and we see $GASO in a “NoGo” trend. That trend weakened this week, as GoNoGo Trend paints weaker pink bars. GoNoGo Oscillator is testing the zero line from below as a GoNoGo Squeeze builds. We will look to see if GoNoGo Oscillator gets rejected by this objective level of resistance and if it does, we could see more relief for drivers.
The weekly chart of $GASO shows that there is a crack in the longer term “Go” trend as well. As price corrects from the high and shows weakness in a string of paler aqua “Go” bars, we see the GoNoGo Oscillator fail to find support at zero. This tells us that there is some heavy selling, and some oversold conditions that shouldn’t be present in a strong “Go” trend. If this selling continues, we could see a “NoGo” emerge on the weekly chart.
Daily Dollar Woes
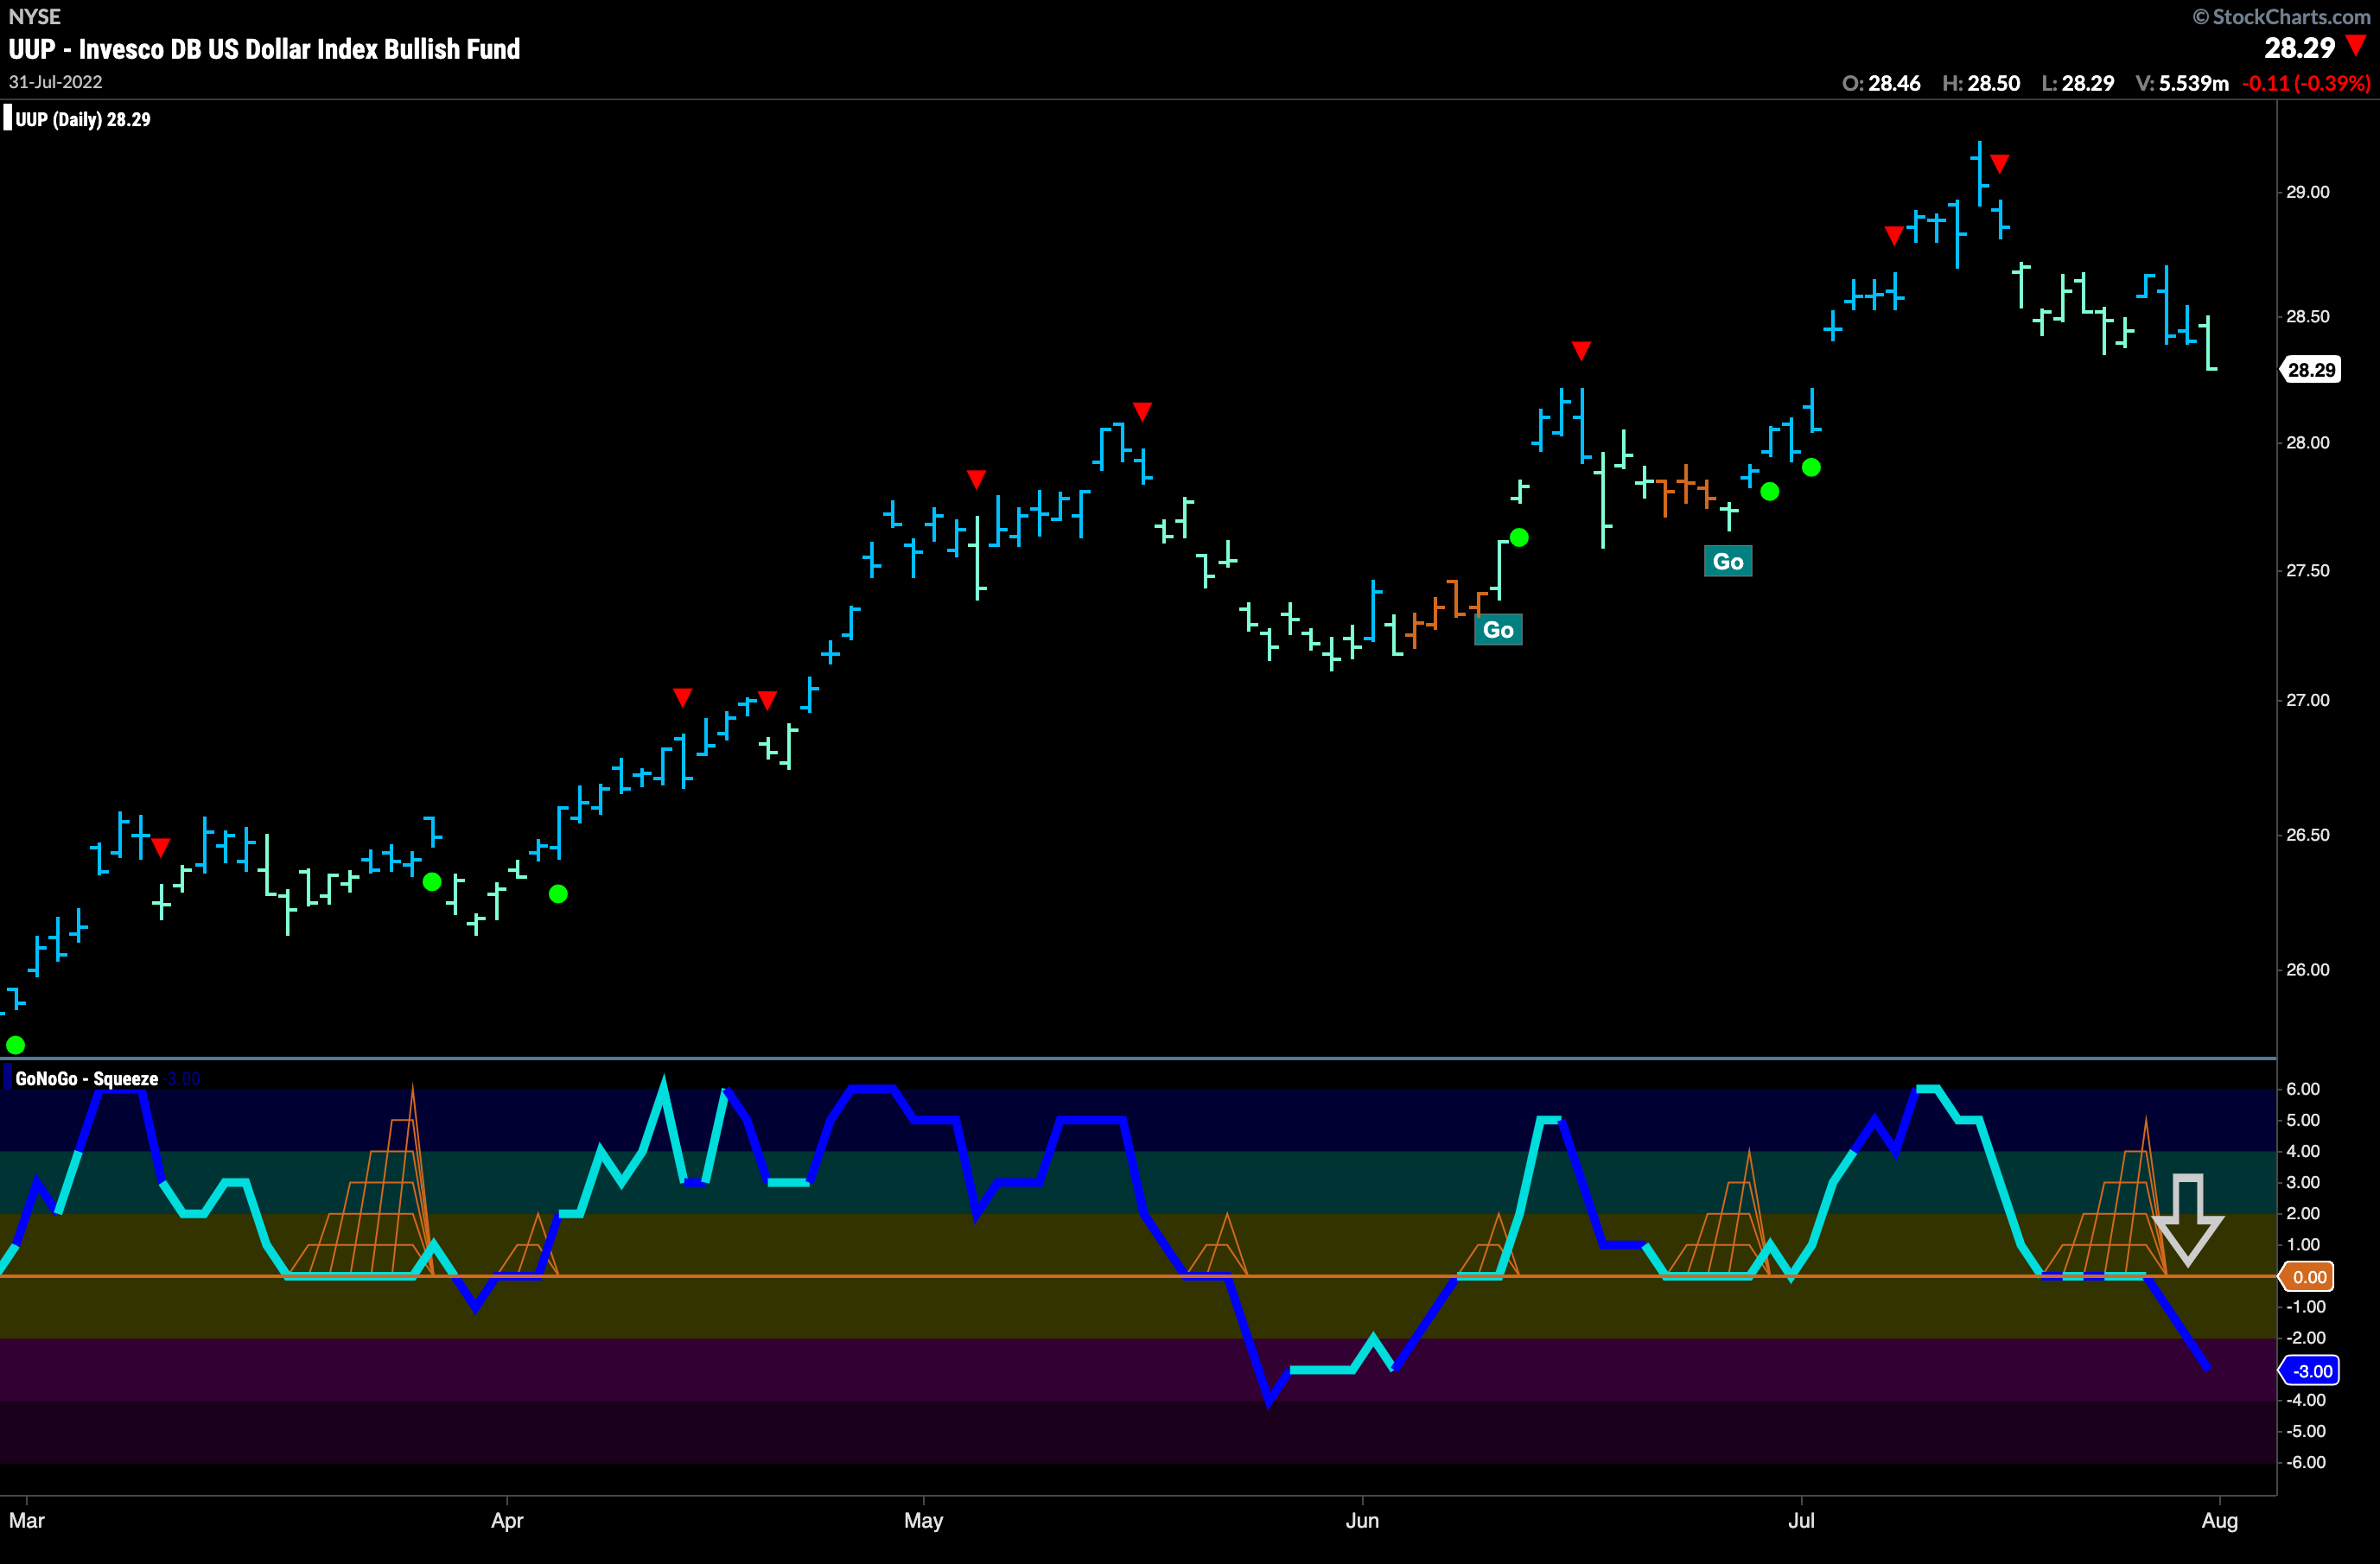
The dollar strength has surprised many this year as the “Go” trend continues and price hits high after high. Currently, we see a correction after the Go CounterTrend correction red arrows in mid July and price is currently painting a weaker aqua bar. While the weight of the evidence tells us that the trend, albeit weaker, is still in place, the movements of GoNoGo Oscillator have got us worried. Instead of finding support at zero, the oscillator has broken out of a GoNoGo Squeeze into negative territory and on heavy volume (oscillator line dark blue). This tells us that there is countertrend momentum and that the greenback may struggle to go higher in the short term.
Dollar Holding on to Strength Against Sterling
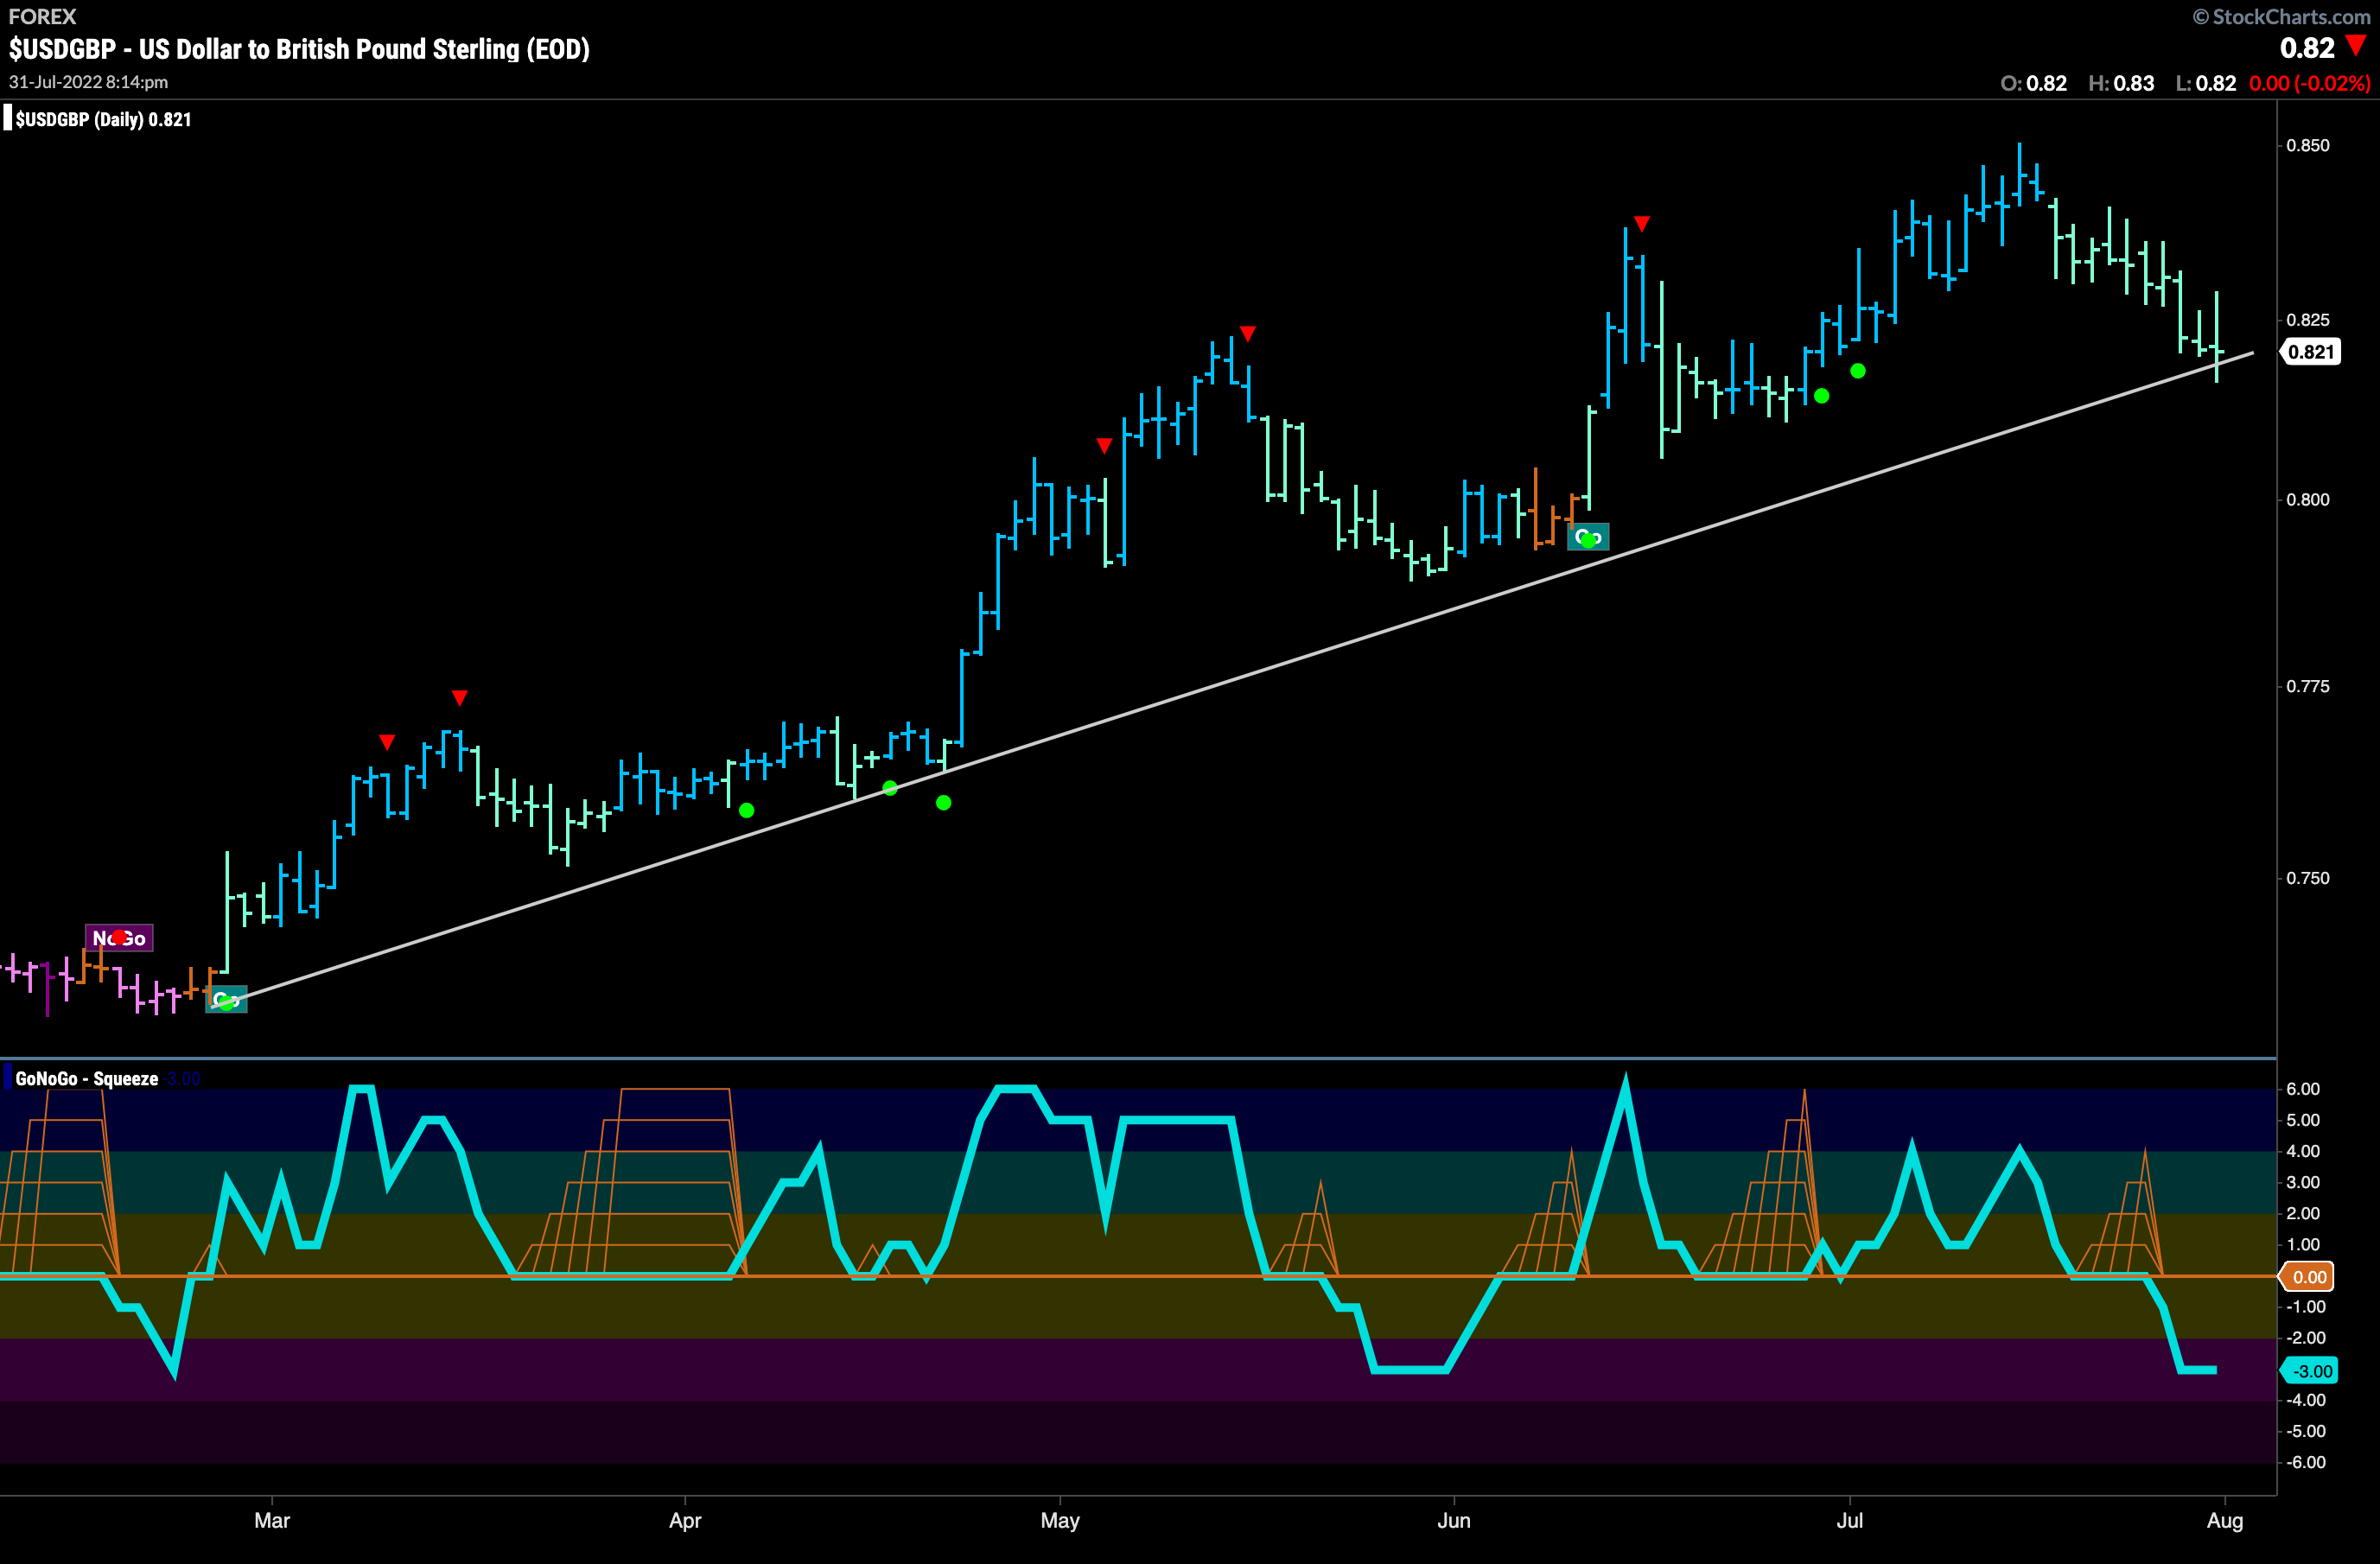
With a trip back home to the U.K approaching in a couple of weeks, I’m keen to look at the chart below showing the relative “Go” trend of the dollar to the British pound. It is at an important inflection point. With the prospect of my dollars going further than they have for a few years I’m curious to see if the GoNoGo Oscillator break below zero will decrease my spending money or if price will hold at the trend line!
Louis Vuitton Looking Strong
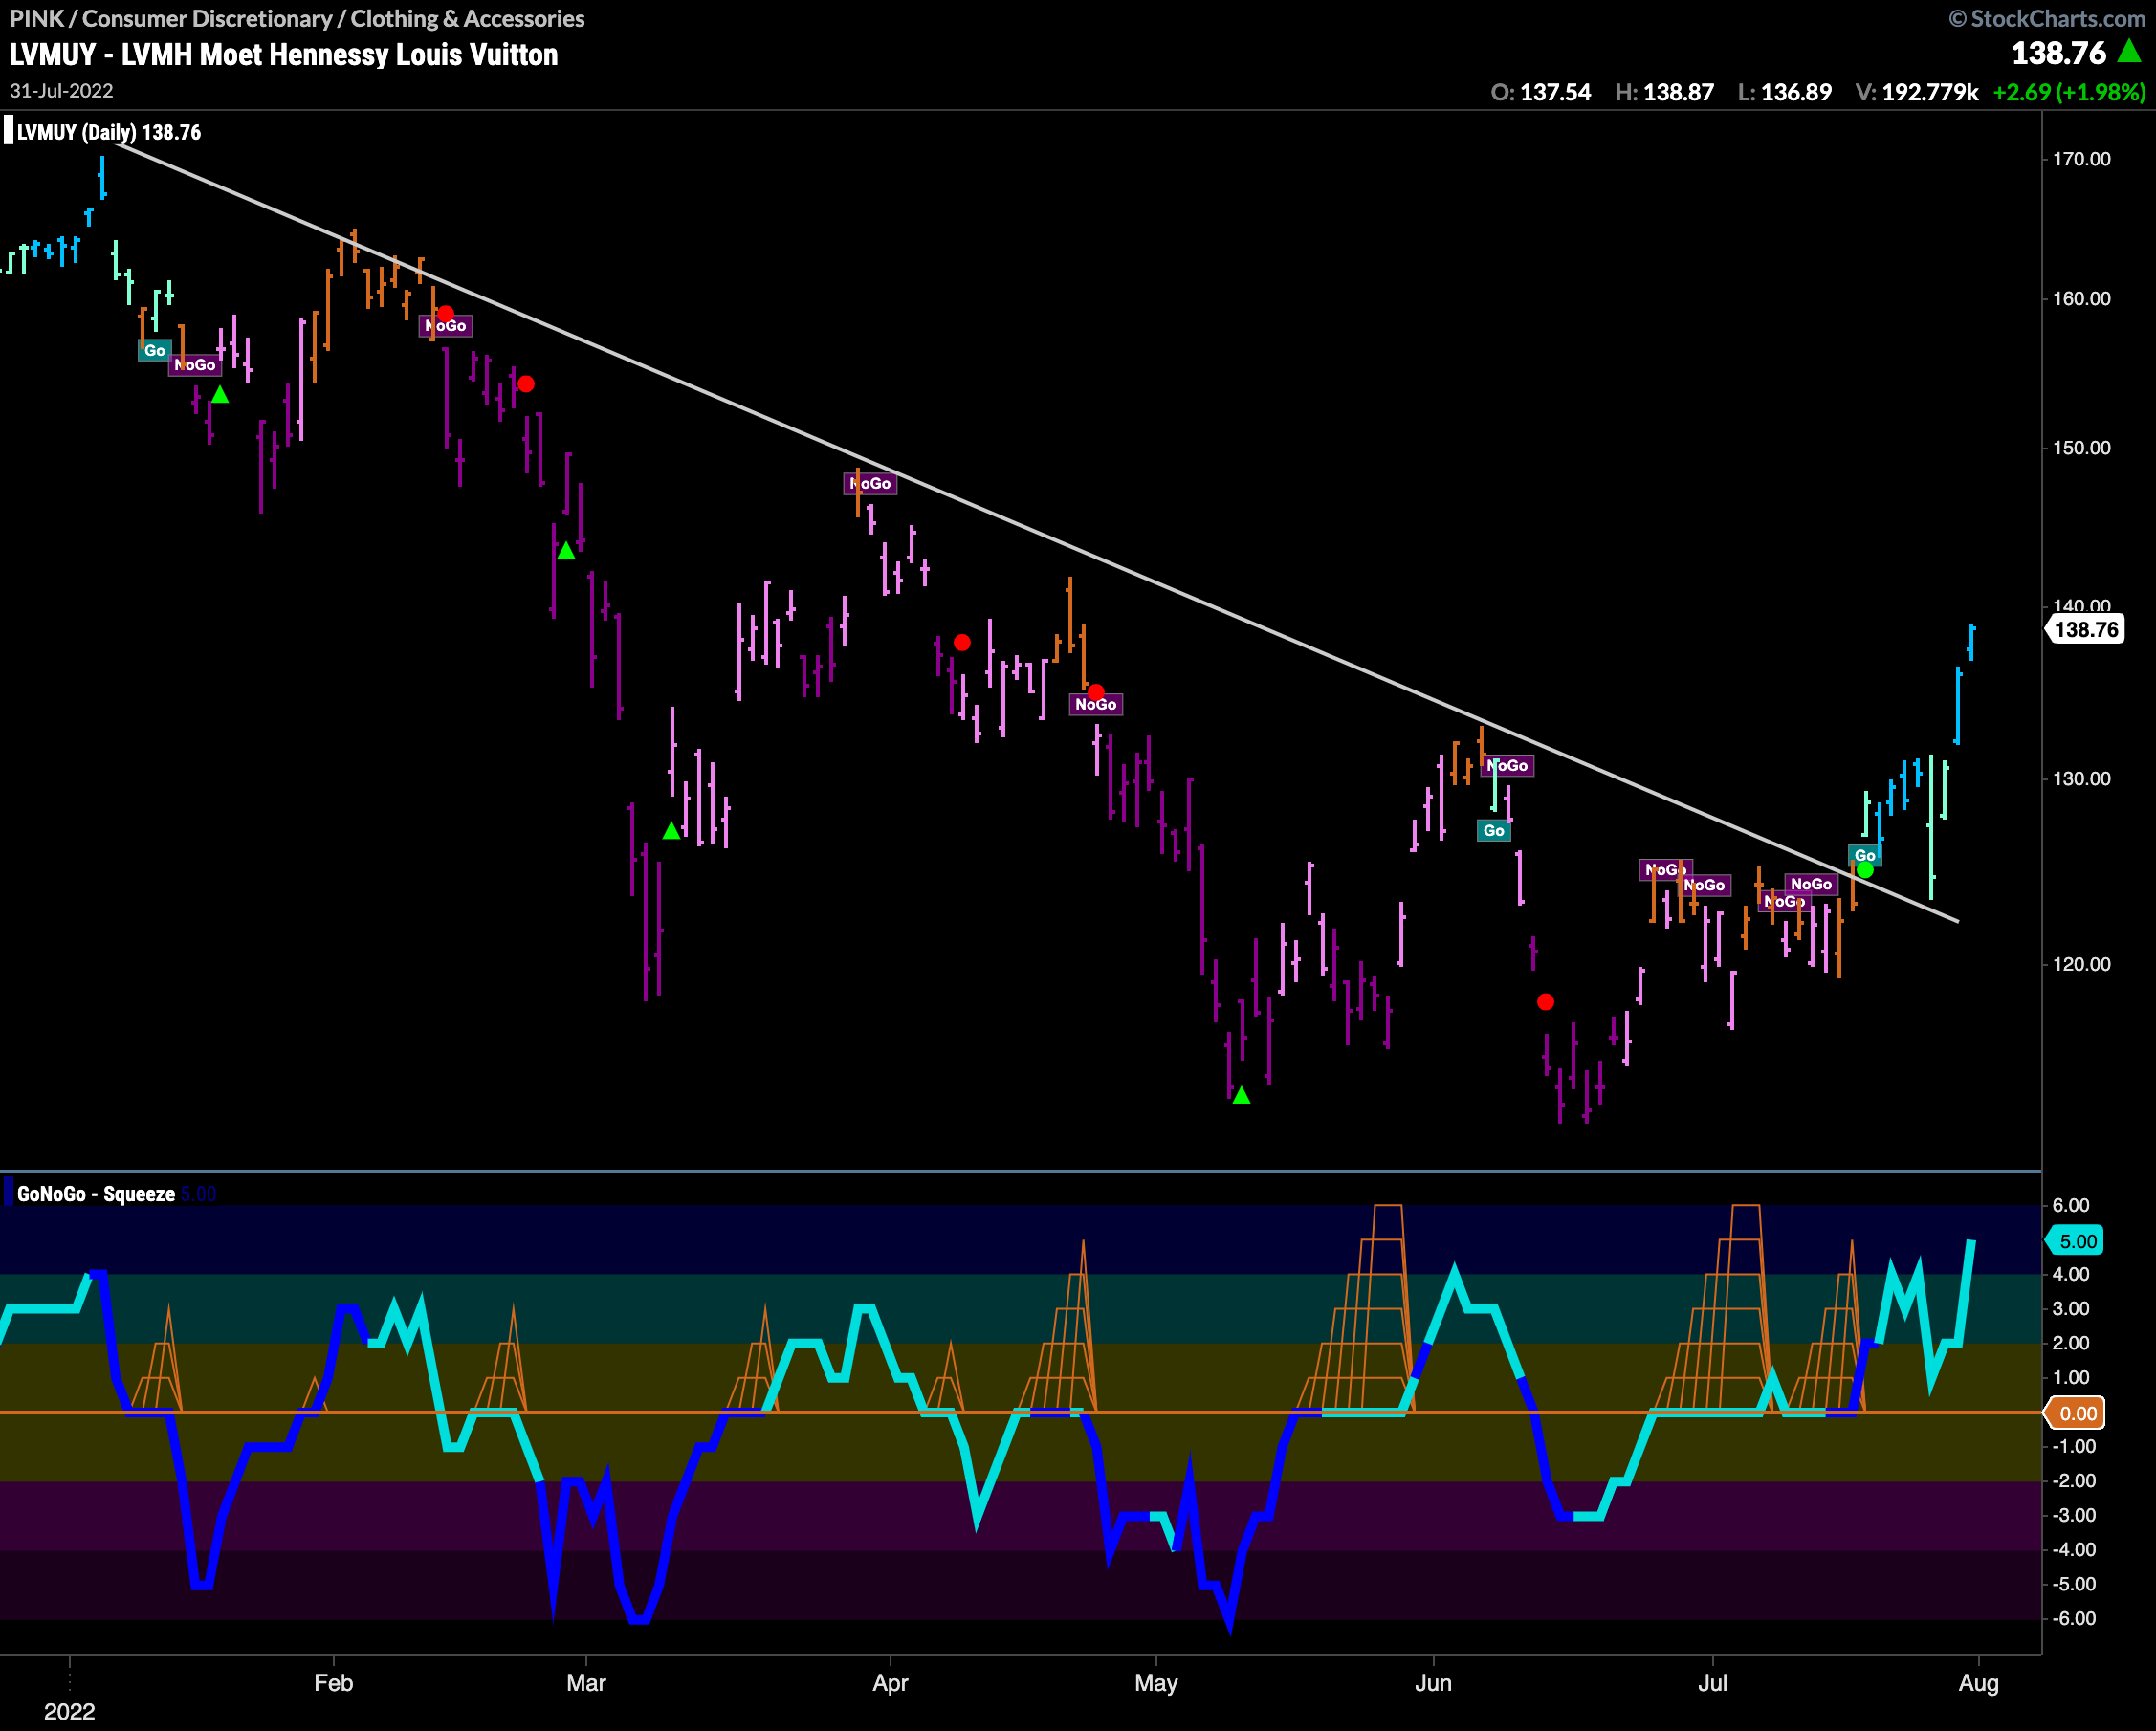
When we looked at the GoNoGo Sector Relmap at the outset of this note, we saw that it was growth sectors leading the rally in U.S. equities. With a bit of relief from rising rates and falling gasoline prices, investors are encouraged to spend this summer. The consumer discretionary sector was shown to be an out-performer in a relative “Go” trend to the S&P. With the dollar still strong if a trip to Europe is on the cards this summer we could check out the chart below of $LVMUY. The GoNoGo Trend shows a strong “Go” this week as prices climbed on blue bars having retested the support provided by the downward sloping trend line. An investor could move to a shorter time and look to buy dips.
