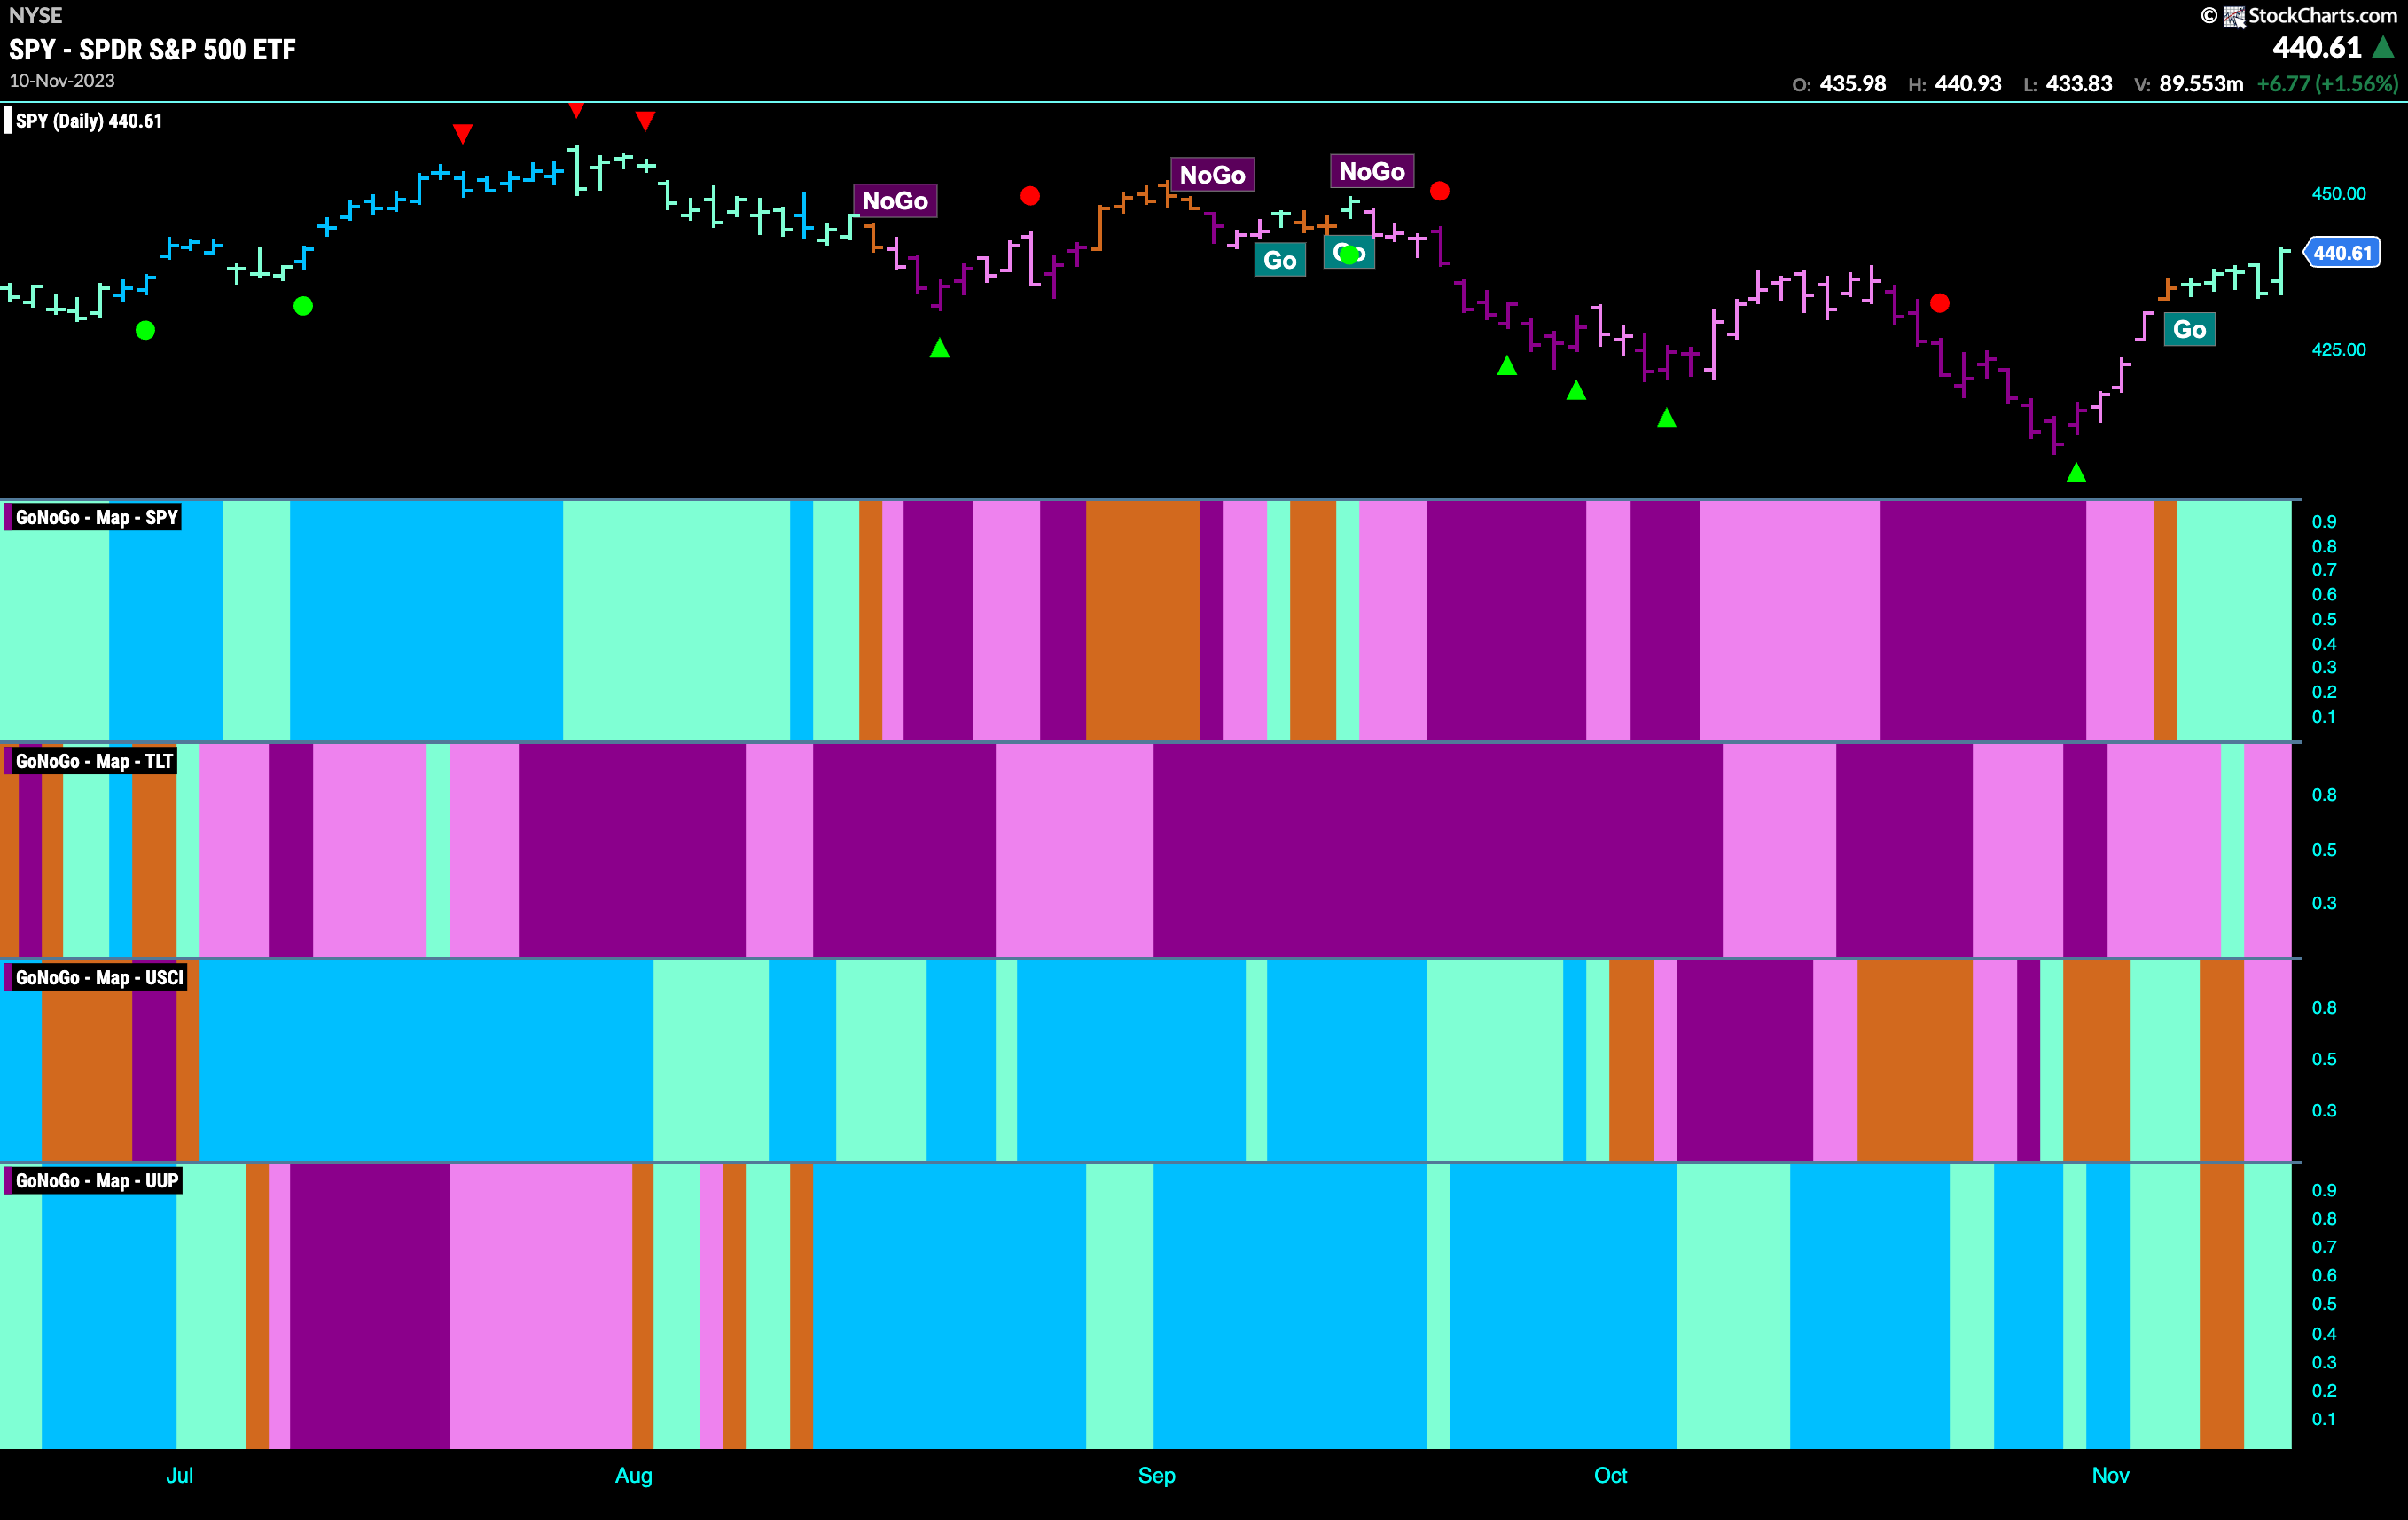
Good morning and welcome to this week’s Flight Path. The strength in equities continued last week and the amber “Go Fish” bar gave way to a string of aqua “Go” bars. Treasury bond prices also flashed strength and an aqua “Go” bar but ended the week painting pink “NoGo” bars again. Commodities continue to chop around, with a couple of “NoGo” pink bars after a “Go Fish” bar showed us the market was still uncertain about future direction on Wednesday. The dollar returned to paint an aqua “Go” bar as the week came to a close as well after flirting with uncertainty and “Go Fish” bars earlier in the week.
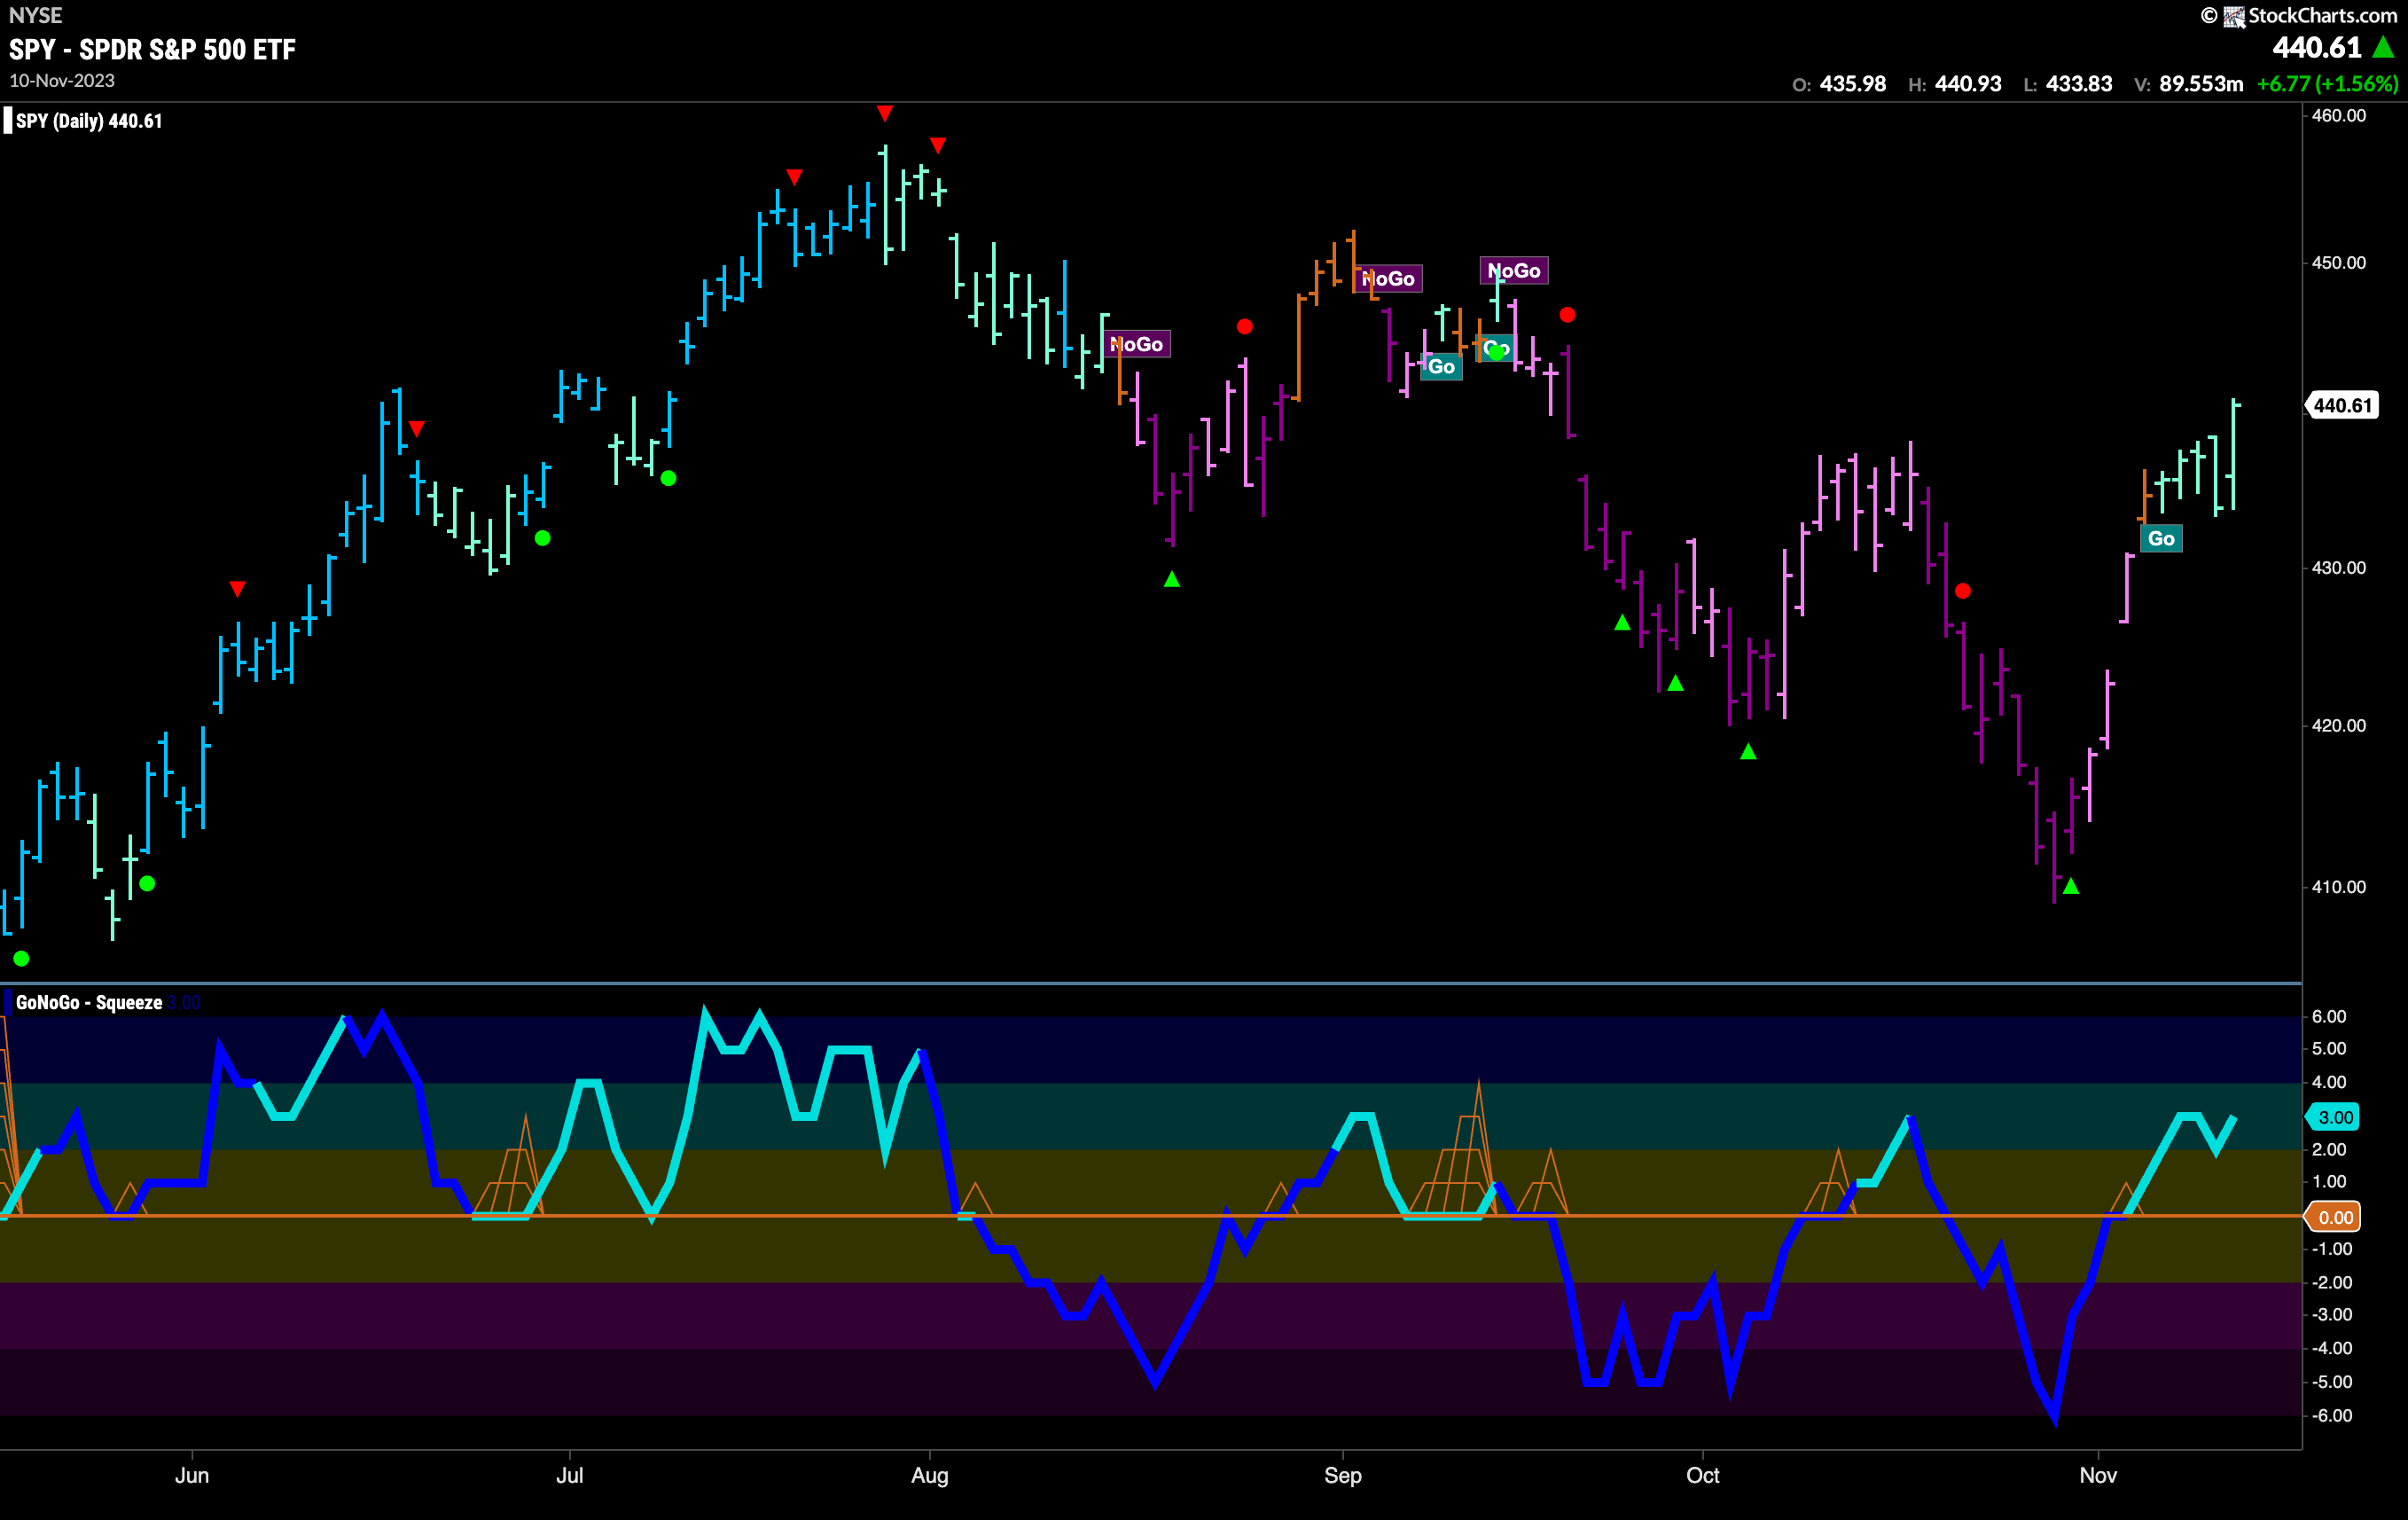
“Go” bars for U.S. Equities
Prices consolidated the strength from the week before as GoNoGo Trend painted a string of aqua “Go” bars. This pushed prices above the October highs. We will watch to see if these prices can hold this week. GoNoGo Oscillator is back in positive territory which tells us that momentum is on the side of the new “Go” trend. It is not yet overbought and volume is light.
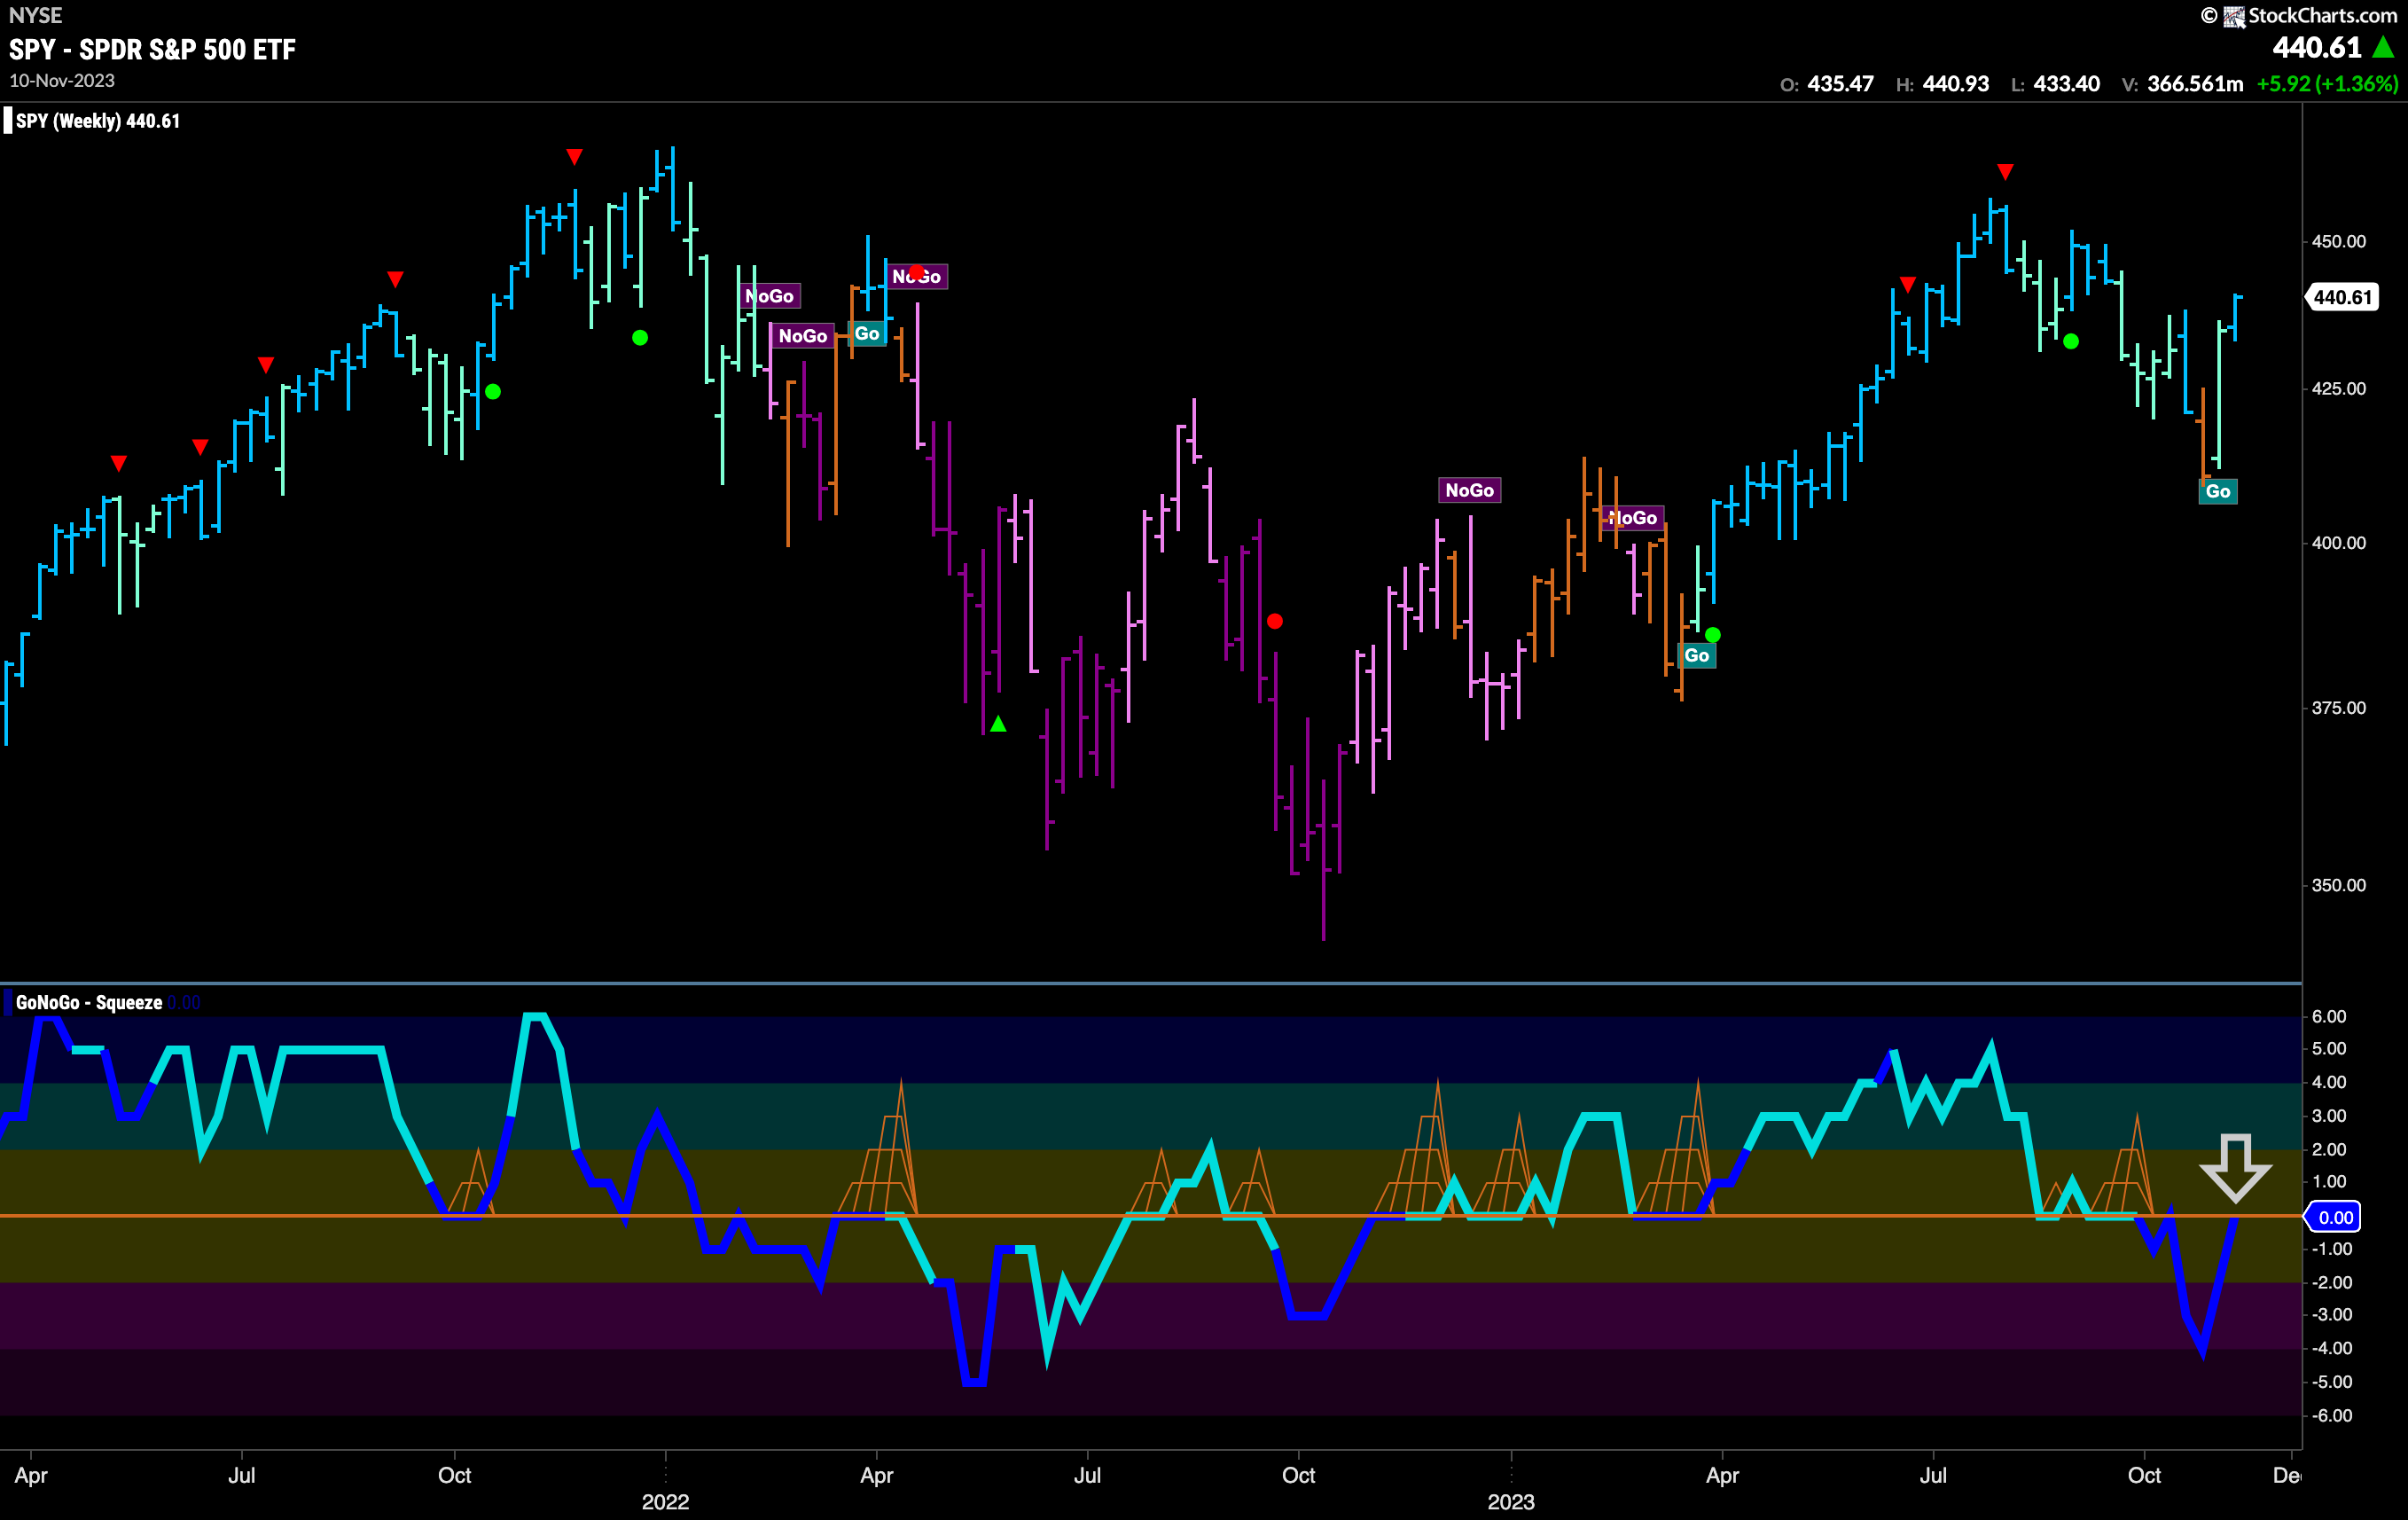
The longer term weekly chart shows a return to strong blue “Go” bars last week. After the amber “Go Fish” bar two weeks ago we have seen a strong rally on the weekly chart. One could argue that we are looking at a longer term higher low here and some support at that level going forward. GoNoGo Oscillator has risen sharply to test the zero line from below and volume is heavy. There has been strong market participation on the recent rally in prices. Now, the oscillator is testing the zero line from below where it will be important to see whether it can regain positive territory or gets rejected. For further price gains it would help if GoNoGo Oscillator could break back above zero.
Treasury Rates Enter “NoGo” Trend
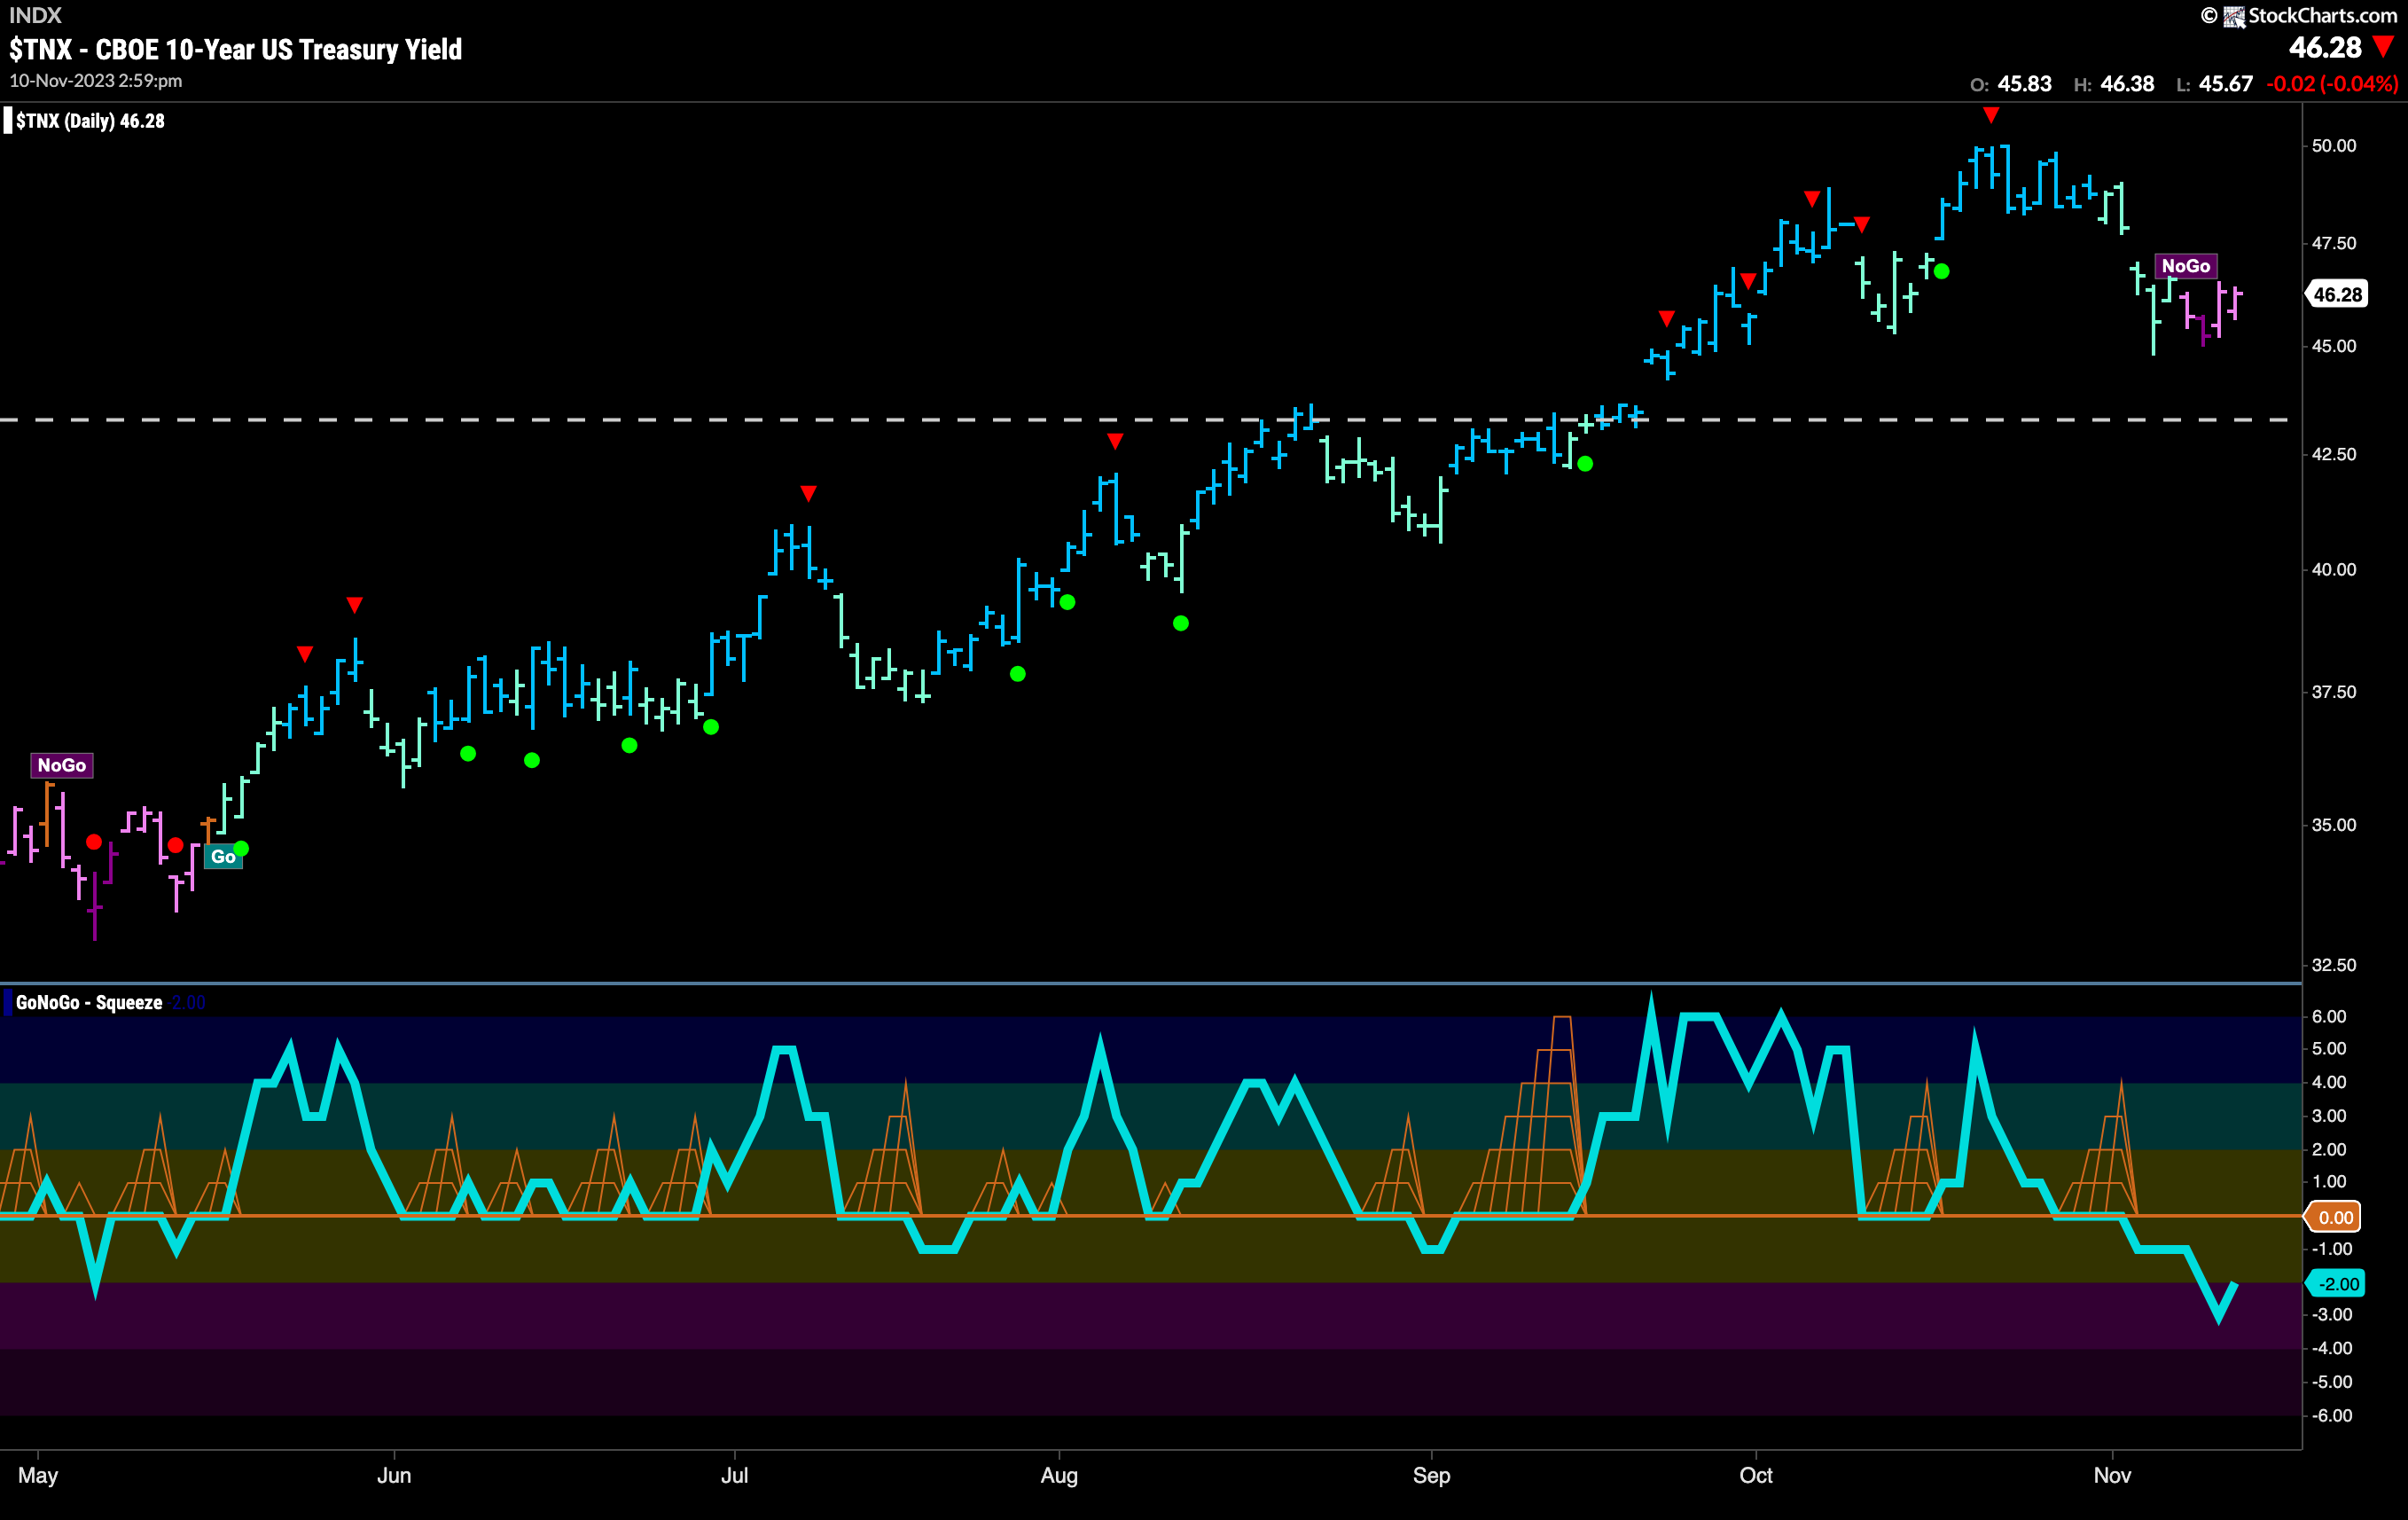
Providing relief for equities, treasury rates fell into a “NoGo” trend this week. Having retreated from the Go Countertrend Correction Icon (red arrow) to paint weaker aqua bars for a period, the indicator recognized a “NoGo” trend at the beginning of the week. We are seeing support on the chart, first from the prior low and then from the horizontal level that comes from the larger time frame weekly chart. GoNoGo Oscillator broke below the zero line ahead of the change in trend in the price panel above, warning us that the trend was in some trouble. Now, GoNoGo Oscillator is in negative territory but not oversold, confirming the “NoGo” trend in price.
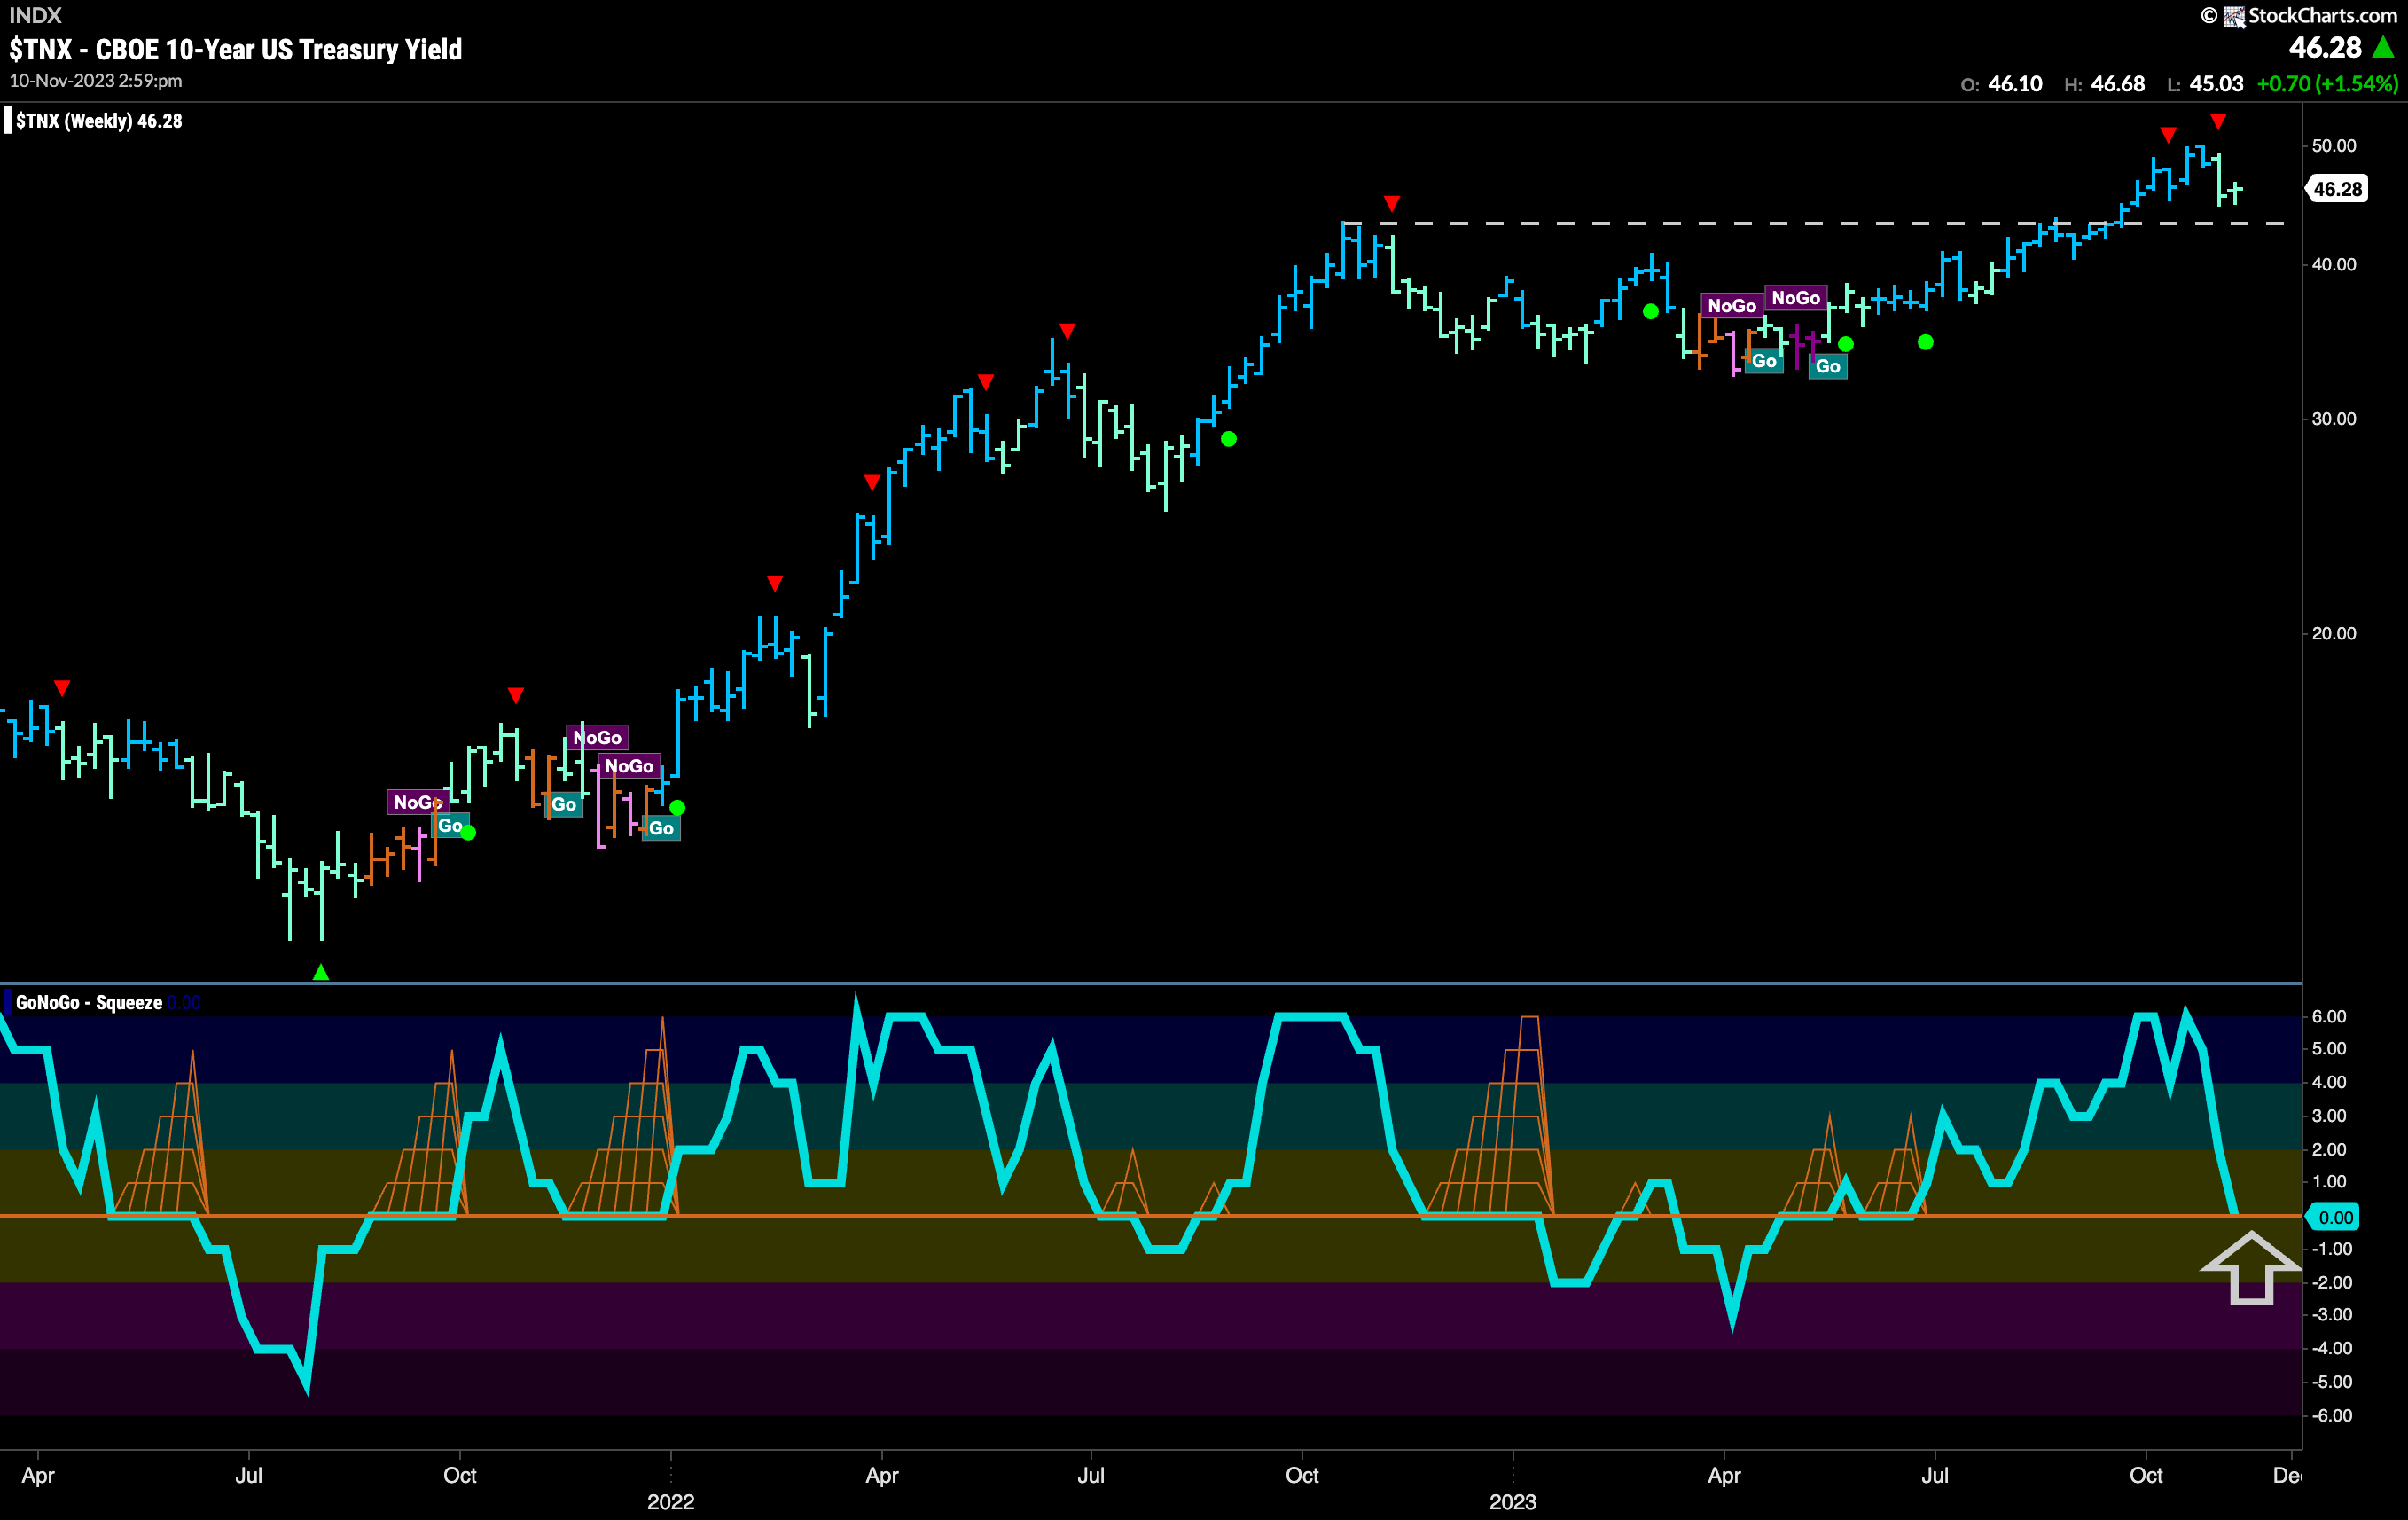
The larger timeframe chart shows us that we are at a critical inflection point for treasury rates. The “Go” trend remains in place but is painting a second weaker aqua bar and is approaching what should be support from last year’s October high. We turn our eye to the oscillator panel and see that GoNoGo Oscillator has crashed to the test the zero line from above. For this “Go” trend to remain in place and attempt higher highs, we would need to see the oscillator find support here.
Dollar Struggles but Regains “Go” Trend
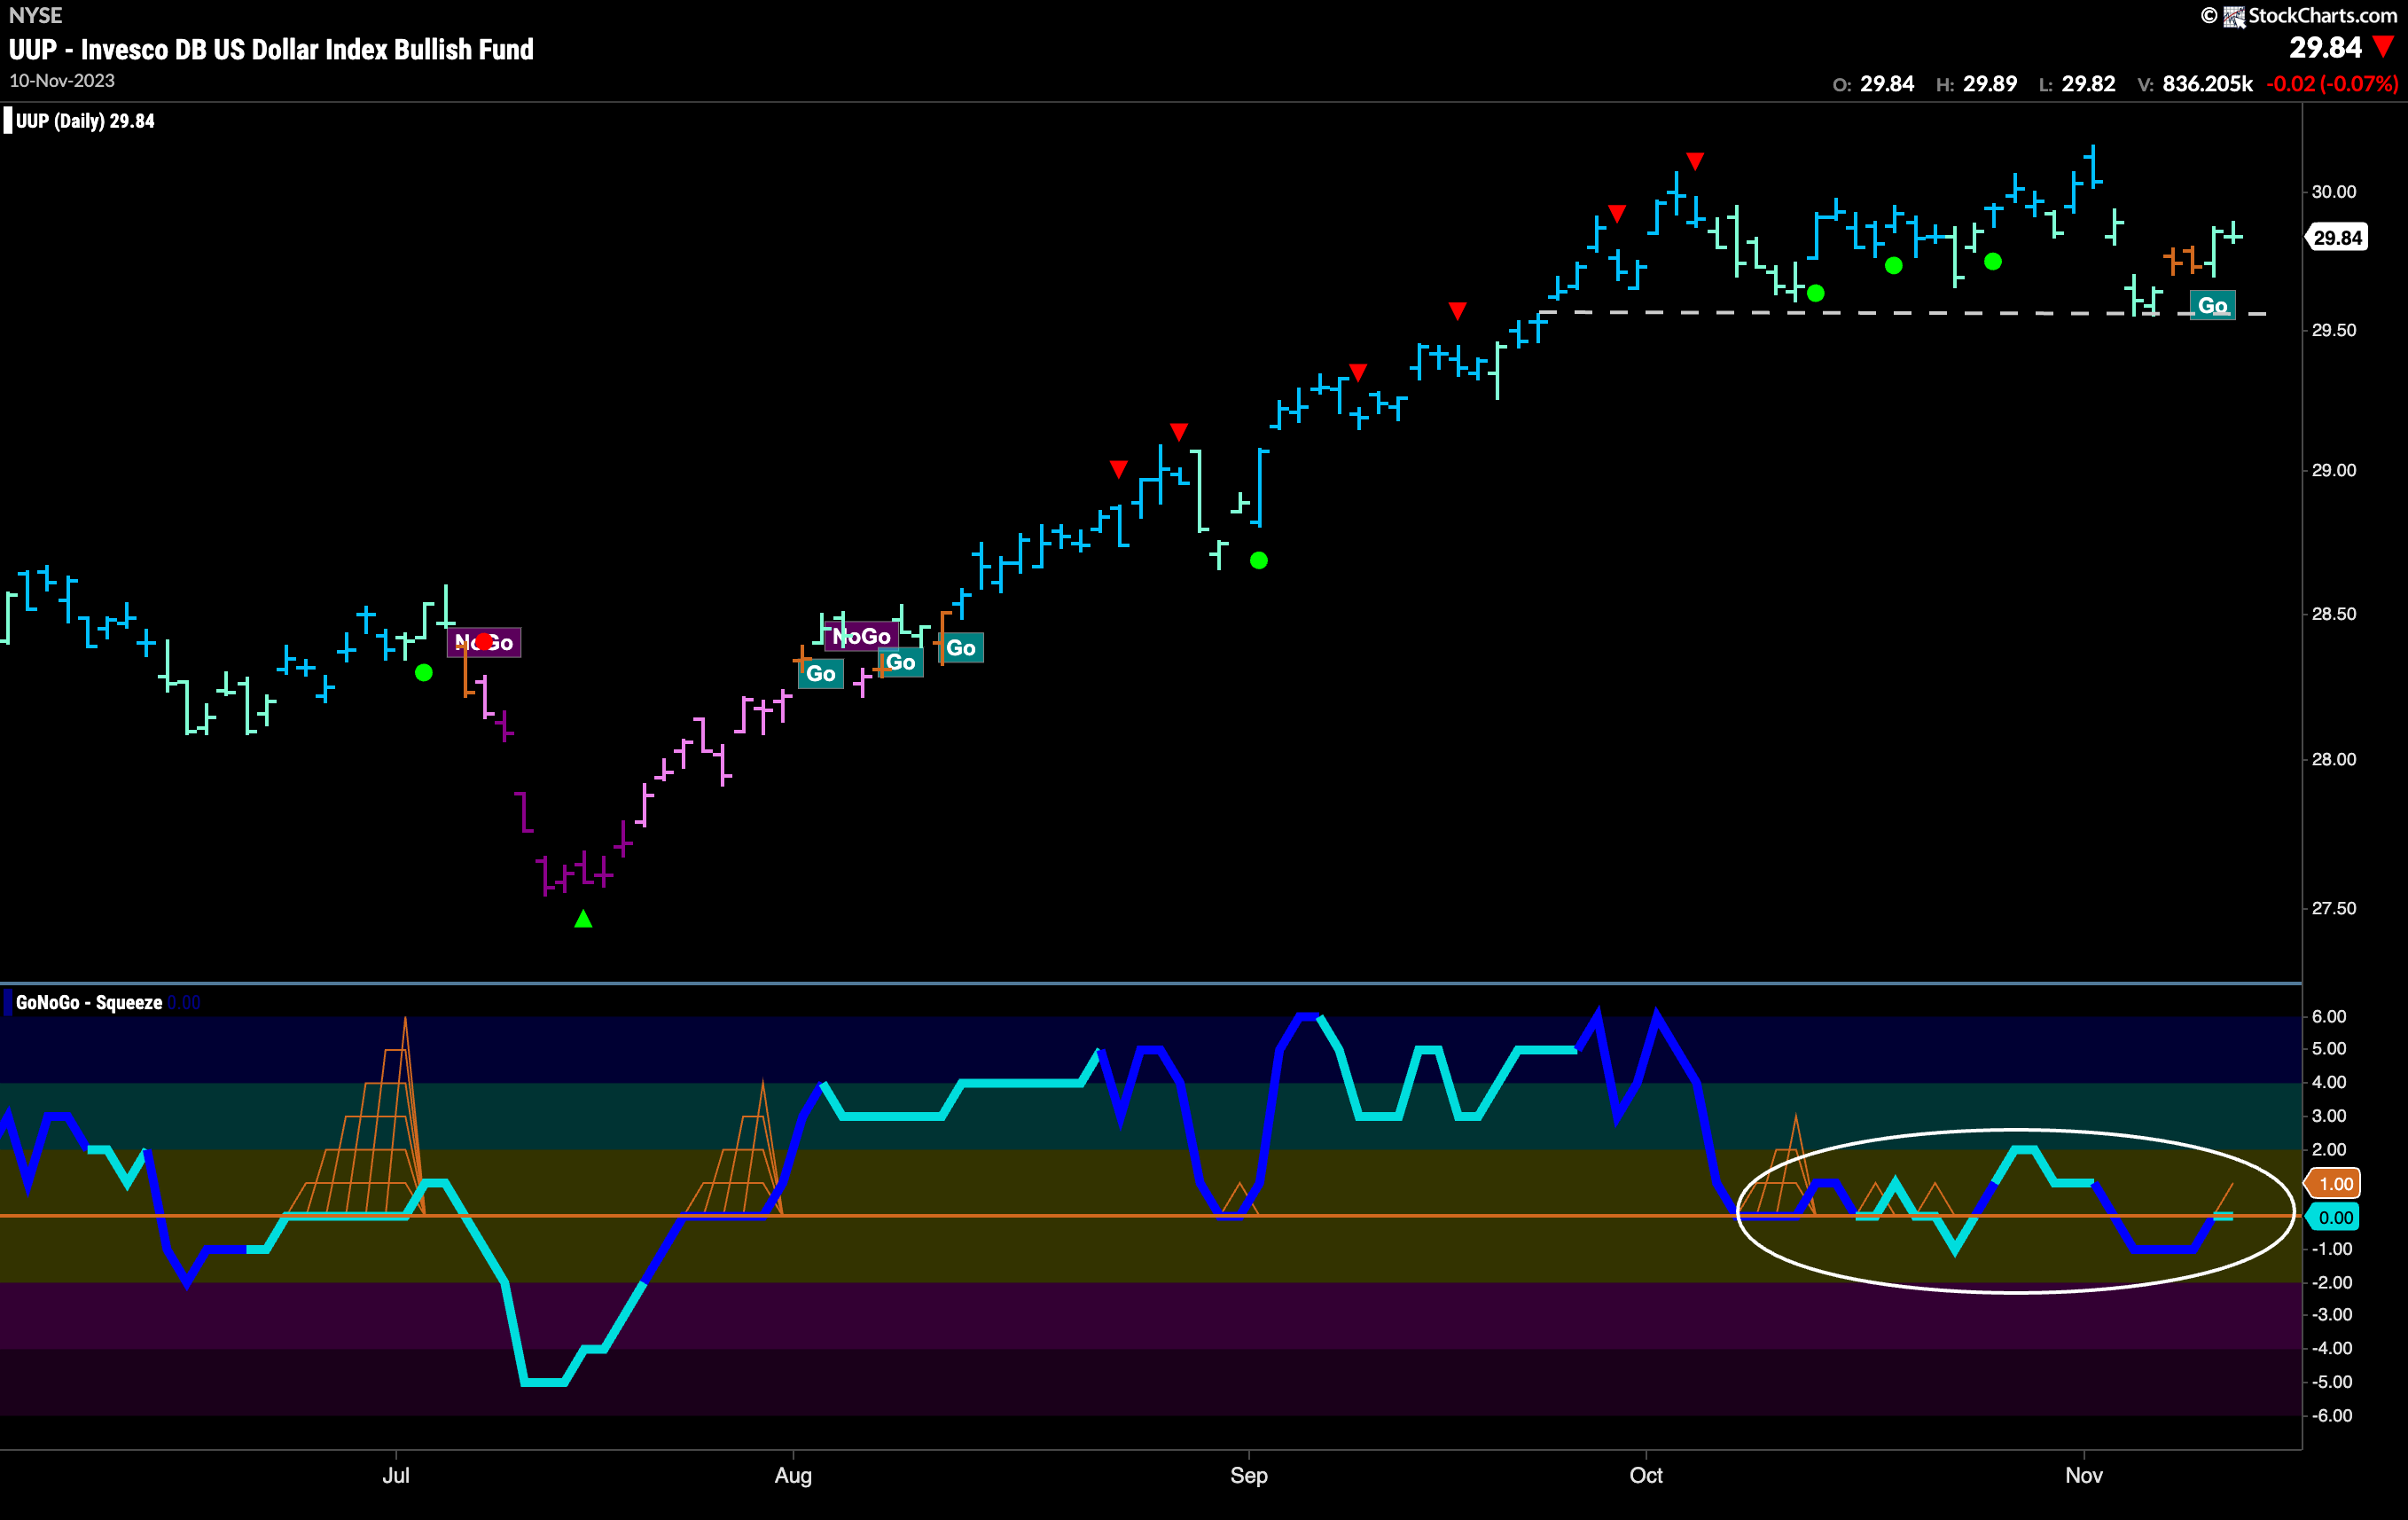
The dollar saw GoNoGo Trend paint a couple of amber “Go Fish” bars this past week. This told us that there was some uncertainty in the markets as not enough criteria were being met for GoNoGo Trend to identify a trend in either direction. However, some strength returned as the week came to a close and GoNoGo Trend was able to repaint aqua “Go” bars. If we look at the oscillator panel we see that for several weeks now it has struggled to clearly break away from the zero line in either direction. This will be important. When the GoNoGo Oscillator finds direction it will help determine price’s next move.
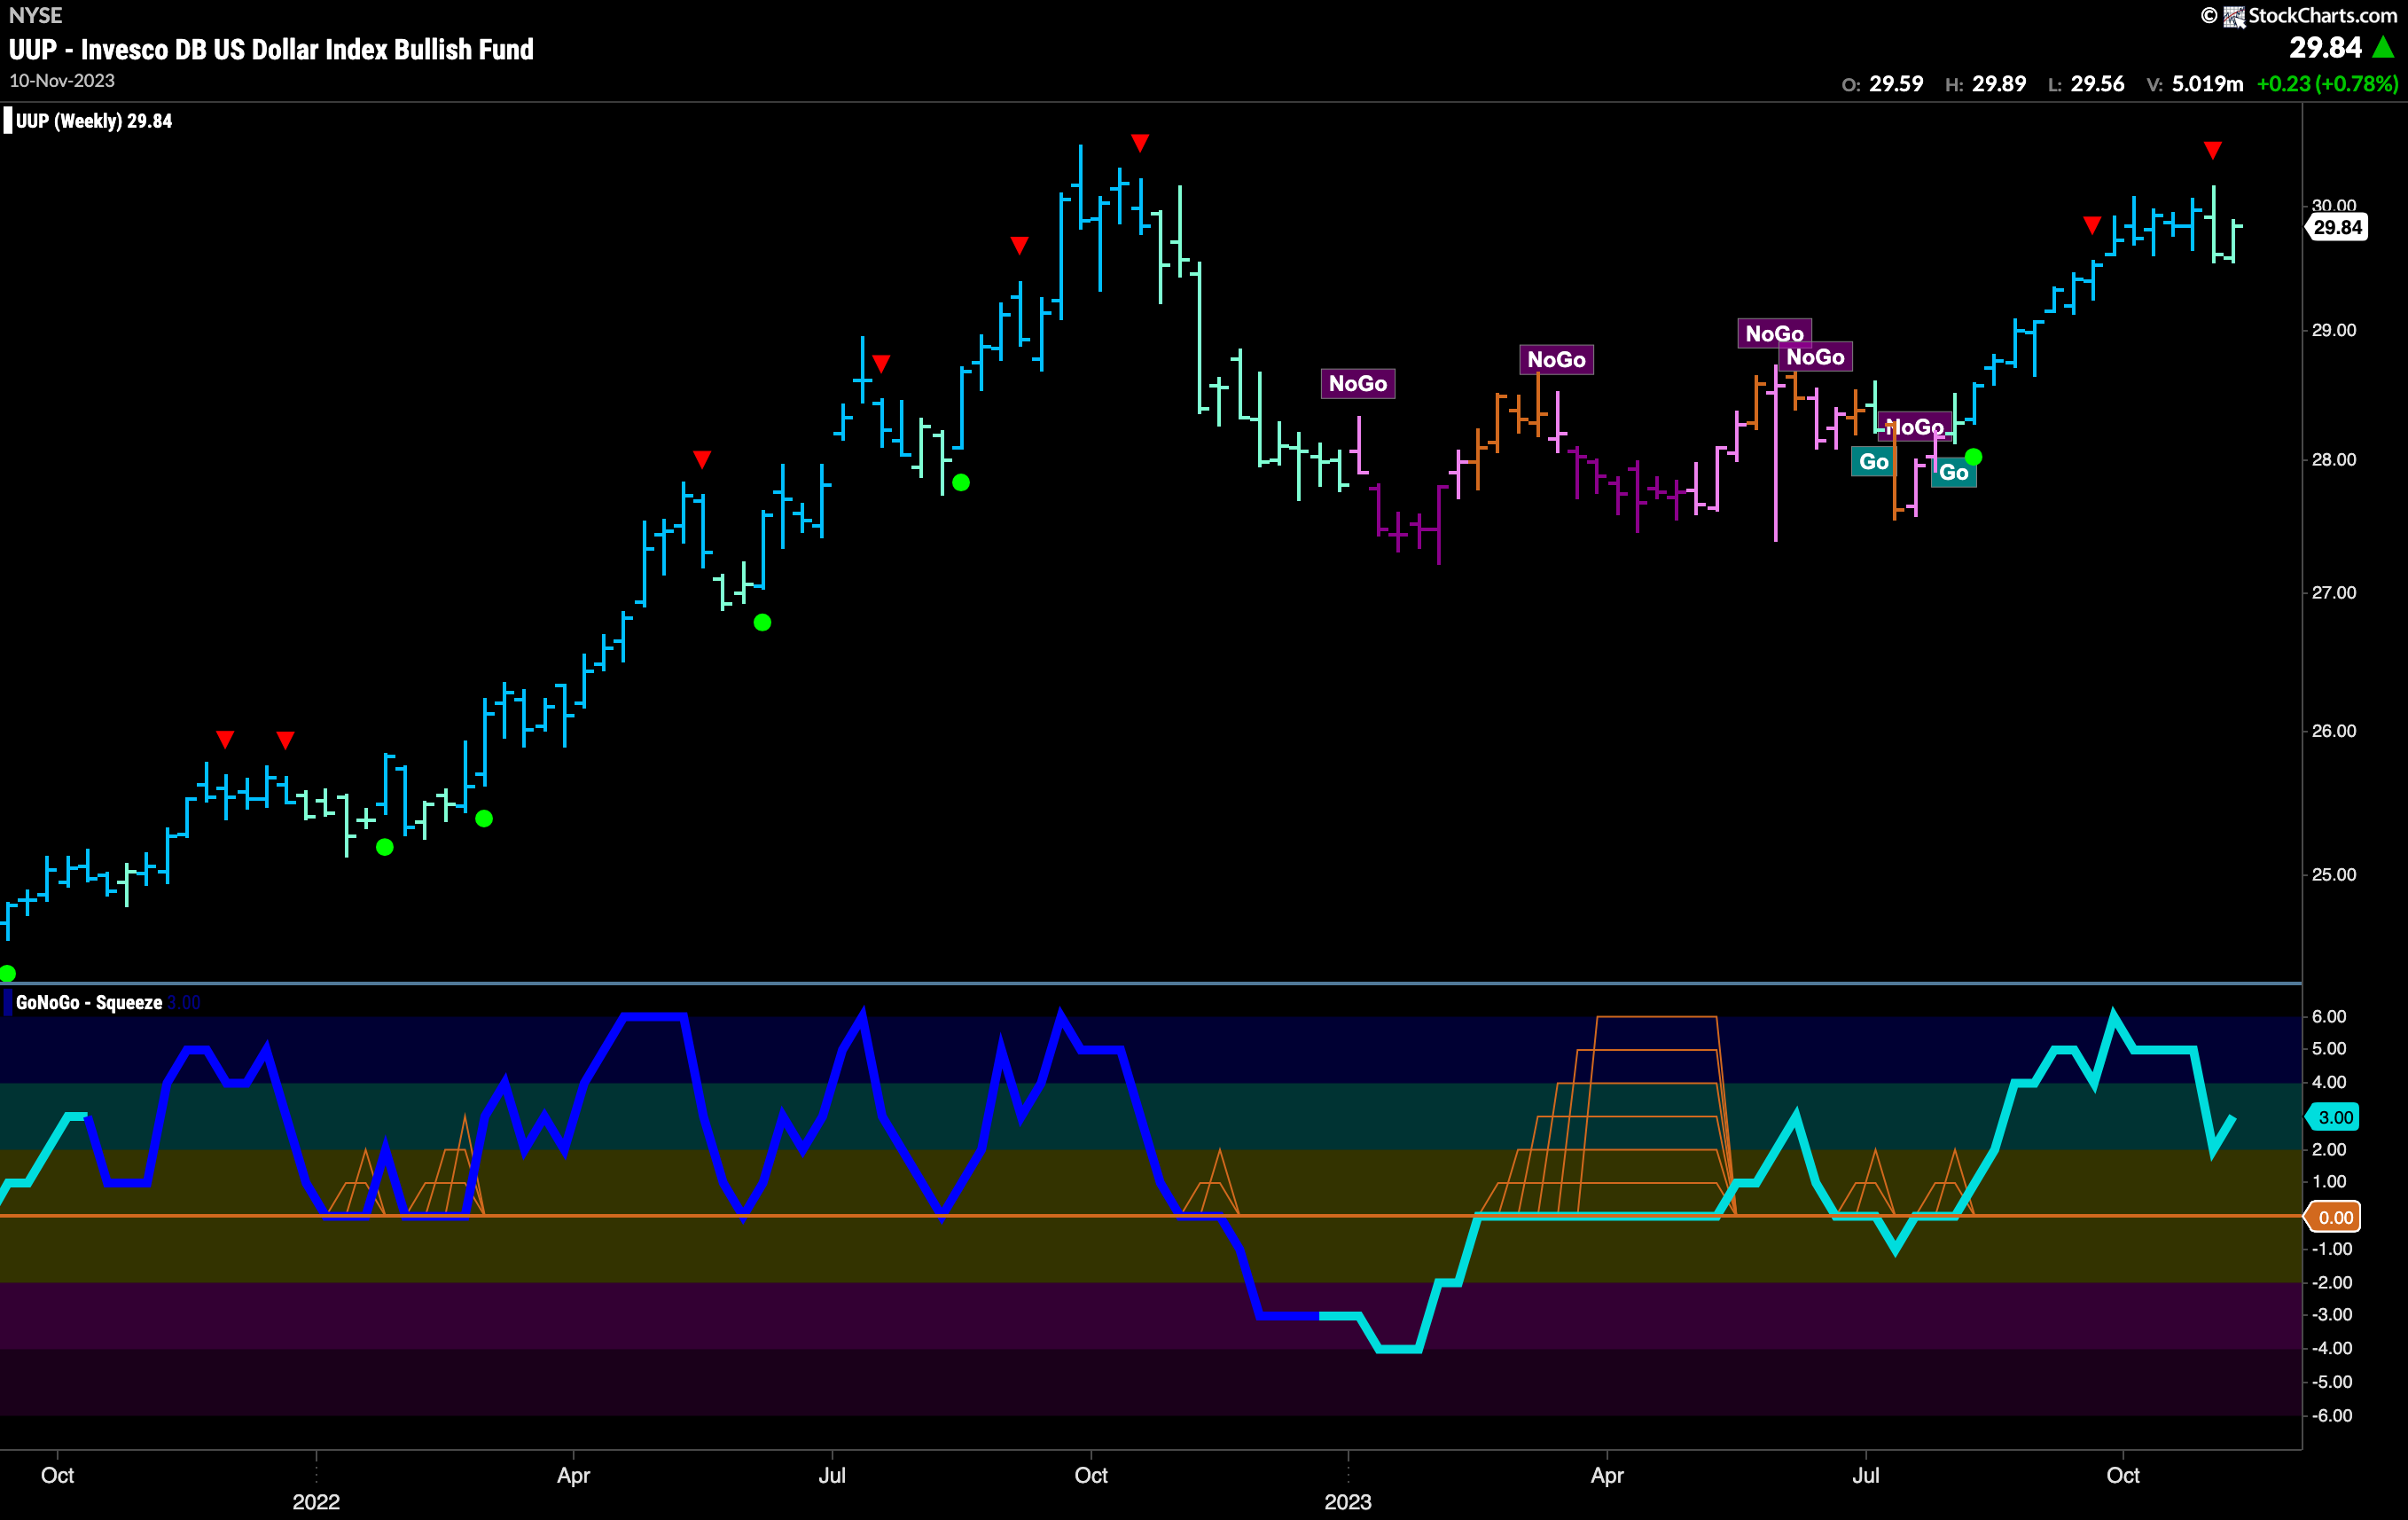
The weekly chart shows the “Go” trend remains in place. GoNoGo Oscillator is in positive territory and GoNoGo Trend is painting weaker aqua bars after the most recent Go Countertrend Correction Icon. GoNoGo Oscillator is in positive territory but no longer overbought. We will watch to see if price can make another attack on last October’s highs.
Oil Saw “NoGo” Strengthen
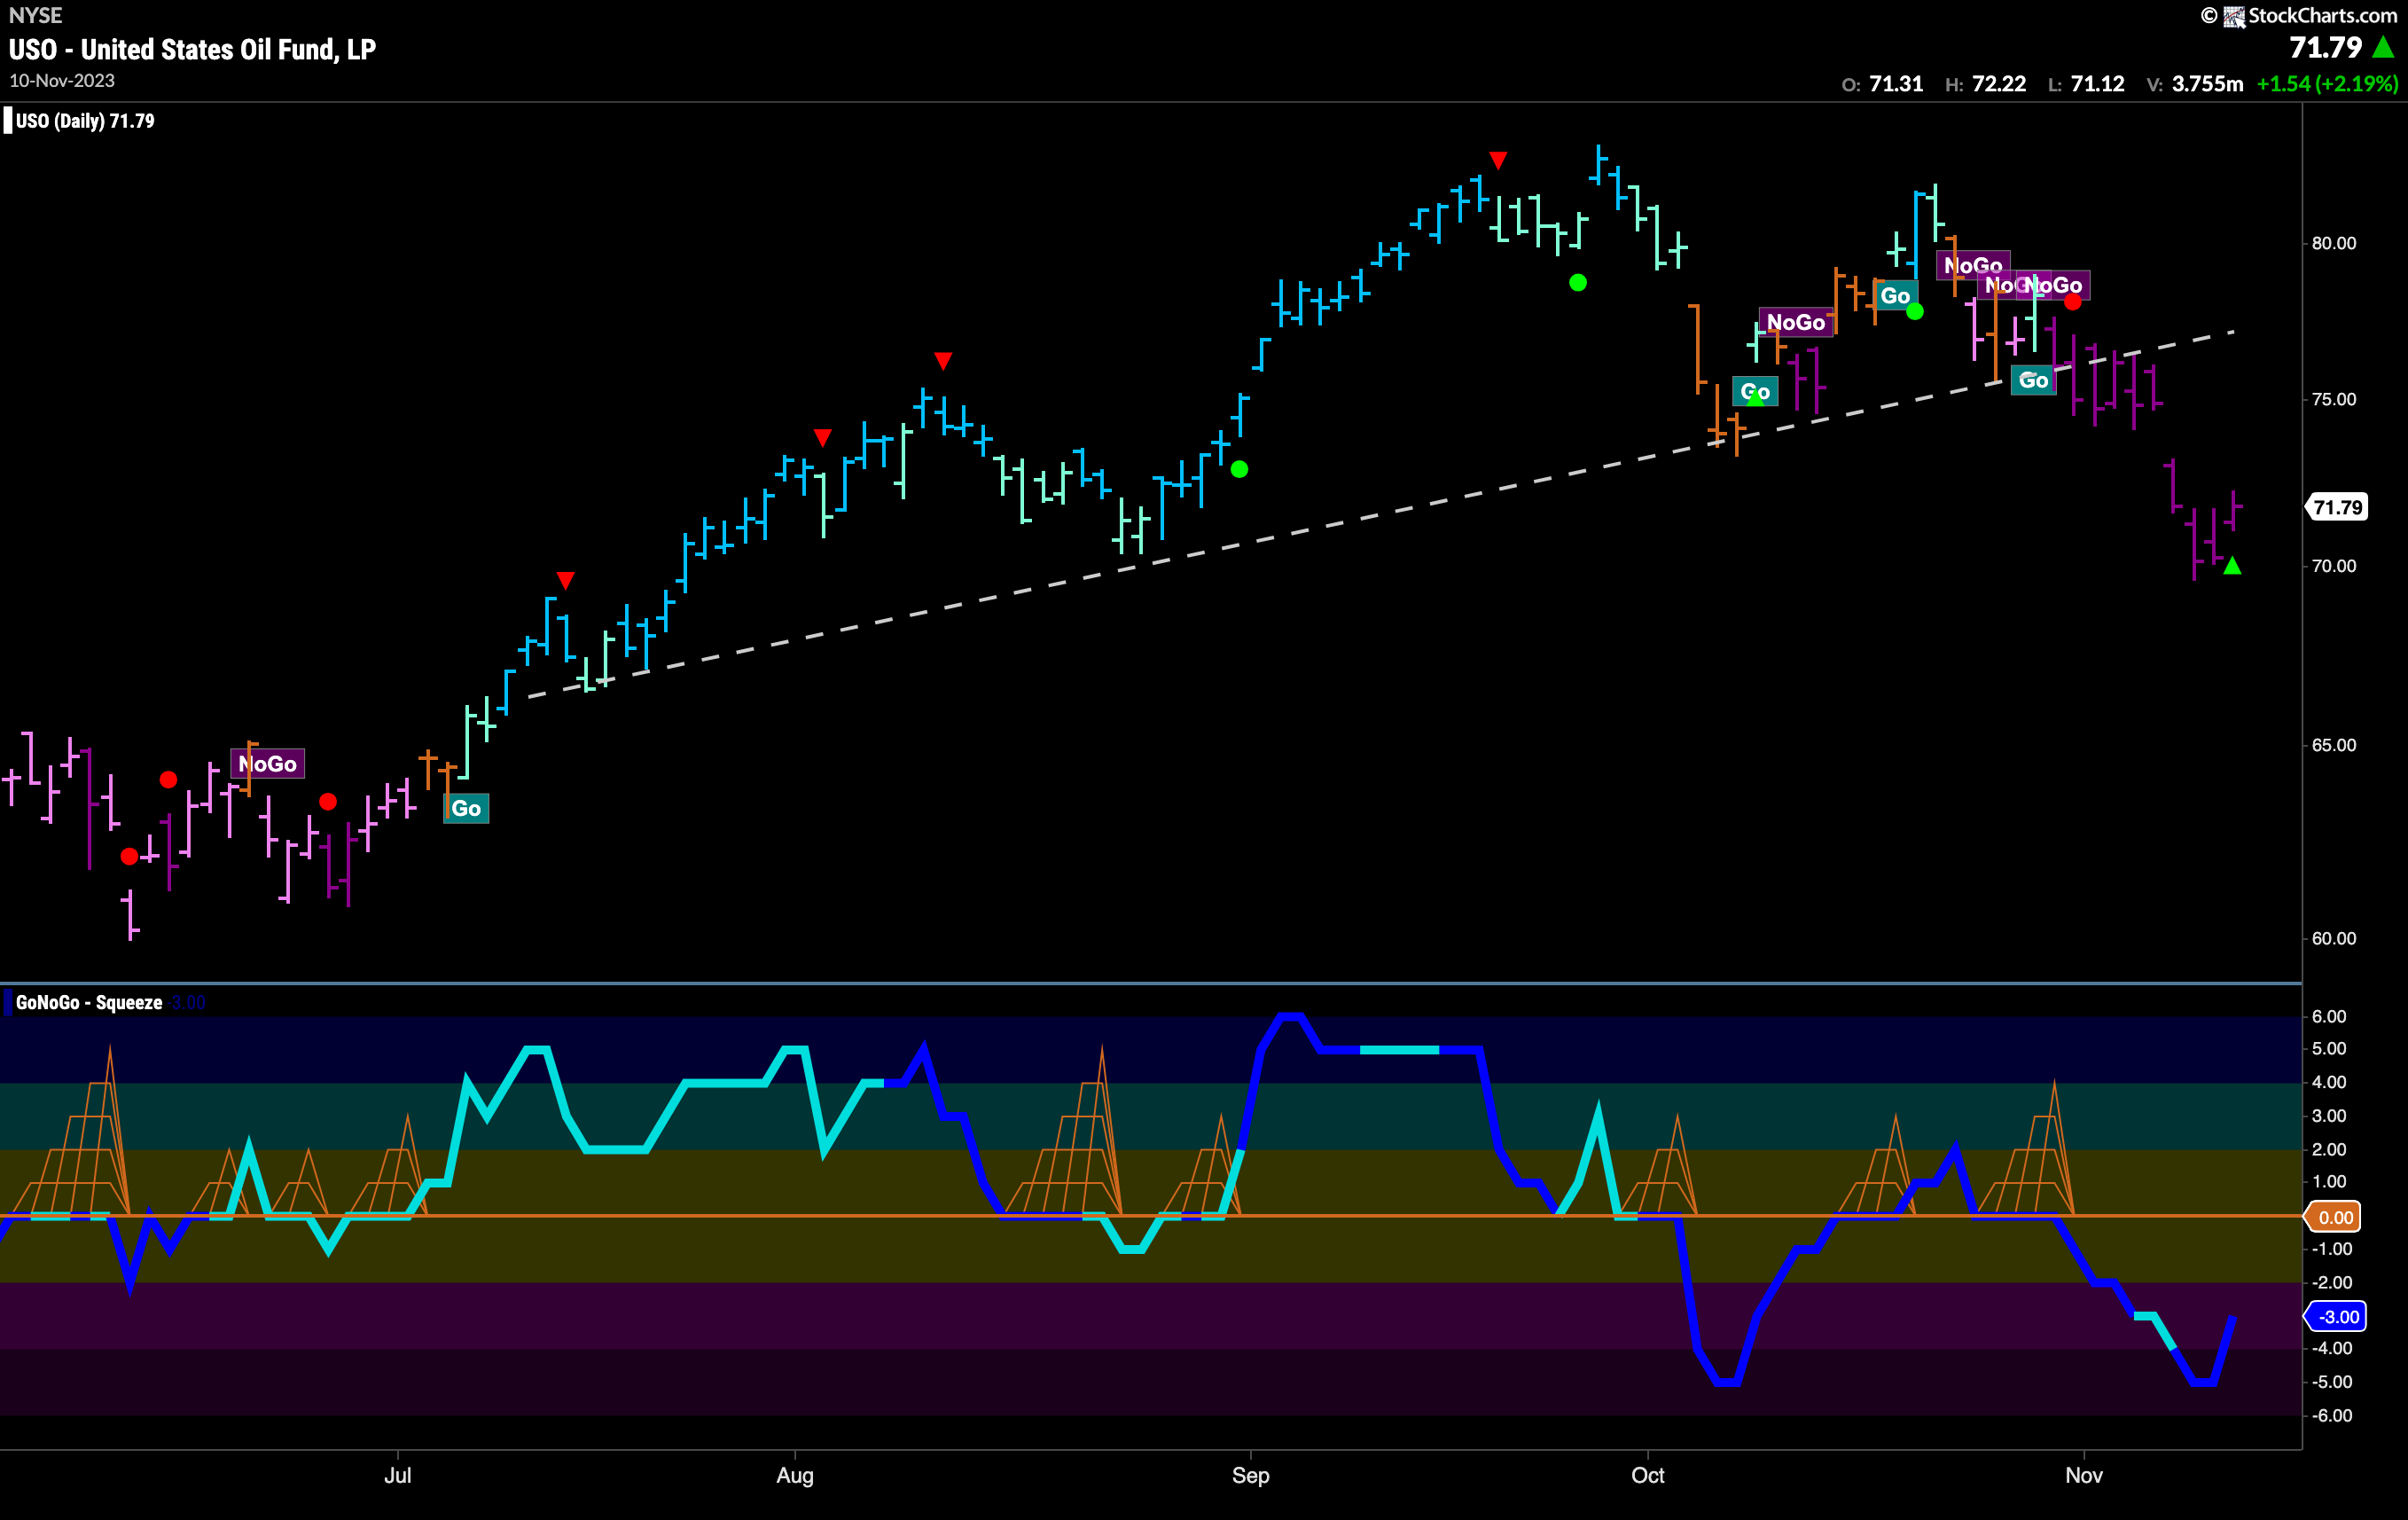
Oil continued in the direction it started last week. A string of unbroken strong purple “NoGo” bars were painted by GoNoGo Trend. We also saw prices gap lower as they fell through midweek. GoNoGo Oscillator is in negative territory but no longer oversold. Volume has been generally heavy throughout this move lower confirming the strength of the “NoGo” trend.
Momentum Dries up as Gold Tries to Hold “Go” Trend
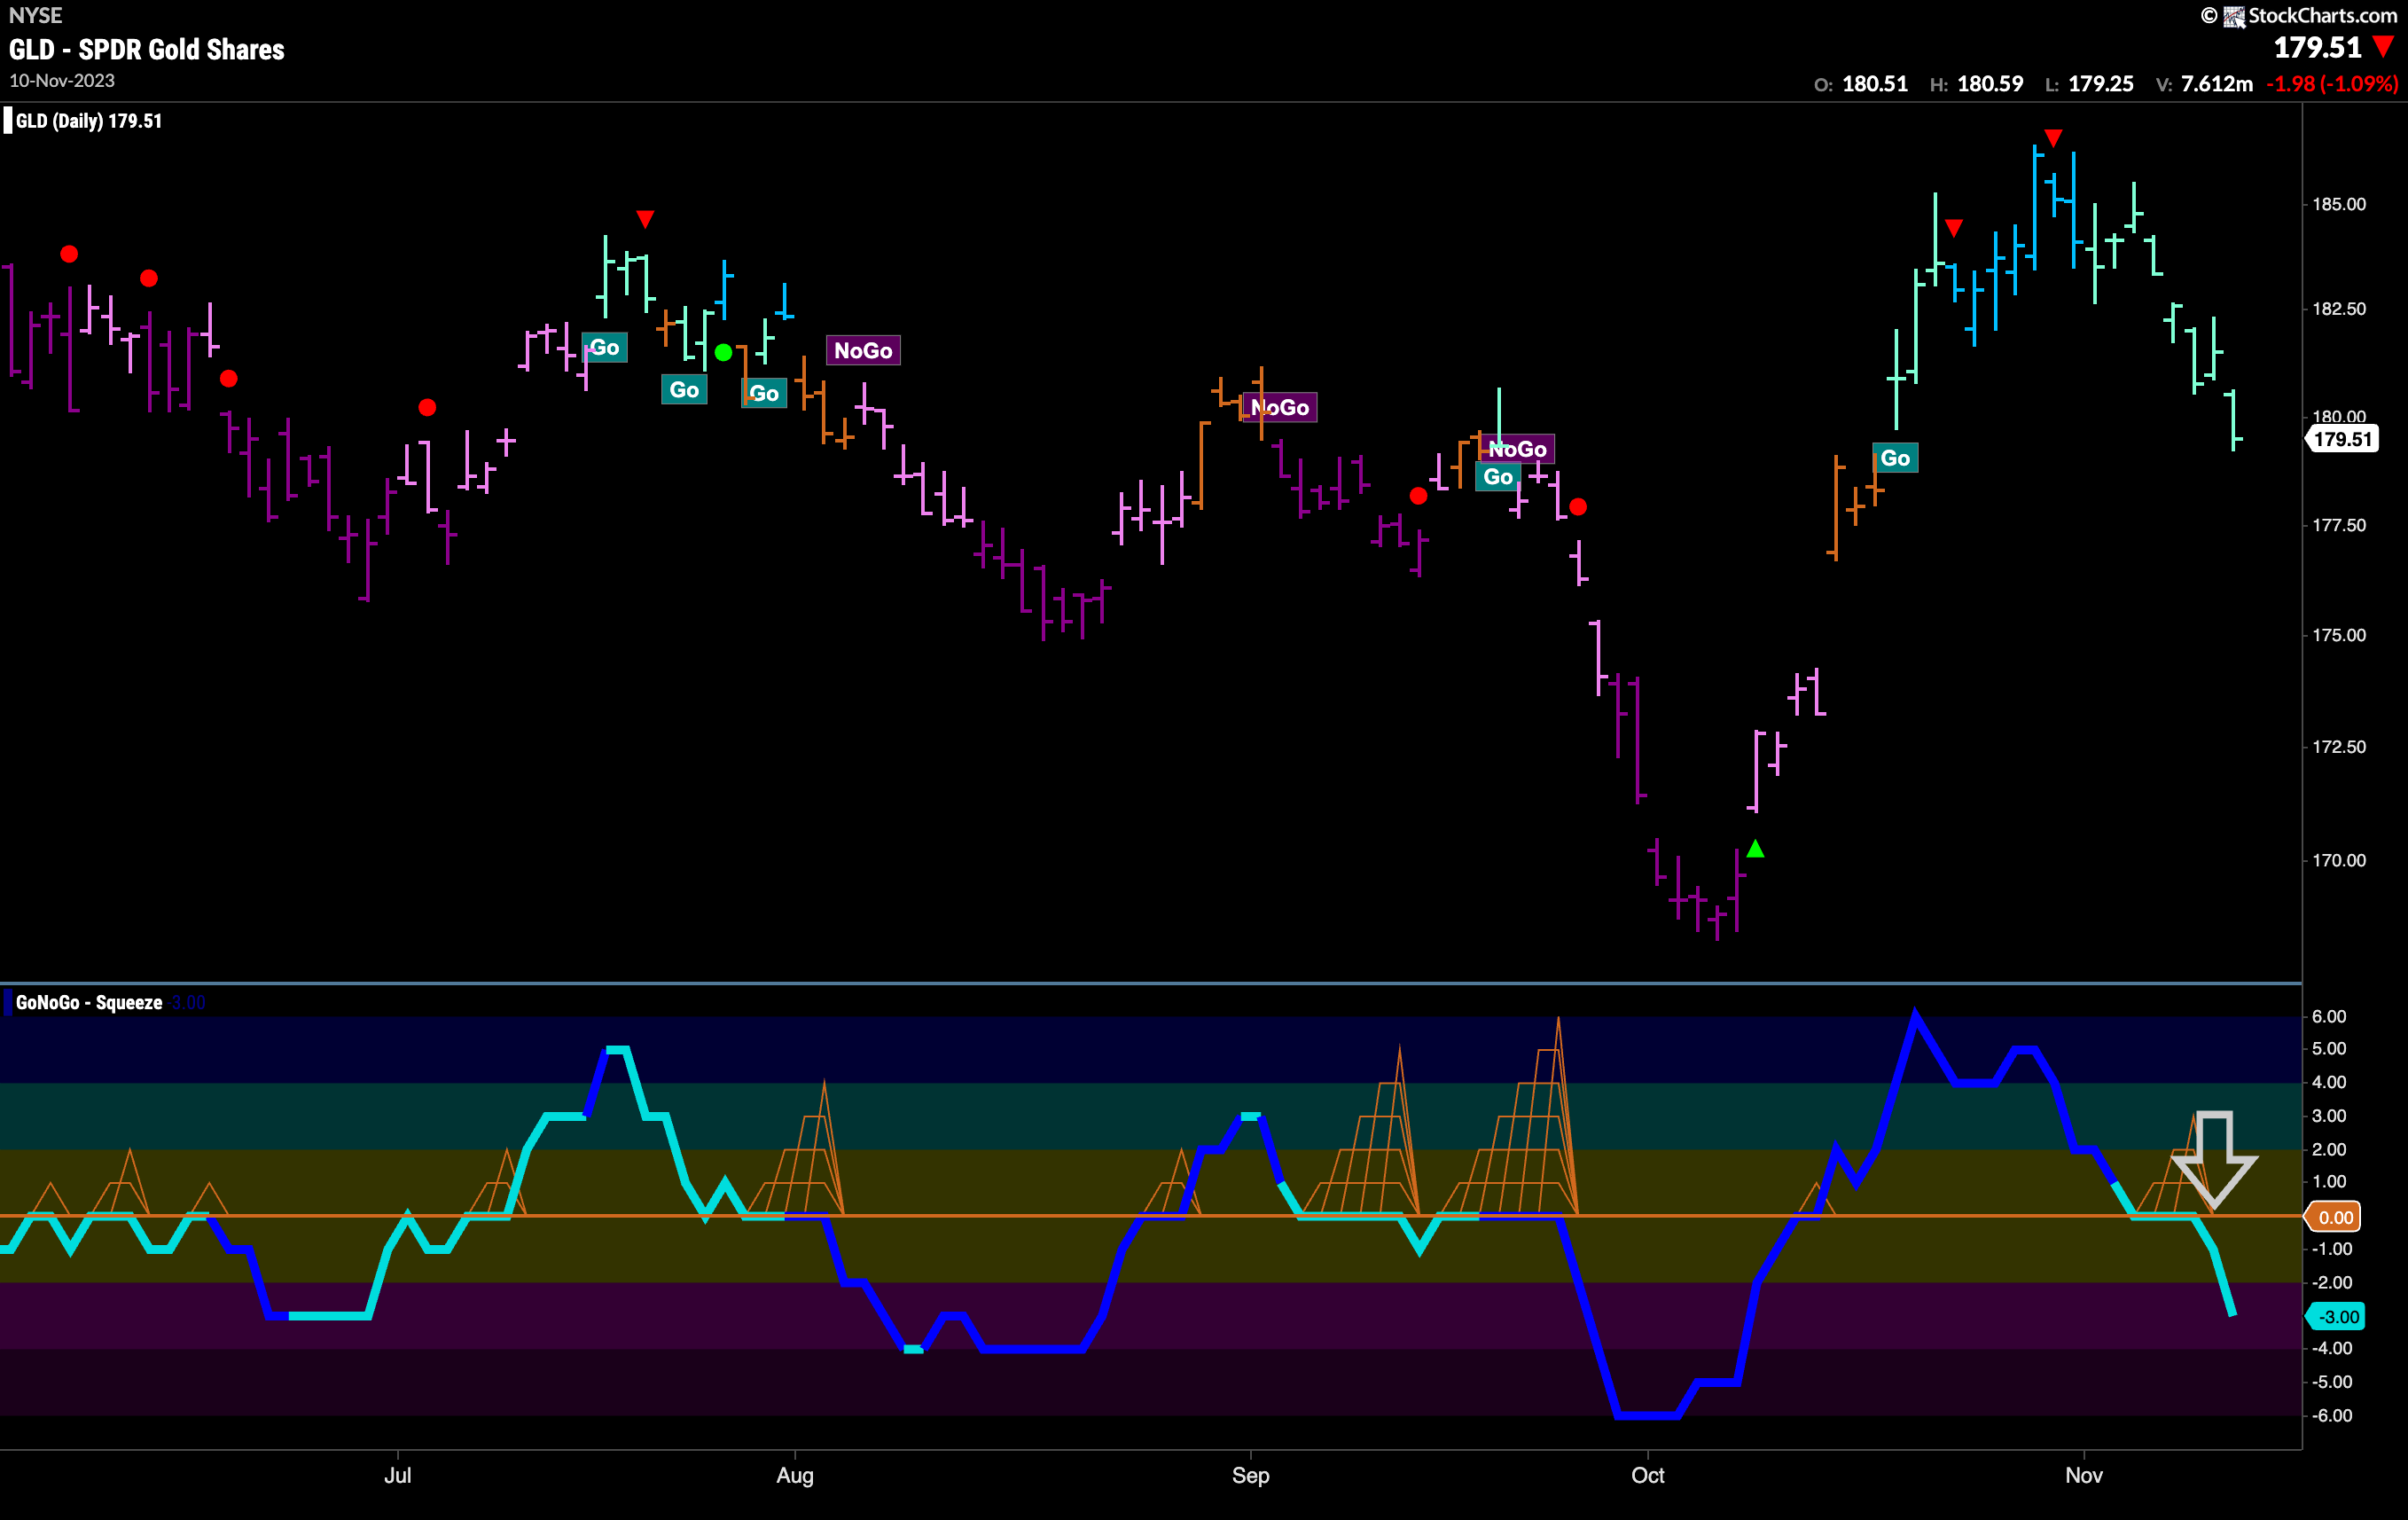
After entering a “Go” trend three weeks ago, we are back where we started with Gold. After the last Go Countertrend Correction Icon (red arrow) prices have fallen sharply and have painted over a week of uninterrupted paler aqua “Go” bars. GoNoGo Oscillator recently failed to find support at the zero line and so we know this is trouble for the “Go” trend. Momentum is now out of line with the trend. For the “Go” trend to hold, GoNoGo Oscillator will need to regain the zero line.
Sector RelMap
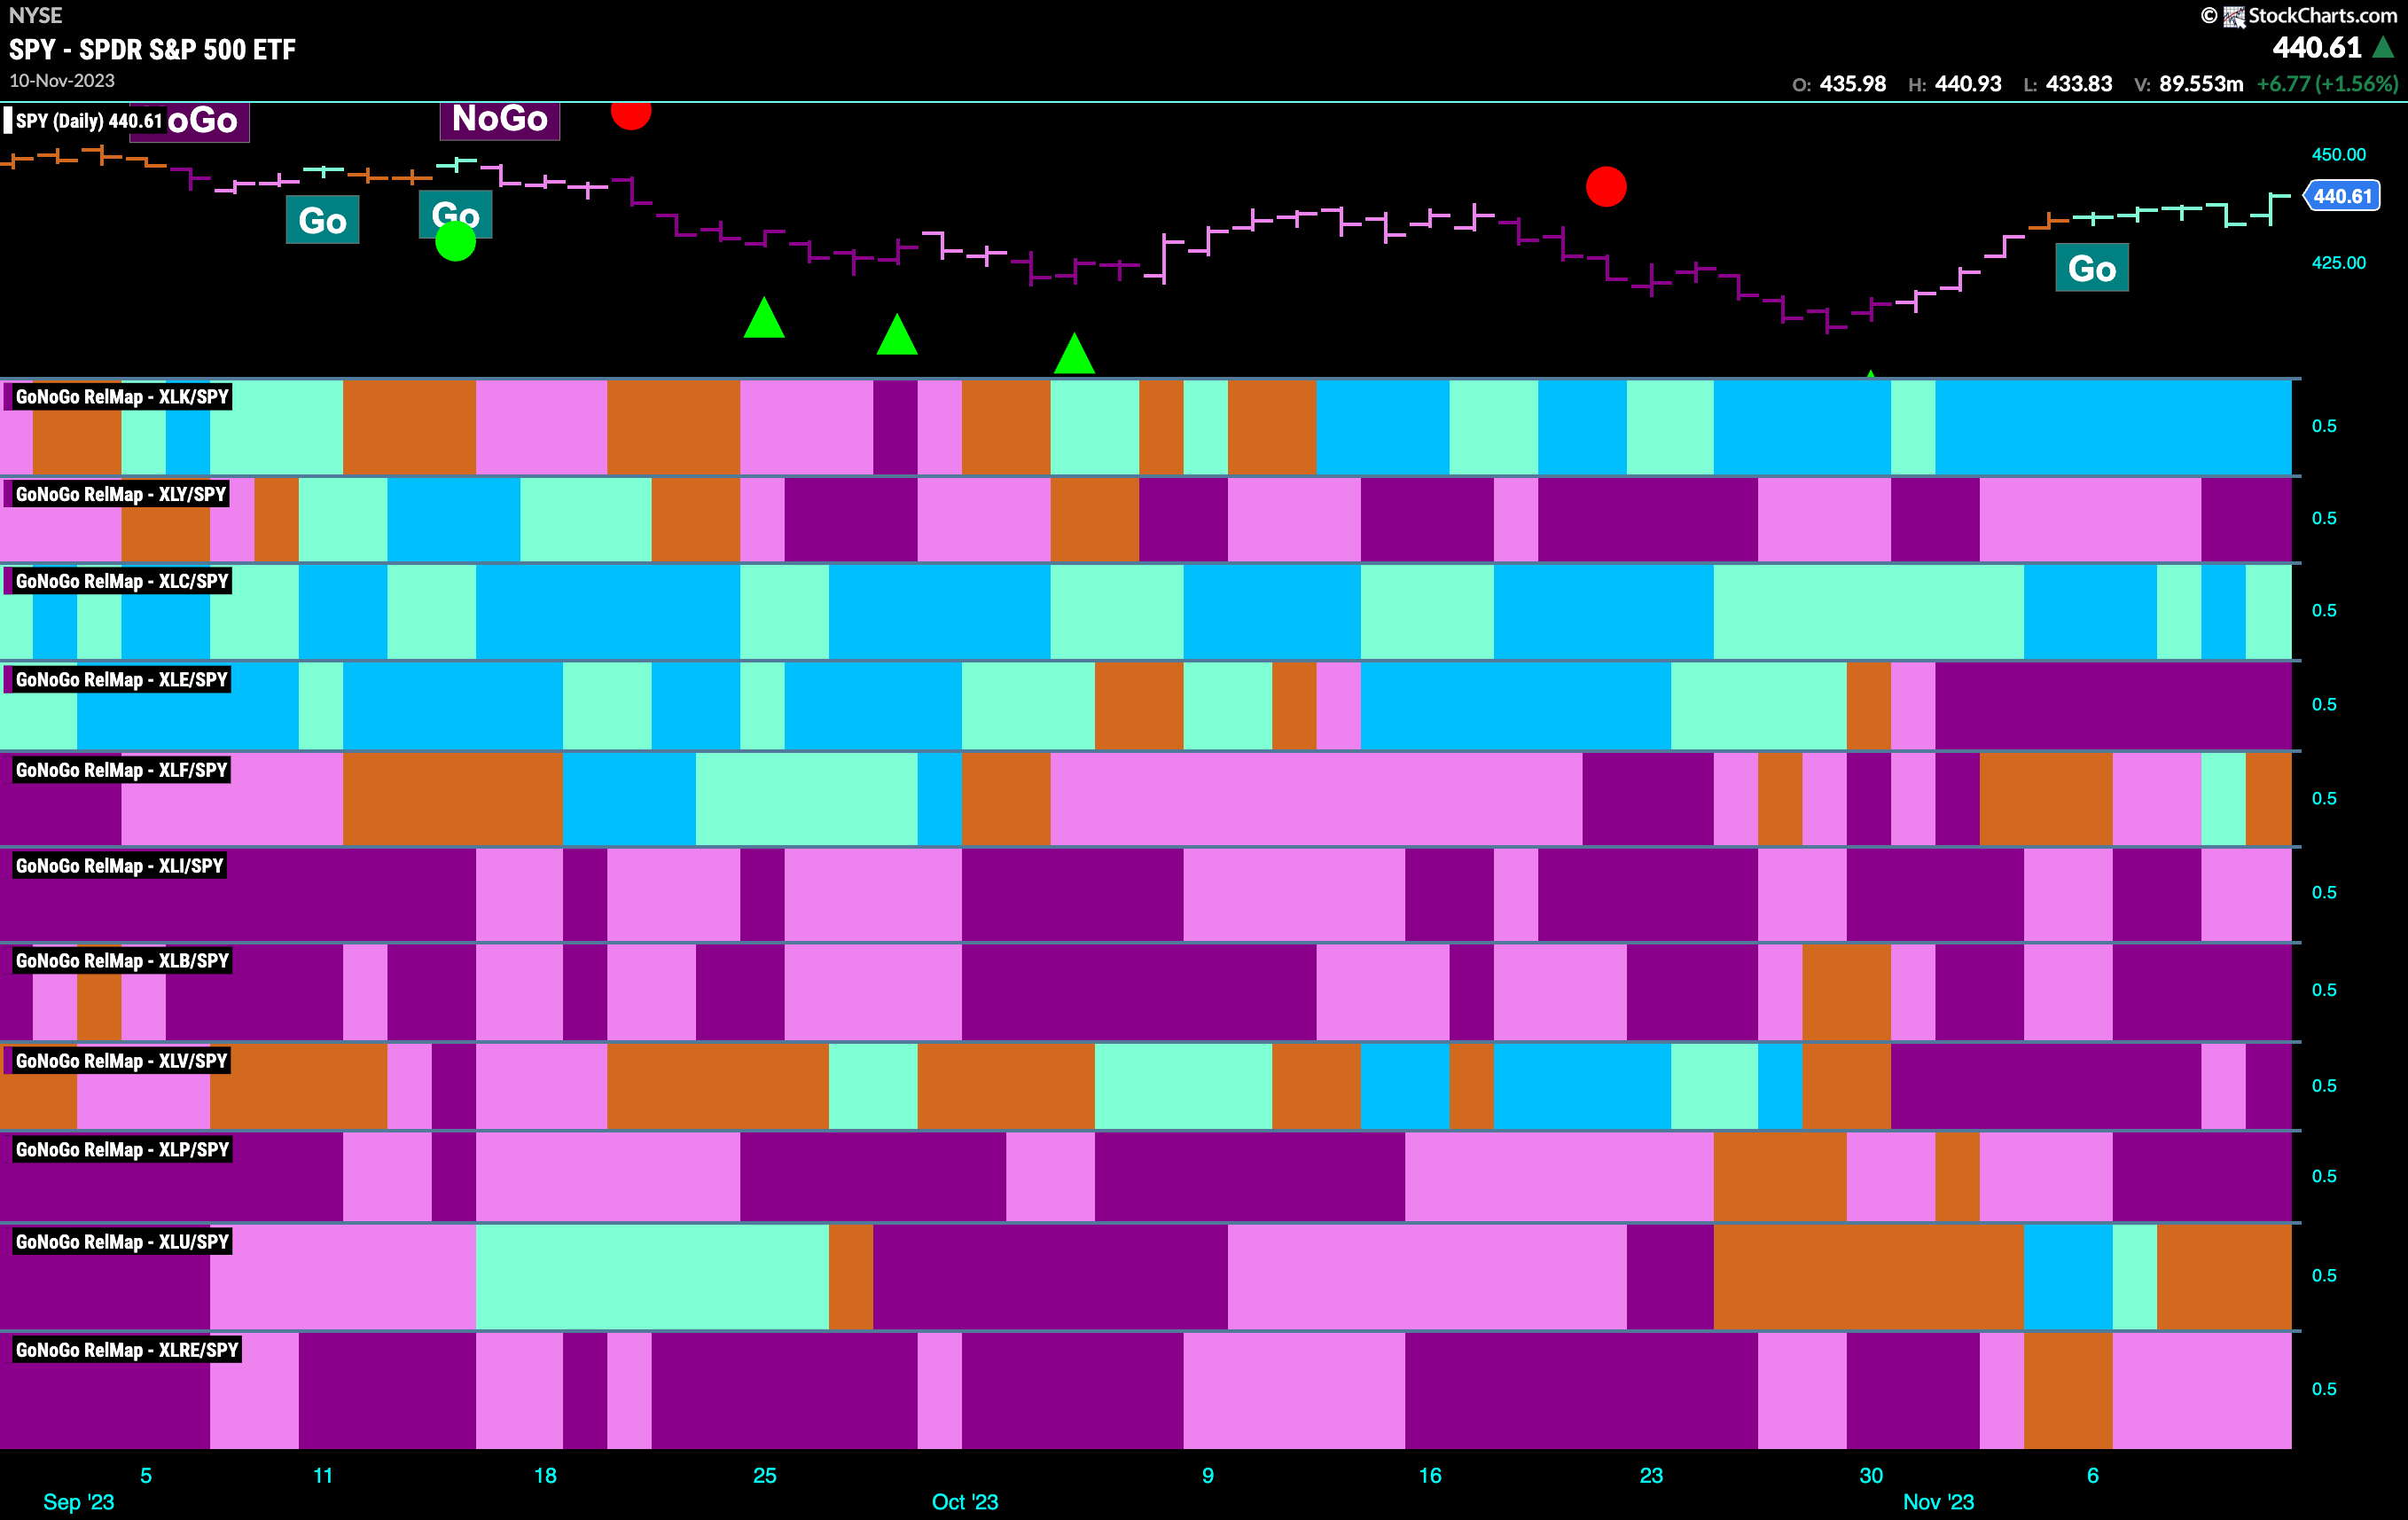
Below is the GoNoGo Sector RelMap. This GoNoGo RelMap applies the GoNoGo Trend to the relative strength ratios of the sectors to the base index. Looking at this map, we can quickly see where the relative outperformance is coming from as well as which sectors are lagging on a relative basis. 2 sectors are outperforming the base index this week. $XLK, and $XLC, are painting “Go” bars.
Technology So Strong
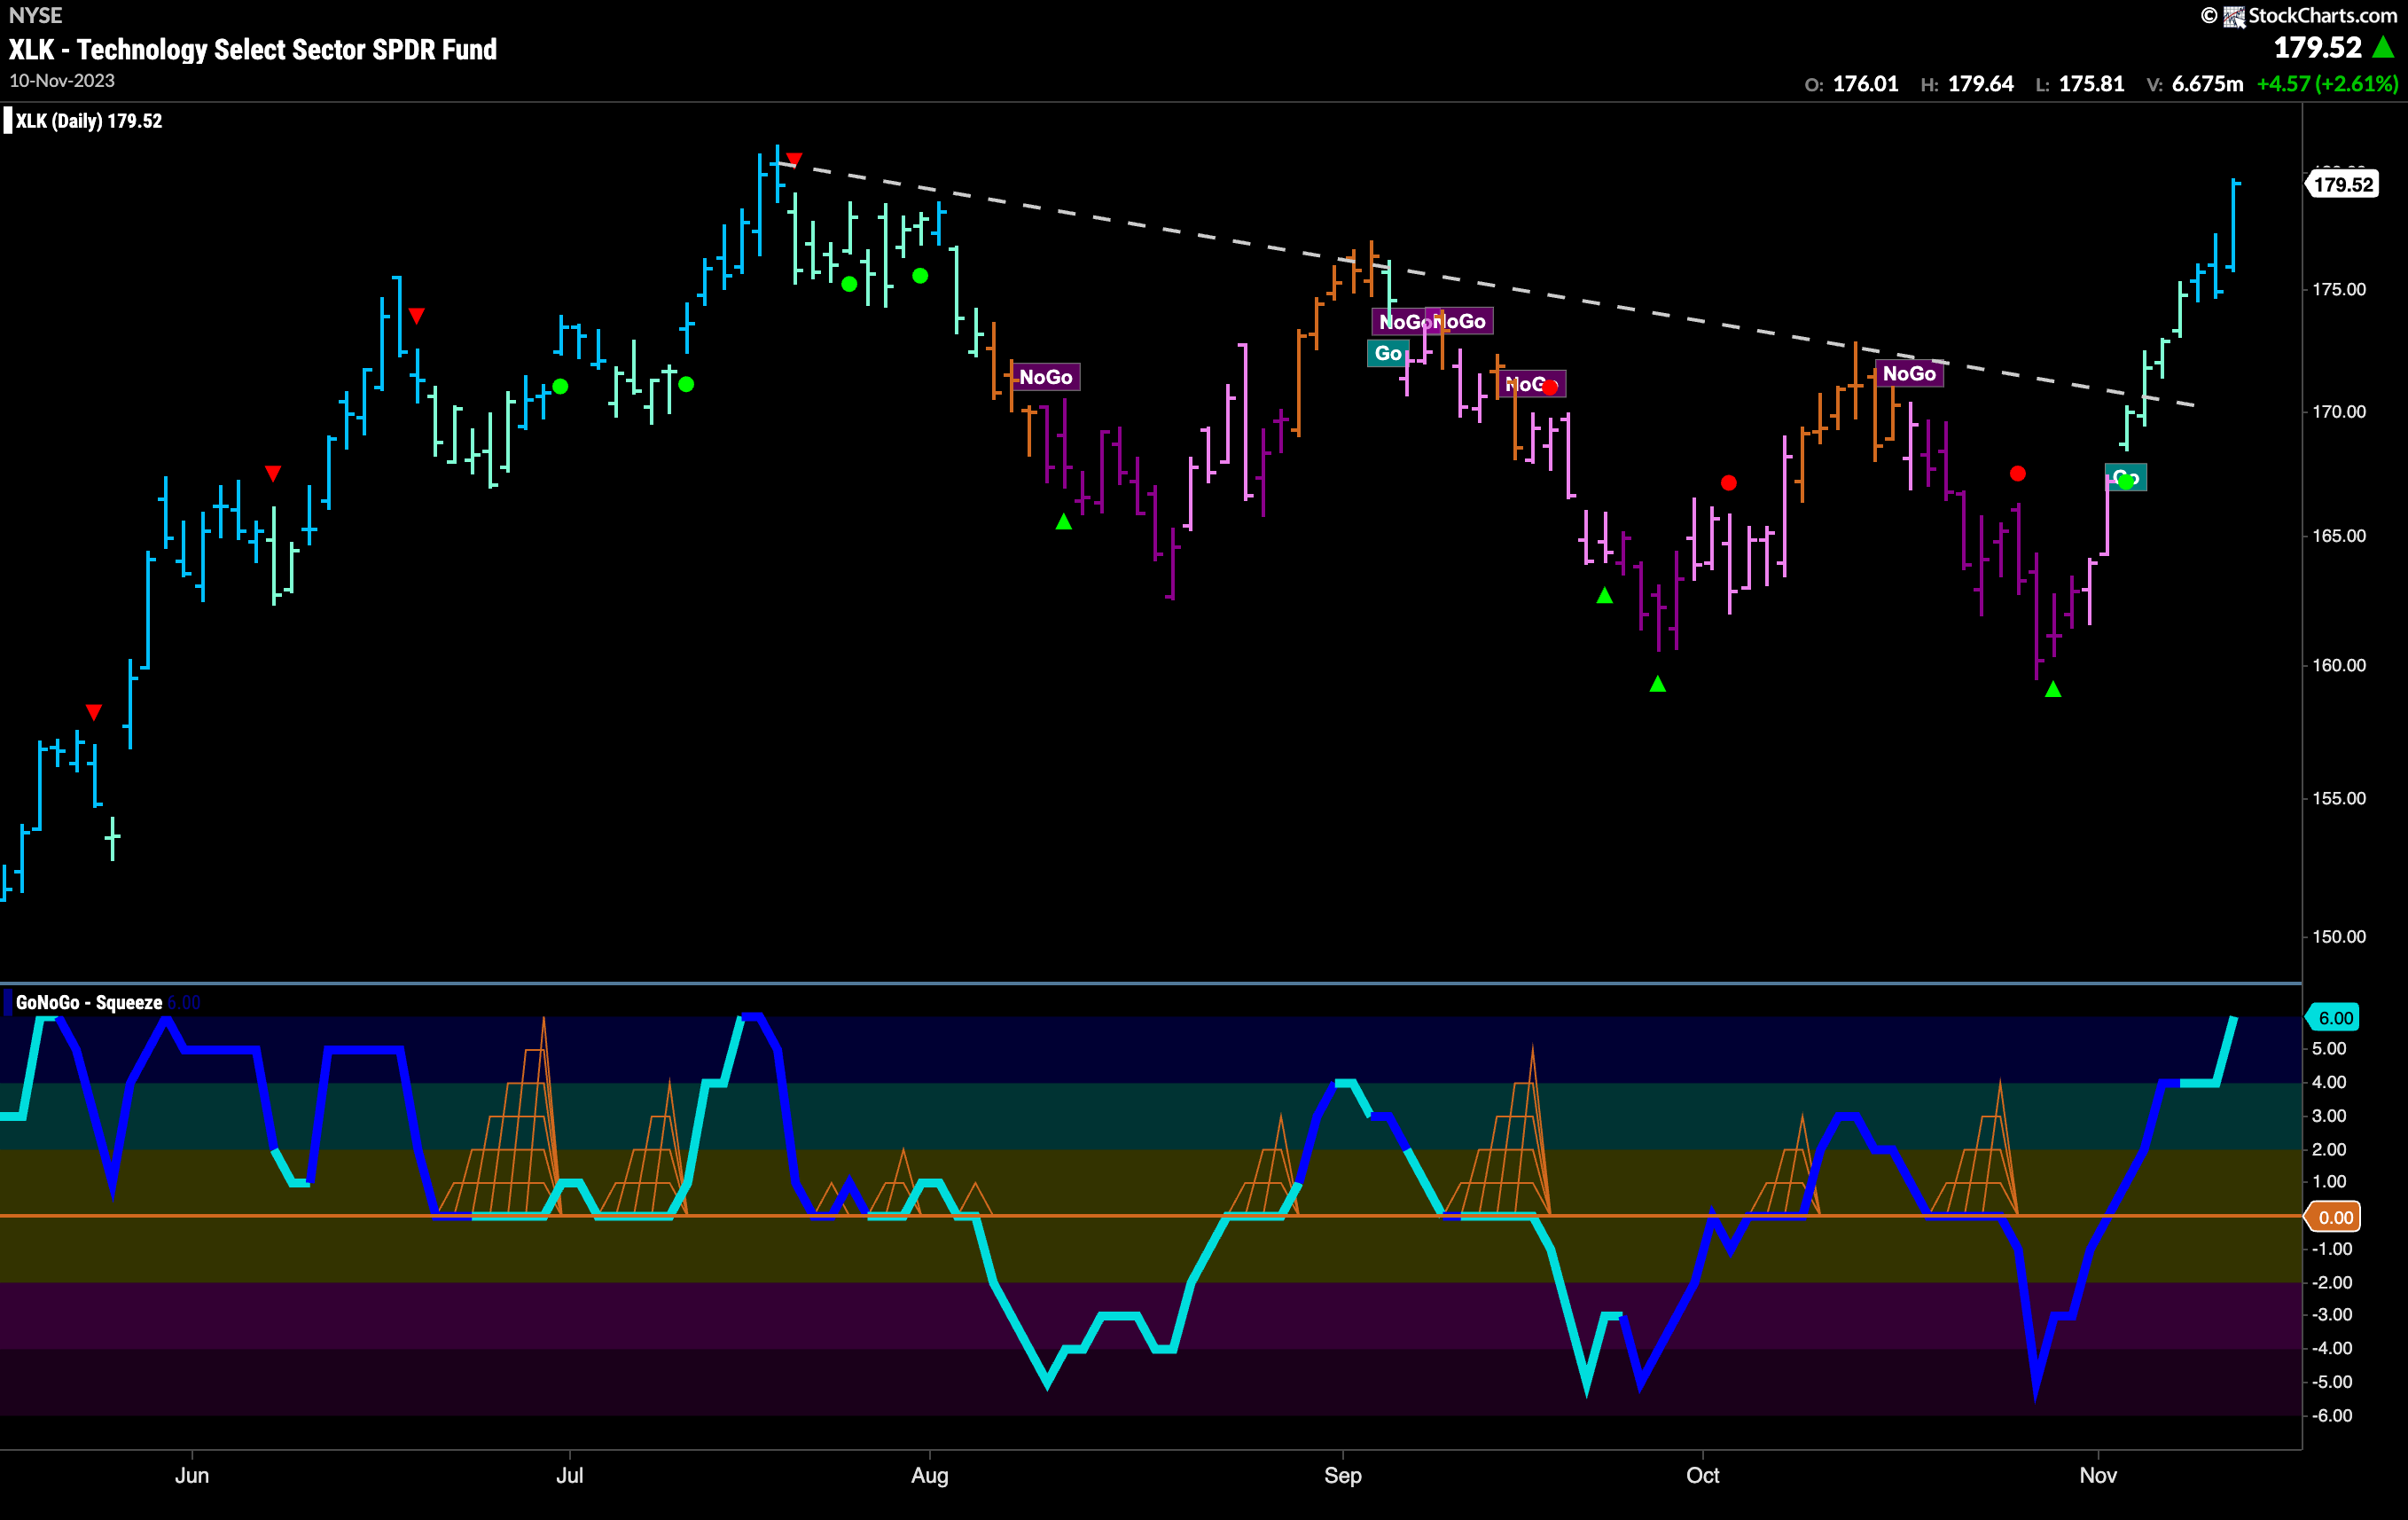
We talked about the strength of the technology sector last week and it has remained the leader of this recent push higher in the equity markets. The chart below shows the $XLK with the full suite of GoNoGo Charts applied. We can see that it has moved higher at a faster pace than the overall market. We have already taken out the highs from September and we see GoNoGo Trend has strengthened to paint blue bars. GoNoGo Oscillator is in overbought territory showing market enthusiasm.
$AAPL Took Off
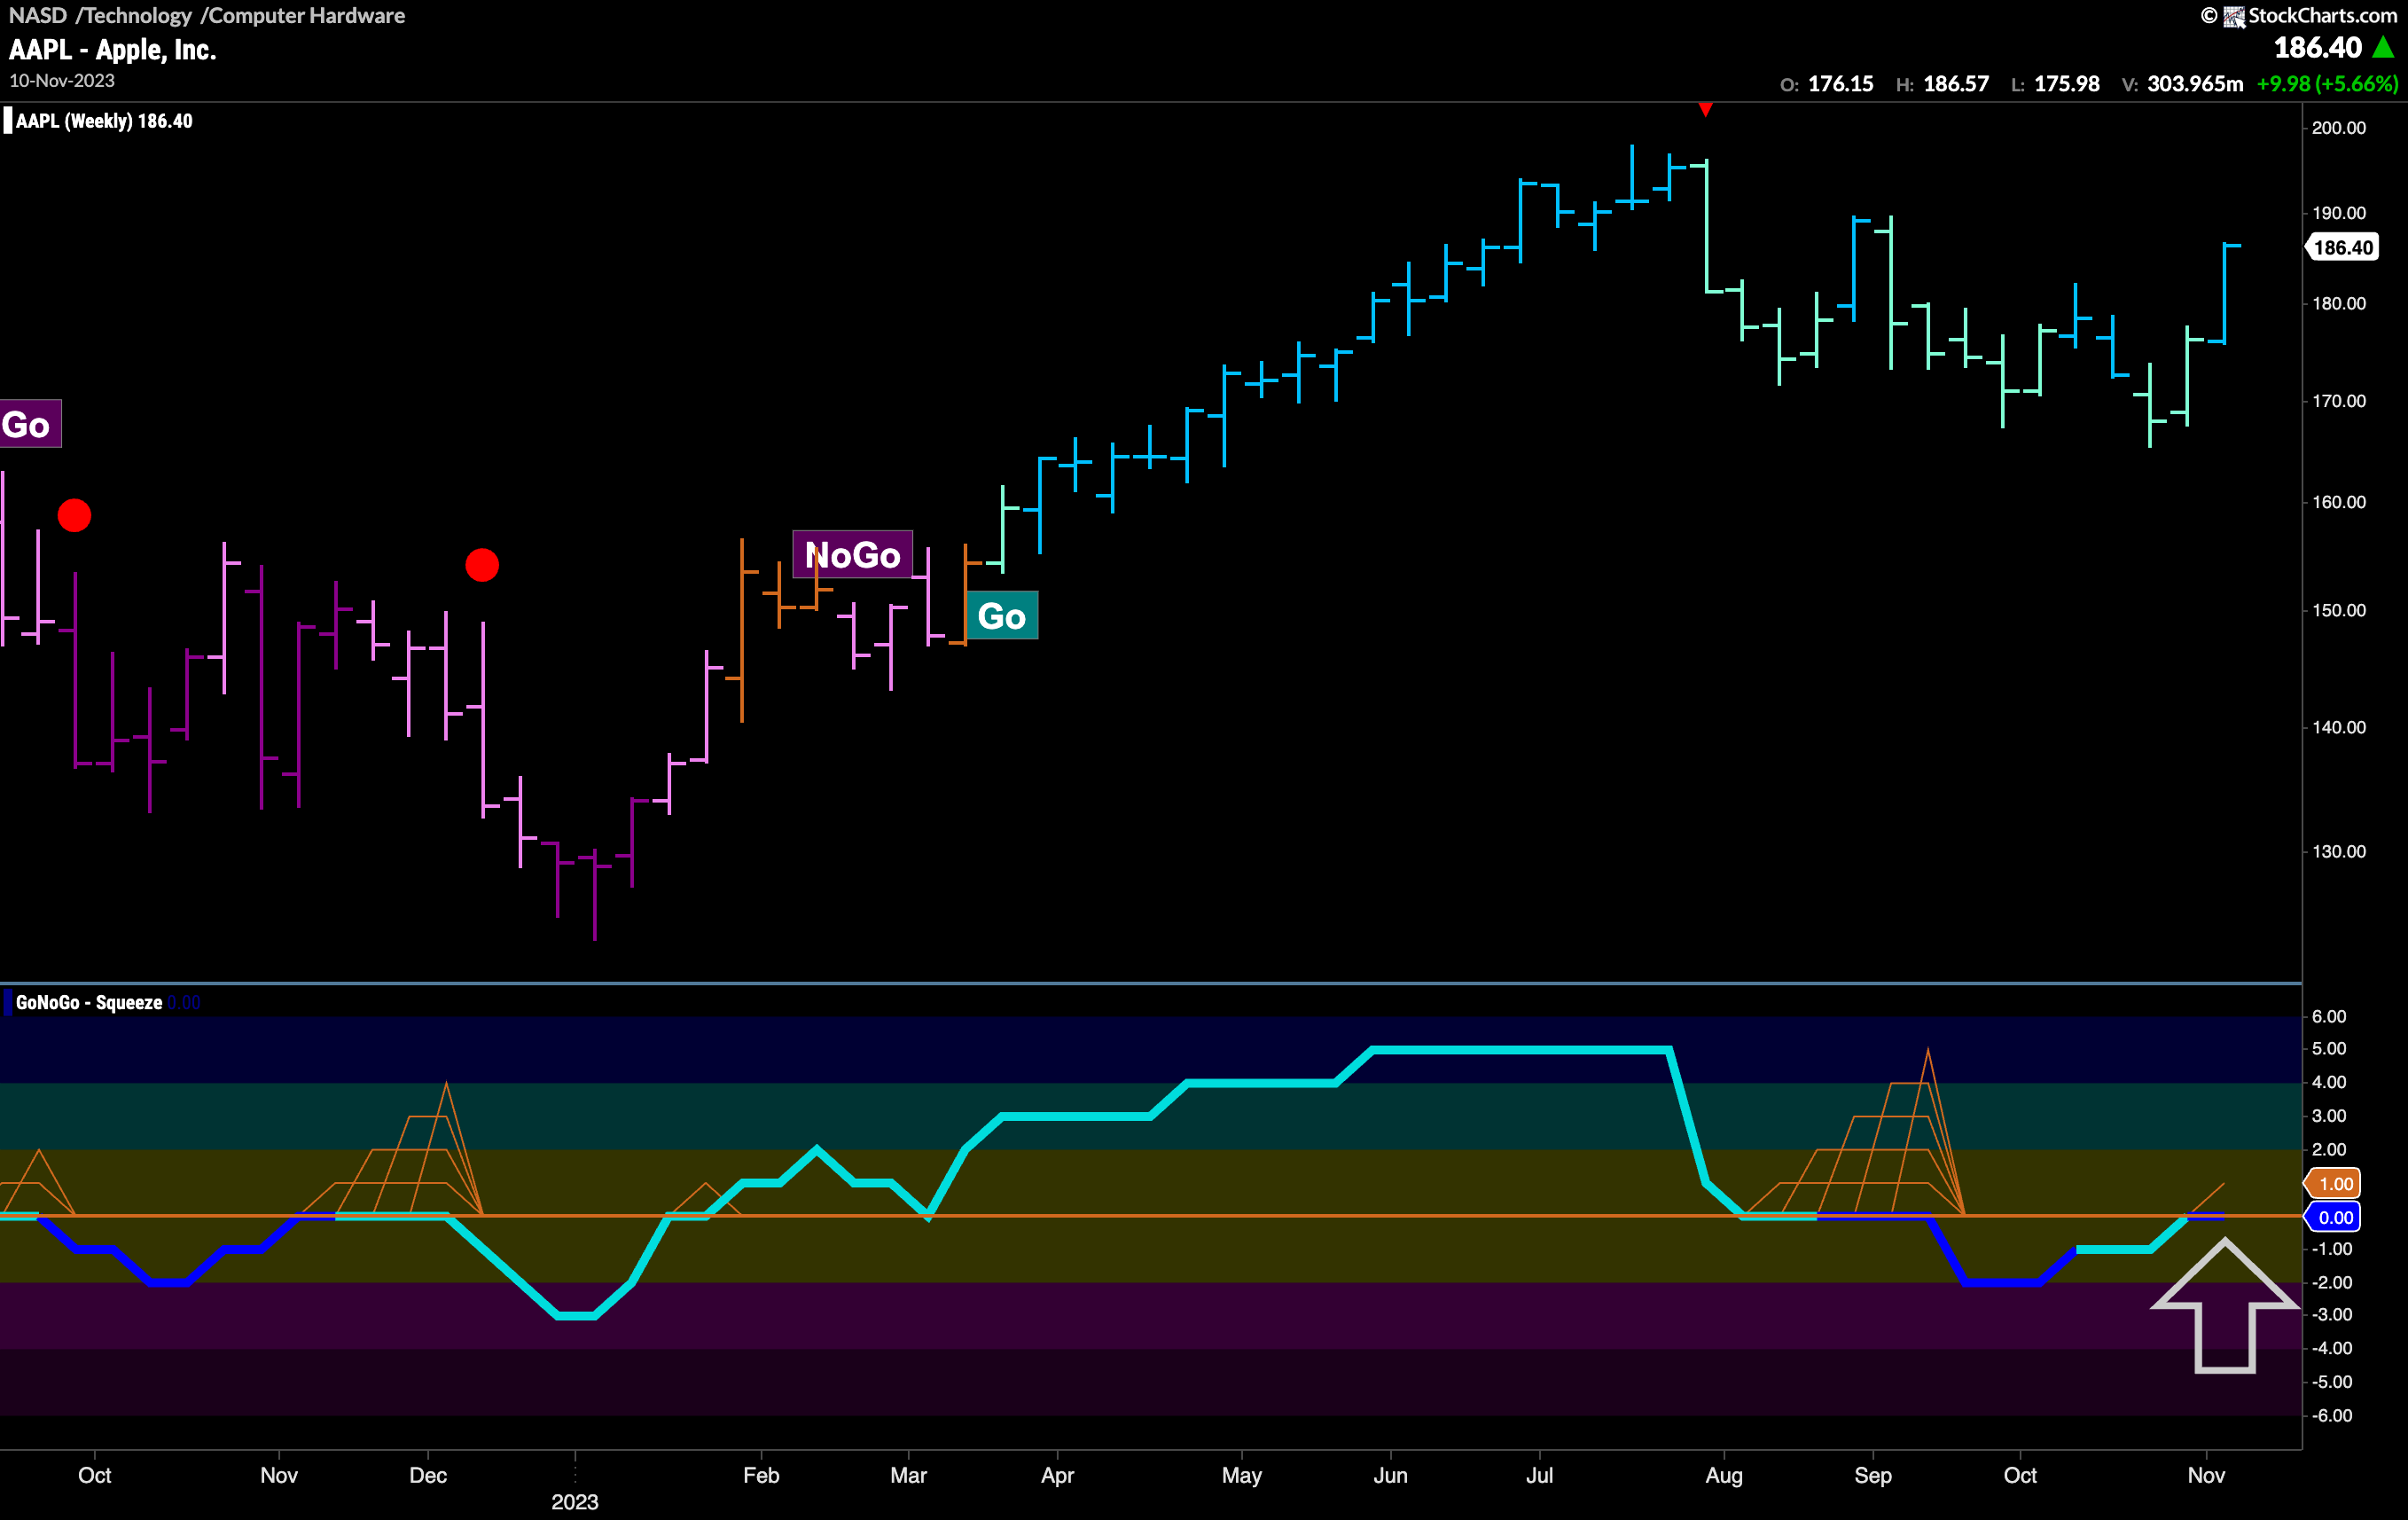
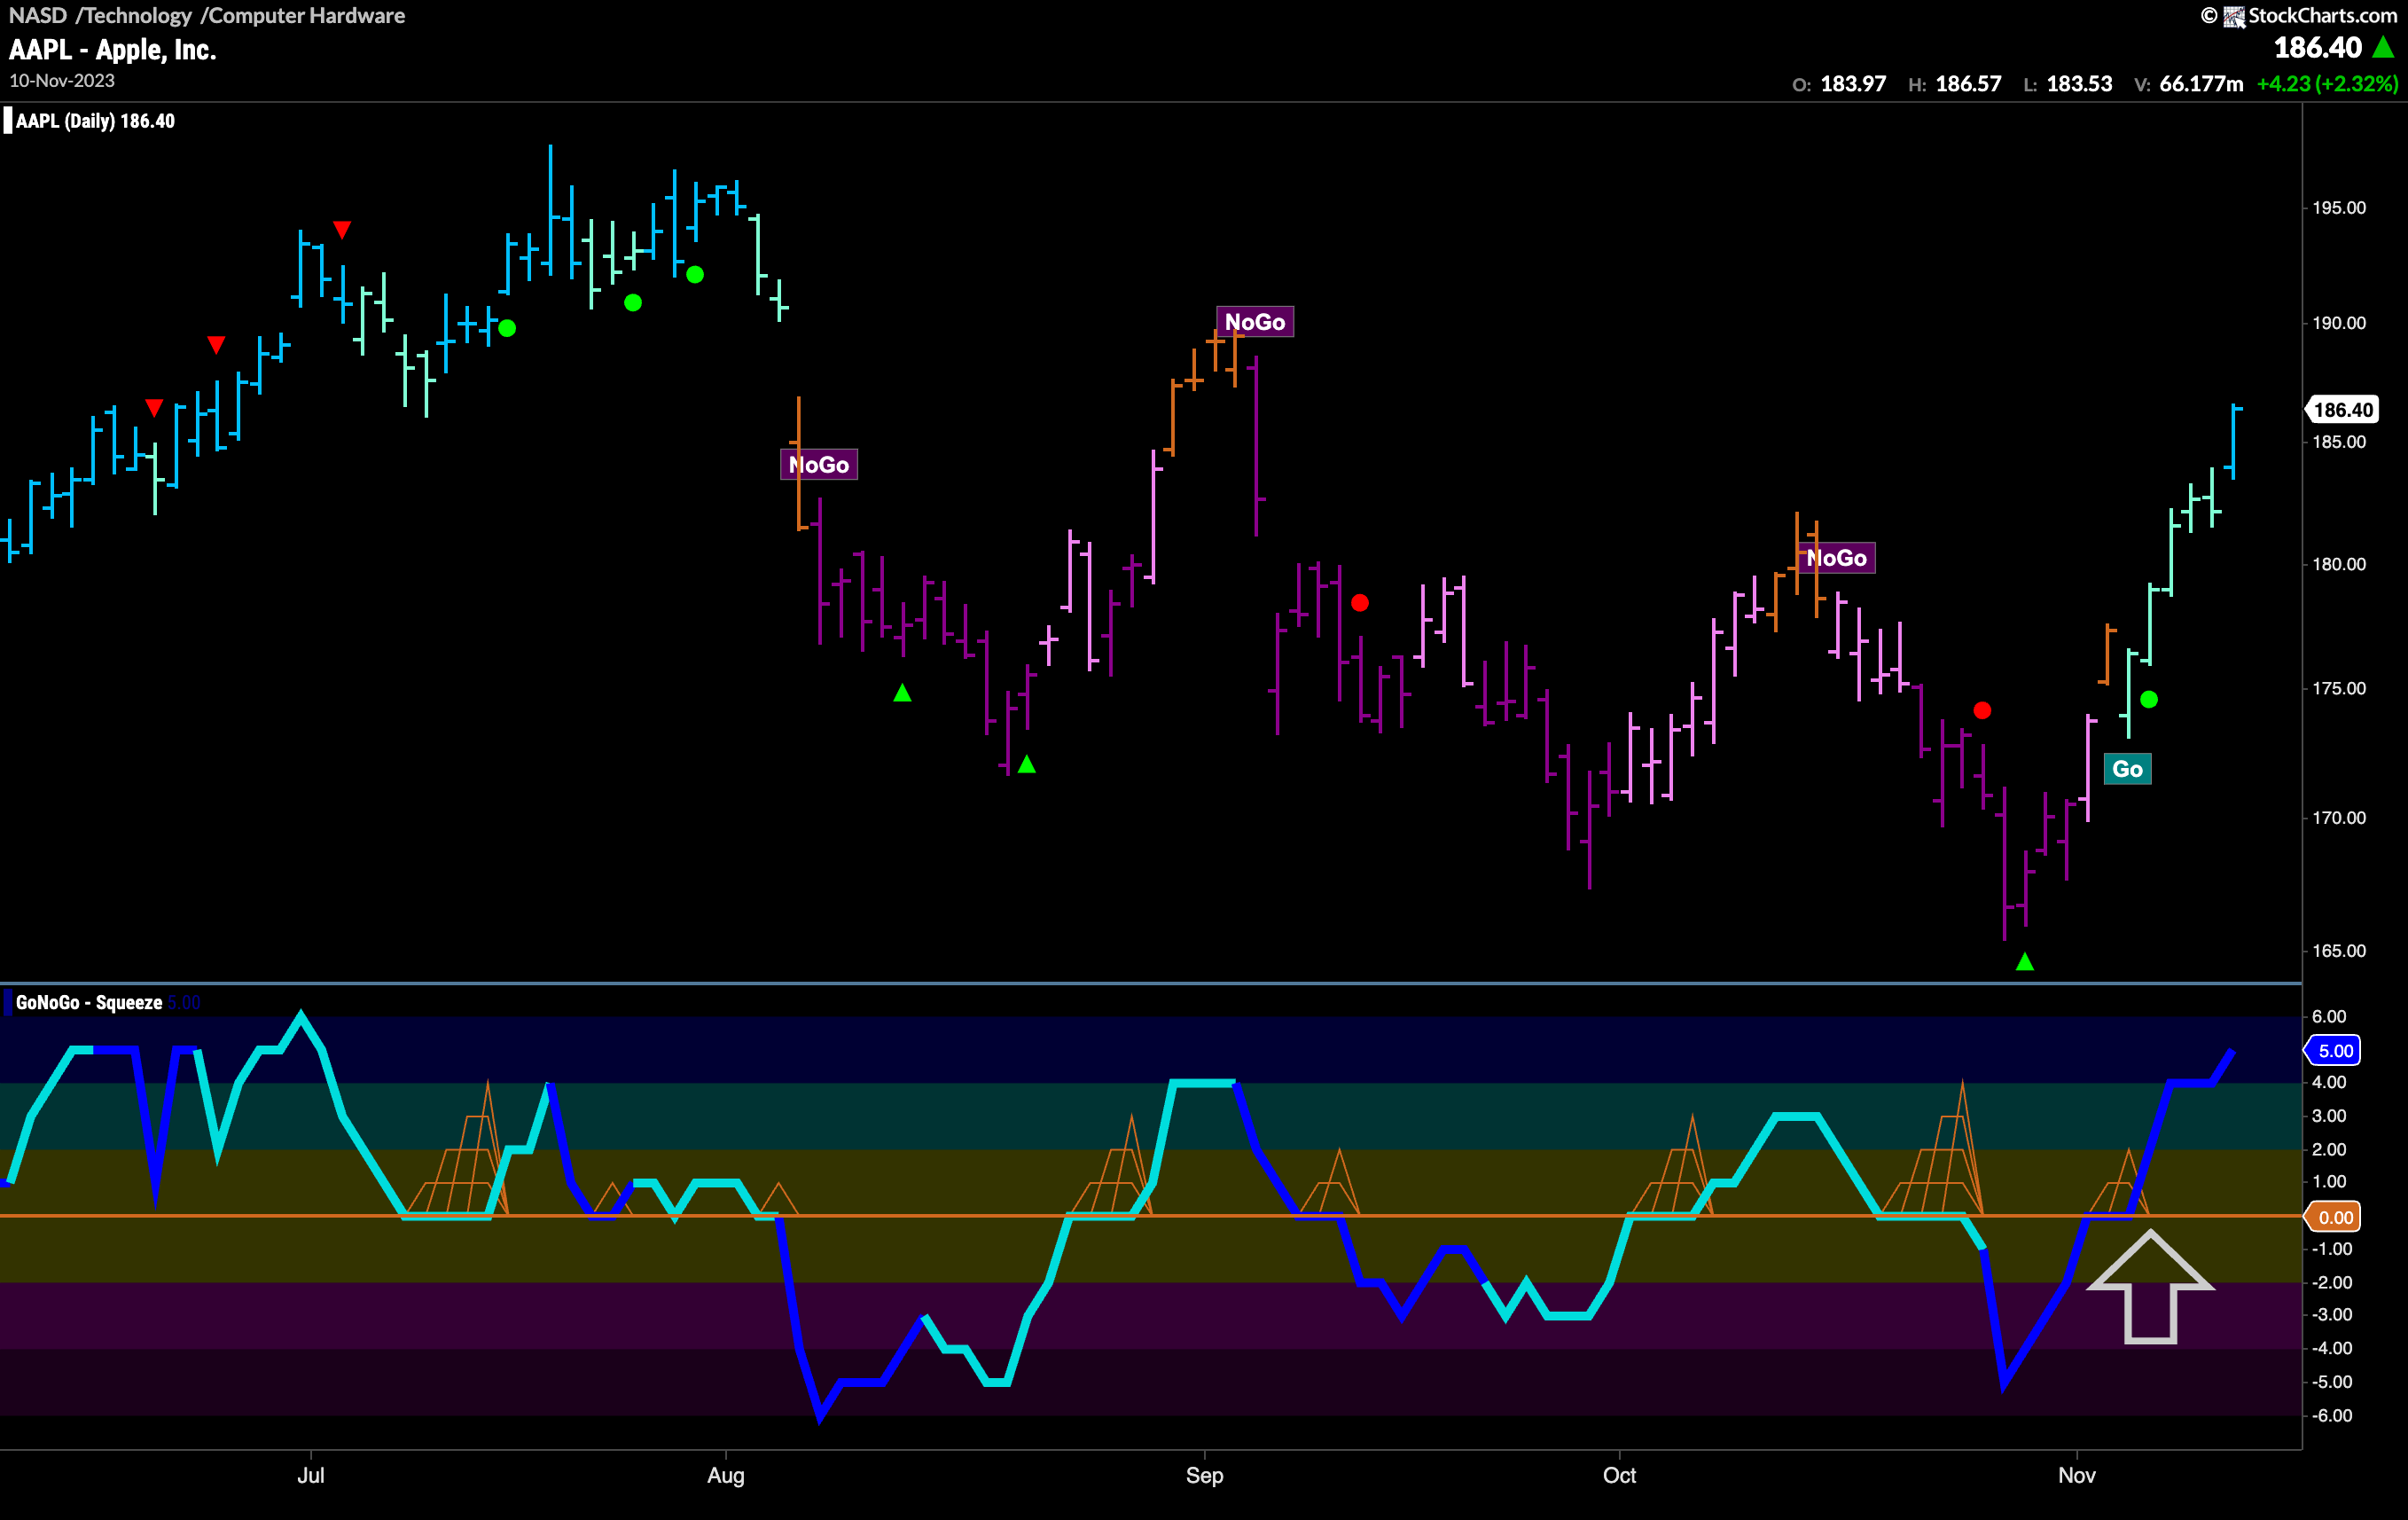
As Apple goes so goes the market? Last week we saw the “Go” trend in $AAPL take off. GoNoGo Trend painted a string of aqua “Go” bars and on the last bar of the week we saw the trend strengthen to paint bright blue. At the same time we saw GoNoGo Oscillator break above the zero line on heavy volume and is now in overbought territory. Price has set a new high and momentum is surging in the direction of the new “Go” trend.
The longer term health of $AAPL will be determined when the GoNoGo Oscillator breaks free from the zero line. GoNoGo Oscillator has fallen into negative territory during this recent correction as price has retreated from the Go Countertrend Correction Icon (red arrow). However, as price strengthened last week to paint a bright blue “Go” bar, GoNoGo Oscillator rallied back to test the zero line from below. If the oscillator can move back into positive territory that would indicate resurgent momentum in the direction of the “Go” trend and we could expect price to make an attack on that prior high.
