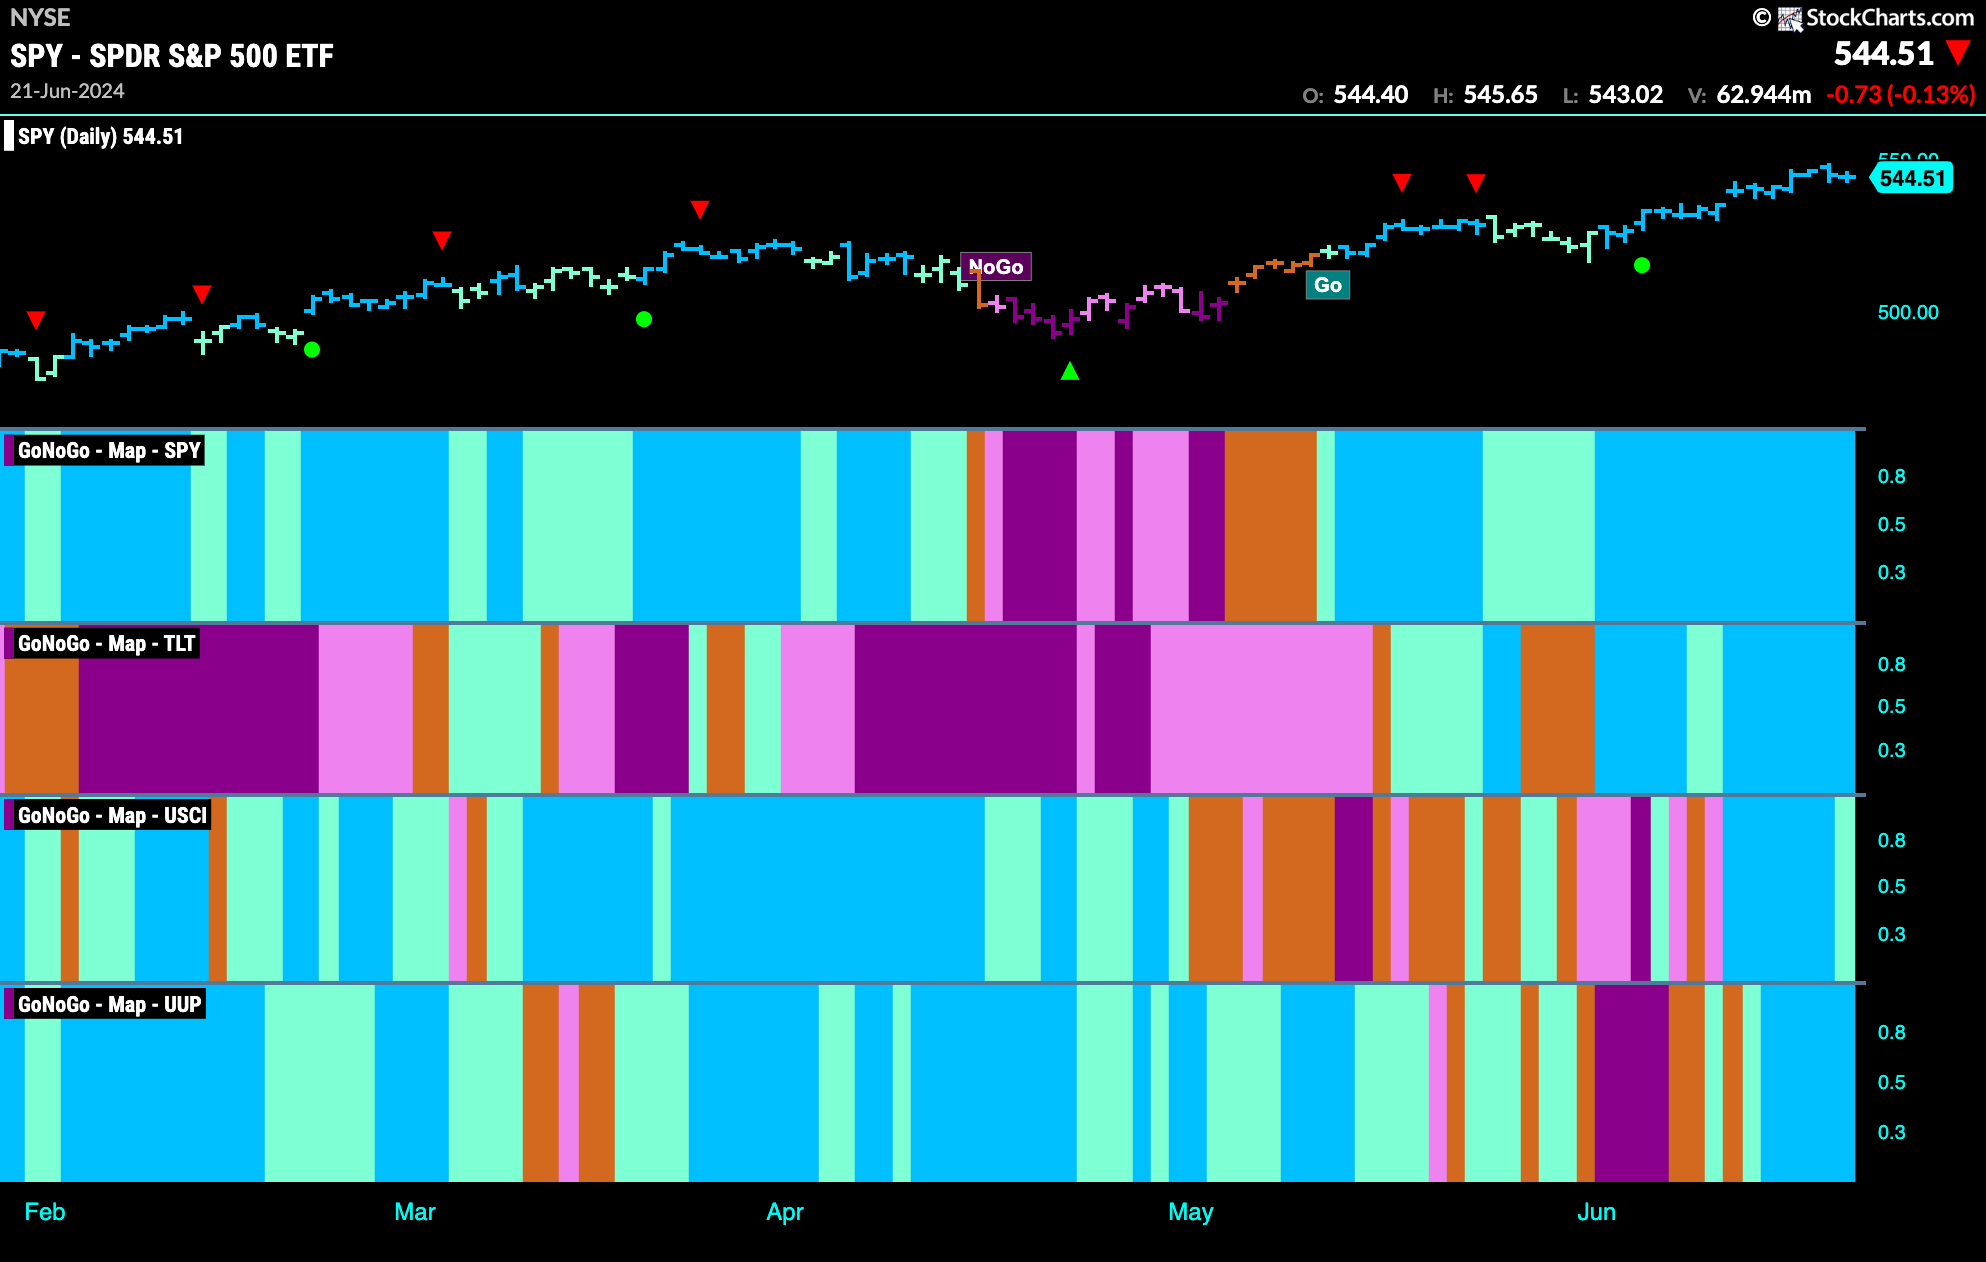
Good morning and welcome to this week’s Flight Path. We saw another strong week of blue “Go” bars for the equity index. Treasury bond prices also maintained strong blue “Go” colors for the entire week. U.S. commodities almost did the same, but the week ended with a weaker aqua bar. The dollar found its feet again this week with a string of strong blue “Go” bars also.
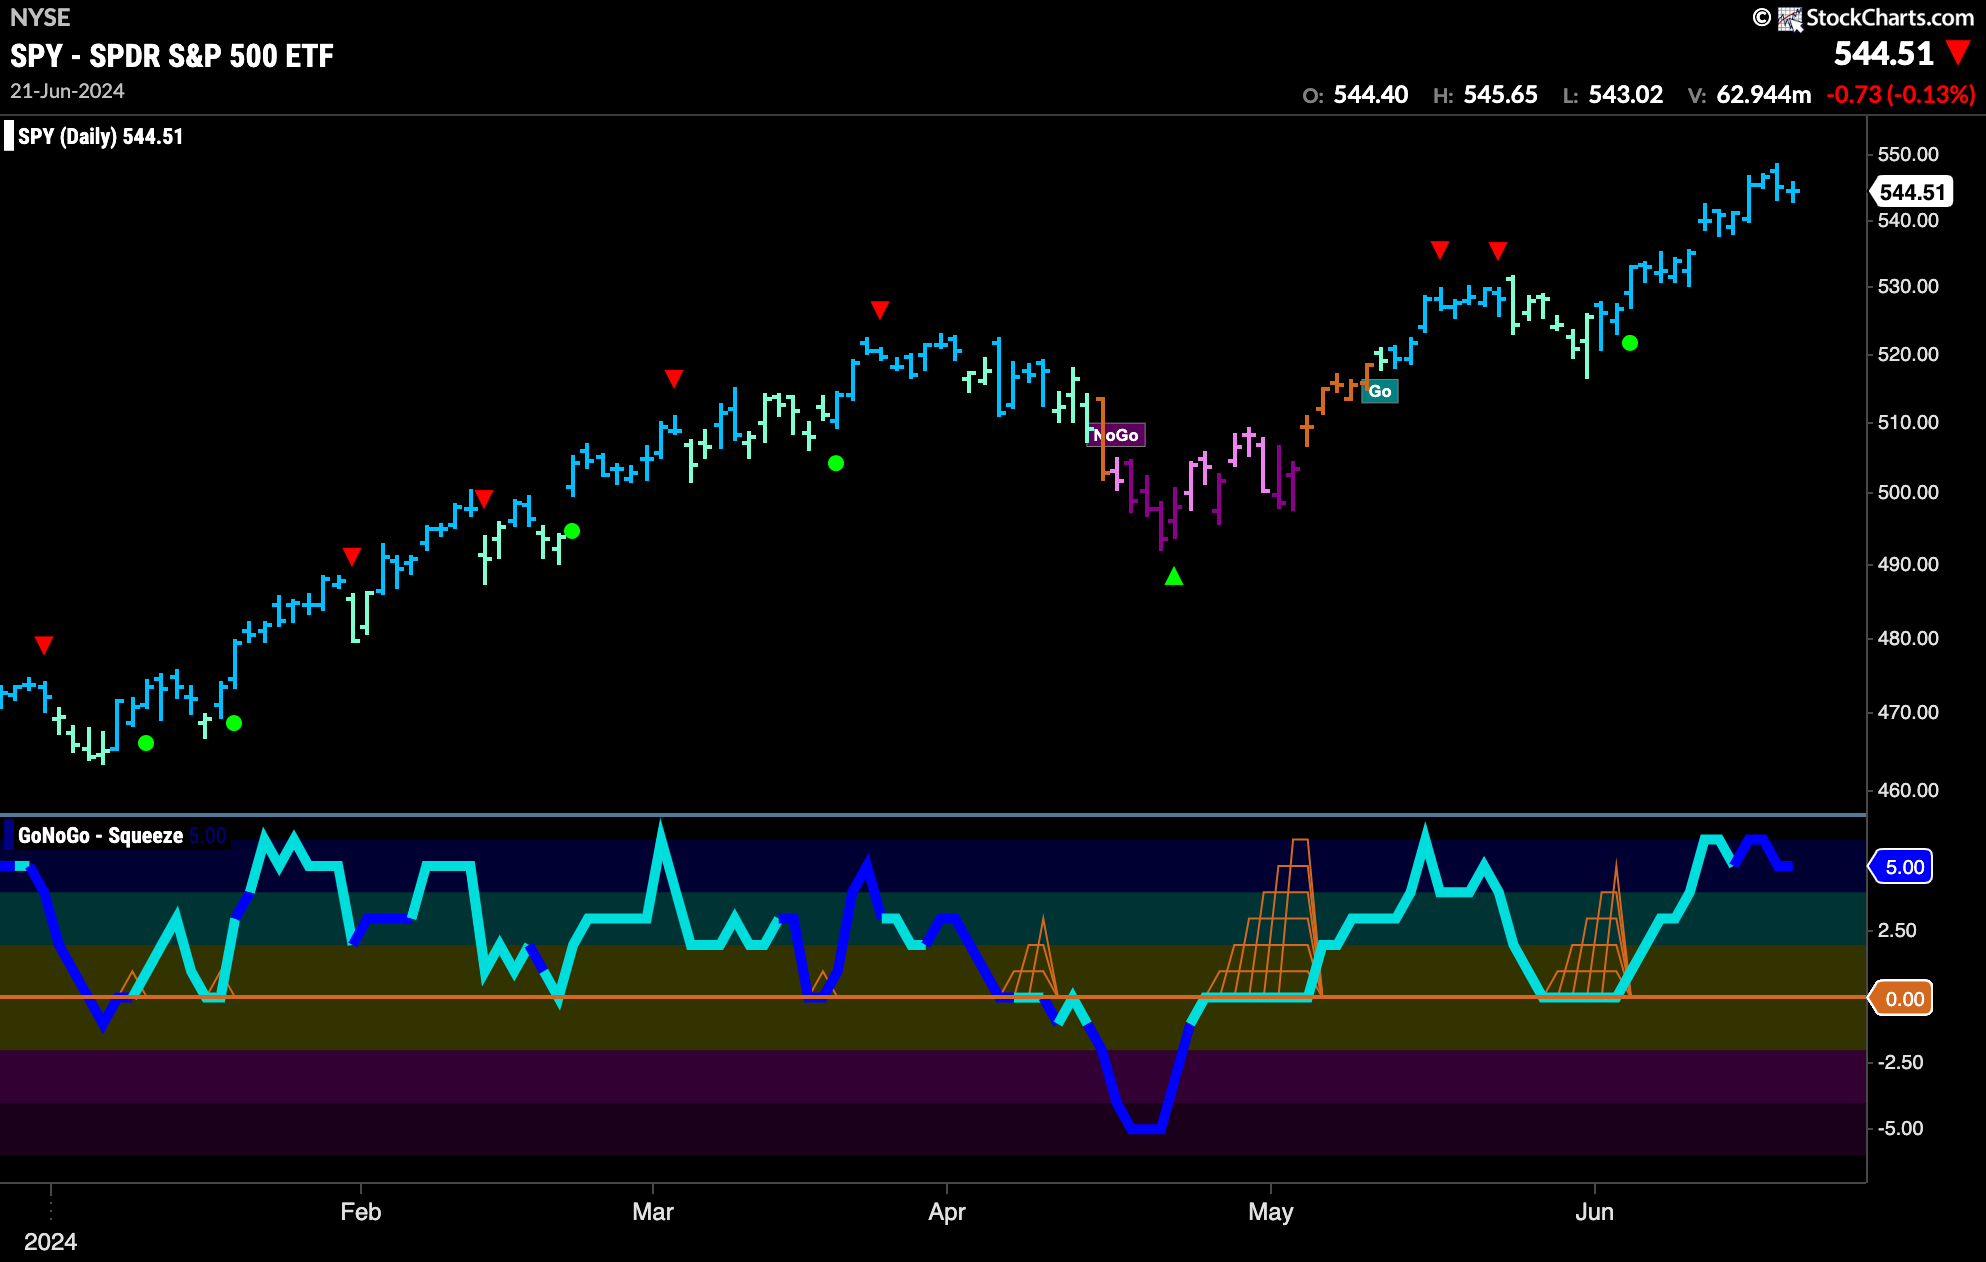
$SPY Paints Another Week of Strong Blue “Go” Bars
Price hit another higher high this week as GoNoGo Trend painted a string of strong blue “Go” bars. When turning our attention to the oscillator panel we see that it has remained overbought this week moving between values of 5 and 6. Volume is heavy with prices at these levels. we will watch to see if the oscillator falls out of the overbought range in the upcoming days. If it does, we will see a Go Countertrend Correction Icon (red arrow) above price indicating that it may be a struggle for price to go higher in the short term.
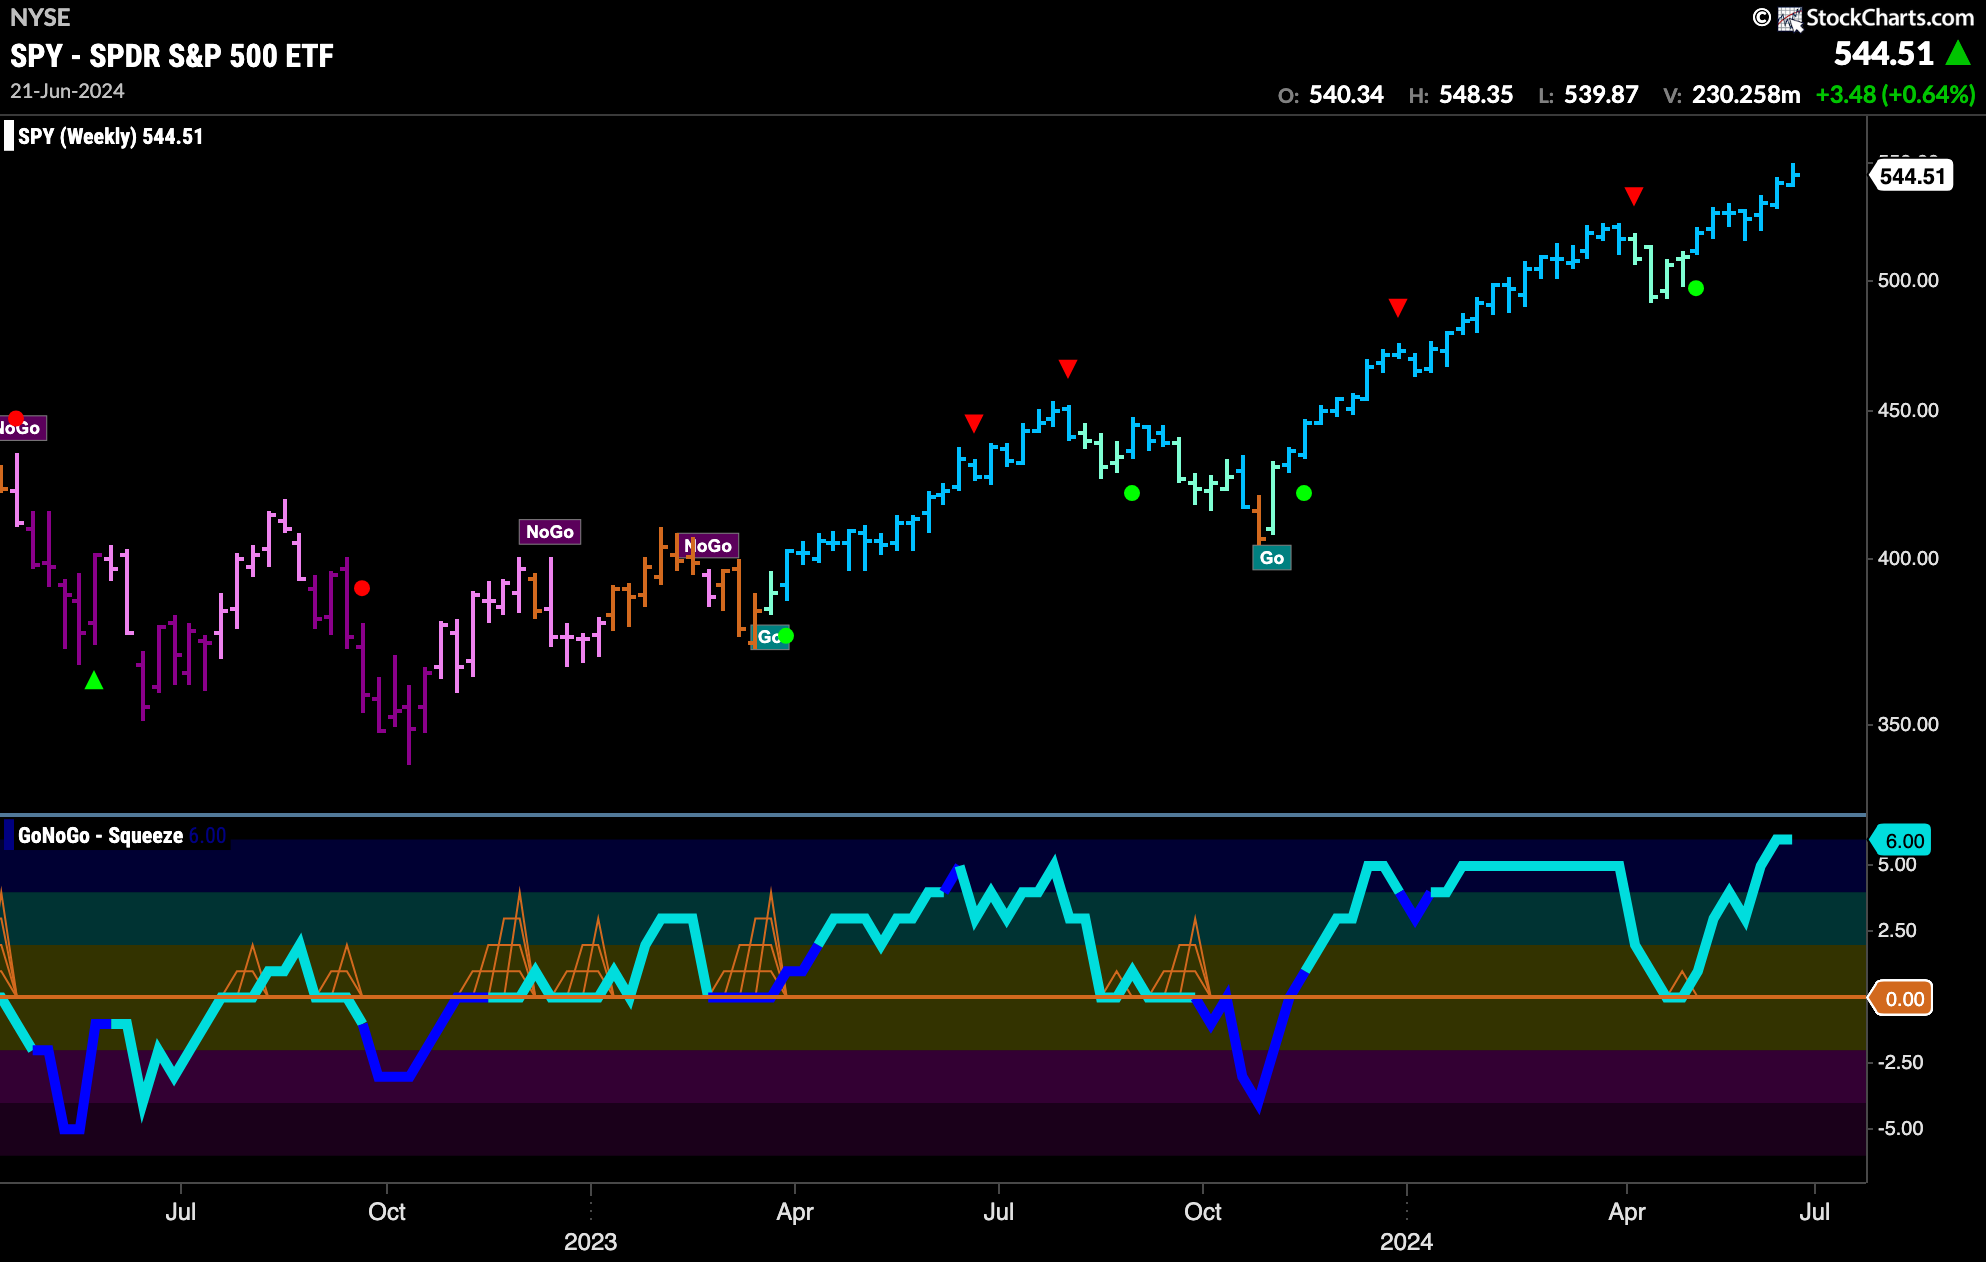
Another week another higher high! A 7th consecutive bright blue bar on the weekly chart as price continues higher. GoNoGo Oscillator has climbed into overbought territory at a value of 6. We will watch to see if it stays overbought or if it falls back toward neutral territory.
Treasury Rates Continue to Paint “NoGo” Bars
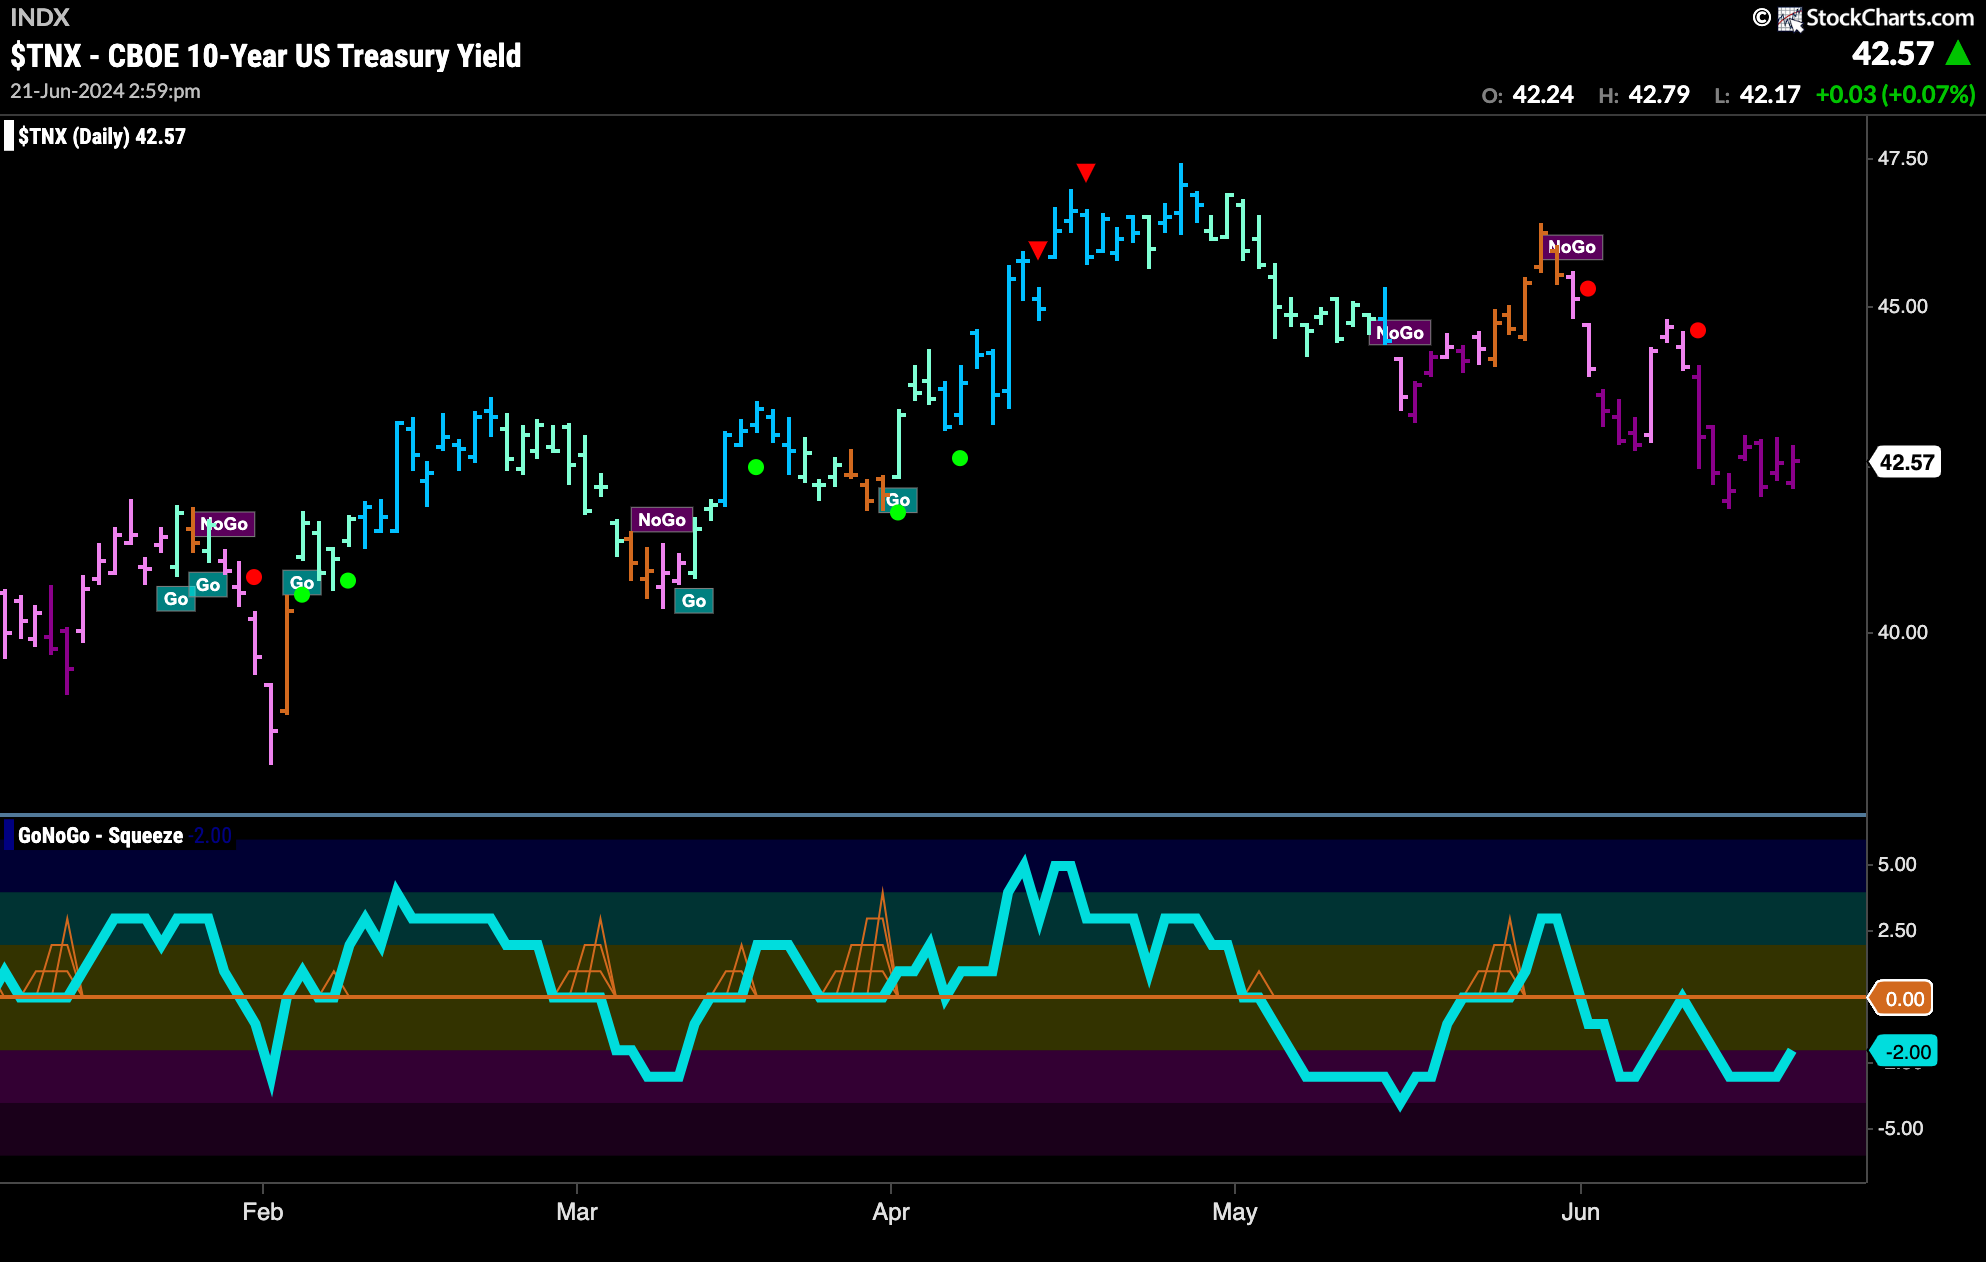
After a new low at the beginning of the week we saw strong purple “NoGo” bars as price consolidated and moved mostly sideways. GoNoGo Oscillator during this week stayed in negative territory but is not yet oversold and in fact turned up on the final bar of the week. With momentum in negative territory we can say that it is confirming the direction of the underlying “NoGo” trend.
Dollar Consolidates New “Go” Trend
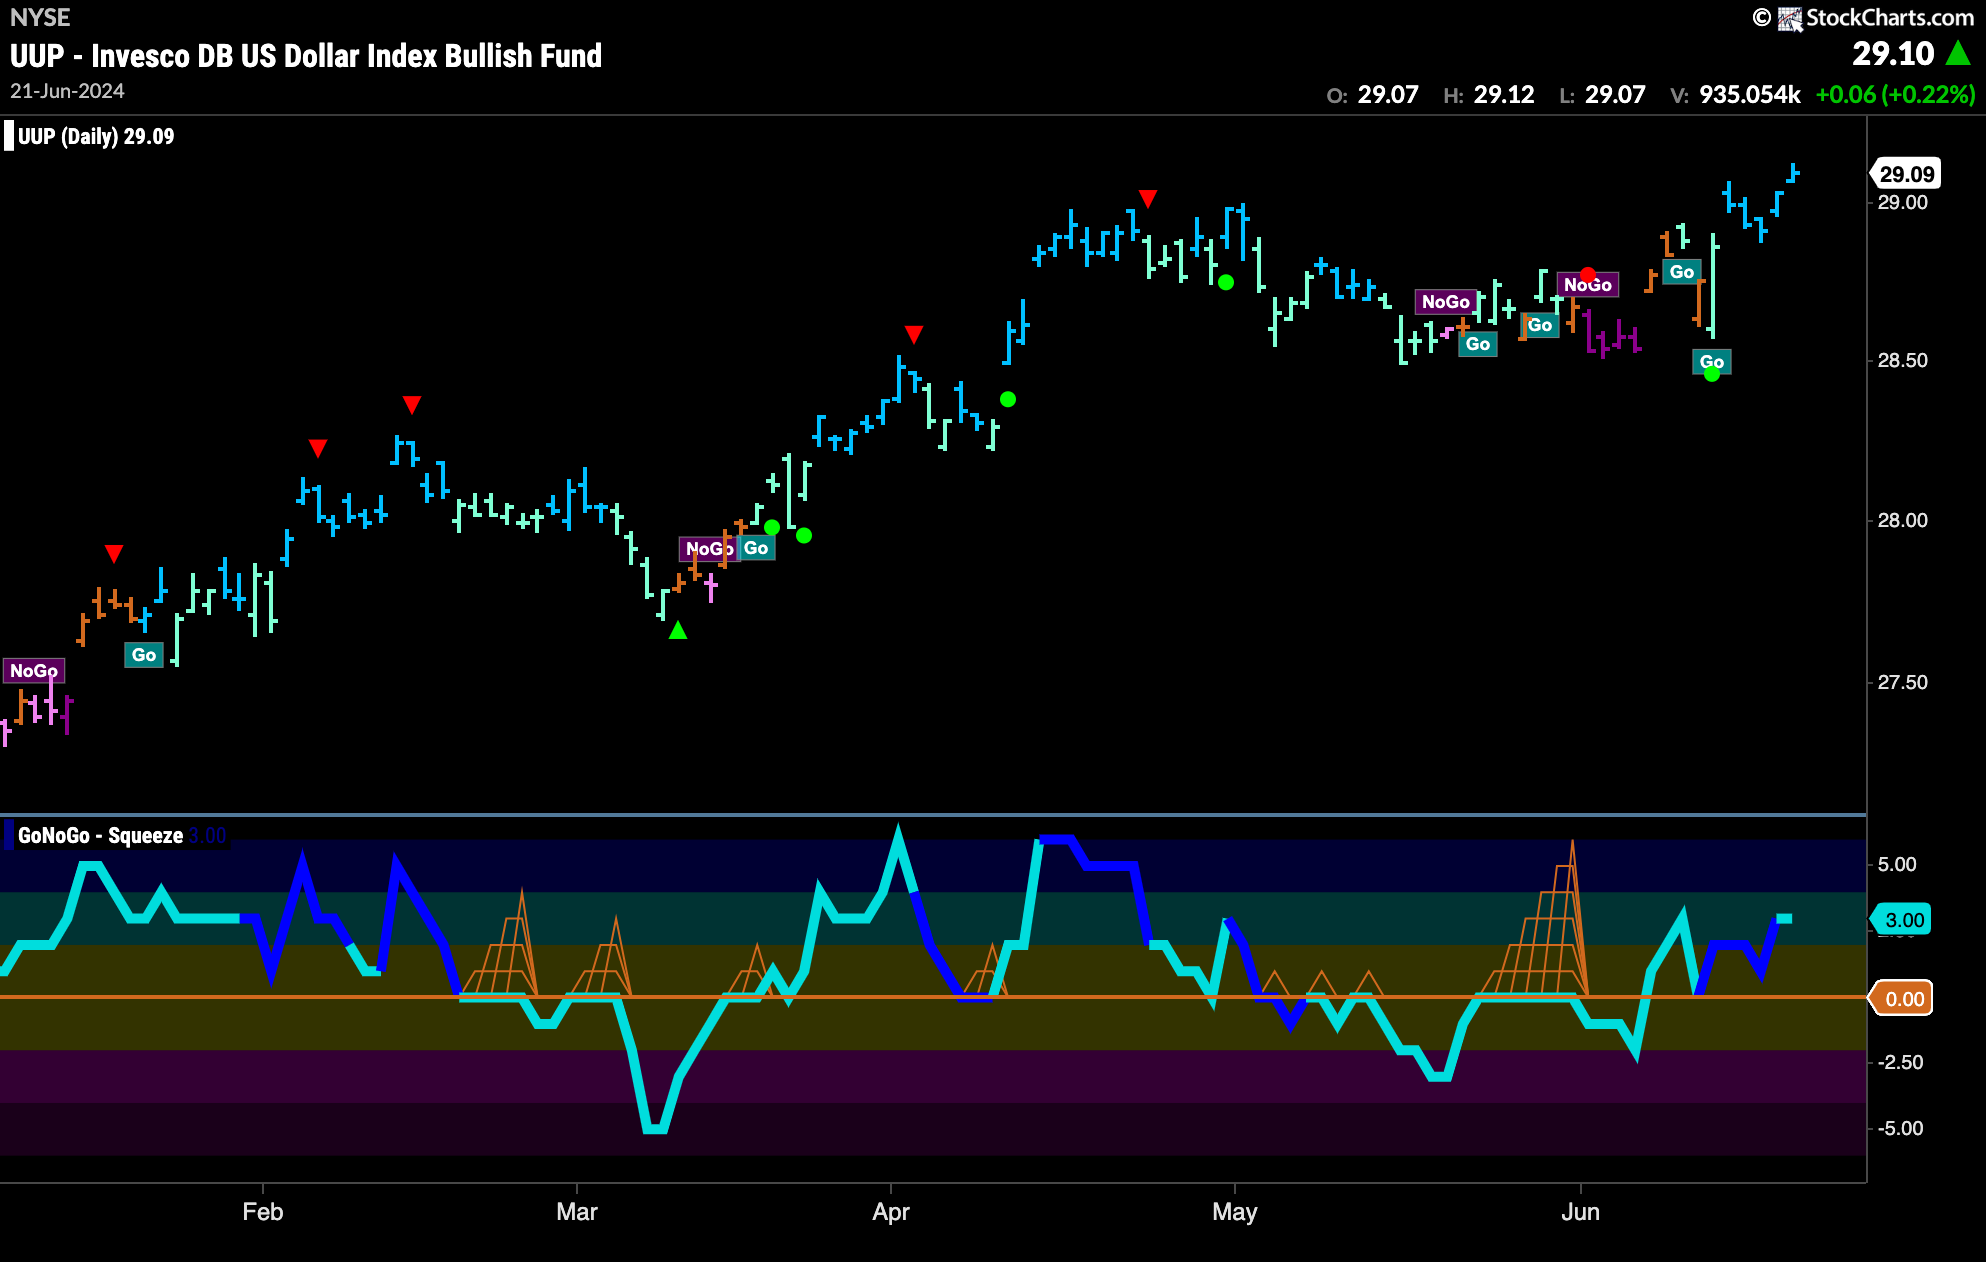
Last week we saw a bullish engulfing pattern end the week on a fresh aqua “Go” bar with price again making a new higher high this week on strong blue bars. This comes as GoNoGo Oscillator appears to have solidified its position in positive territory and is moving further into positive territory at a value of 3.
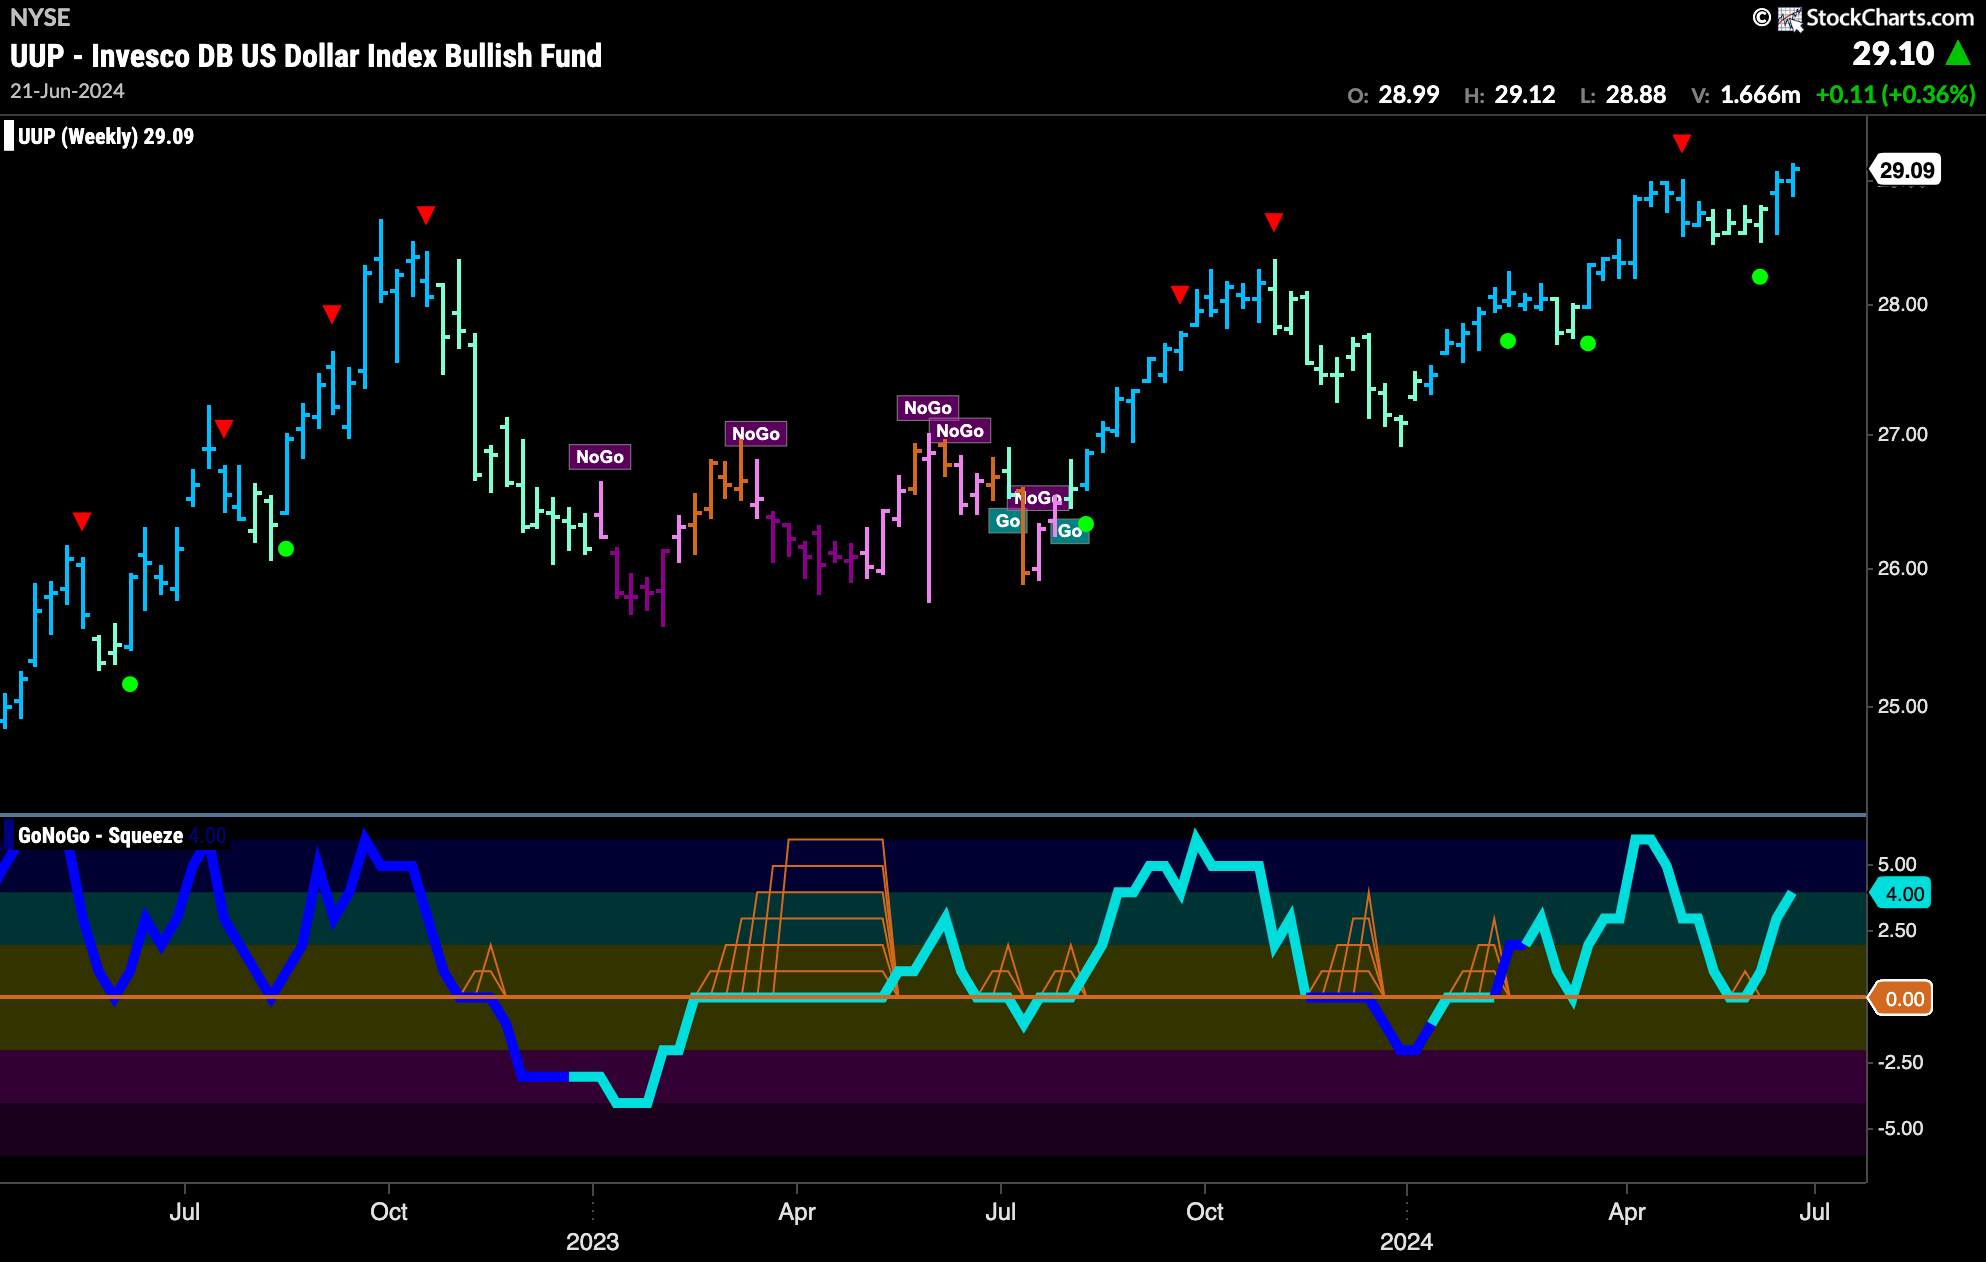
The weekly chart shows continued strength with the latest bar painted strong blue and price at a new slightly higher high. We can see that price is now staying above highs from earlier in the chart. GoNoGo Oscillator has bounced off the zero line and is back in positive territory. With momentum rising and in the direction of the underlying trend we will look to see if price can go higher still.
Oil in New “Go” Trend
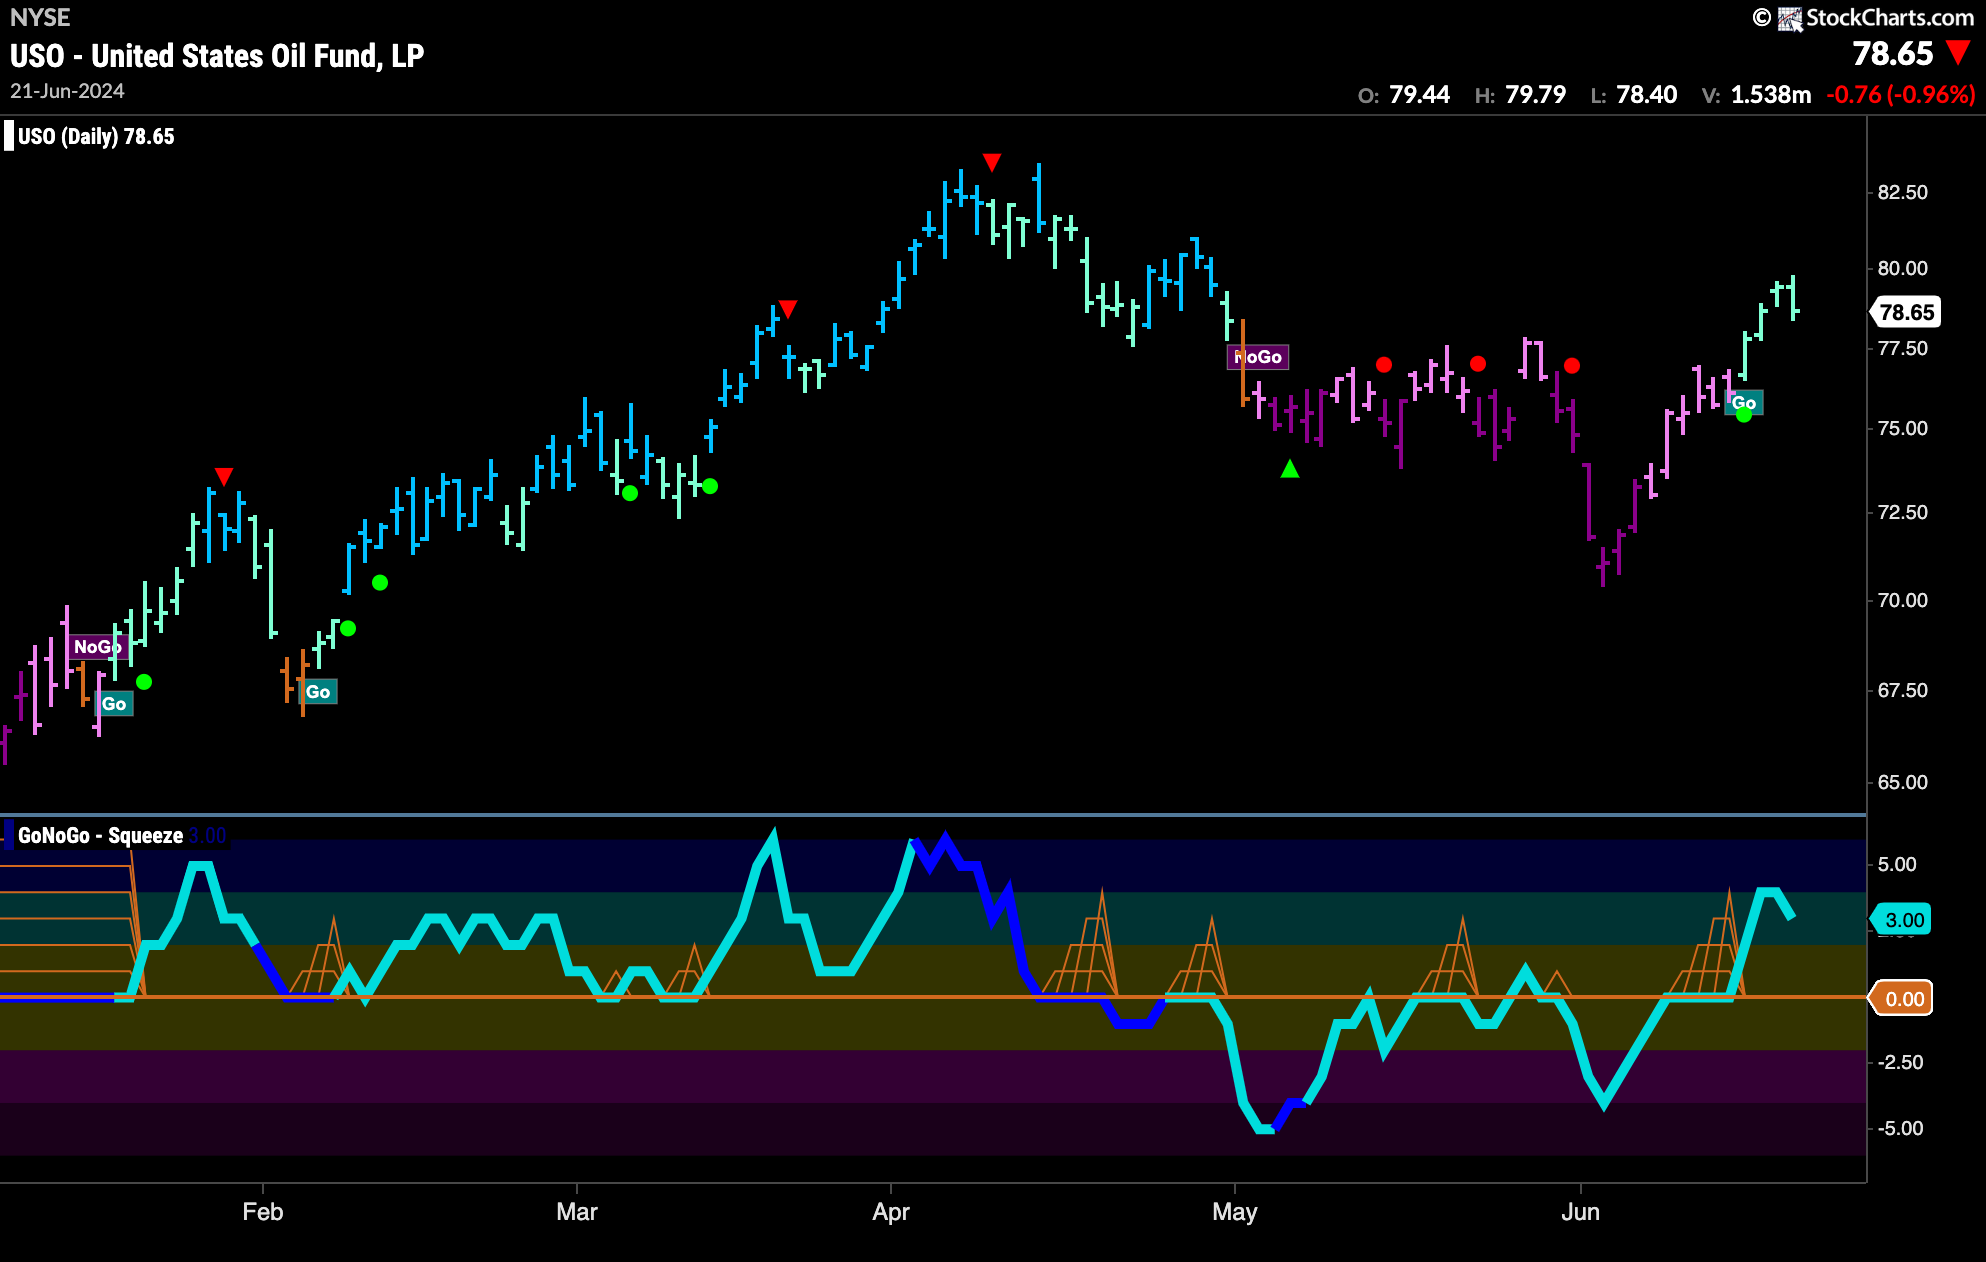
We saw a new “Go” trend this week as price continued its rally off the lows. Price barely slowed down after hitting an area that could have presented some resistance and we now see price clearly above May’s congestion area. GoNoGo Oscillator rode the zero line for a few bars prior to breaking into positive territory. Now we see momentum in positive territory confirming the new “Go” trend.
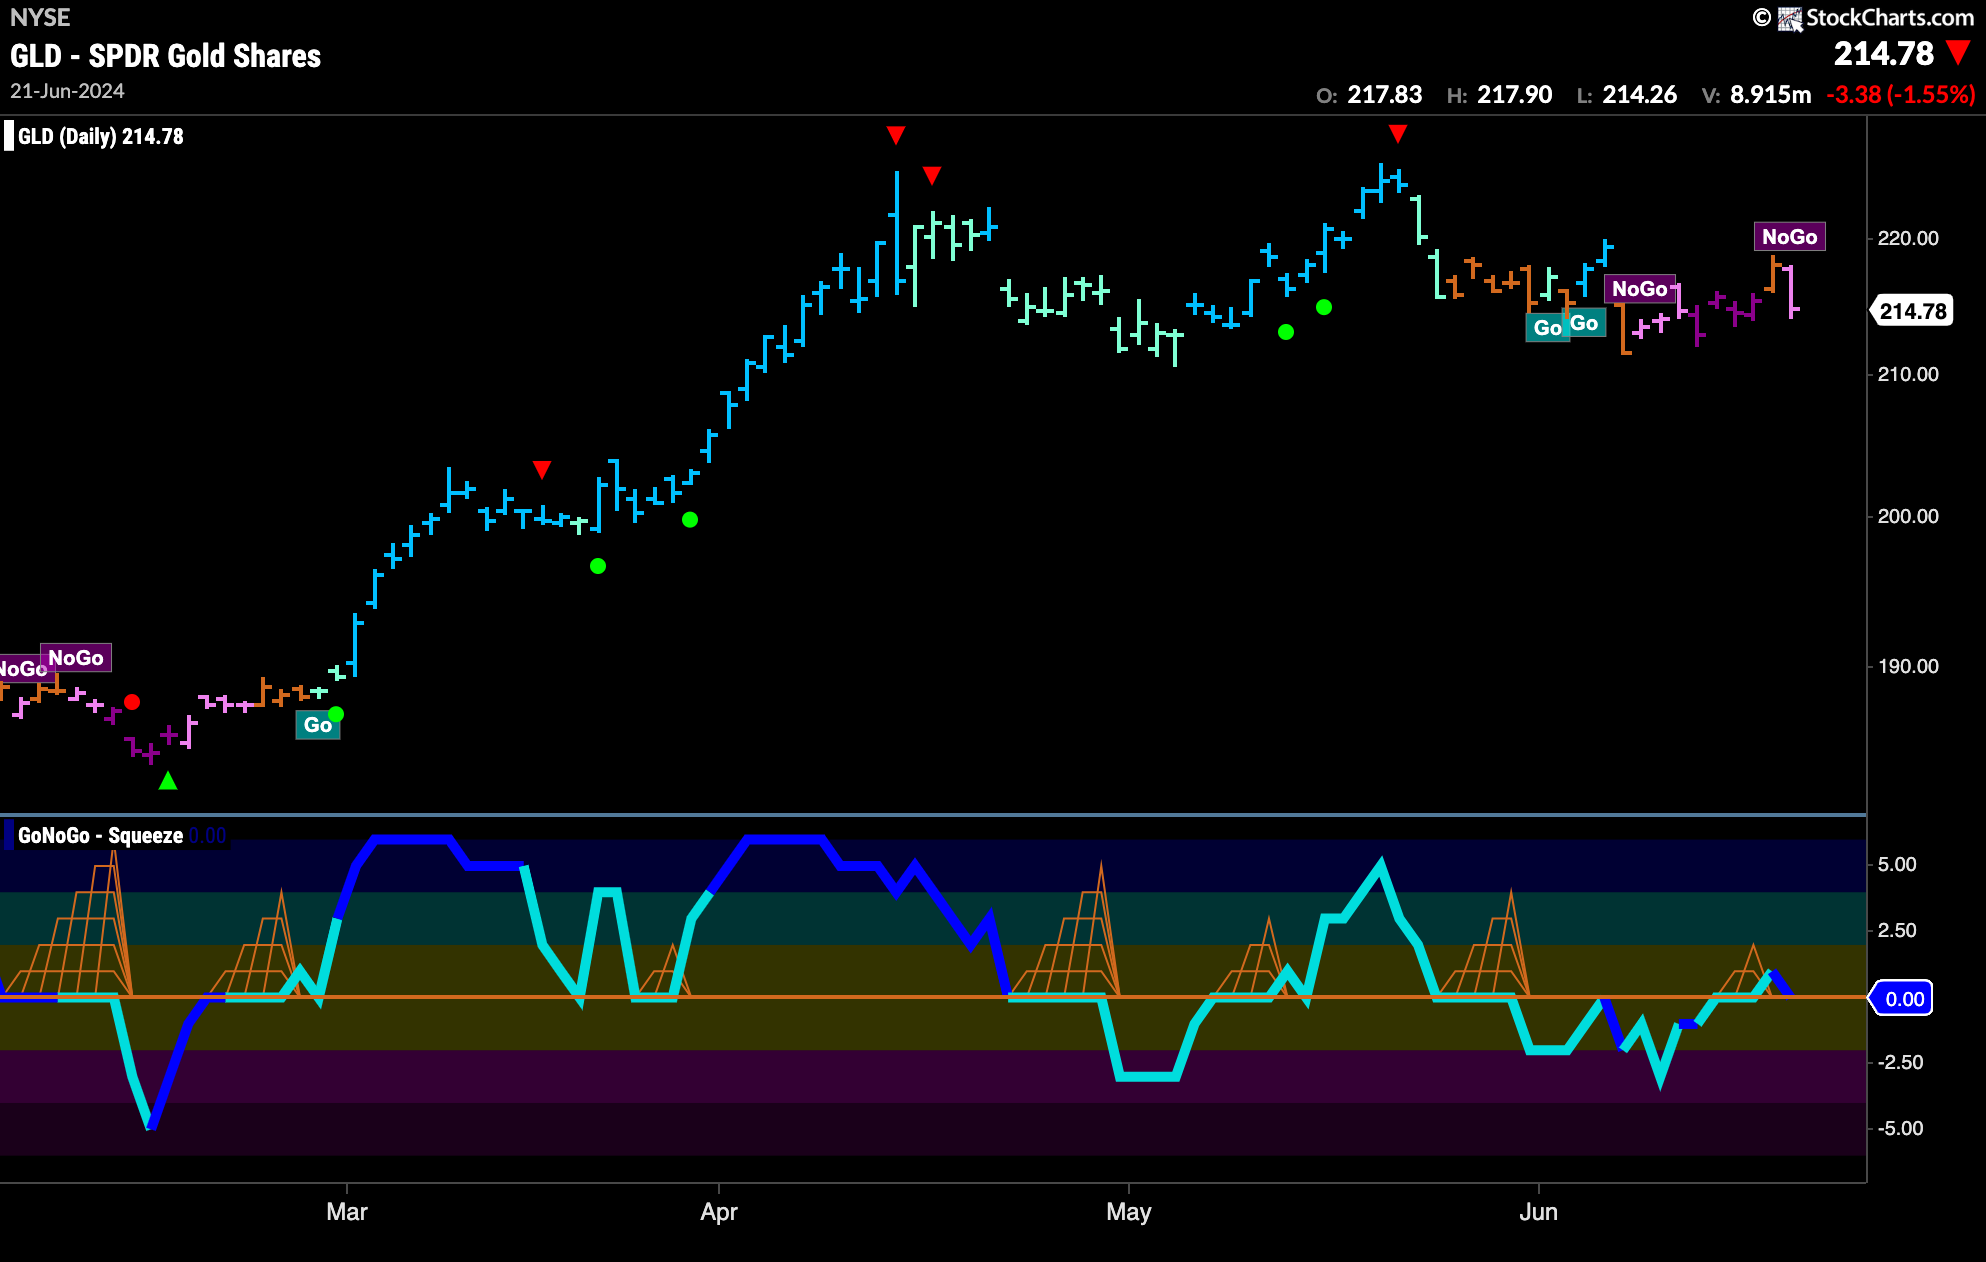
Gold Returns to a “NoGo” Trend
After one amber “Go Fish” bar that represented some market uncertainty as to the direction of the trend, we saw the GoNoGo Trend indicator return to paint a pink “NoGo” bar. This looks to have been a rejection at levels seen earlier in the chart. GoNoGo Oscillator after dipping its nose into positive territory has now returned immediately to test the zero line from above. We will watch to see in which direction momentum moves next.
Sector RelMap
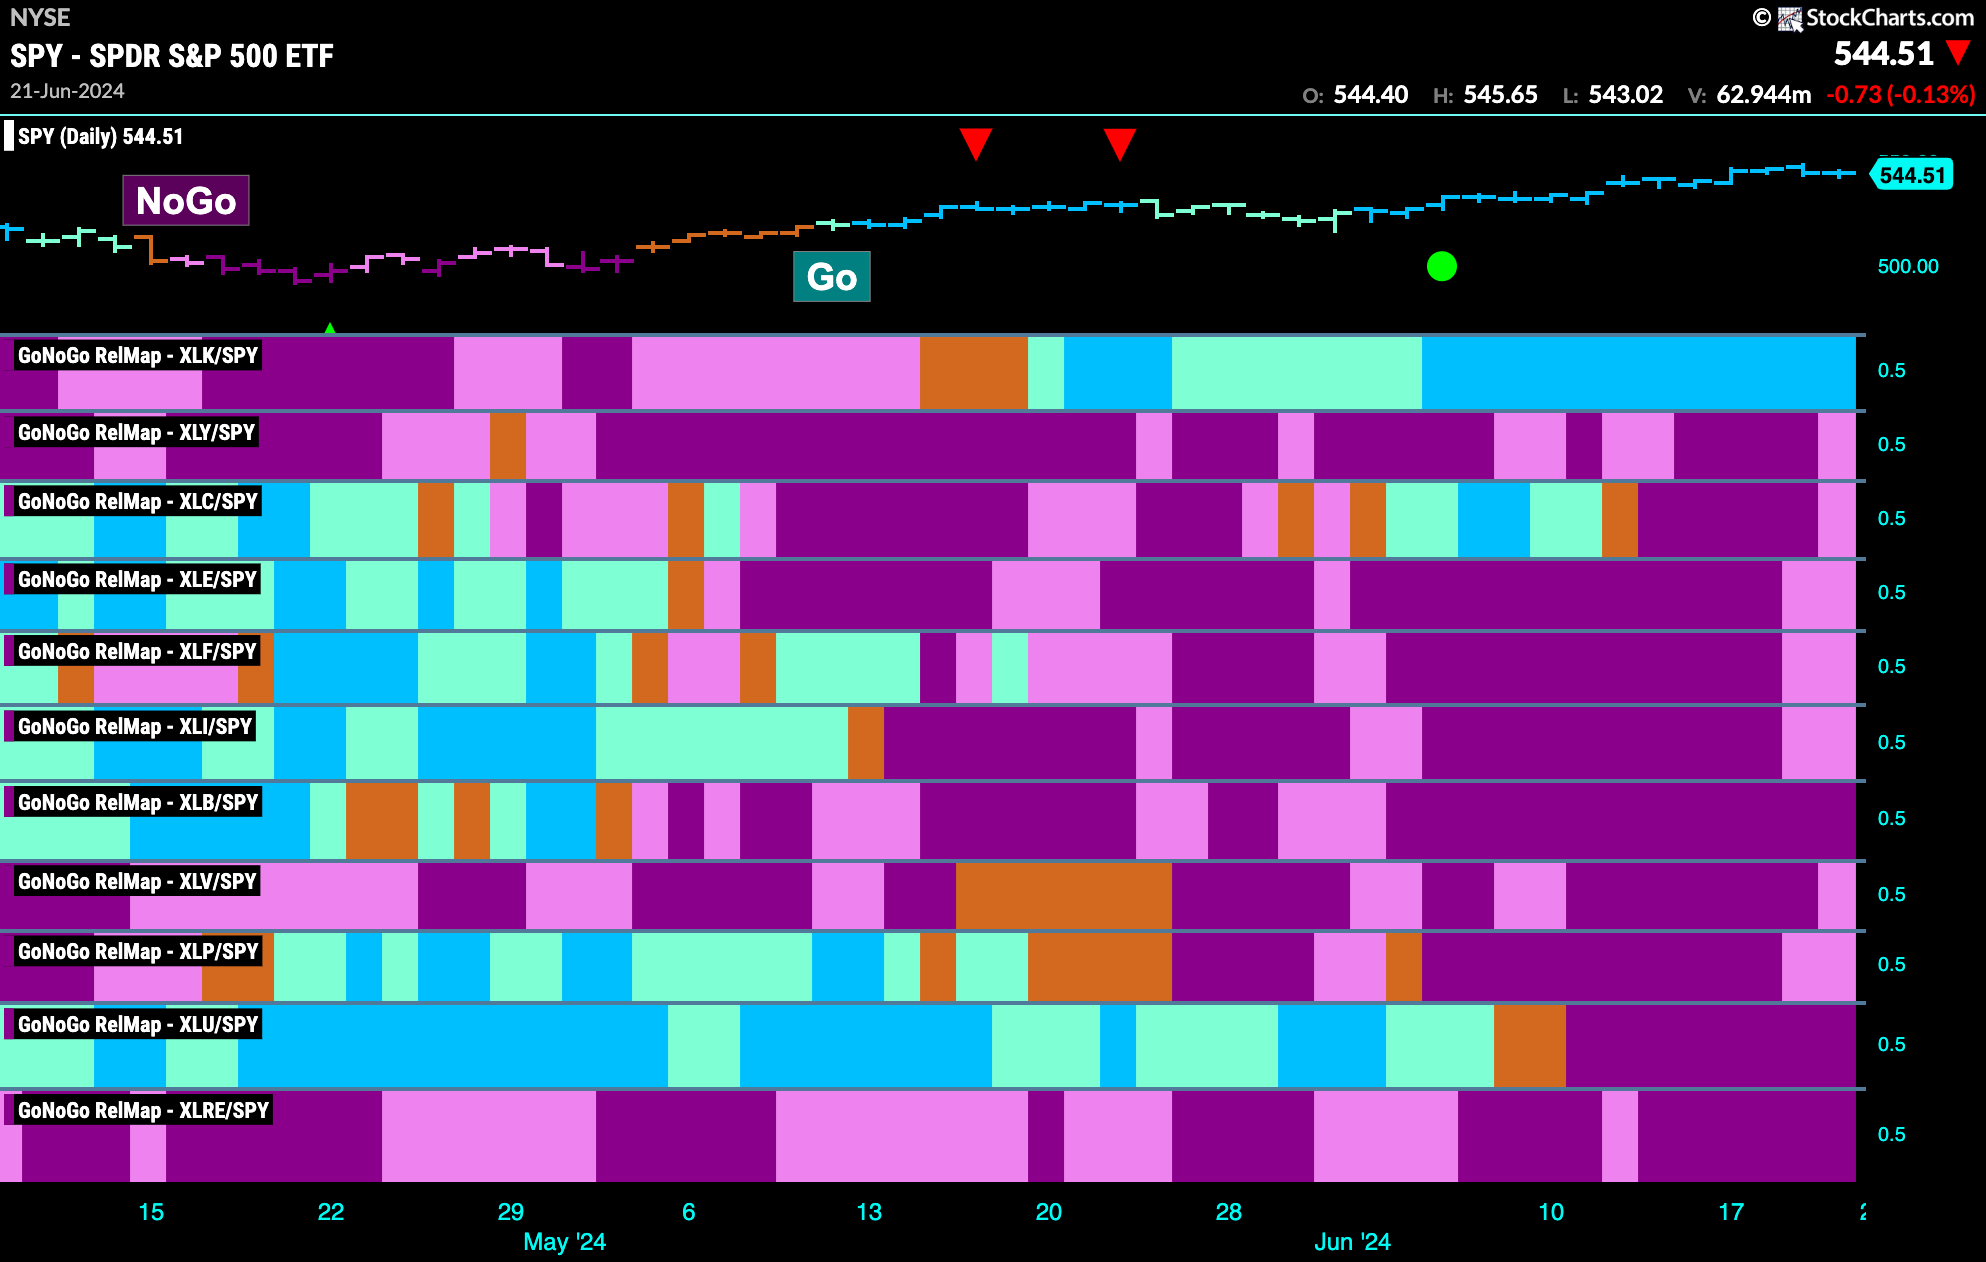
Below is the GoNoGo Sector RelMap. This GoNoGo RelMap applies the GoNoGo Trend to the relative strength ratios of the sectors to the base index. Looking at the map, we can see that only 1 sector is outperforming the base index this week. $XLK, is painting relative “Go” bars.
Technology Sub-Group RelMap
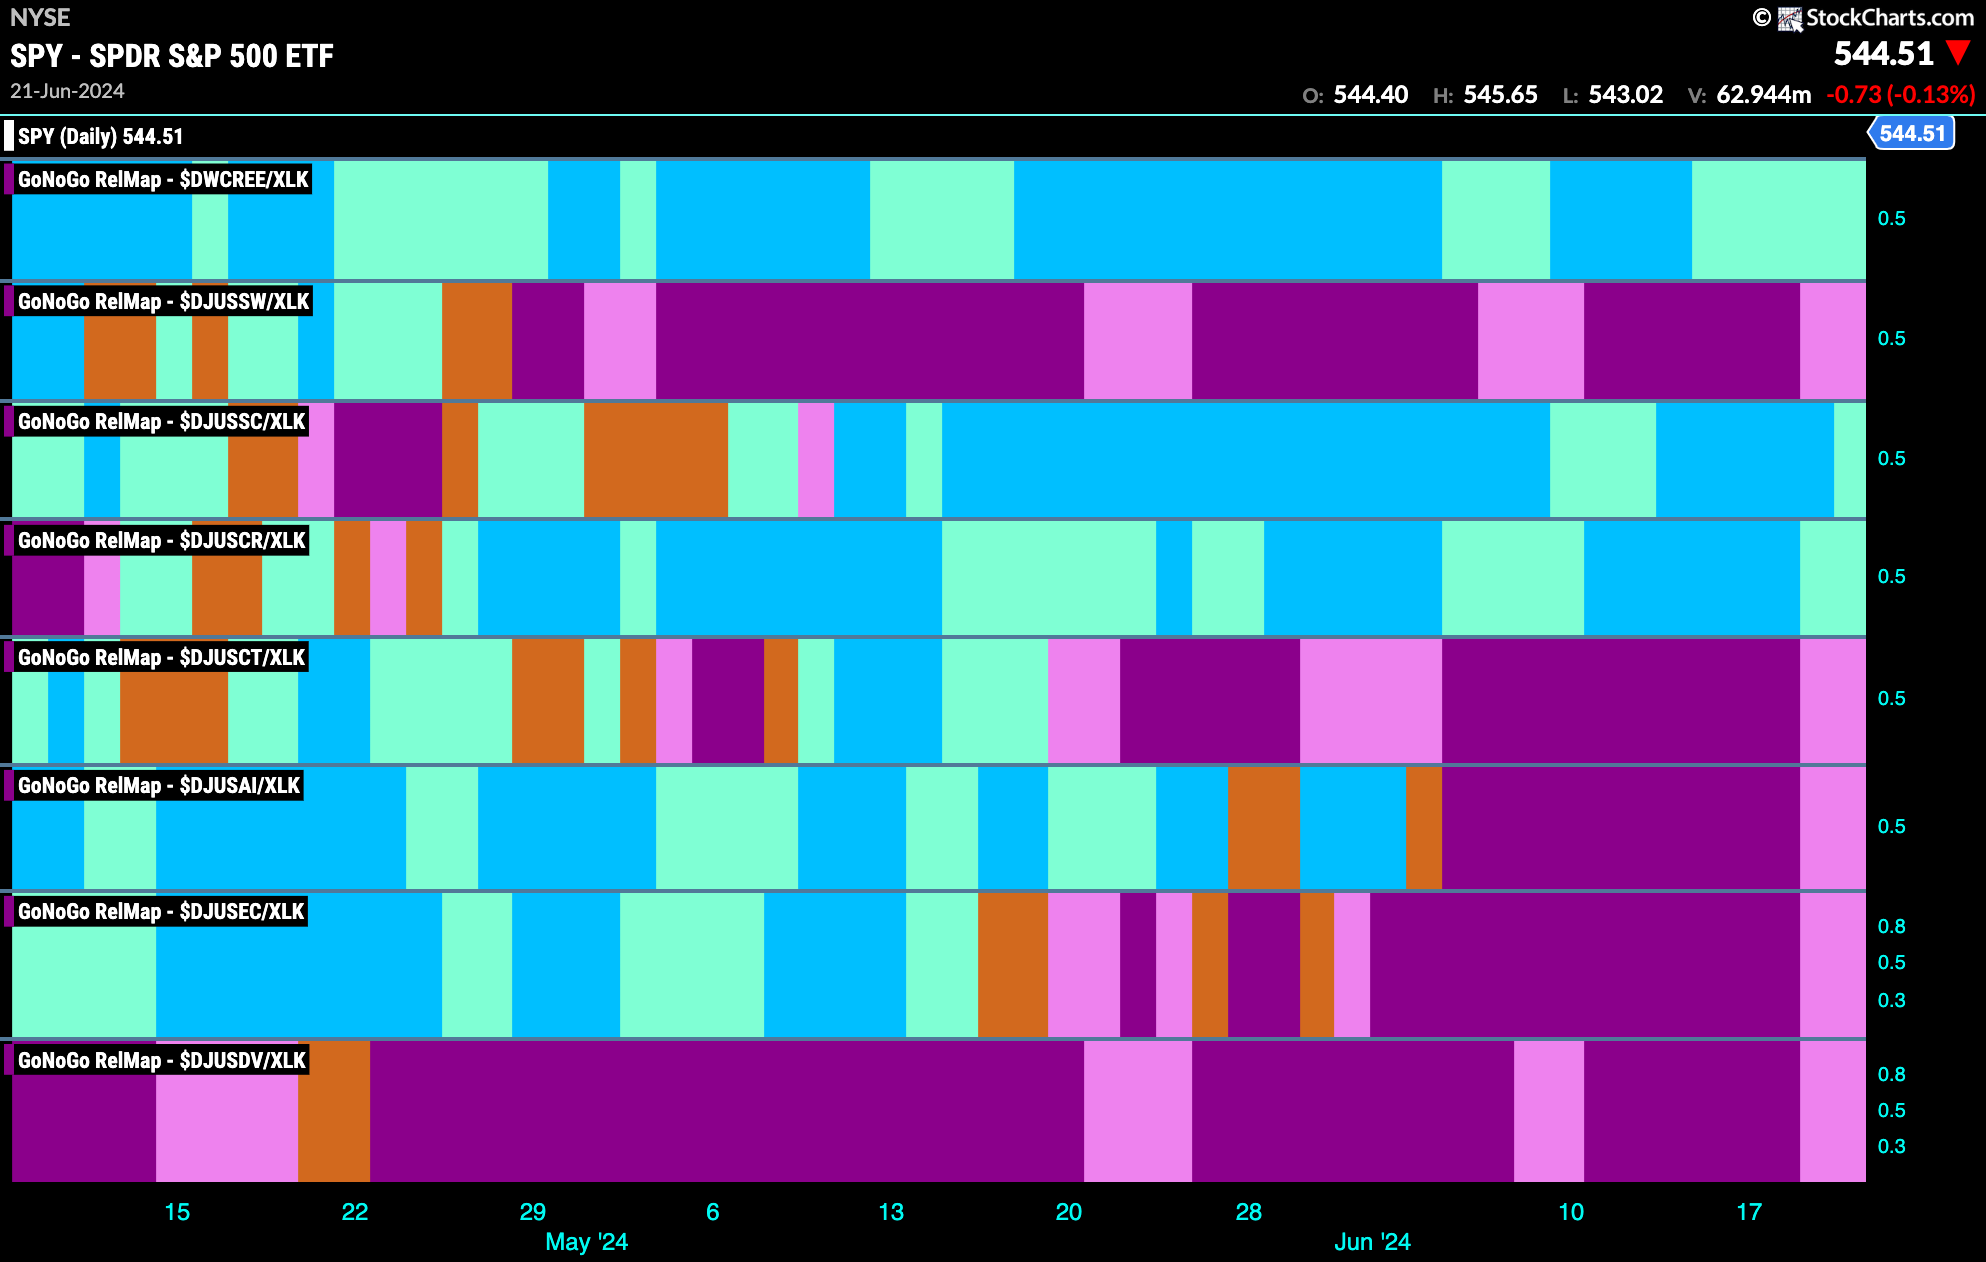
Another week where we see that the technology sector is the only out-performing sector on a relative basis. As we saw in the Sector RelMap above, GoNoGo Trend is painting strong blue “Go” bars for technology. If we break down the sector further, we see that the leadership comes from the same three sub groups this week. Renewable energy, semiconductors, and computer hardware are in relative “Go” trends painting aqua bars.
$SMCI Breaking to New Highs
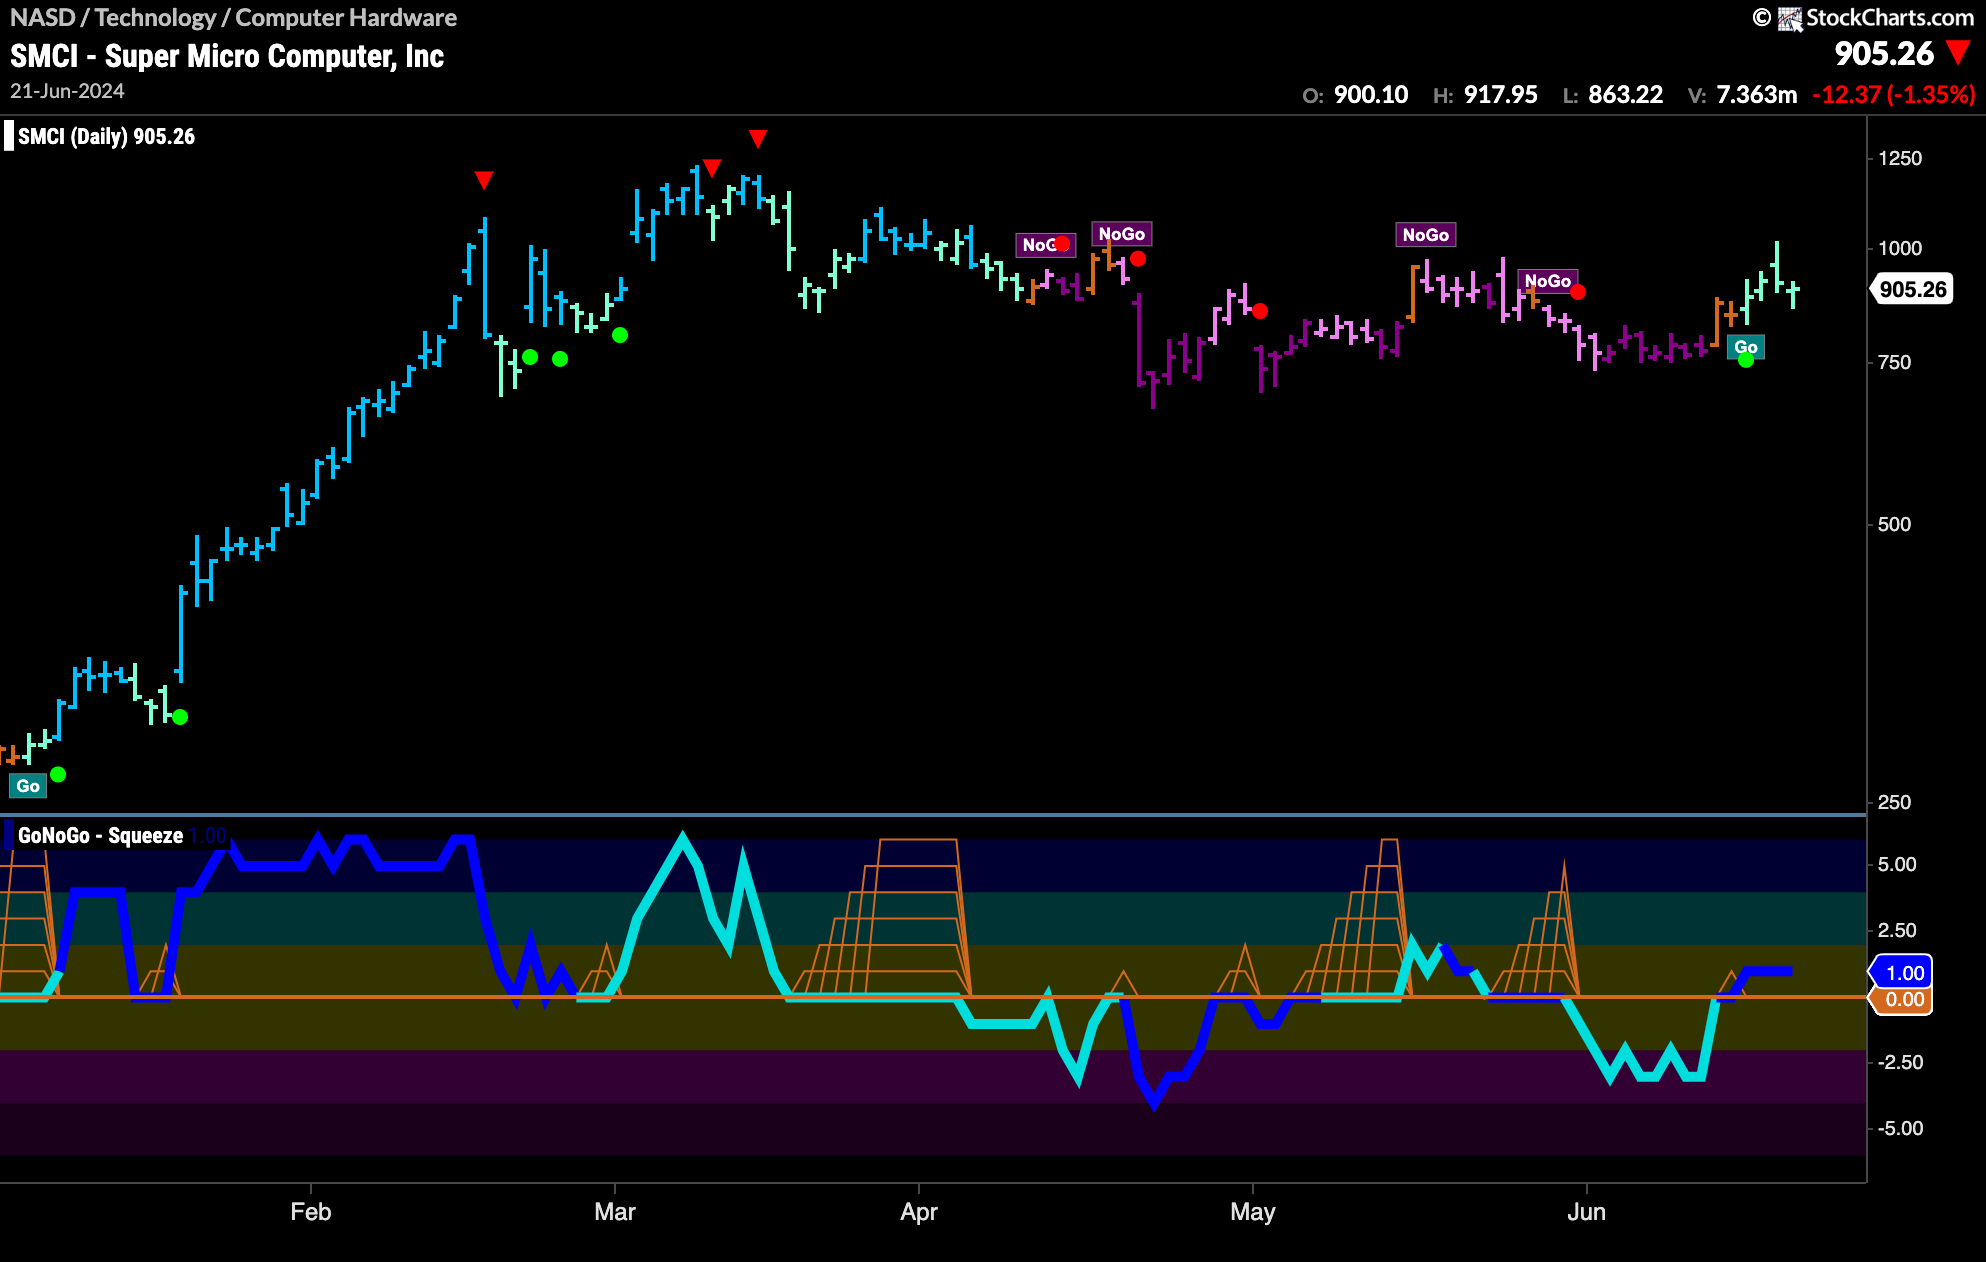
$SMCI is a security in the computer hardware sub group of the technology sector. We can see that this past week saw a new “Go” trend emerge after a couple of amber “Go Fish” bars and an inability to set a new lower low while in the previous “NoGo” trend. GoNoGo Oscillator also was able to break above the zero line and volume was heavy this week. With momentum on the side of the new “Go” trend we will look to see if price can make a new higher high.
$WDC Looks for Trend Continuation
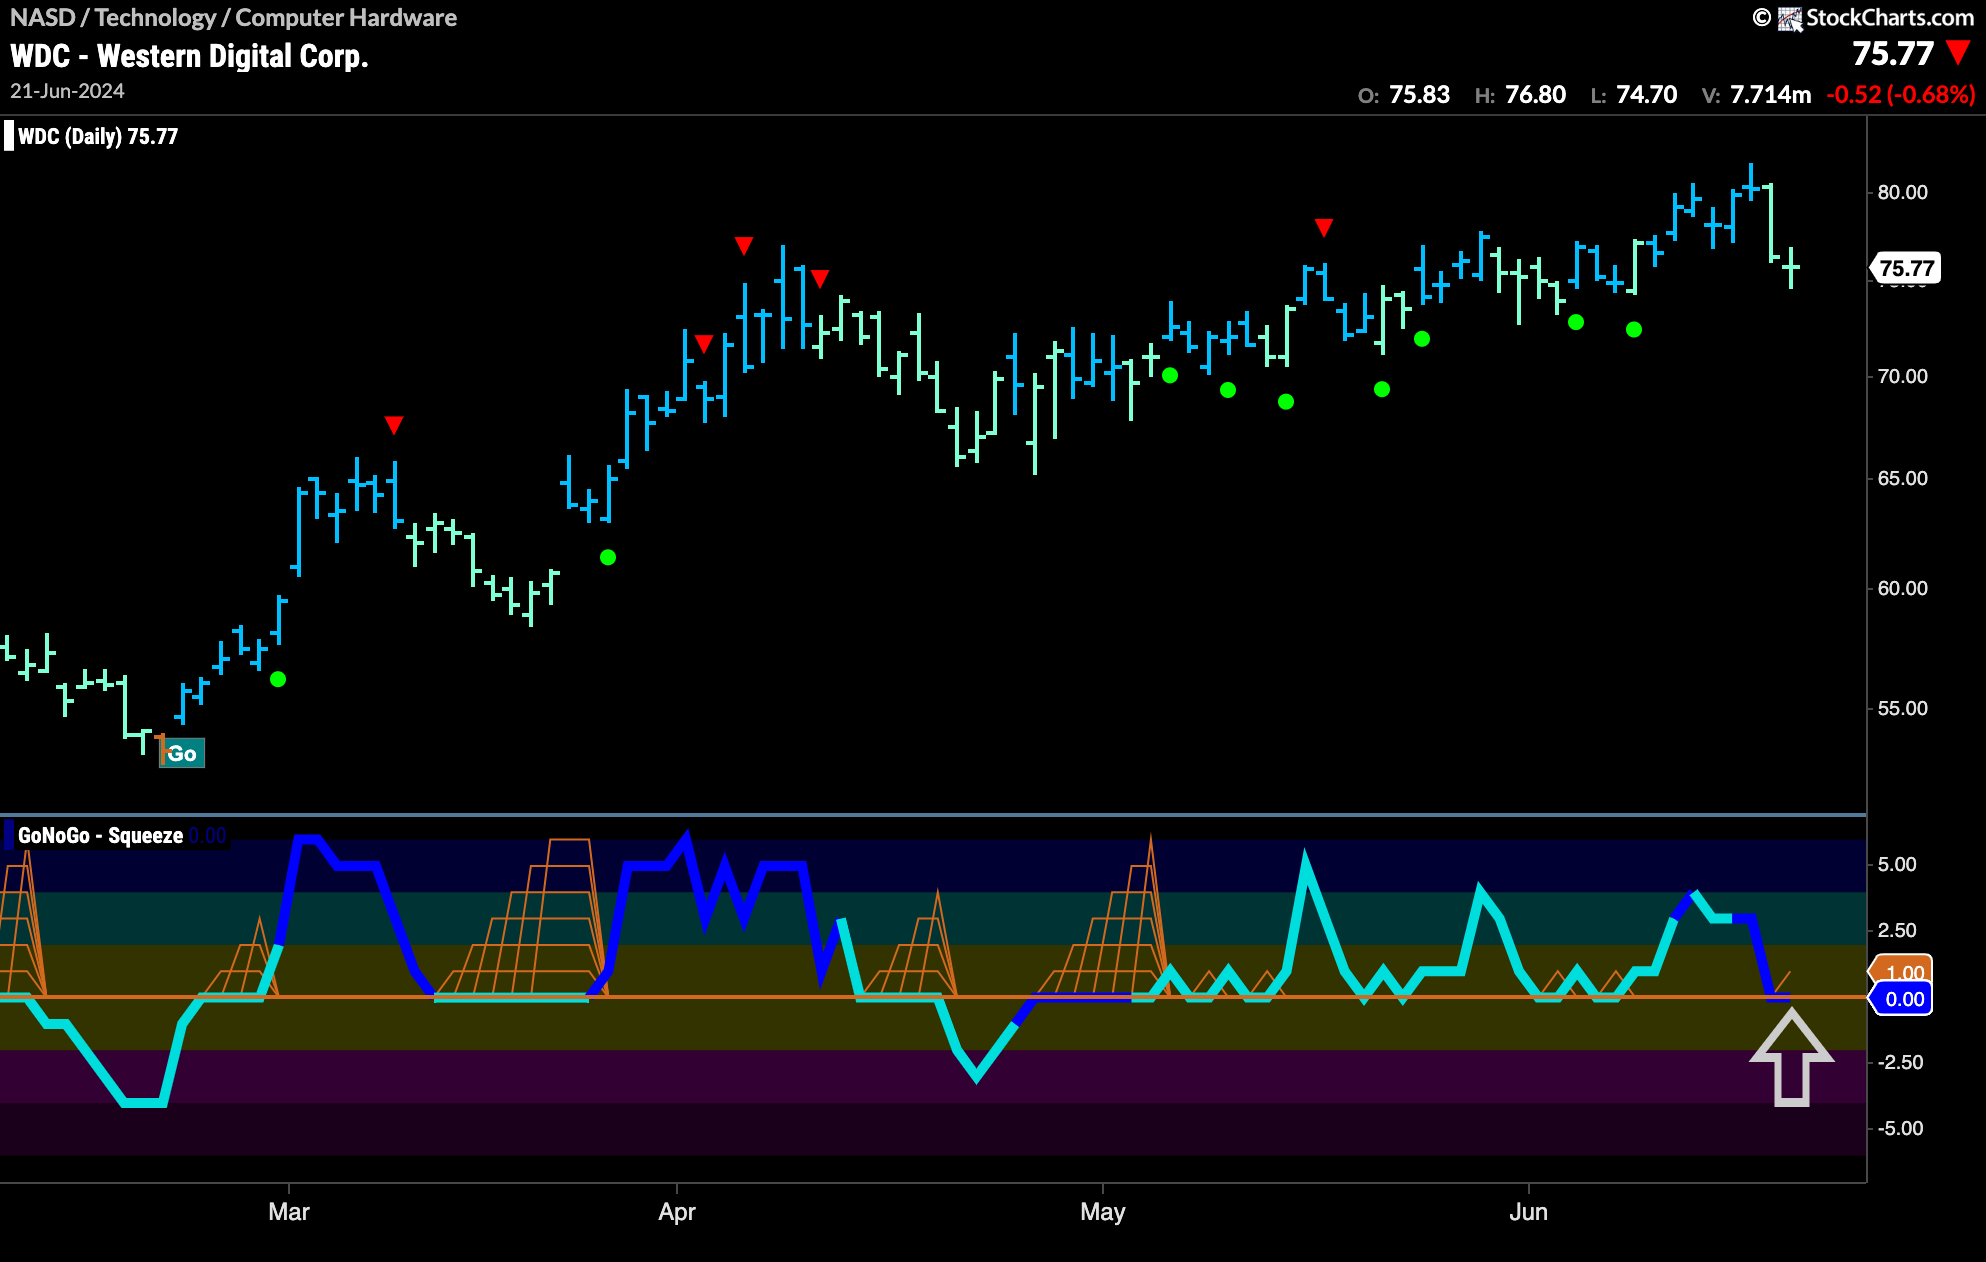
Western Digital Corp has been in a “Go” trend for several months. We have seen very consistent price movement higher as GoNoGo Oscillator has held support at the zero line over and over again. As GoNoGo Trend paints weaker aqua “Go” bars the oscillator has fallen to test the zero level once again. We will pay attention to see if this level holds once again. If it does, and we see the oscillator bounce back into positive territory we will see a Go Trend Continuation Icon (green circle) under the price bar. We will then be able to say that momentum is resurgent in the direction of the “Go” trend.
