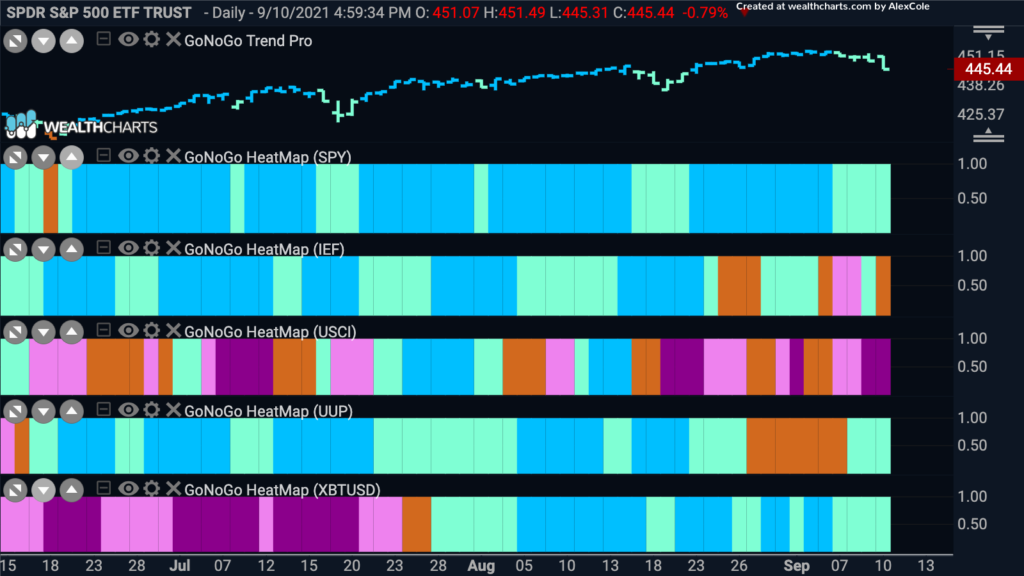
Good morning and welcome to this week’s Flight Path. Let’s take a look at the below GoNoGo Asset Map for this week. As we can see, the trend is still a “Go” in U.S. equities. However, we saw several paler aqua bars in succession as price fell away from the high and we will watch to see if this is just a short term counter trend correction or the start of something more. We see also that treasury prices continue to struggle to hold a trend, ending the week with an amber “Go Fish” bar having even seen “NoGo” bars earlier. Commodities, represented by the $USCI seem to have settled into a “NoGo” for the time being. The dollar has also rebounded this week, painting pale aqua bars which in theory could put pressure on equity prices.
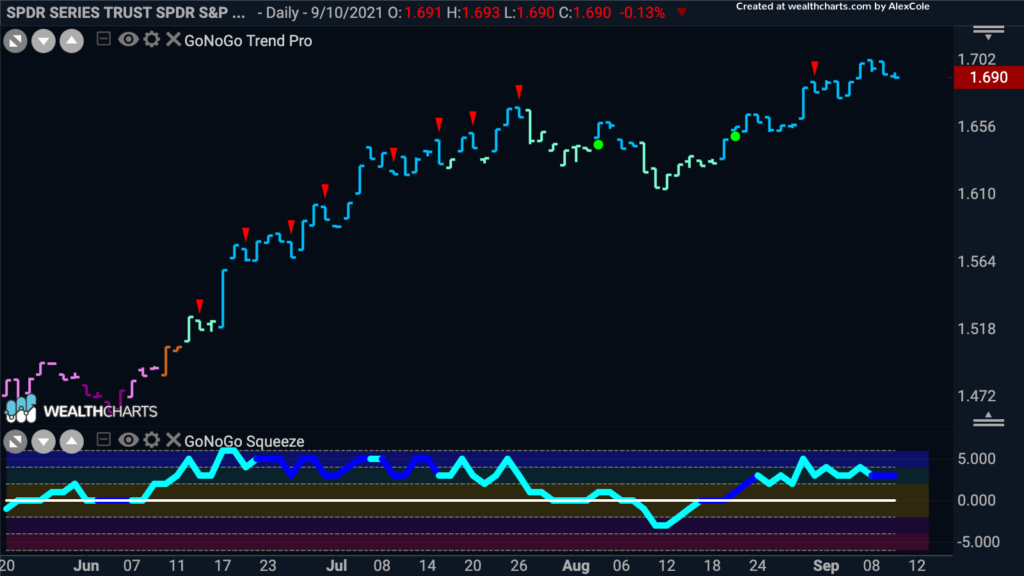
Growth Continues to Outpace Value
This is a theme that will be interesting to watch play out. Growth, usually associated with bullish market environments, continues to out perform value even in the face of some bearish talk in financial circles lately. We are living in a different time though where pandemic concerns over the new variant can cause certain unlikely sectors to see gains. For example, technology and communications sector stocks are likely to thrive as they did in 2020 and are traditionally growth stocks.
Sector Leadership
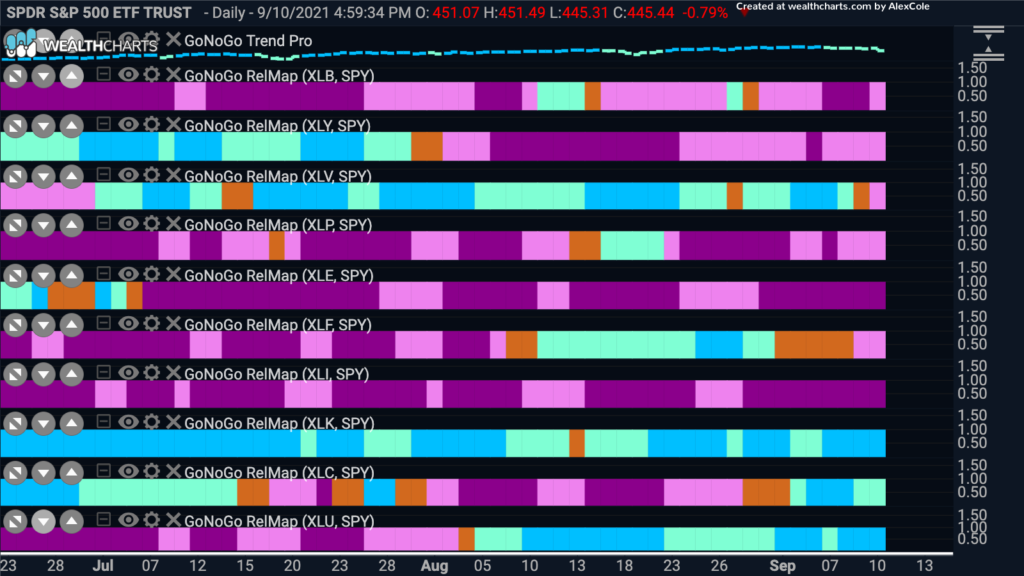
Below is a GoNoGo Sector RelMap. The chart applies the GoNoGo Trend to the relative ratio of each sector ETF to the base ETF, the $SPY. As you’d expect from the previous comments, we see that there are three sectors outperforming the index to end the week. Technology ($XLK), communications ($XLC) and utilities ($XLU). Utilities, a defensive sector, continuing with its “Go” trend is not a surprise either given the concerns over the delta variant and debate over raising the debt ceiling.
Technology Time Again?
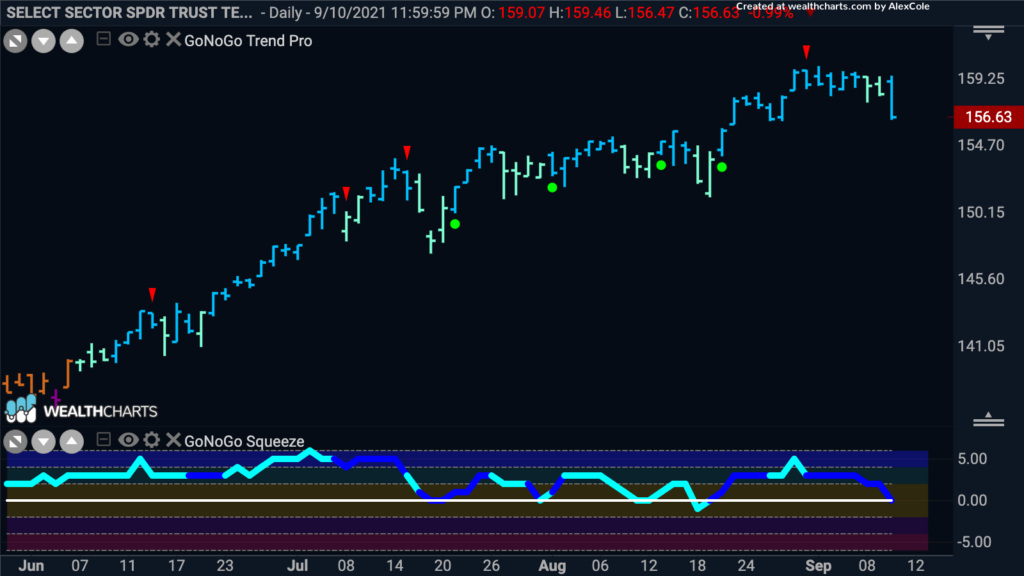
The pure GoNoGo Trend chart of the technology sector, $XLK, shows a strong uninterrupted “Go” trend that has been in place for months. What is interesting at this point, is that we appear to be at a point of presumed support. As price has consolidated mostly sideways from the most recent high, picked out by the red countertrend correction arrow, the GoNoGo Oscillator has fallen to the zero line on heavy volume. We will watch to see if finds support here as it has done several times before. If this happens, we will know that momentum is returning in the direction of the “Go” trend.
CDK Global Tries to Test Gap Resistance
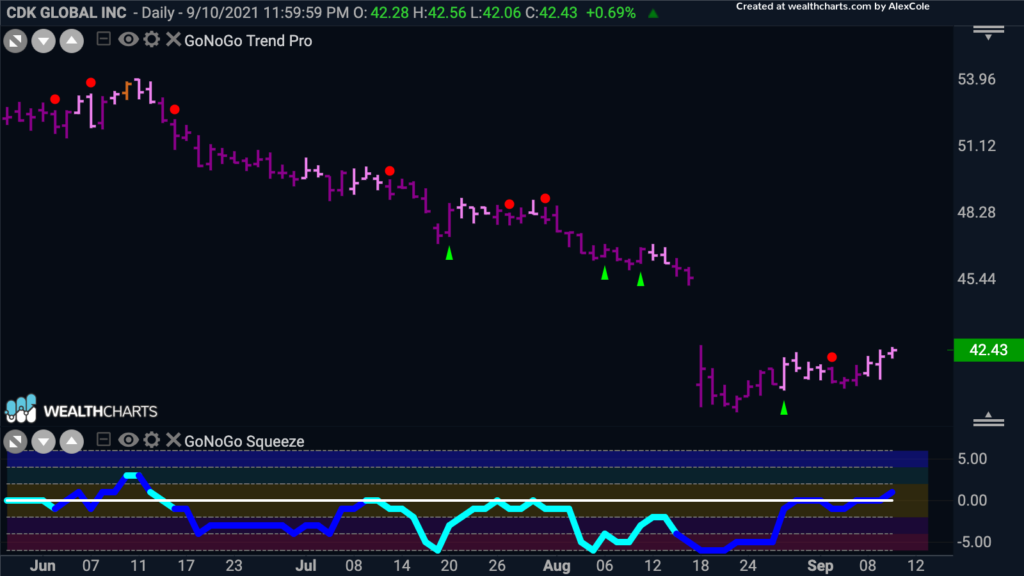
$CDK is an integrated data and technology solutions provide to automotive and heavy industries. If Technology is to continue in its “Go” trend, will CDK finally be able to break out of the “NoGo” trend that it has been in. There are some important points to note about the chart below. Price has made its first higher low and has rallied to the resistance level of lower bound of the gap down from mid August. We know that this may be resistance but we also know that gaps are typically filled. The GoNoGo Oscillator has also risen quickly to the zero line from below on heavy volume and has even been able to slightly break above that level in to positive territory.
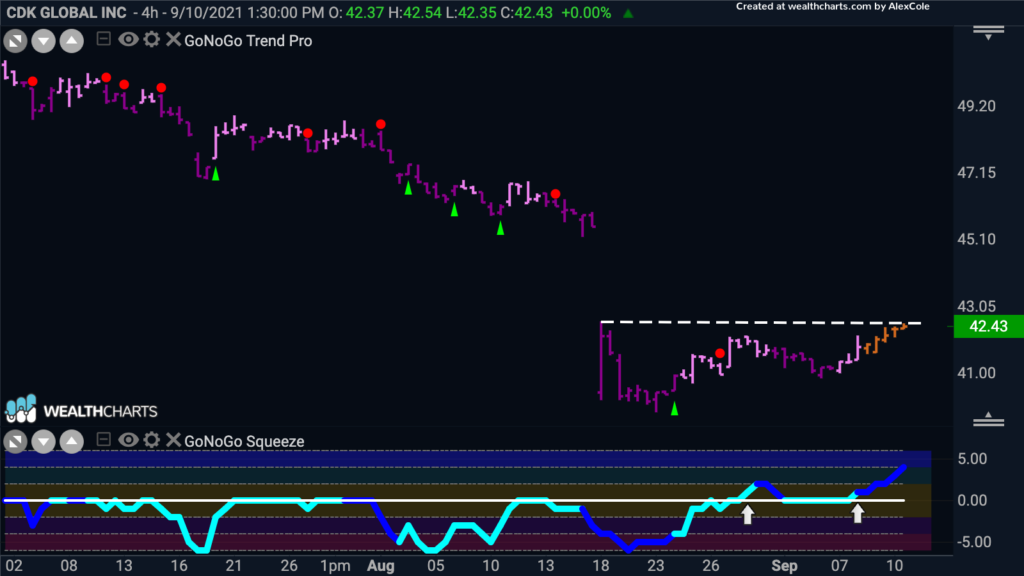
If we look at a shorter time frame there are some more encouraging signs. The below chart is a GoNoGo Chart using 4hr closing prices. Toward the right side of the pattern, in this case an ascending triangle, the GoNoGo Oscillator broke above zero and found support at that level as price made a higher low. Now, ,as the oscillator rallies into positive territory on heavy volume we see that the GoNoGo Trend has painted a series of amber “Go Fish” bars as price approaches the upper bound of the triangle. We will watch to see if price can break above this level and then look for a target at the high of the gap.
Stay with the Crowd?
Crowdstrike holdings is a cybersecurity platform and so perhaps as technology companies goes has a defensive element to it. The below chart is a weekly GoNoGo Chart and you can see that the “Go” trend is well established. The GoNoGo Trend is painting strong blue “Go” bars and the GoNoGo Oscillator has found support at the zero line throughout. We will look to see if this level holds again as support allowing price to make another move higher.
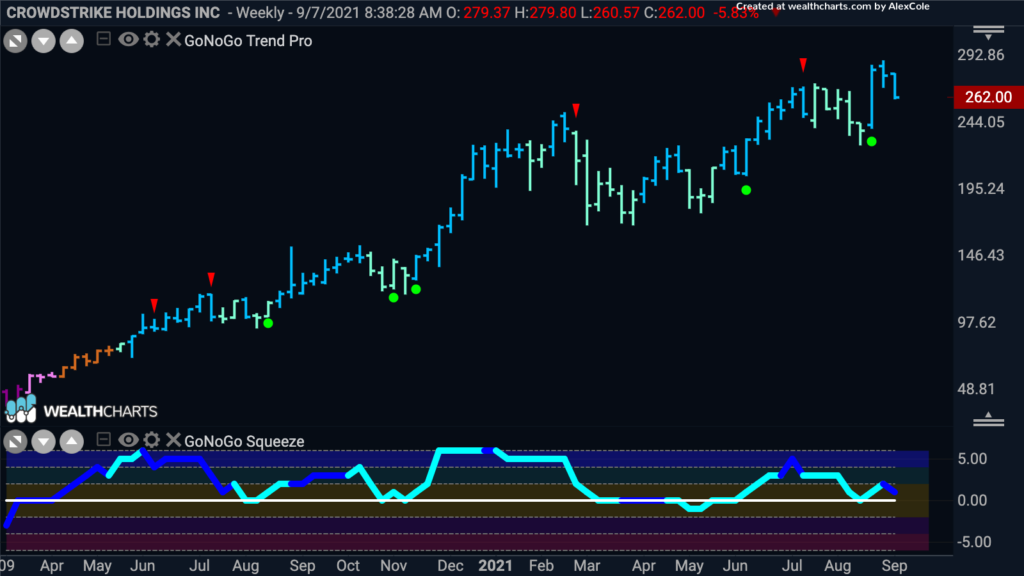
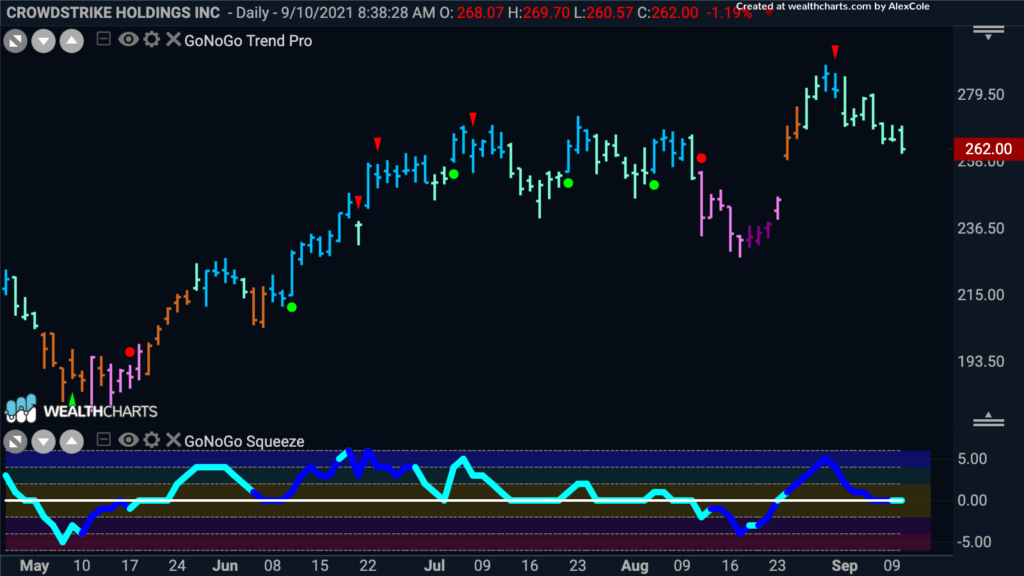
Looking at a daily GoNoGo Chart, we can see that we are in a position to wait for a reason to take action. The “Go” trend is in place, but we have seen weakness as displayed by the paler aqua “Go” bars and this was indicated by the red short term countertrend correction arrow at the end of August. The GoNoGo Oscillator, as you’d expect, has fallen to the zero line with the correction in price. If this “Go” trend is to continue, we will look for the zero line to act as support here and if the oscillator can rally into positive territory we will see a green Go Trend continuation circle appear under the price bar.
