Good morning and welcome to this week’s Flight Path. The uncertainty we saw last week gave way to a resumption of the “NoGo” trend. We saw the week end with pink bars for U.S. equities as investors showed they weren’t ready for a new “Go” to begin. Treasury bond prices remained in a strong “NoGo” trend as we saw continued strength in commodities and the dollar.
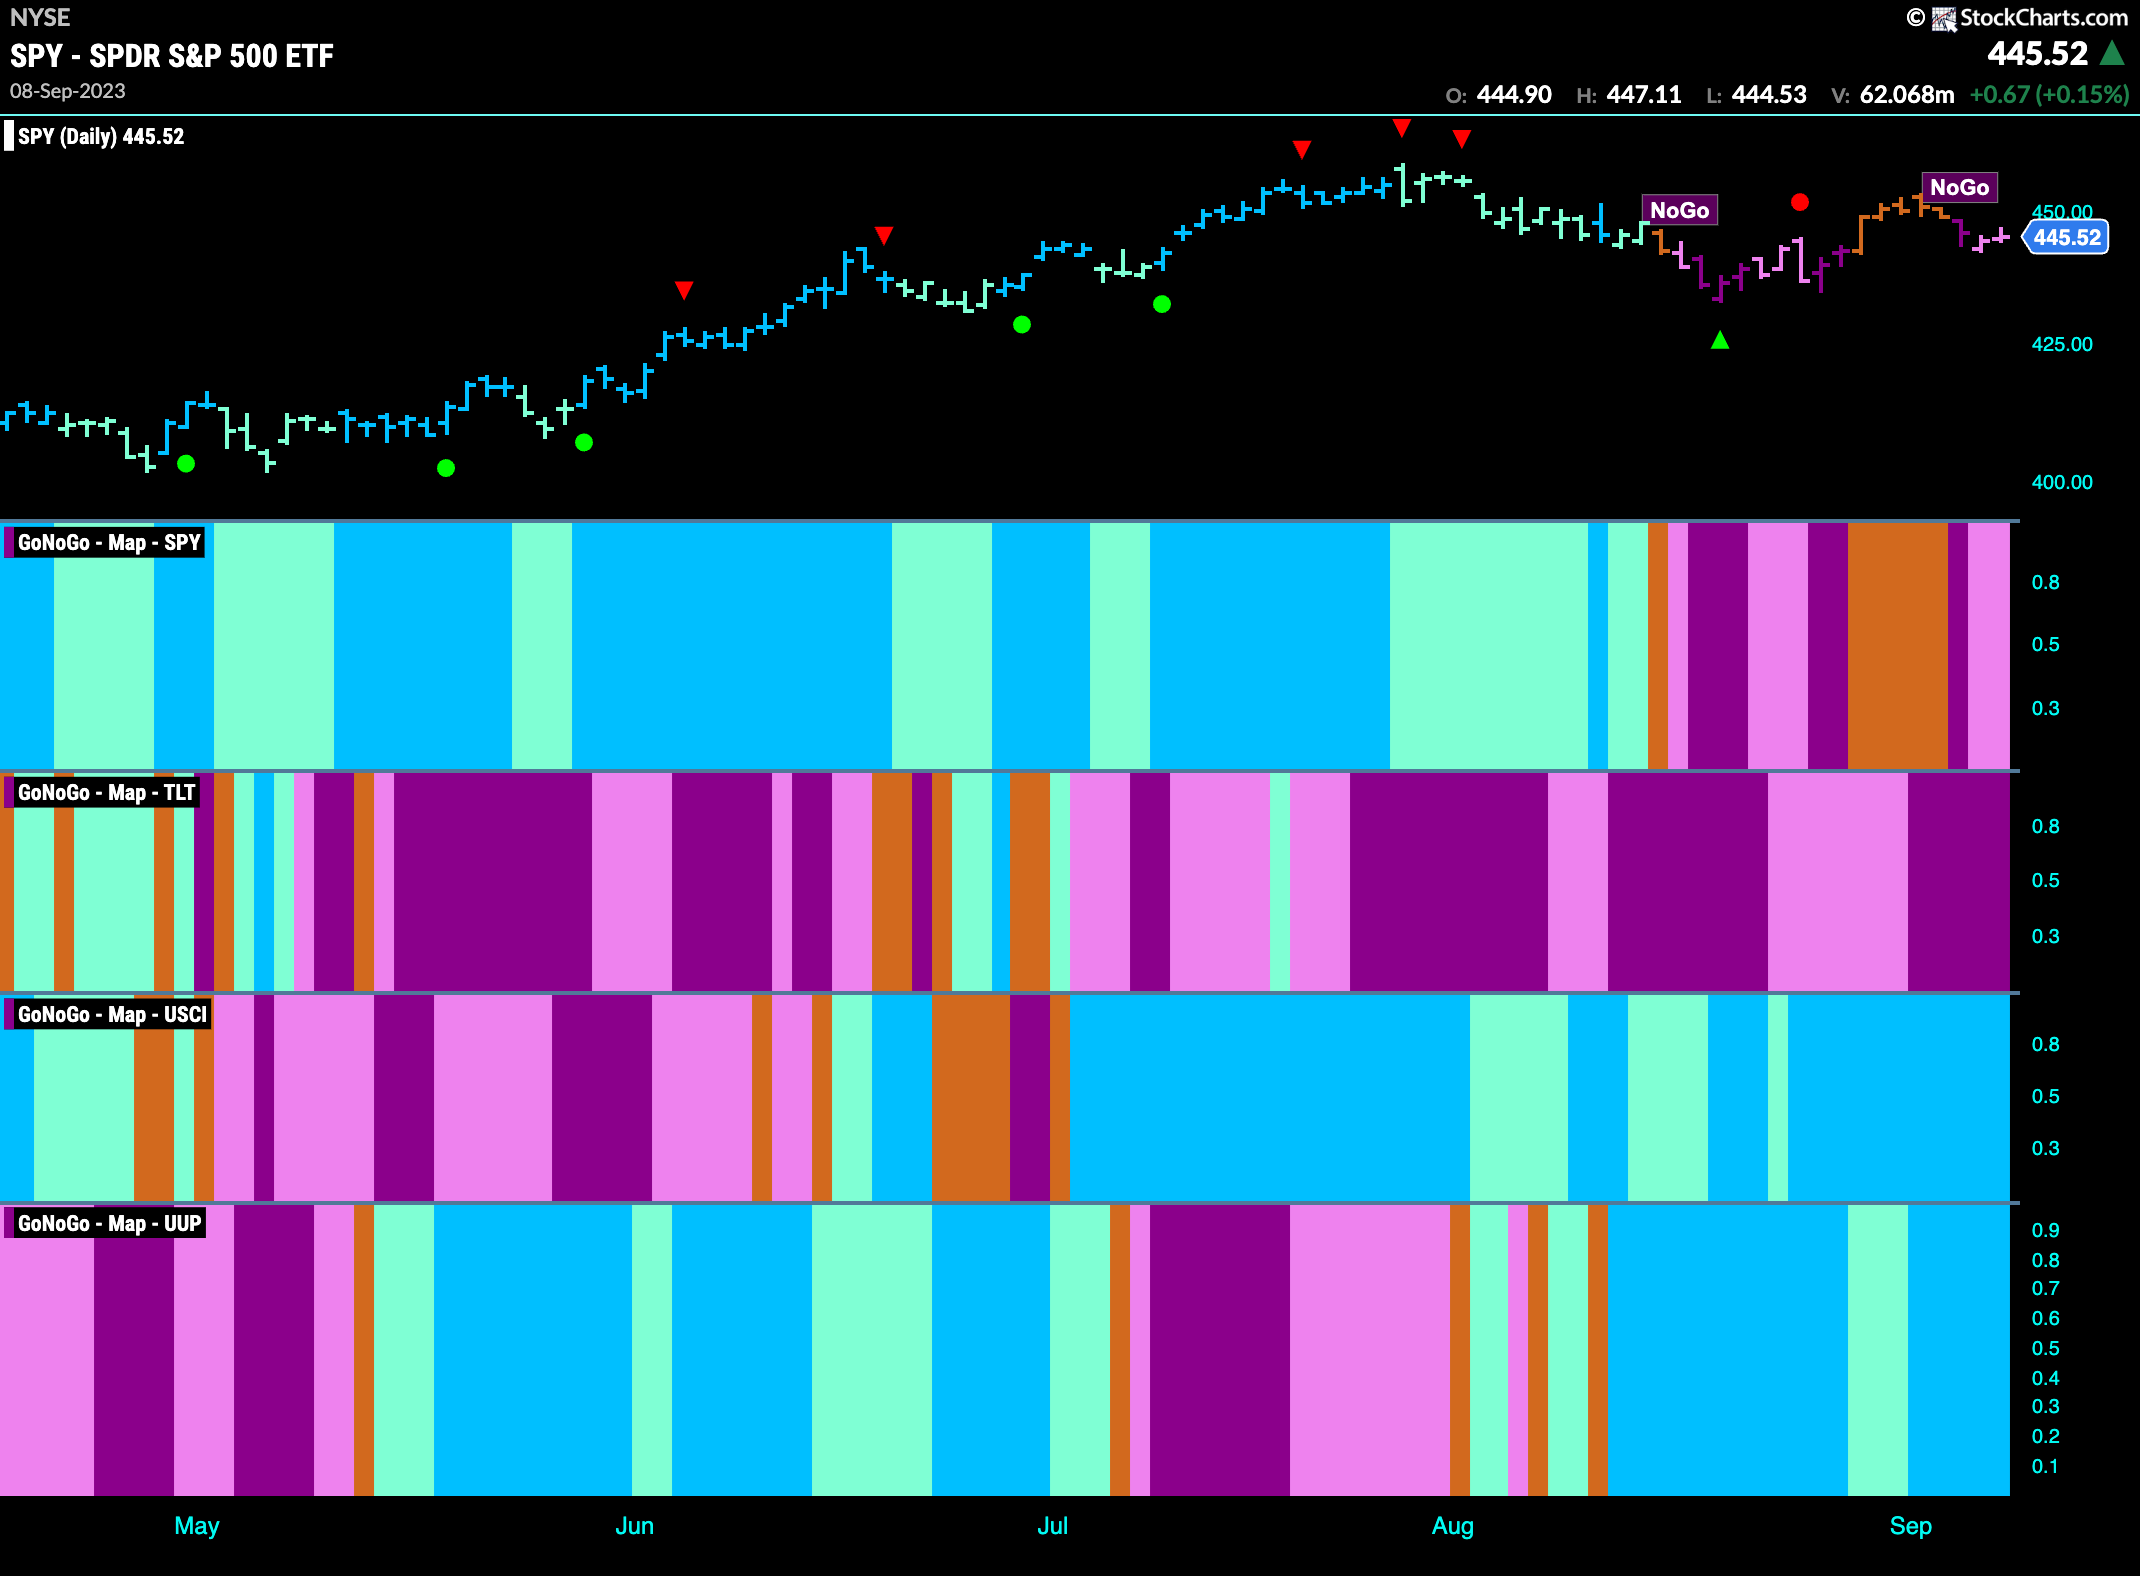
Return of the “NoGo’
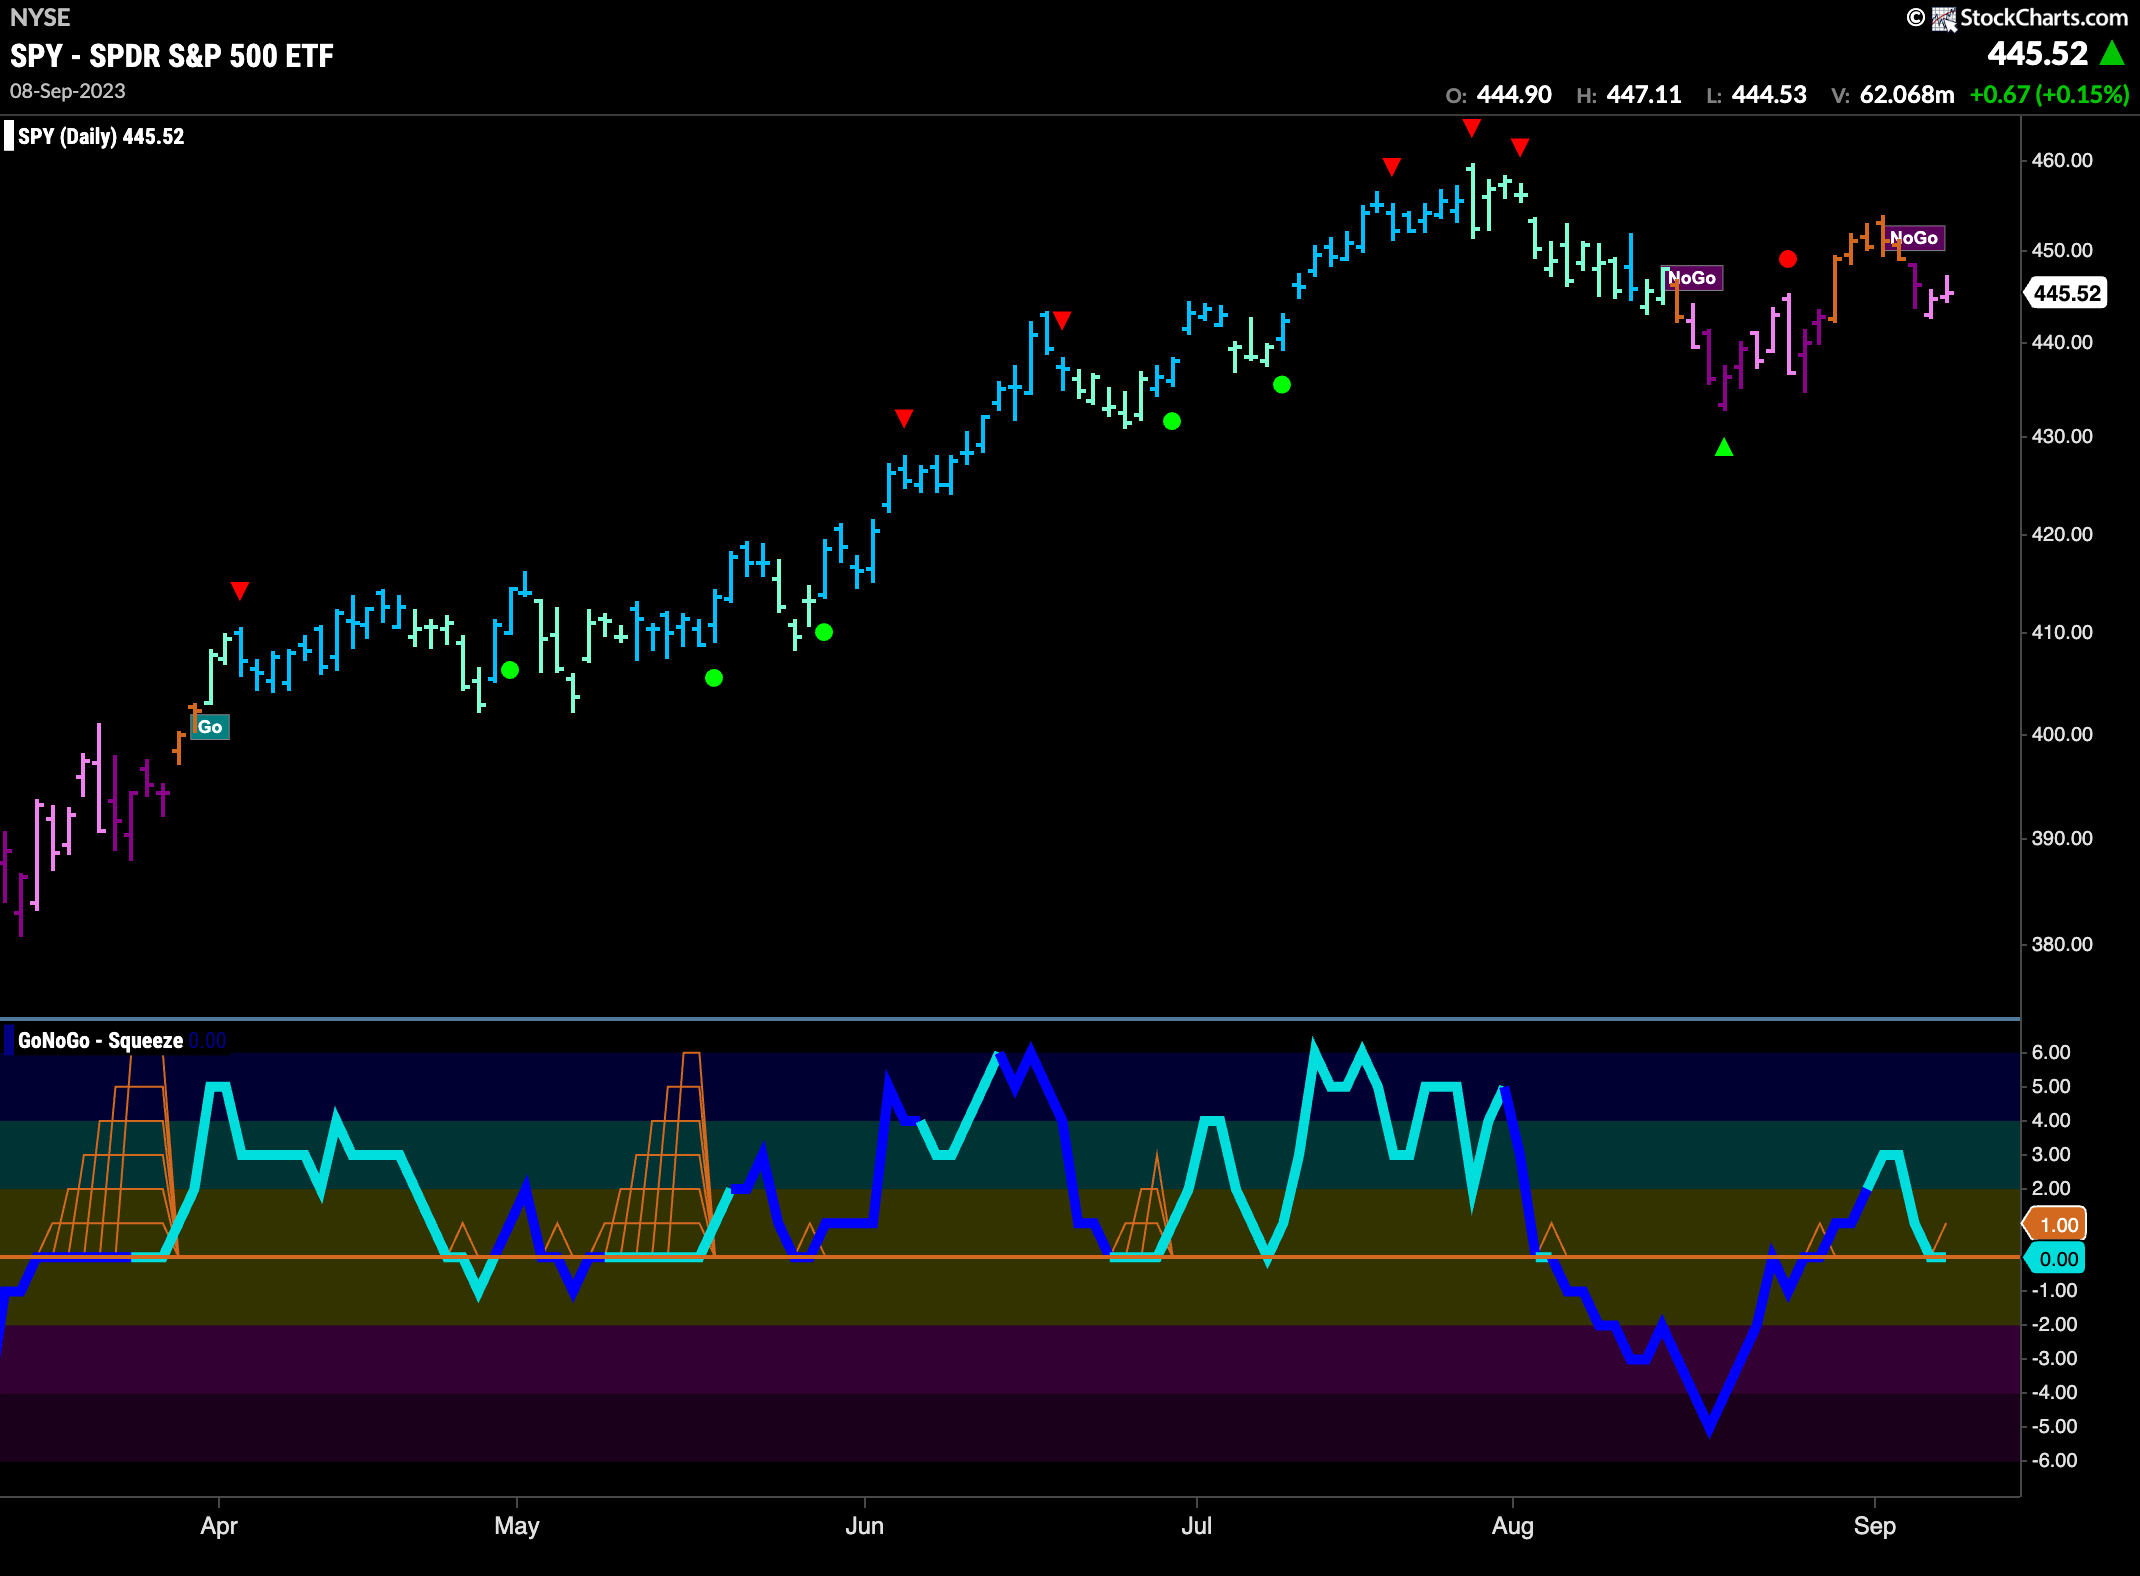
As of Friday, the “NoGo” had returned this past week as GoNoGo Trend painted purple and pink bars after several bars of uncertainty represented by amber “Go Fish”. We are watching closely as GoNoGo Oscillator having broken above the zero line into positive territory is now back retesting the zero line. Support here could coincide with a higher low in price and then we would be on the look out for a change in price trend. However, as it stands, a “NoGo” is in place and a return of the oscillator into negative territory would be a concern.
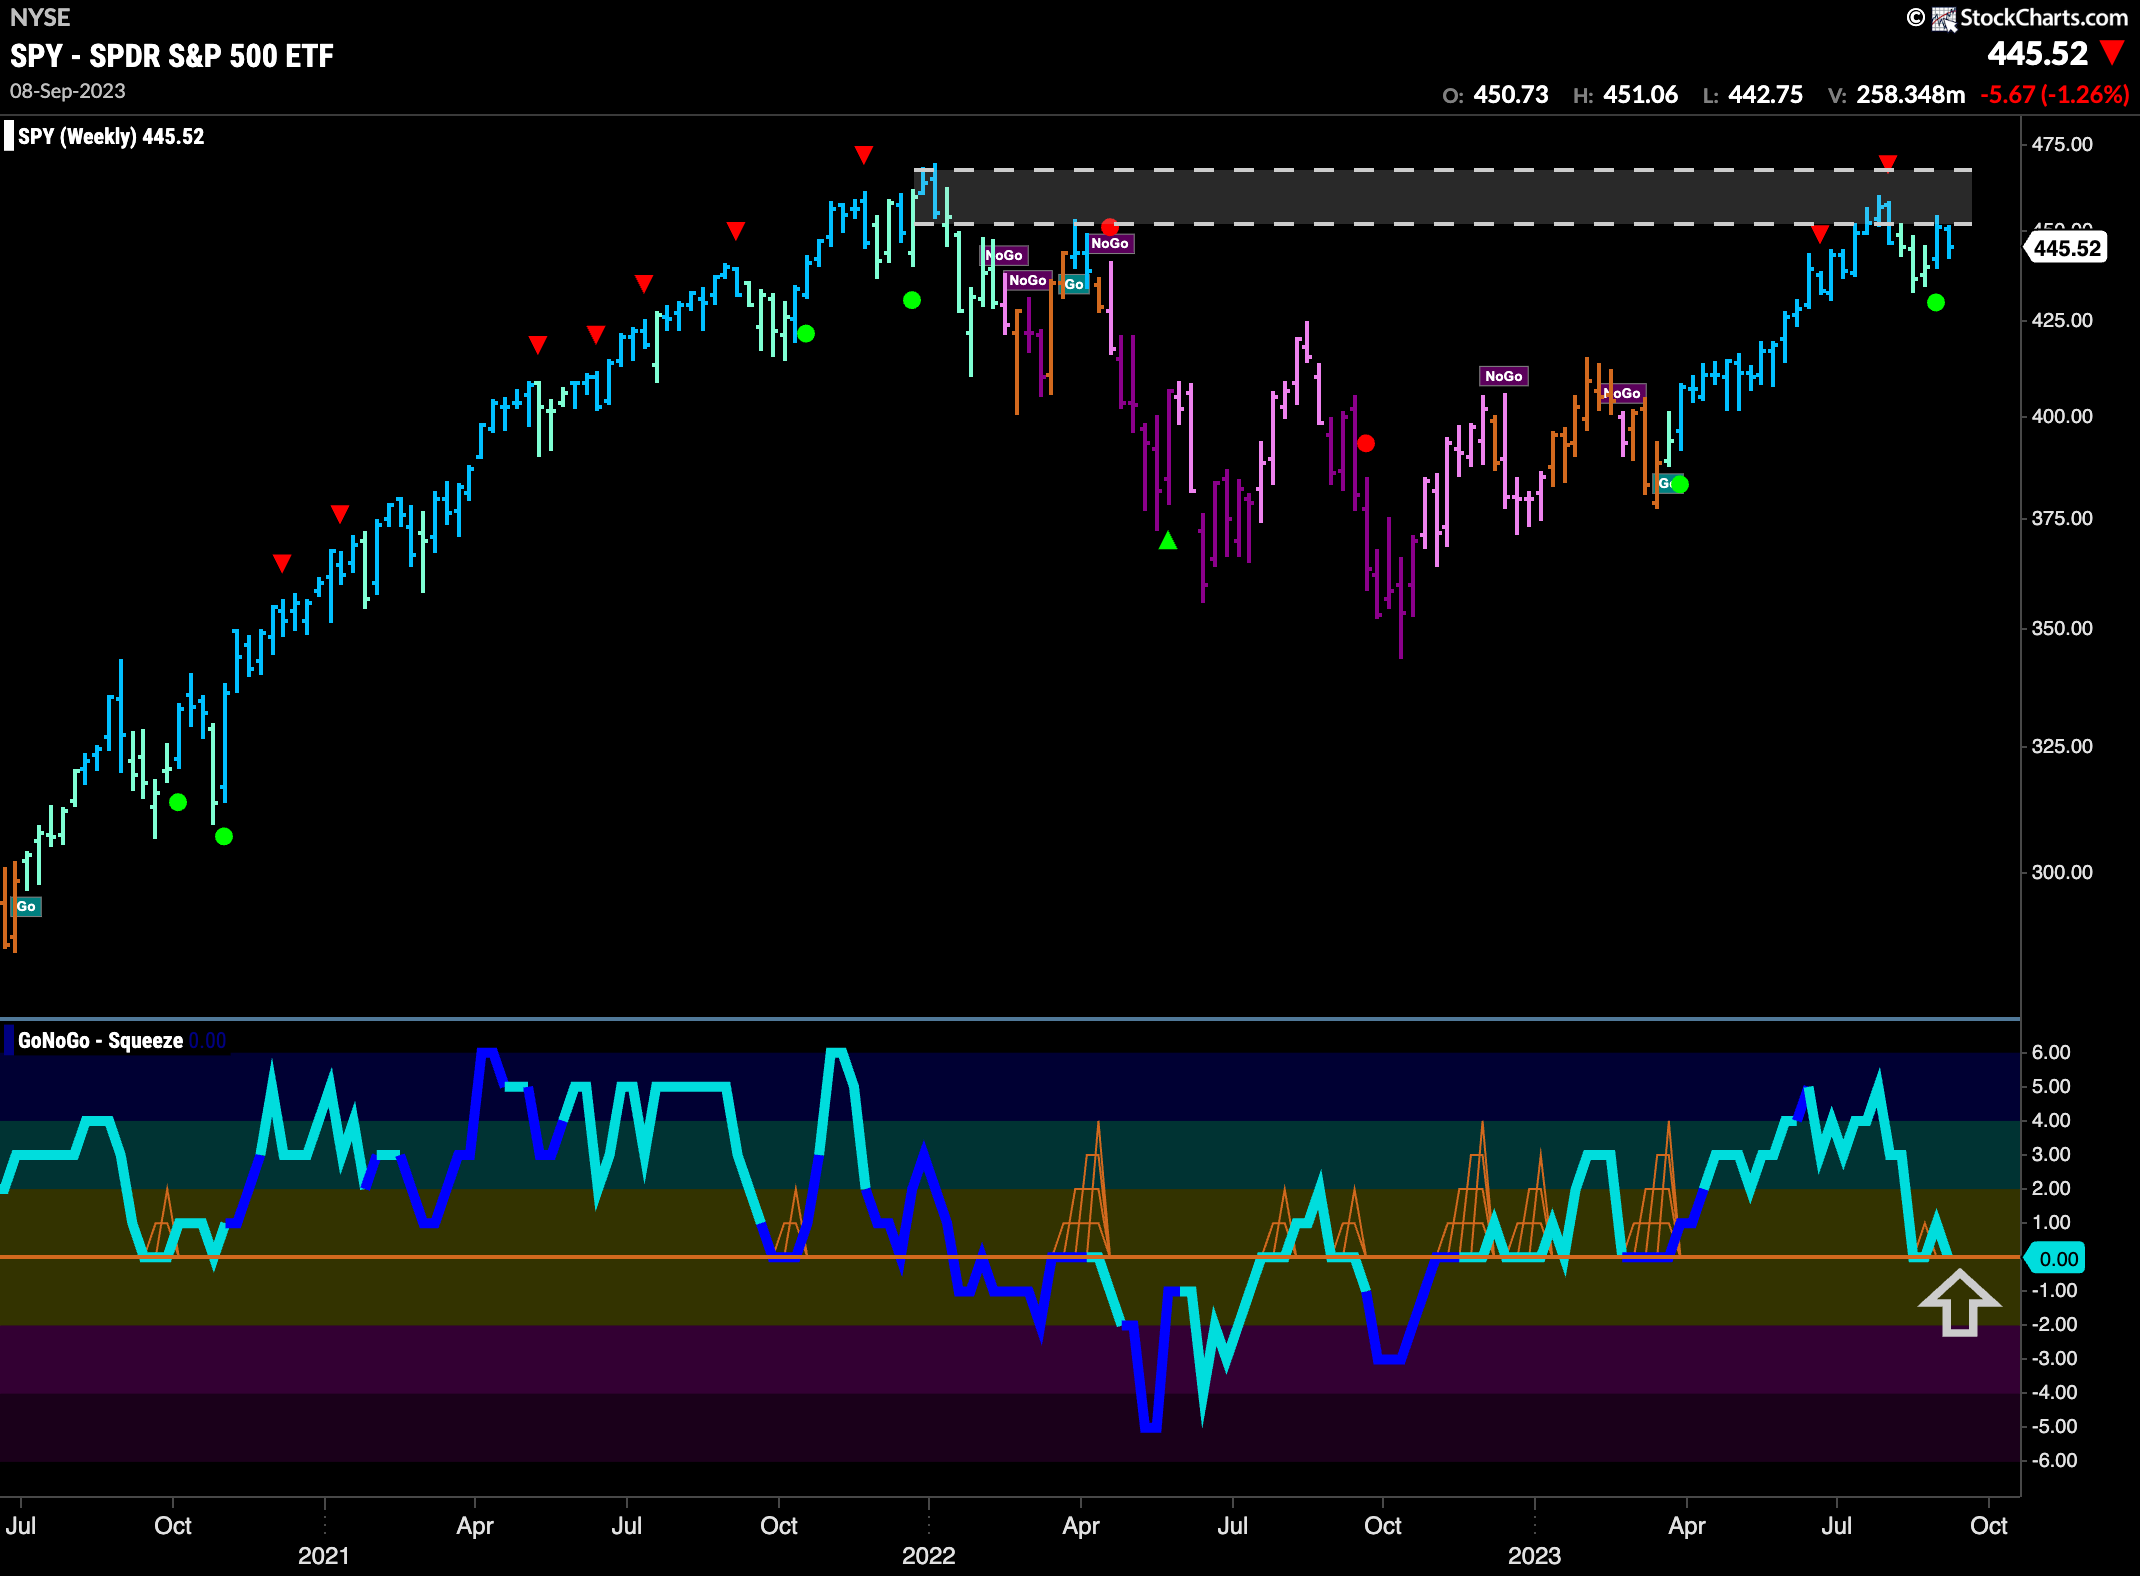
The longer term weekly chart remains in a “Go” trend. We see that there is strong resistance overhead still and we will need a big push to get through this. GoNoGo Trend painted a strong blue “Go” bar this week and GoNoGo Oscillator is managing to hold the zero line. It is back re-stesting that level again this week and so we will watch to see if it continues to find support.
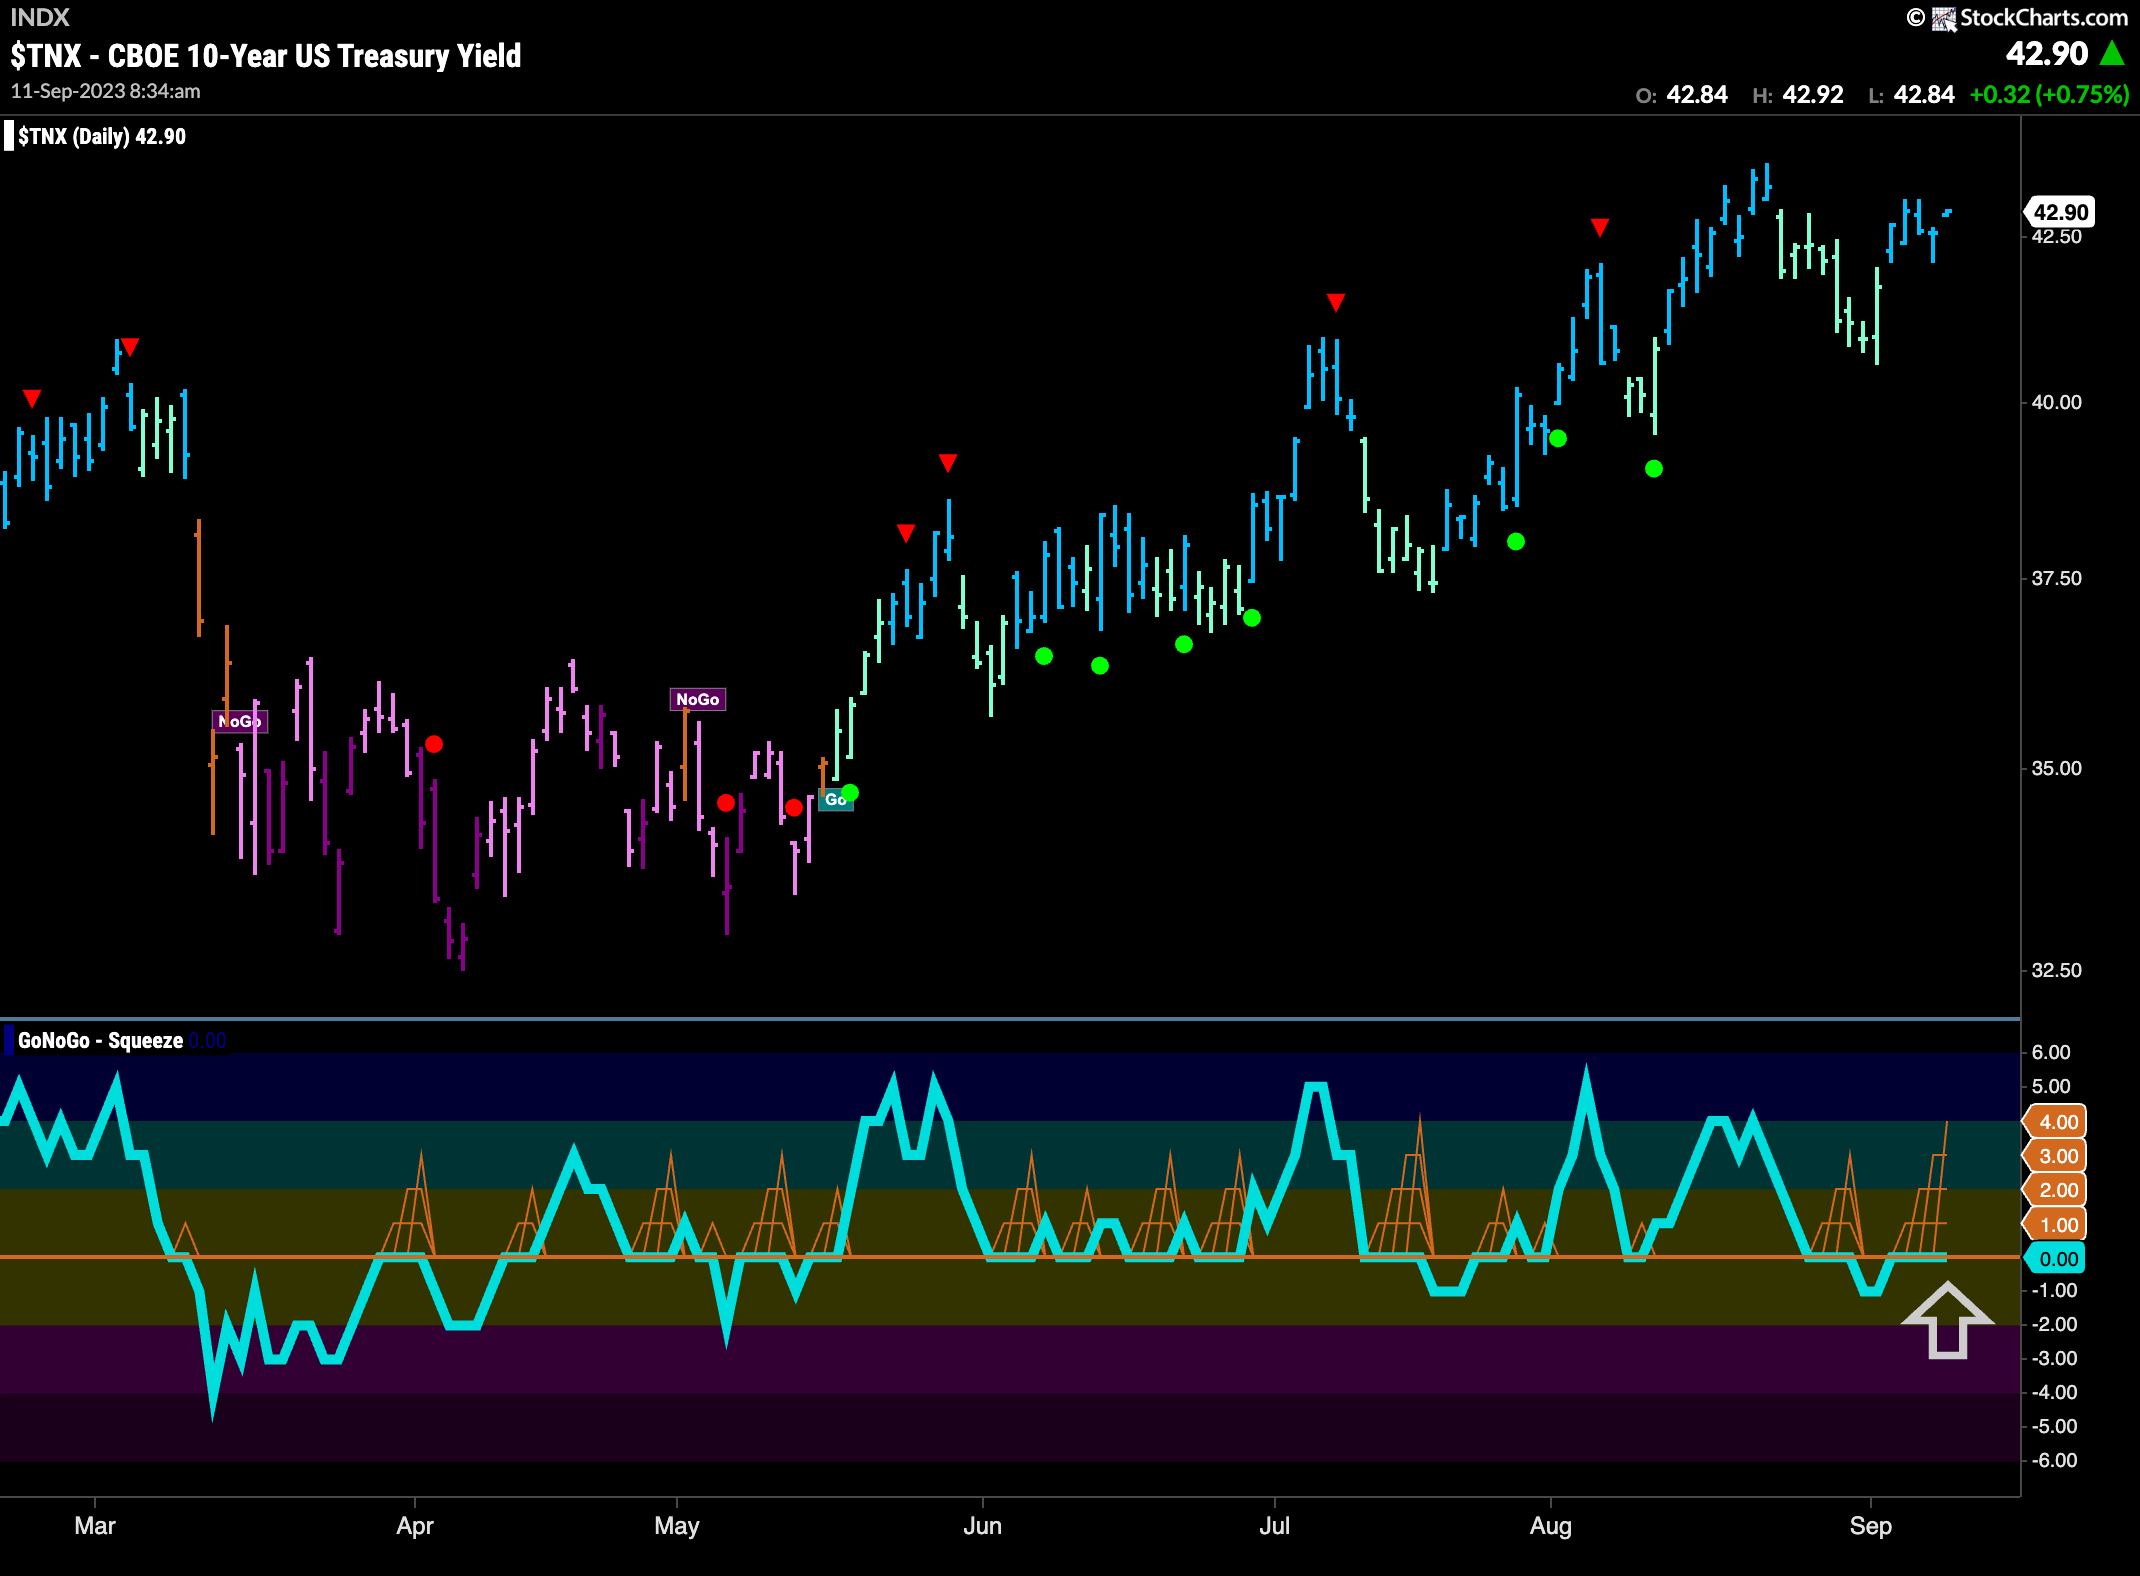
Treasury Rates Fighting to go Higher in “Go” Trend
Treasury bond rates continued to rally this week as we see GoNoGo Trend paint several stronger blue “Go” bars. Indeed, price is approaching levels of resistance in the form of the recent high. GoNoGo Oscillator is back riding the zero line as a GoNoGo Squeeze builds. It will be of great importance to see in which direction the Squeeze is broken. This will likely determine whether or not price can break to new highs.
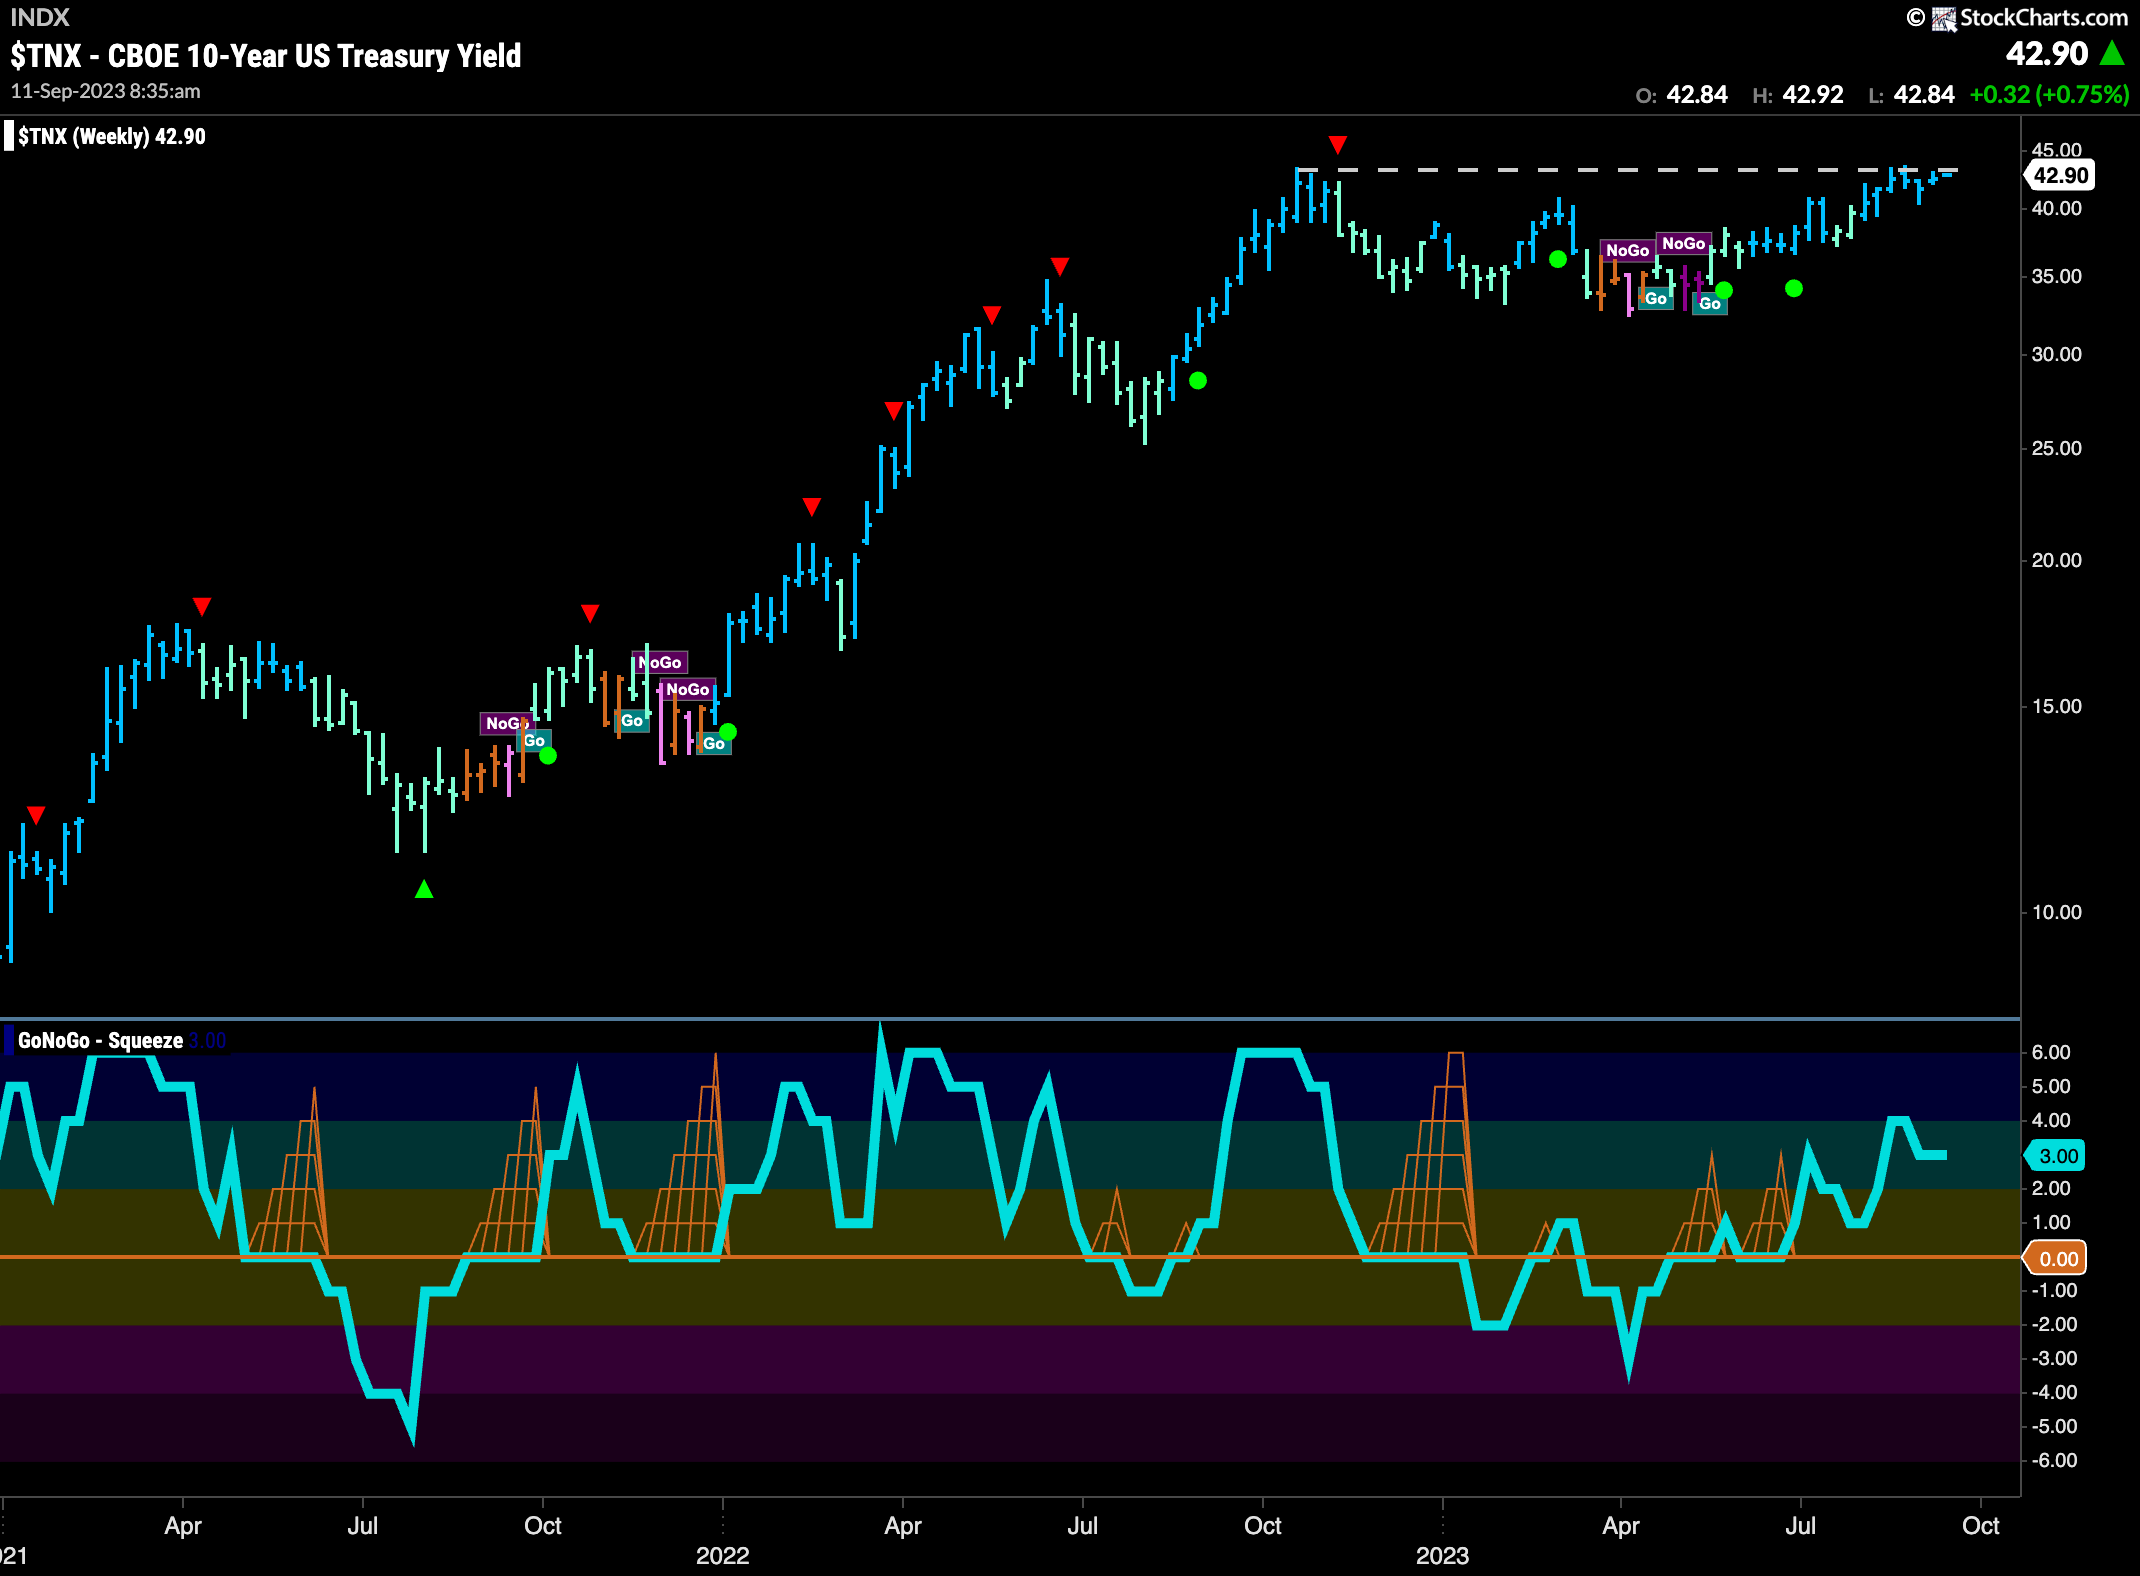
The weekly chart shows just how strong the overhead resistance is. This is a critical moment for rates. The evidence suggests that a “Go” trend is in place and momentum is on its side. We know this as GoNoGo Trend paints strong blue “Go” bars and GoNoGo Oscillator is in positive territory but not yet overbought. A surge in rates could have a sobering effect on U.S. equity prices.
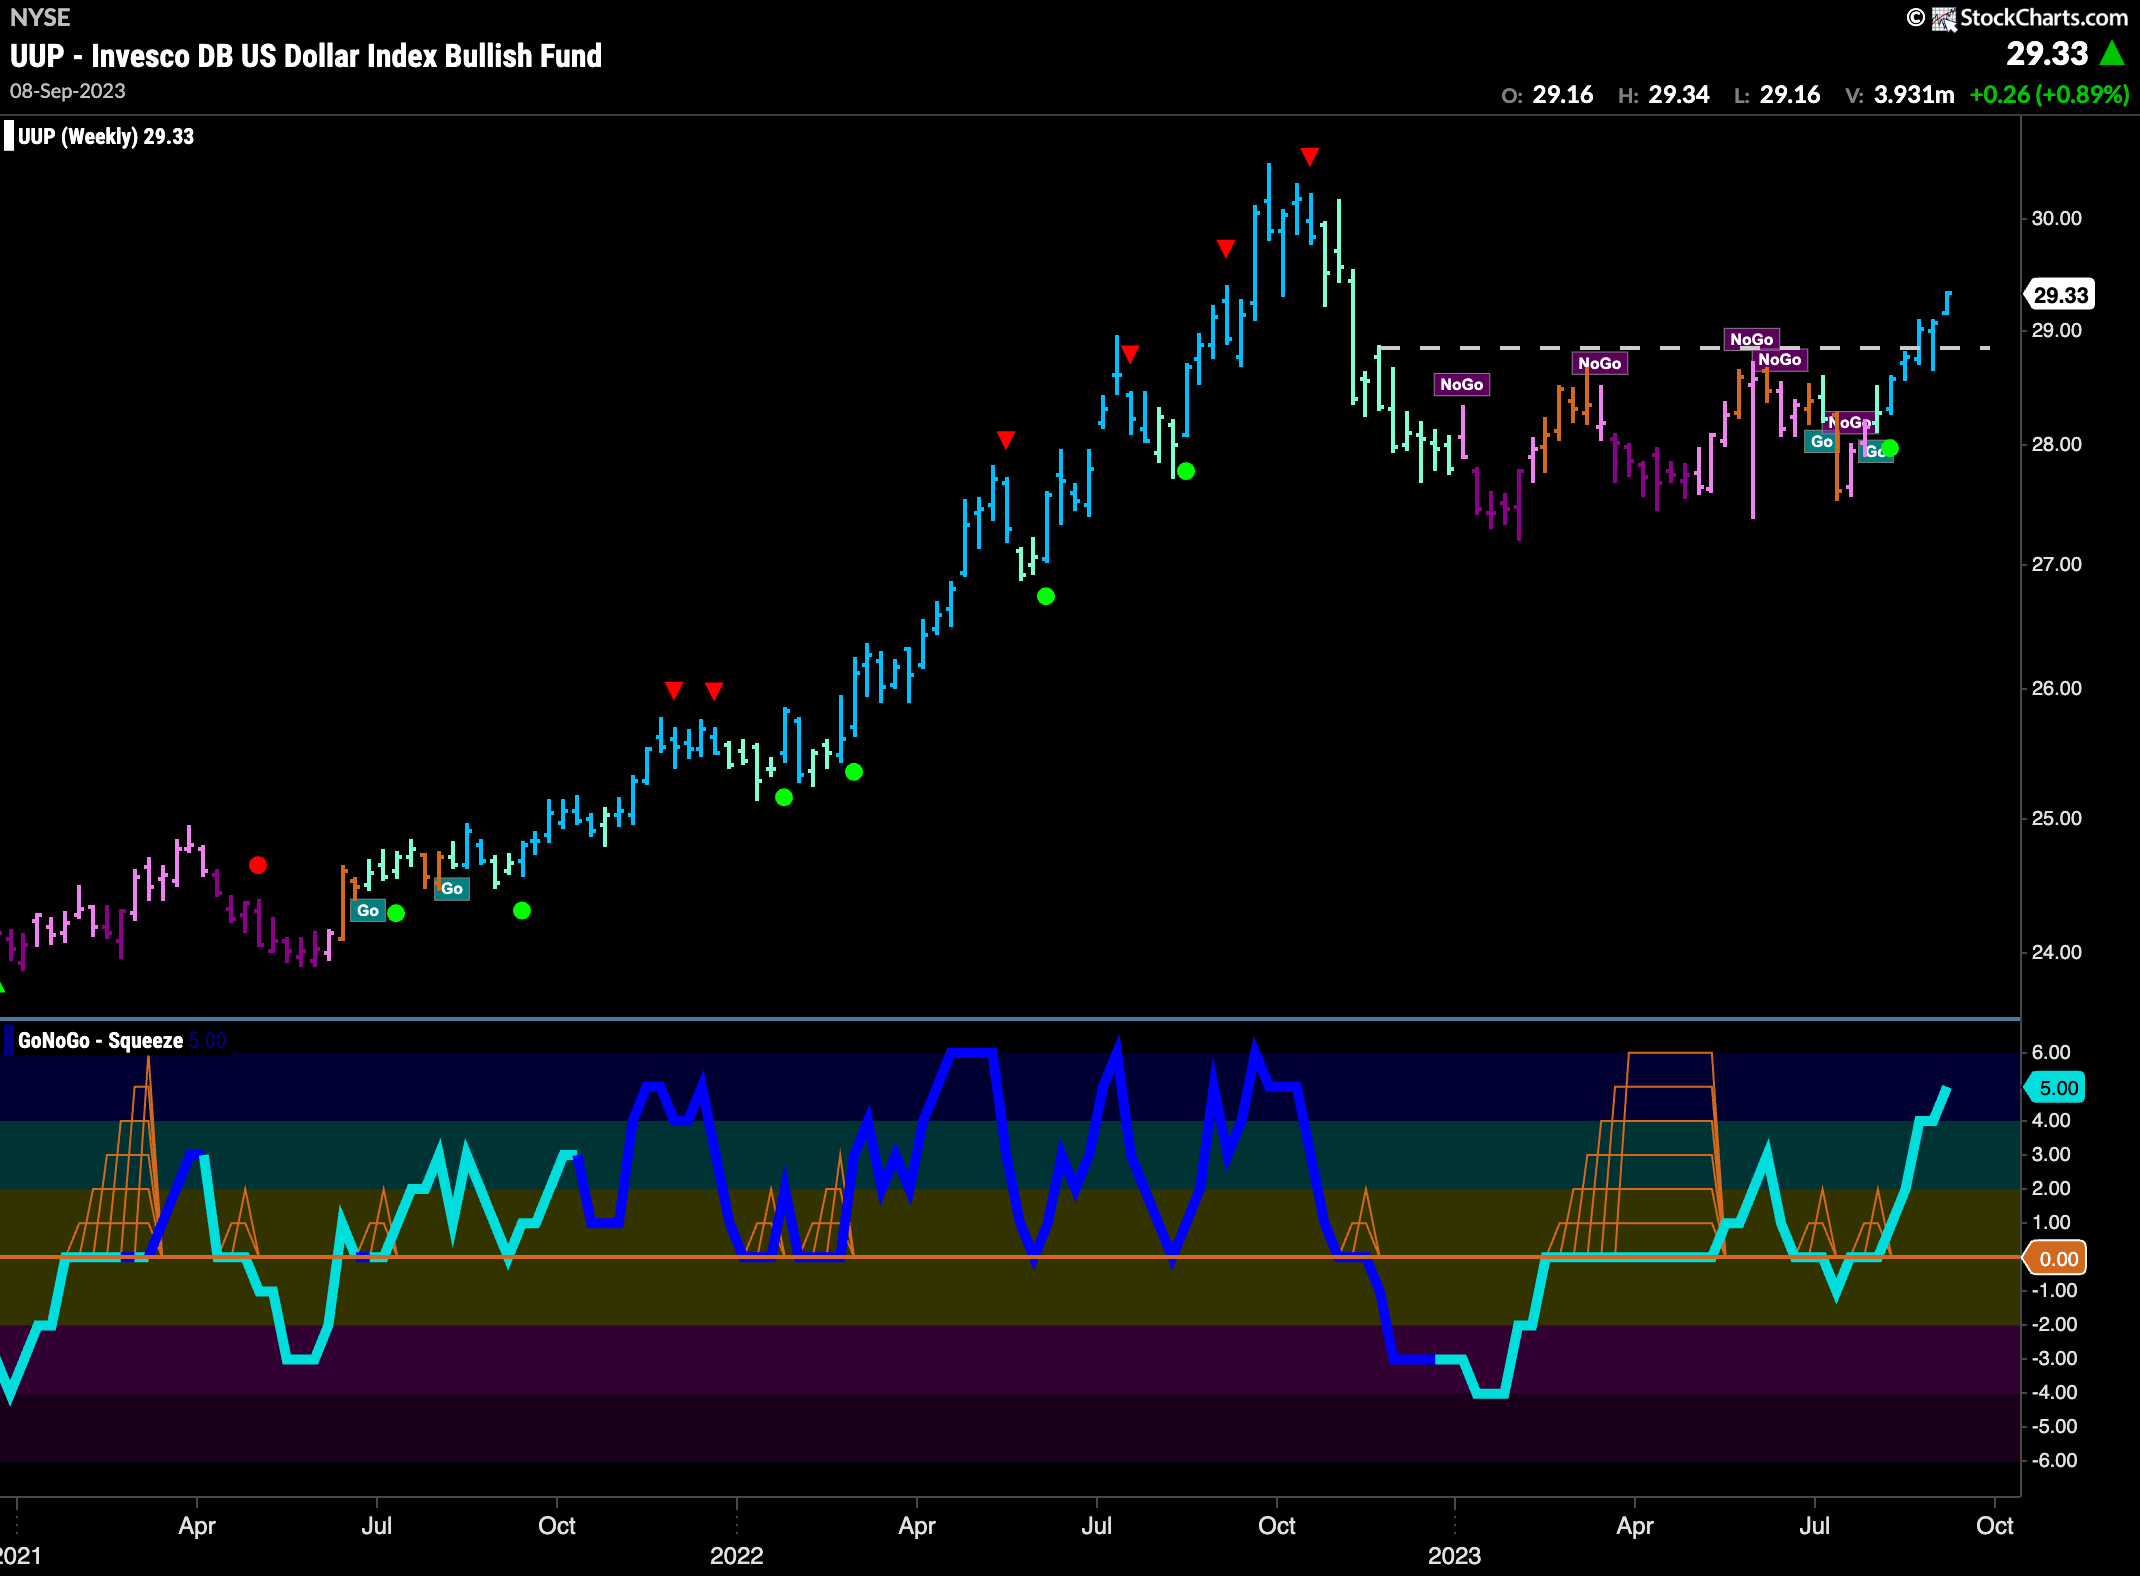
Dollar Continues to Push Higher
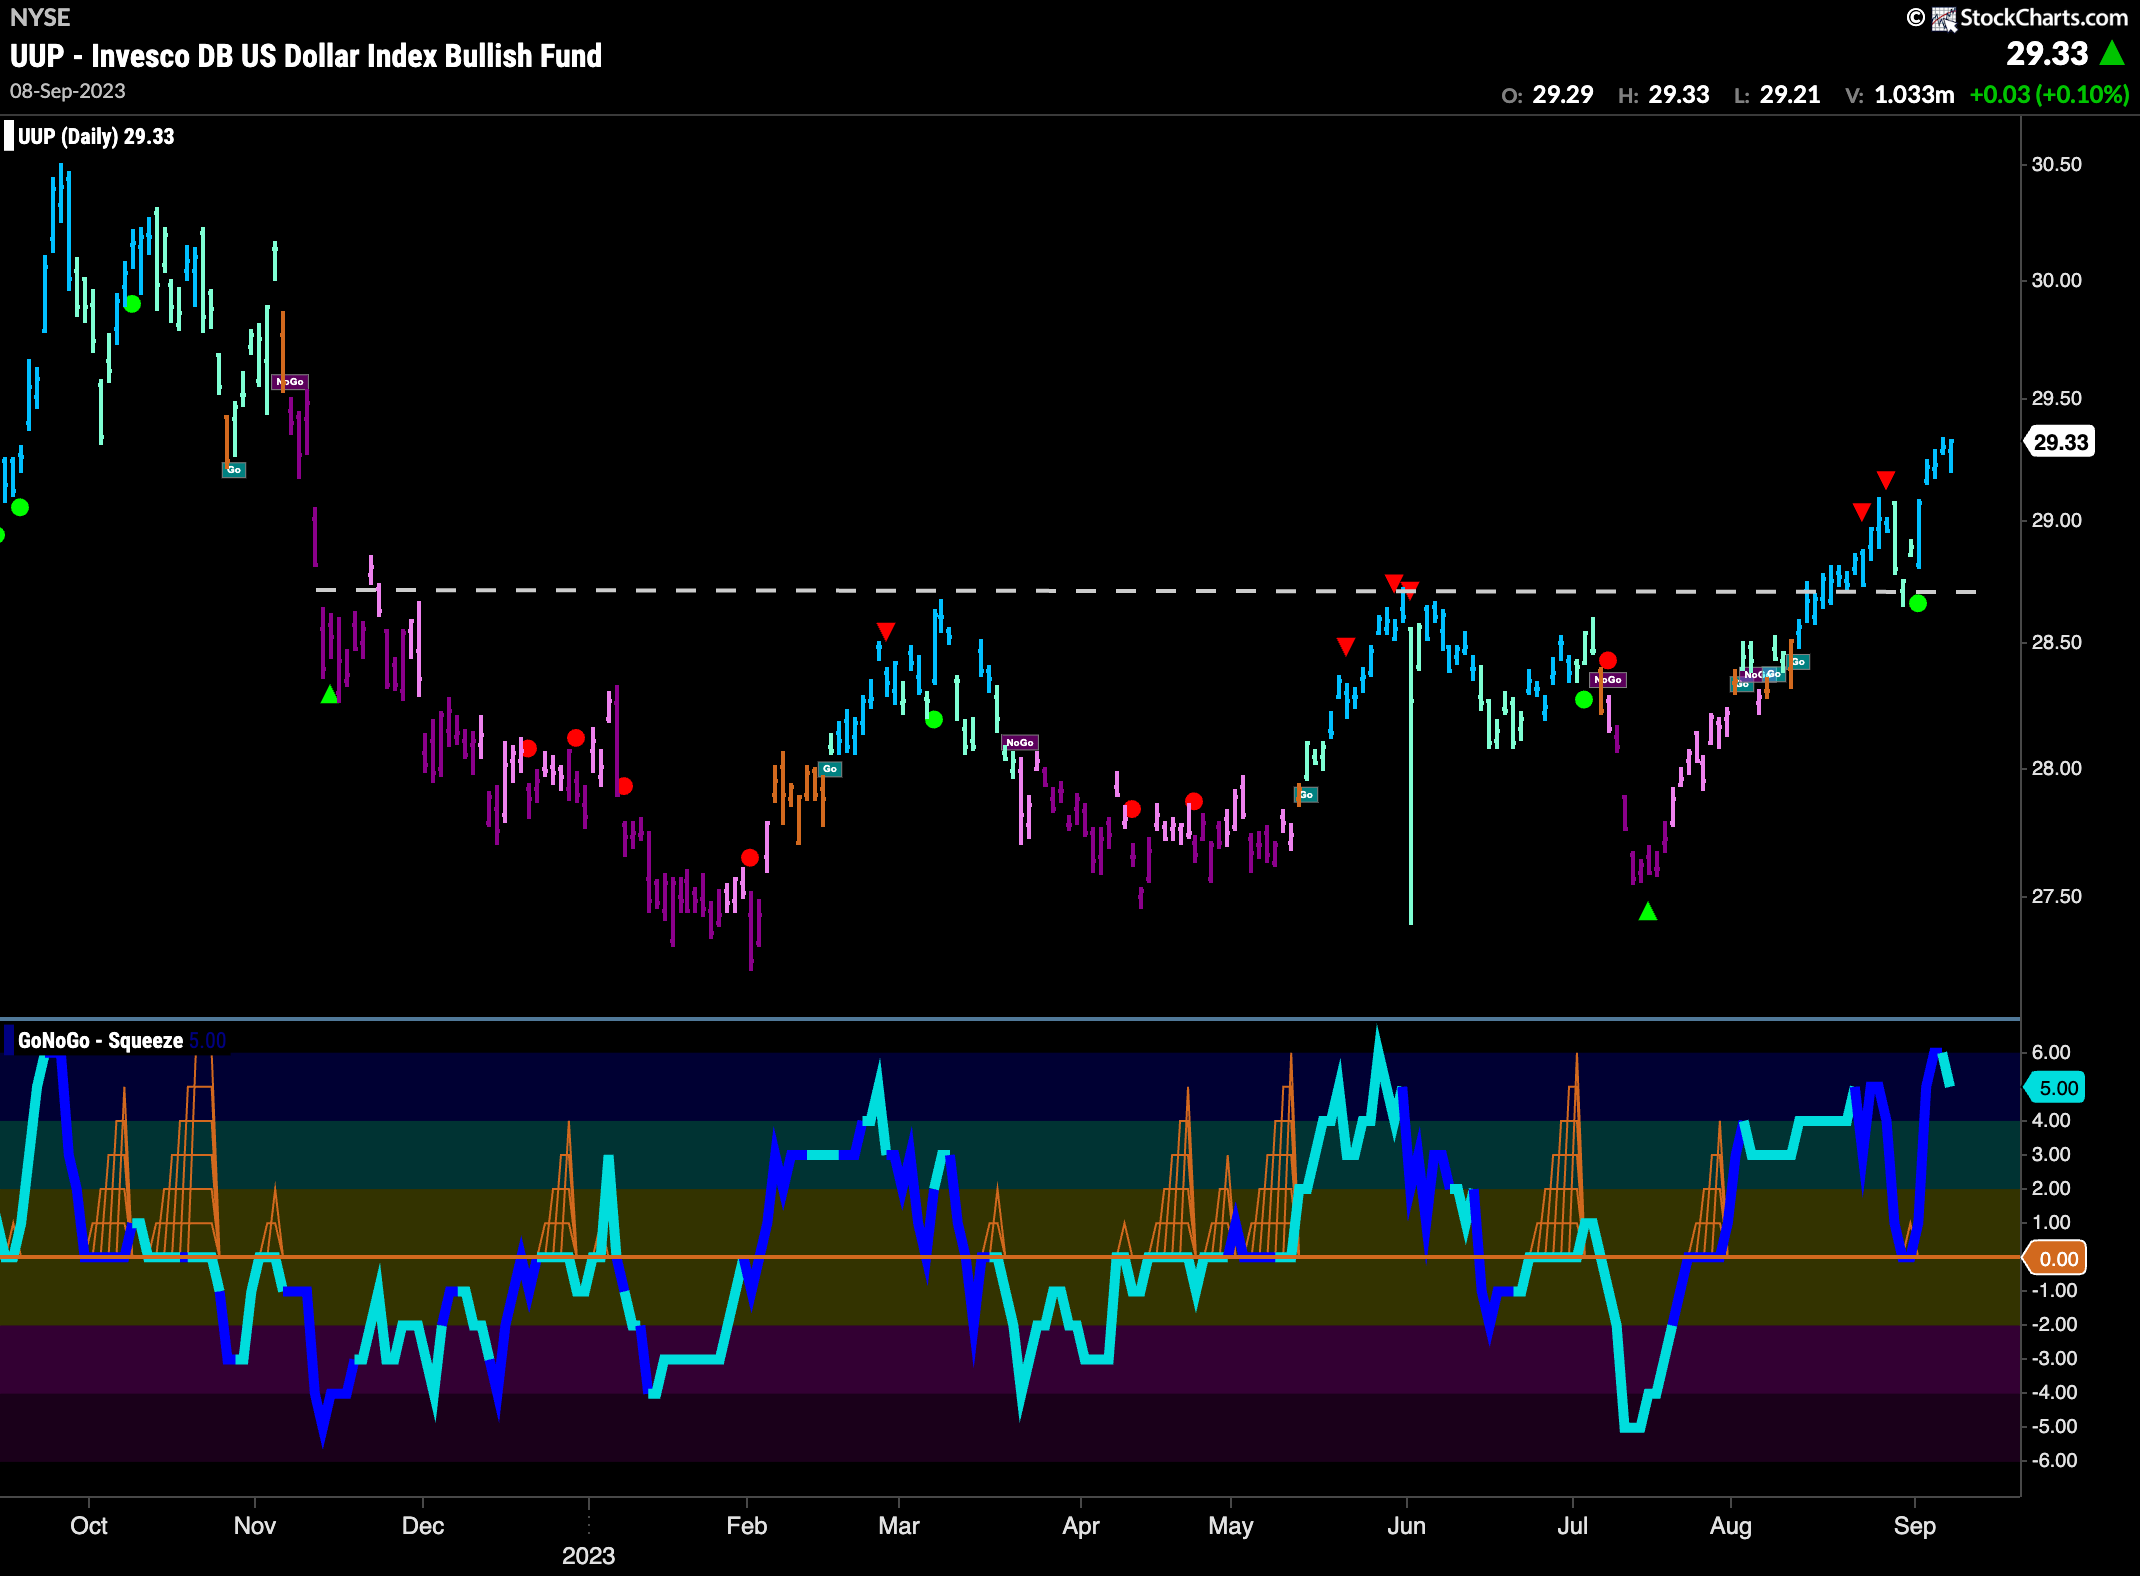
Looking at the weekly chart of the dollar shows us that the greenback went from strength to strength this week. Now well above resistance, there is some room to run before it has to deal with the prior high from last autumn that we see on the chart. GoNoGo Oscillator is overbought and we will watch to see if it remains so or if we get a short term Counter Trend Correction Icon.
The daily chart below shows how price was able to use the support it found at prior resistance to propel itself higher. This is the classic technical analysis concept of polarity. What once was resistance becomes support. GoNoGo Trend is painting strong blue “Go” bars and GoNoGo Oscillator is in overbought territory.
Oil Trading at New Highs
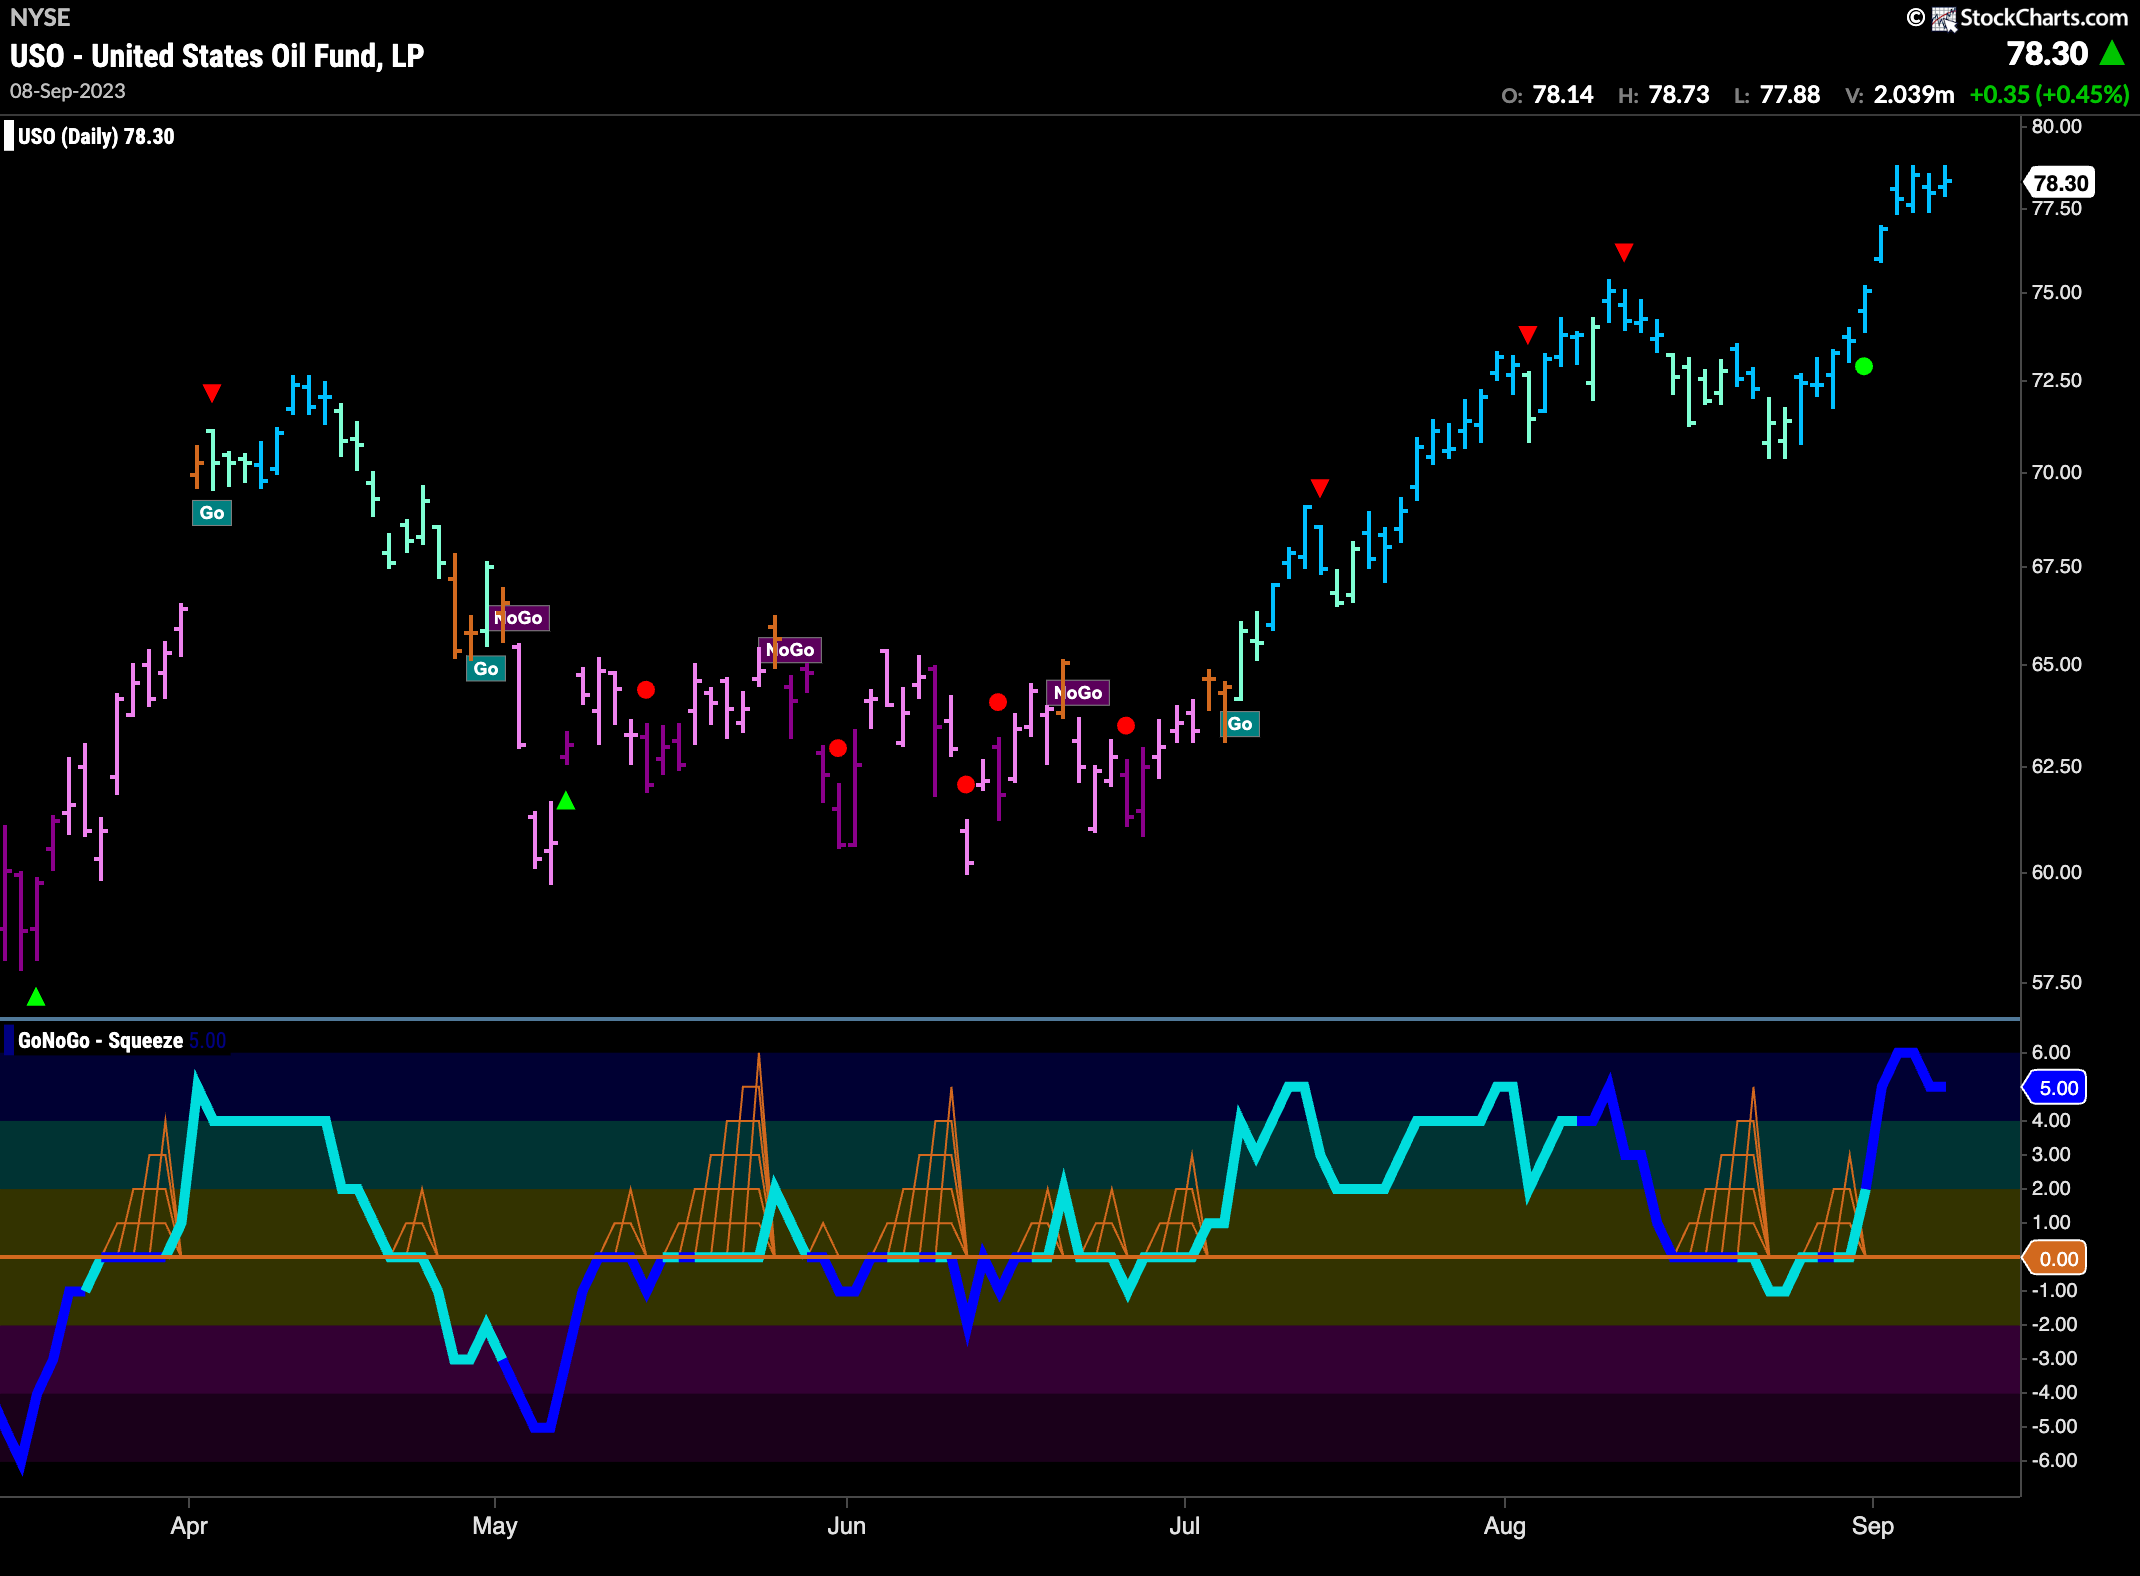
The chart below shows that having broken out of the downward sloping resistance that we had been monitoring for months on the weekly chart, price is free to move higher. At new highs, we see GoNoGo Trend paint strong blue daily bars and GoNoGo Oscillator is in overbought territory. Volume is heavy on this recent price surge and that tells us that the market is participating in the price move.
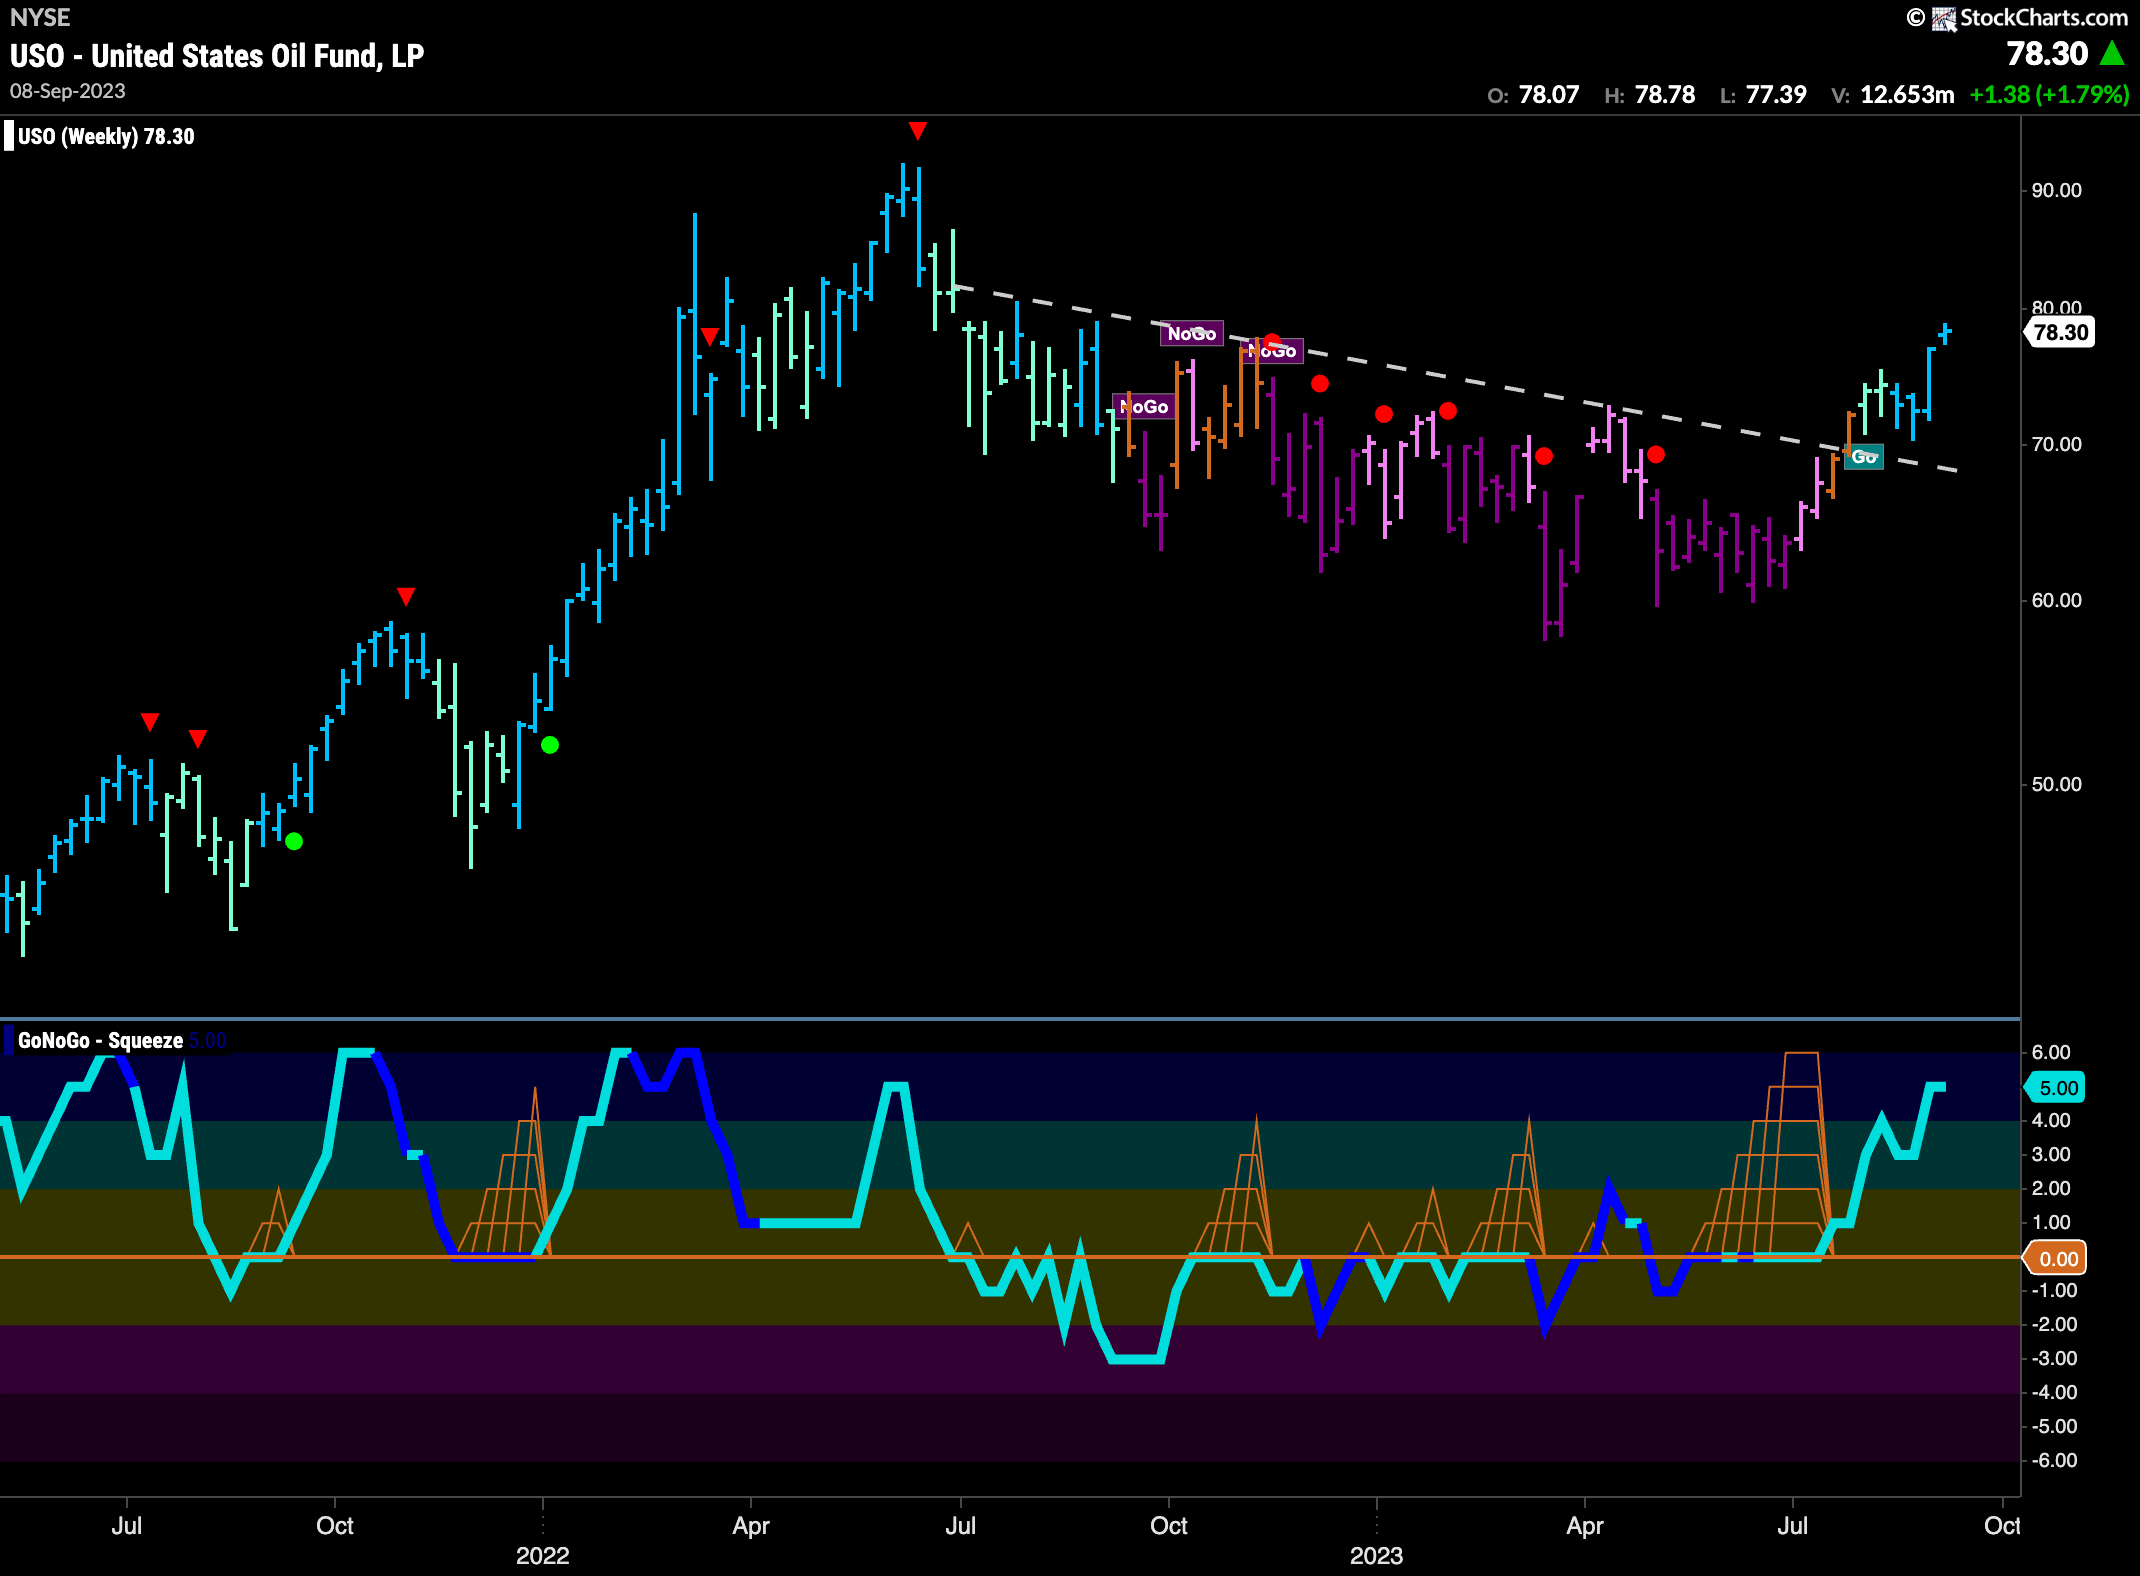
You can see just how strong the recent move in oil prices has been on this weekly chart below. Having retested the support from downward sloping resistance we saw a strong blue “Go” bar the week before last. We consolidated that this week with another strong bar higher still. Since breaking out of the Max GoNoGo Squeeze, GoNoGo Oscillator has been in positive territory and this week is hovering in overbought territory.
Gold Decides to Return to “NoGo”
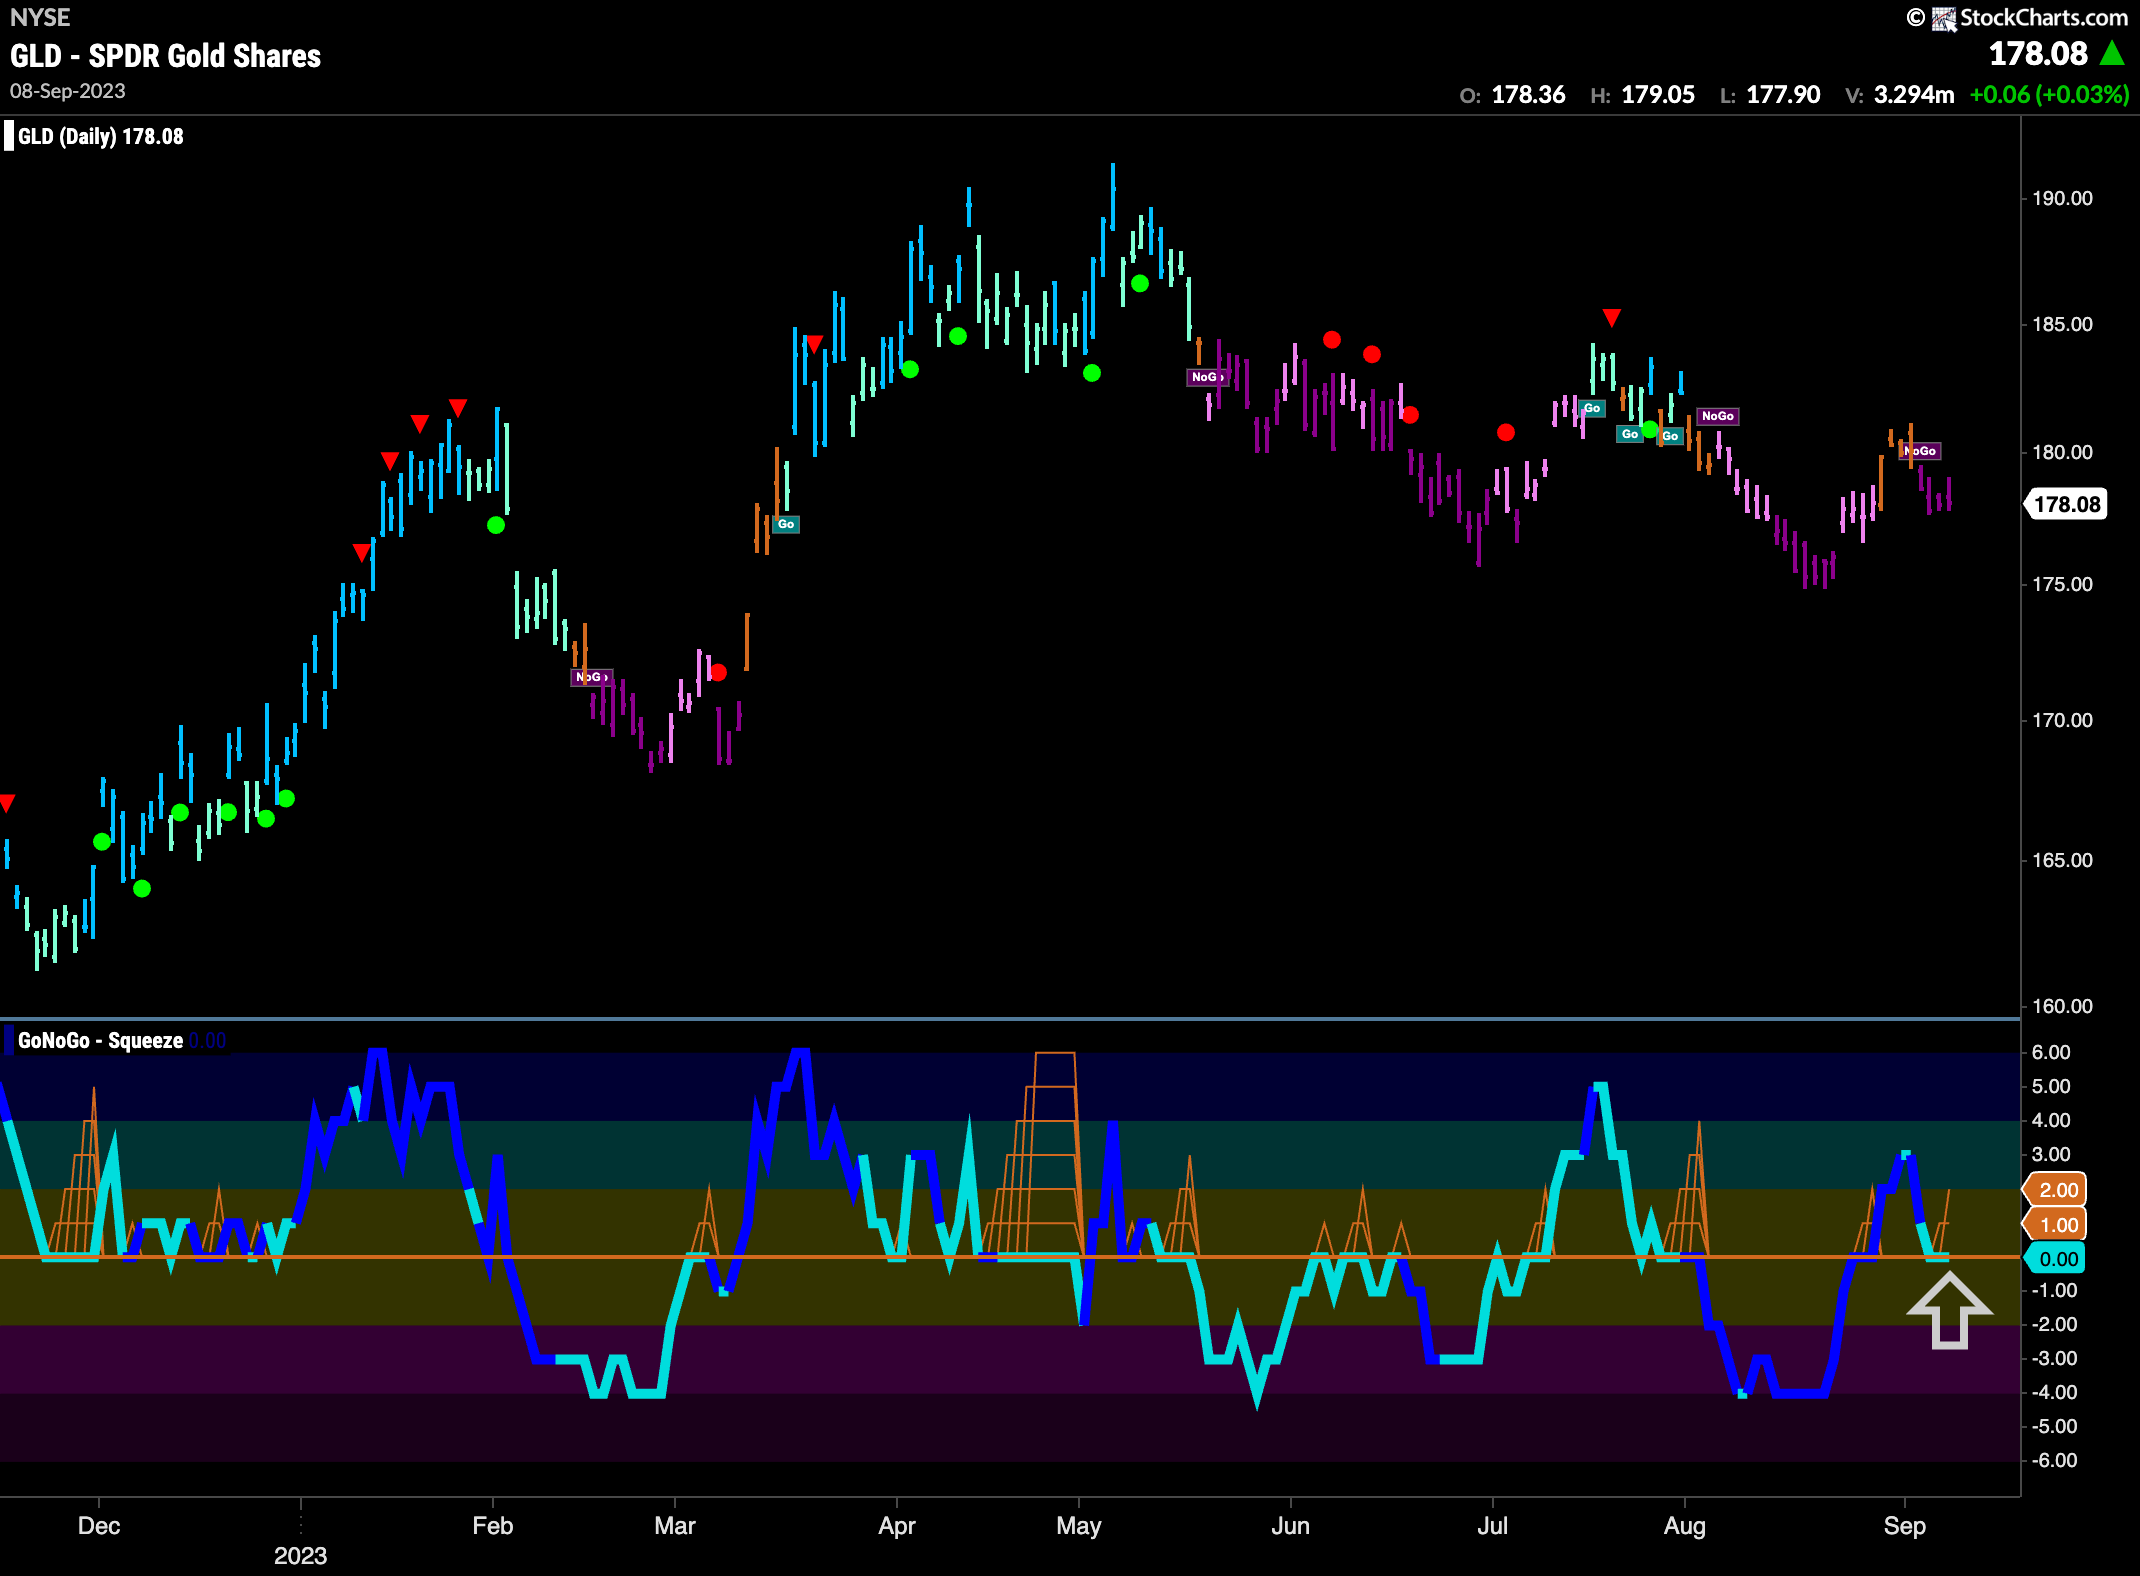
Last week we noted that GoNoGo Trend was showing uncertainty as it ended the week with “Go Fish” bars. This week saw the precious metal make up its mind, returning to the “NoGo” trend for most of the week. The indicator painted a string of strong purple “NoGo” bars. GoNoGo Oscillator which had dipped into positive territory quickly returned to test that level from above. We will watch to see if it finds support or if it fails and moves back into negative territory.
Sector RelMap
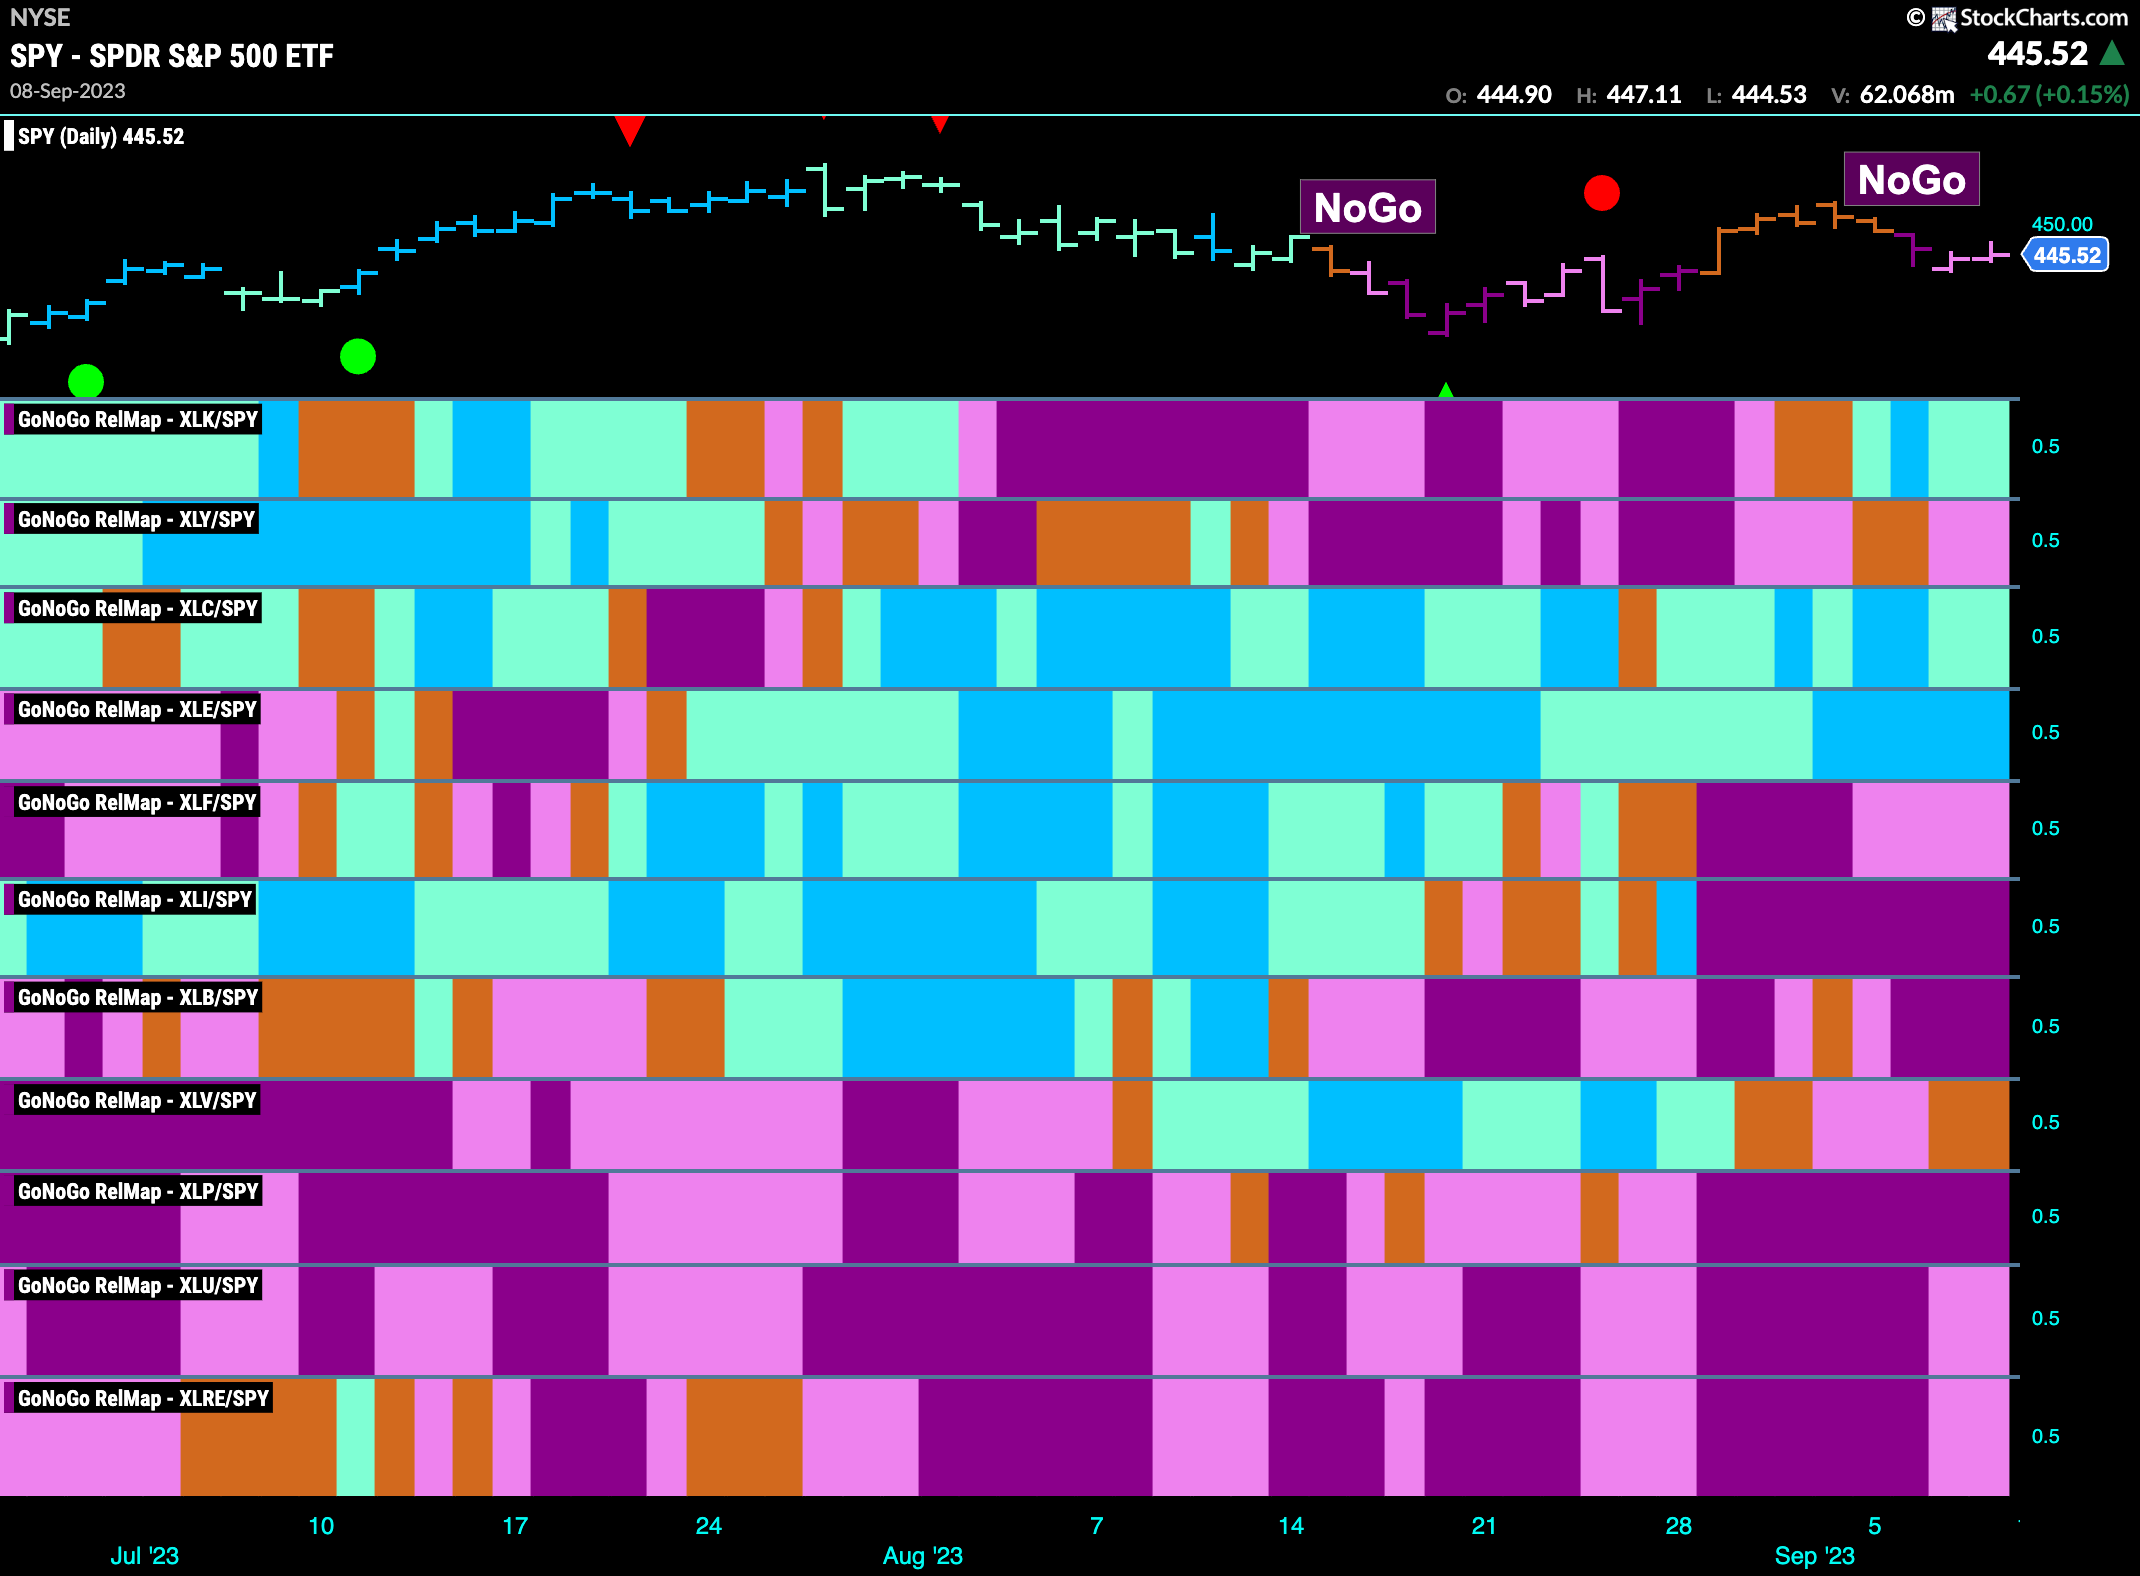
Below is the GoNoGo Sector RelMap. This GoNoGo RelMap applies the GoNoGo Trend to the relative strength ratios of the sectors to the base index. Looking at this map, we can quickly see where the relative outperformance is coming from as well as which sectors are lagging on a relative basis. 3 sectors are outperforming the base index this week. $XLK, $XLC, and $XLE are painting “Go” bars.
Relative to Index, Technology Starts to Shine
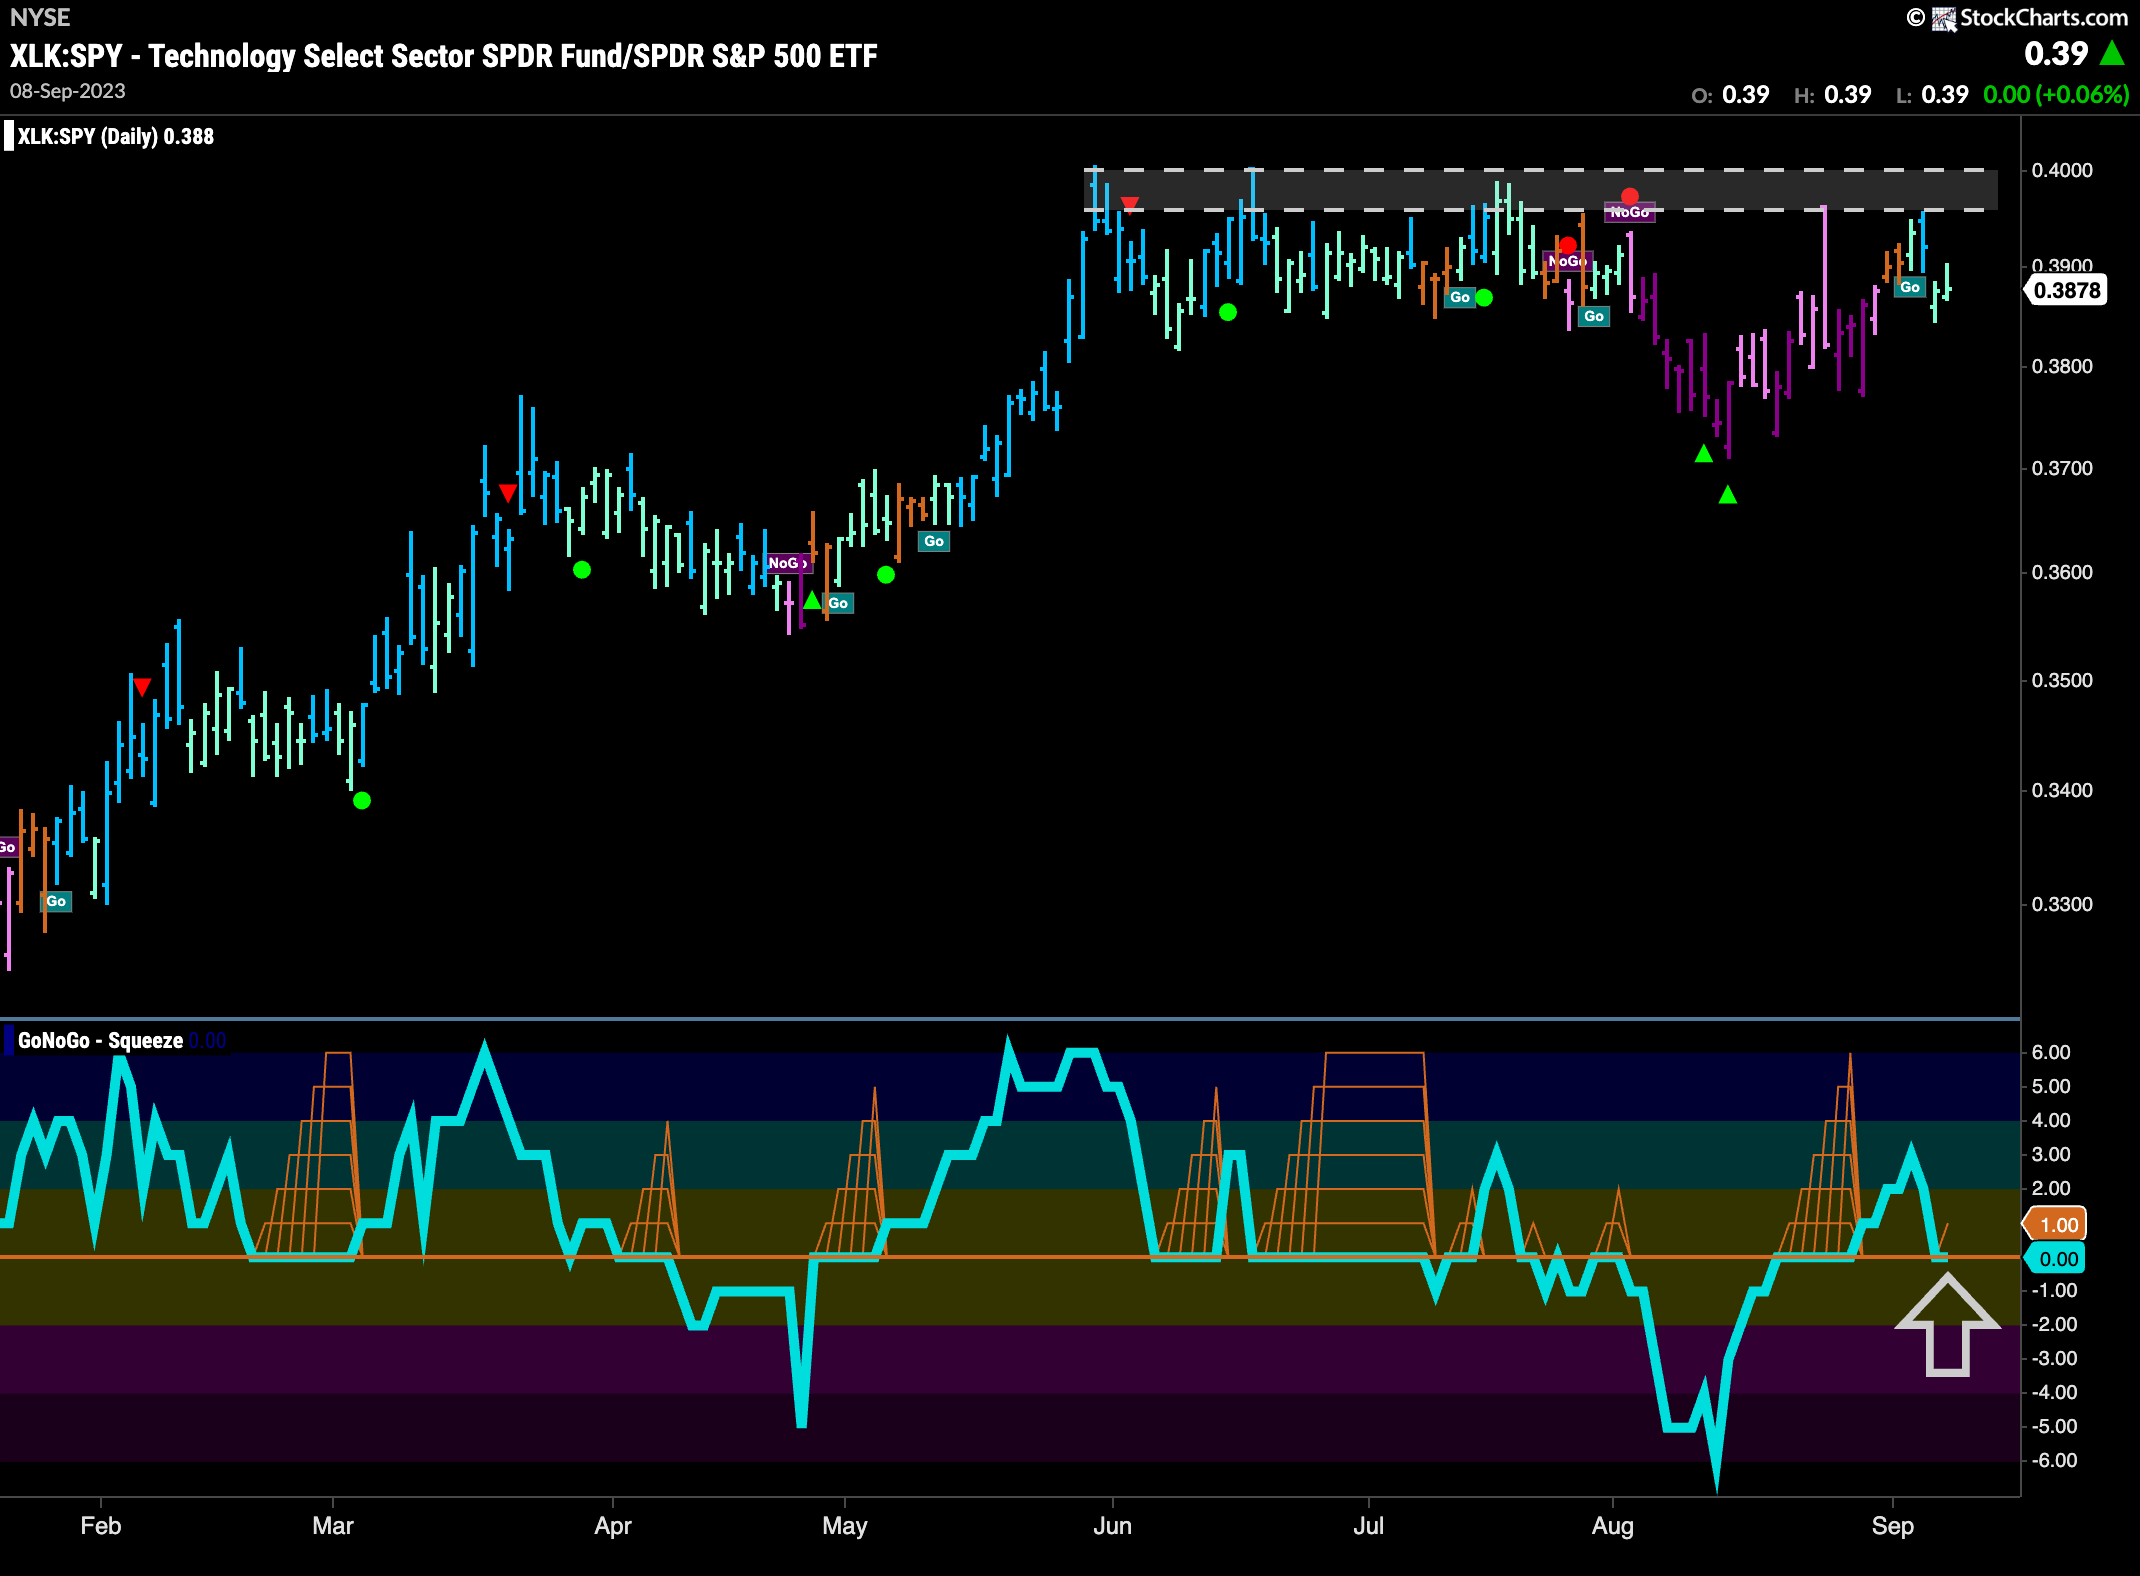
The GoNoGo Sector RelMap above showed that technology had returned to a position of leadership on a relative basis. We can see that on the chart below which shows the GoNoGo suite of tools on a relative chart of $XLK to $SPY. After a corrective period that was reflected by the “NoGo” colors for much of the summer, we see a return to “Go” bars this past week. We must note the overhead resistance that will give this ratio some trouble going forward. however, GoNoGo Oscillator is testing the zero line from above where we will look to see if it finds support.
Technology Sub Group RelMap
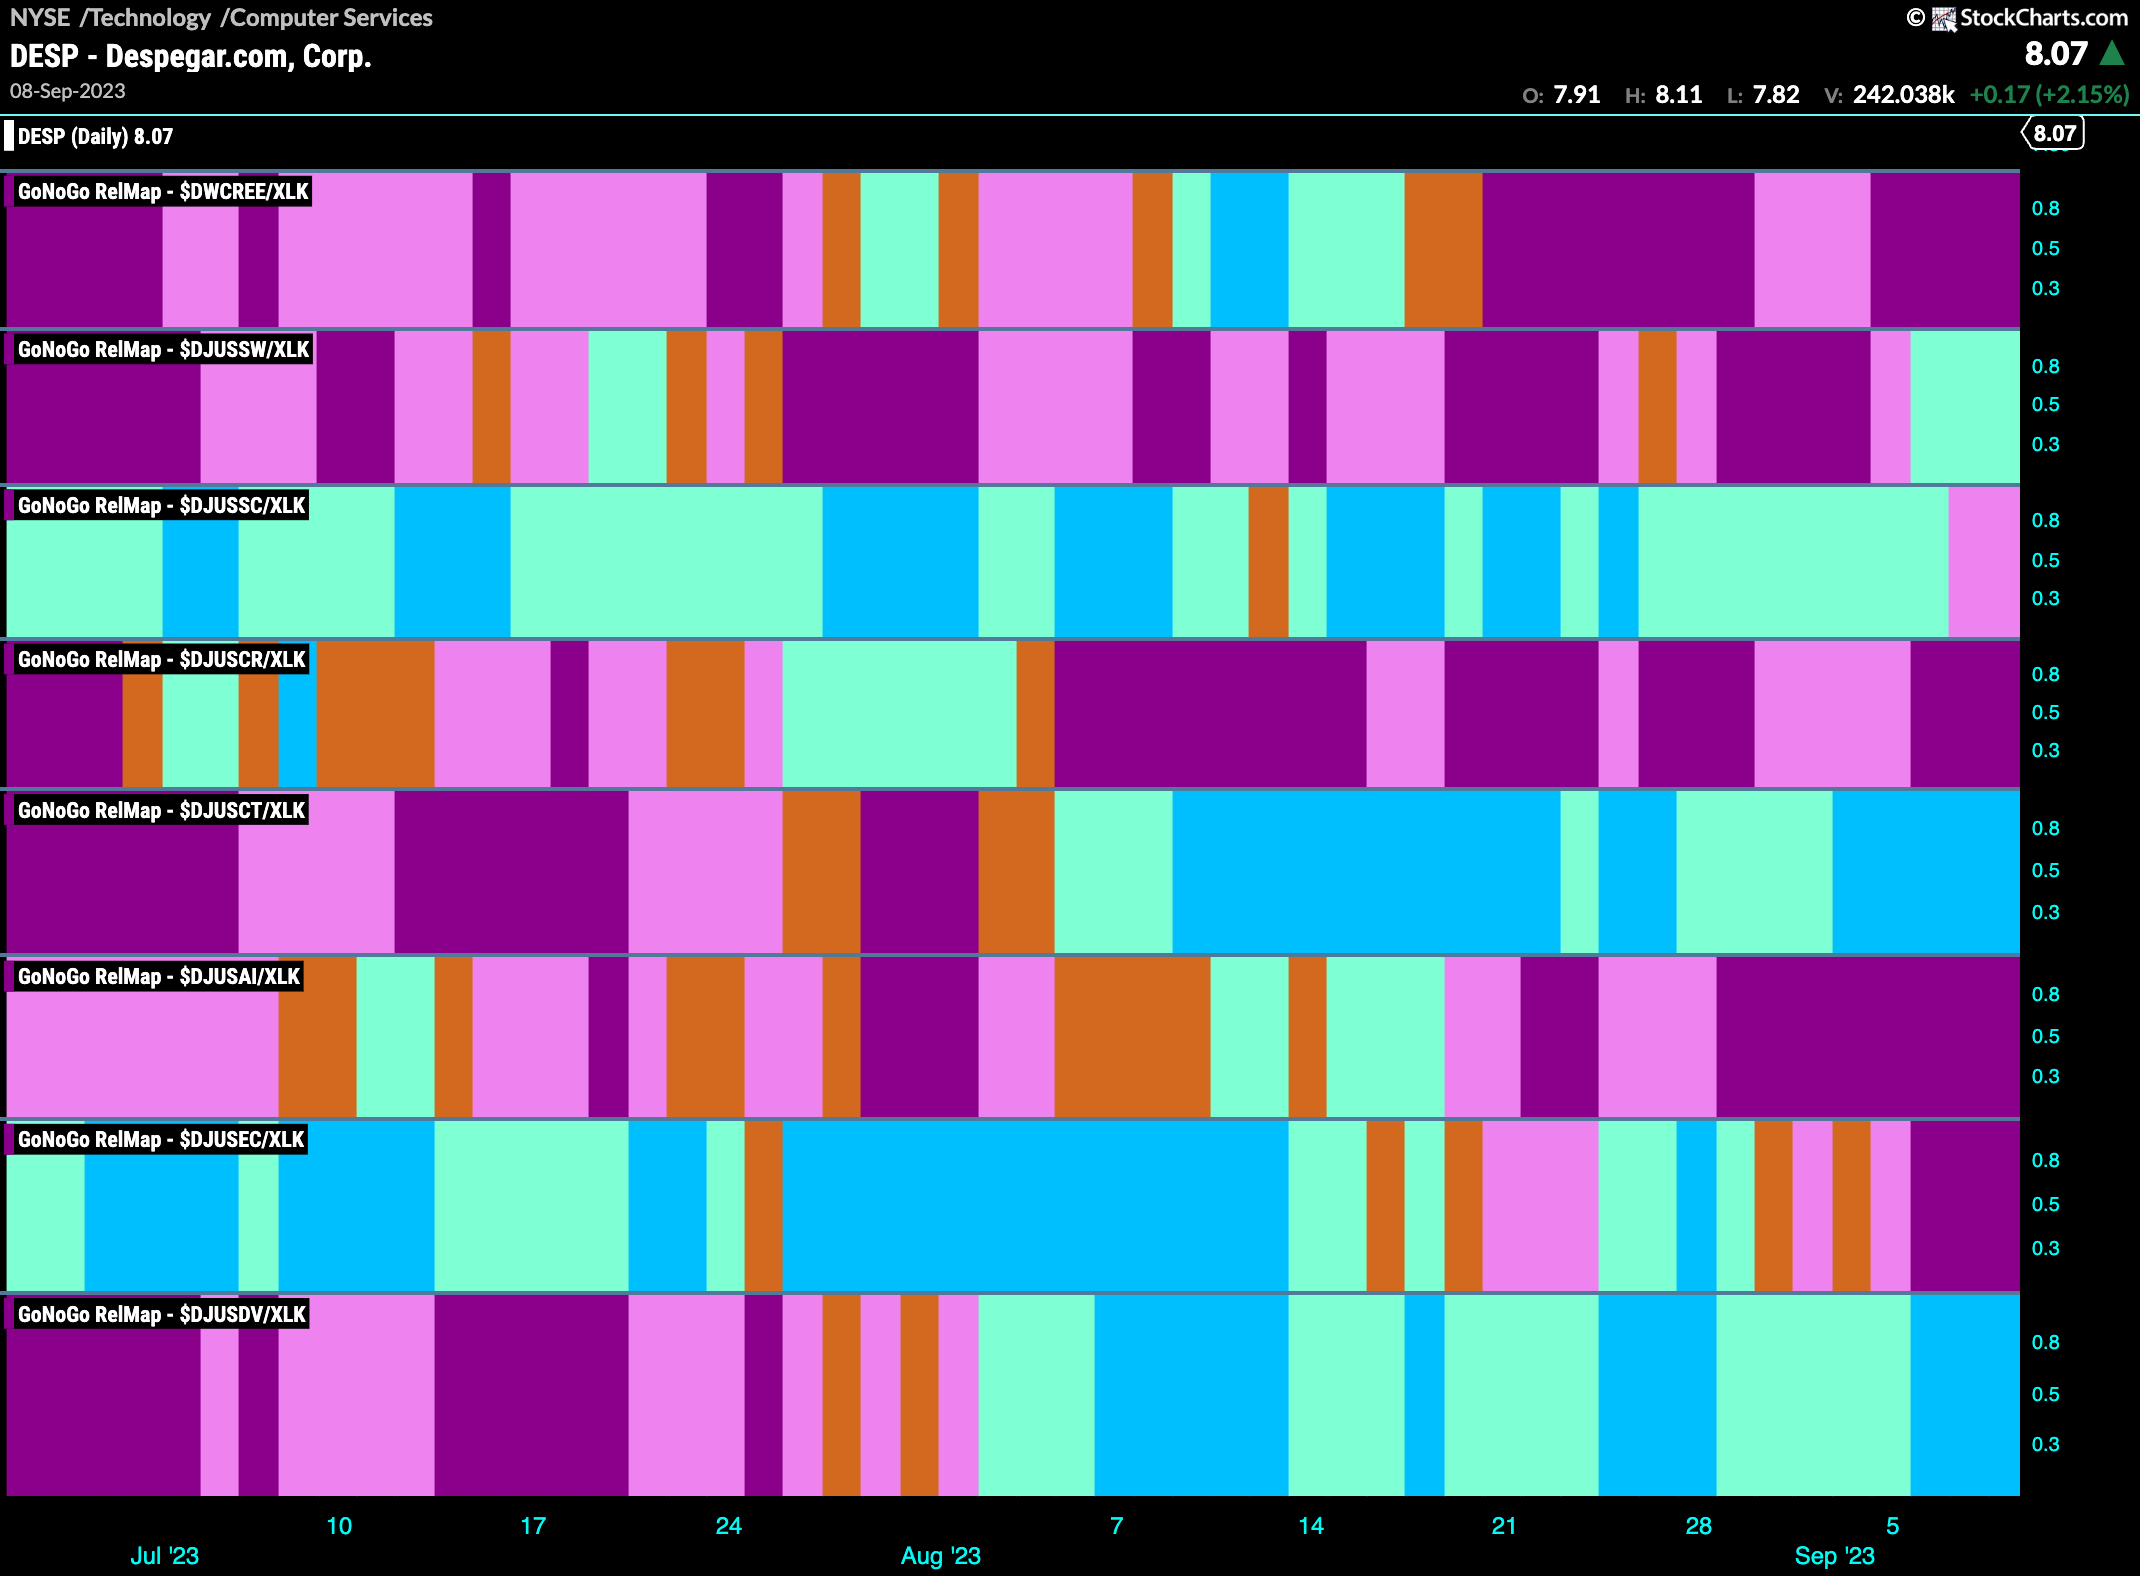
Looking at a breakdown of the groups within the technology sector relative to the $XLK, we can see a few areas of strength. Computer services and telecom equipment are in relative “Go” trends and so it would make sense to look to these industry groups for opportunities.
Despegar.com in Max Squeeze
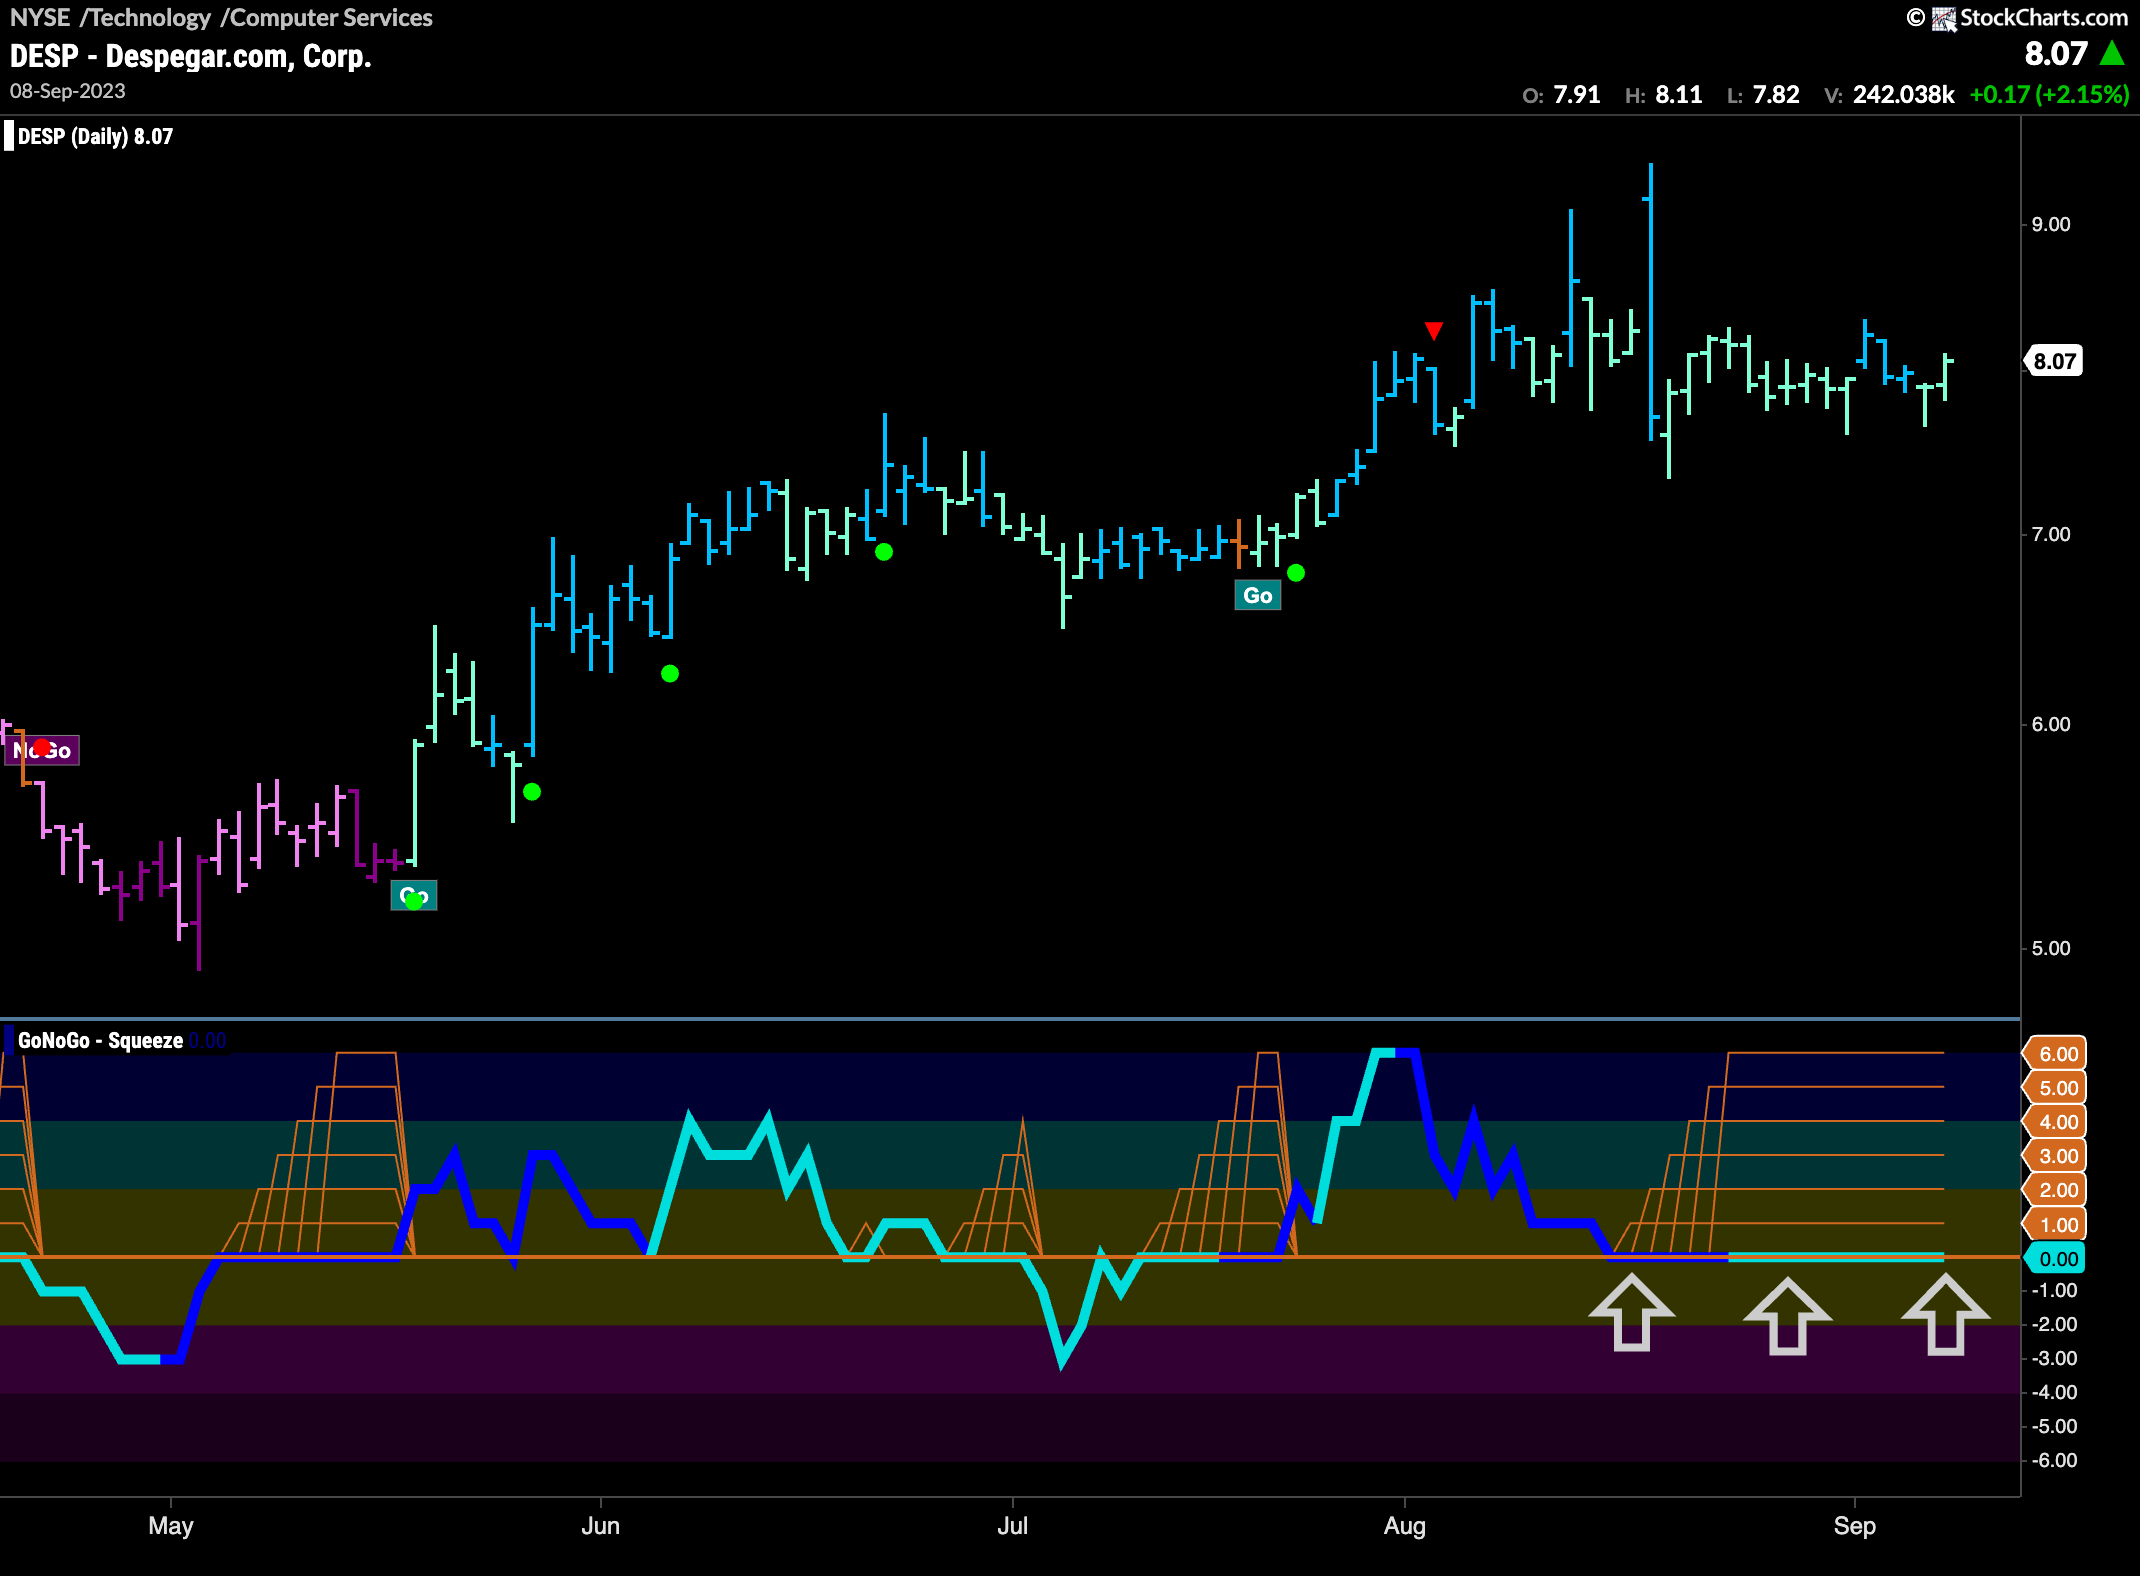
The chart below shows $DESP using daily prices and with the full suite of GoNoGo tools applied. What jumps of the chart is that we are in a battle as buyers and sellers clash over the future direction of the stock. Having been in a “Go” trend since late May, we have seen the GoNoGo Oscillator remain primarily at or above the zero line. More recently, as price has moved sideways, the oscillator has fallen to test the zero line. This time, it has stayed at that level as the market shows no directional influence. A Max GoNoGo Squeeze is in place and it will be important to see in which direction the squeeze is broken. If the oscillator returns to positive territory we will look for a new high in price.
Palo Alto Networks Flashes new “Go”
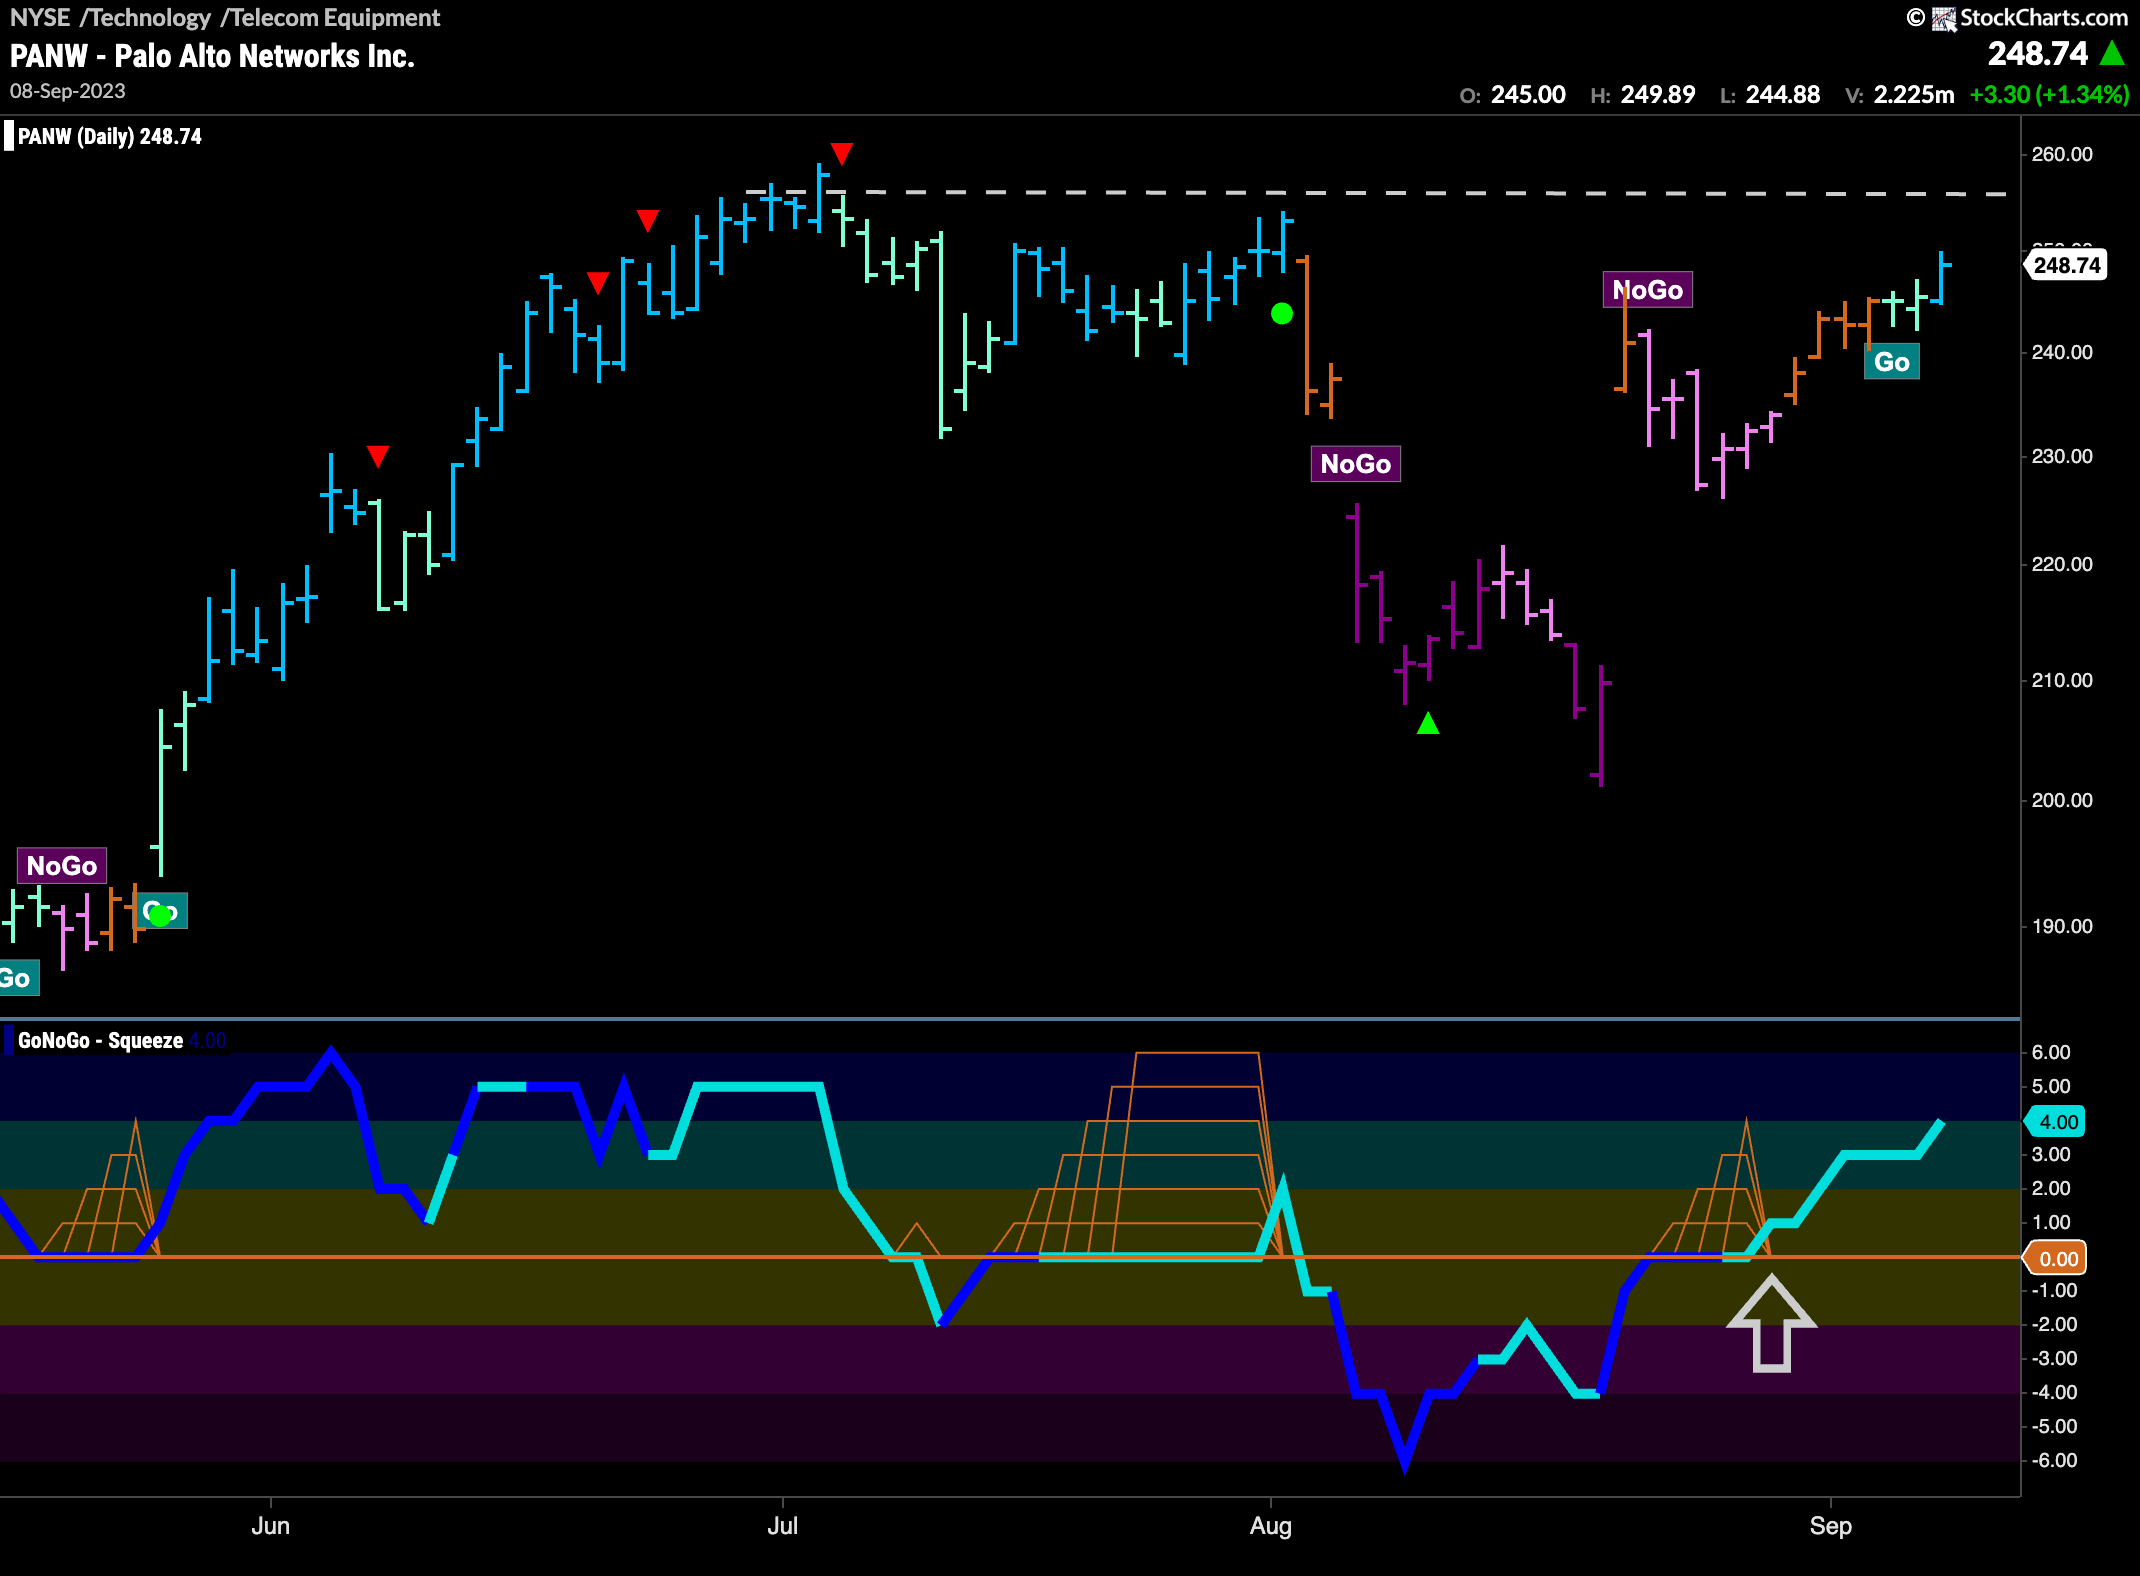
$PANW has shown much volatility over the summer. Having experienced a deep “NoGo” correction, we saw GoNoGo Oscillator burst back into positive territory a few weeks ago. This followed price as it gapped higher. Cycling through amber “Go Fish” bars, GoNoGo Trend is now painting new “Go” colors with the oscillator in positive territory but not yet overbought. We will see if this momentum and new trend gives price the push it needs to set a new higher high.
