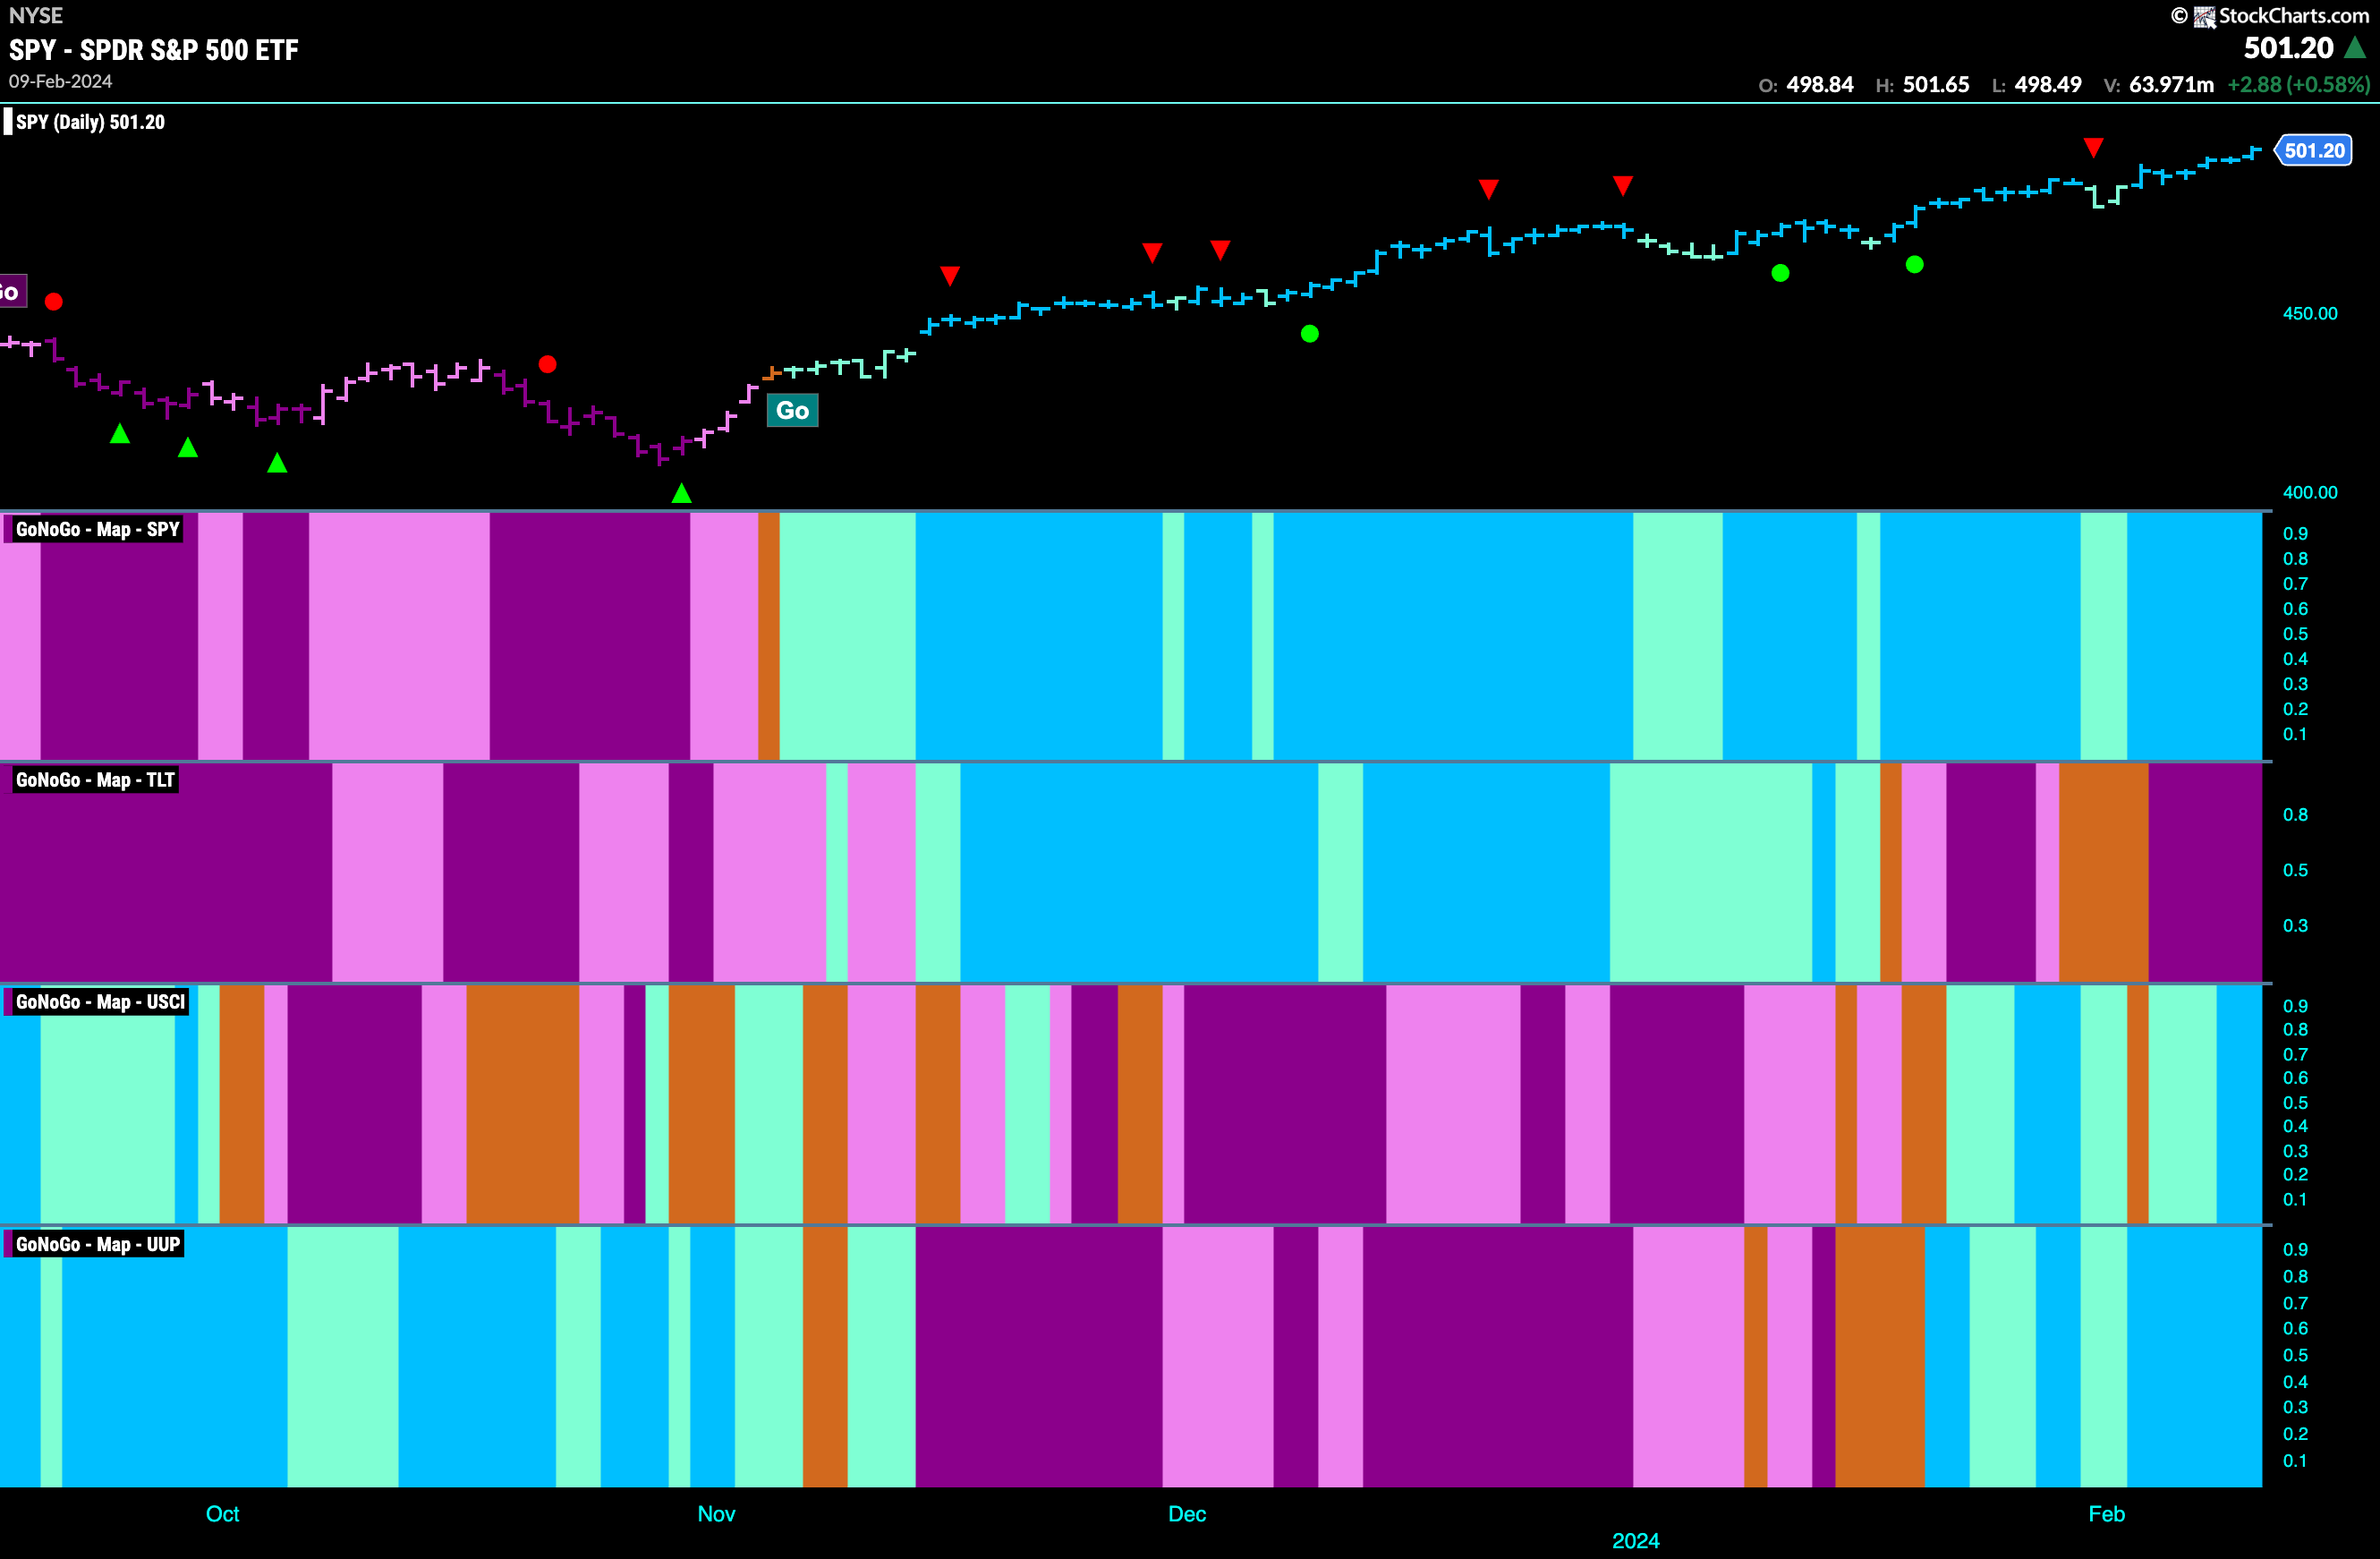
Good morning and welcome to this week’s Flight Path. Equities went from strength to strength this past week as we saw a string of uninterrupted strong blue “Go” bars. Treasury bond prices saw the uncertainty of “Go Fish” bars give way to strong purple “NoGo” bars this week and we’ll look at what this means for rates in a little while. The U.S. Commodity index saw a return to stronger blue “Go” bars late in the week and the U.S. dollar held onto its strong blue “Go” bars this week as well.
U.S. Equities Sees New Highs on Strong “Go” Bars
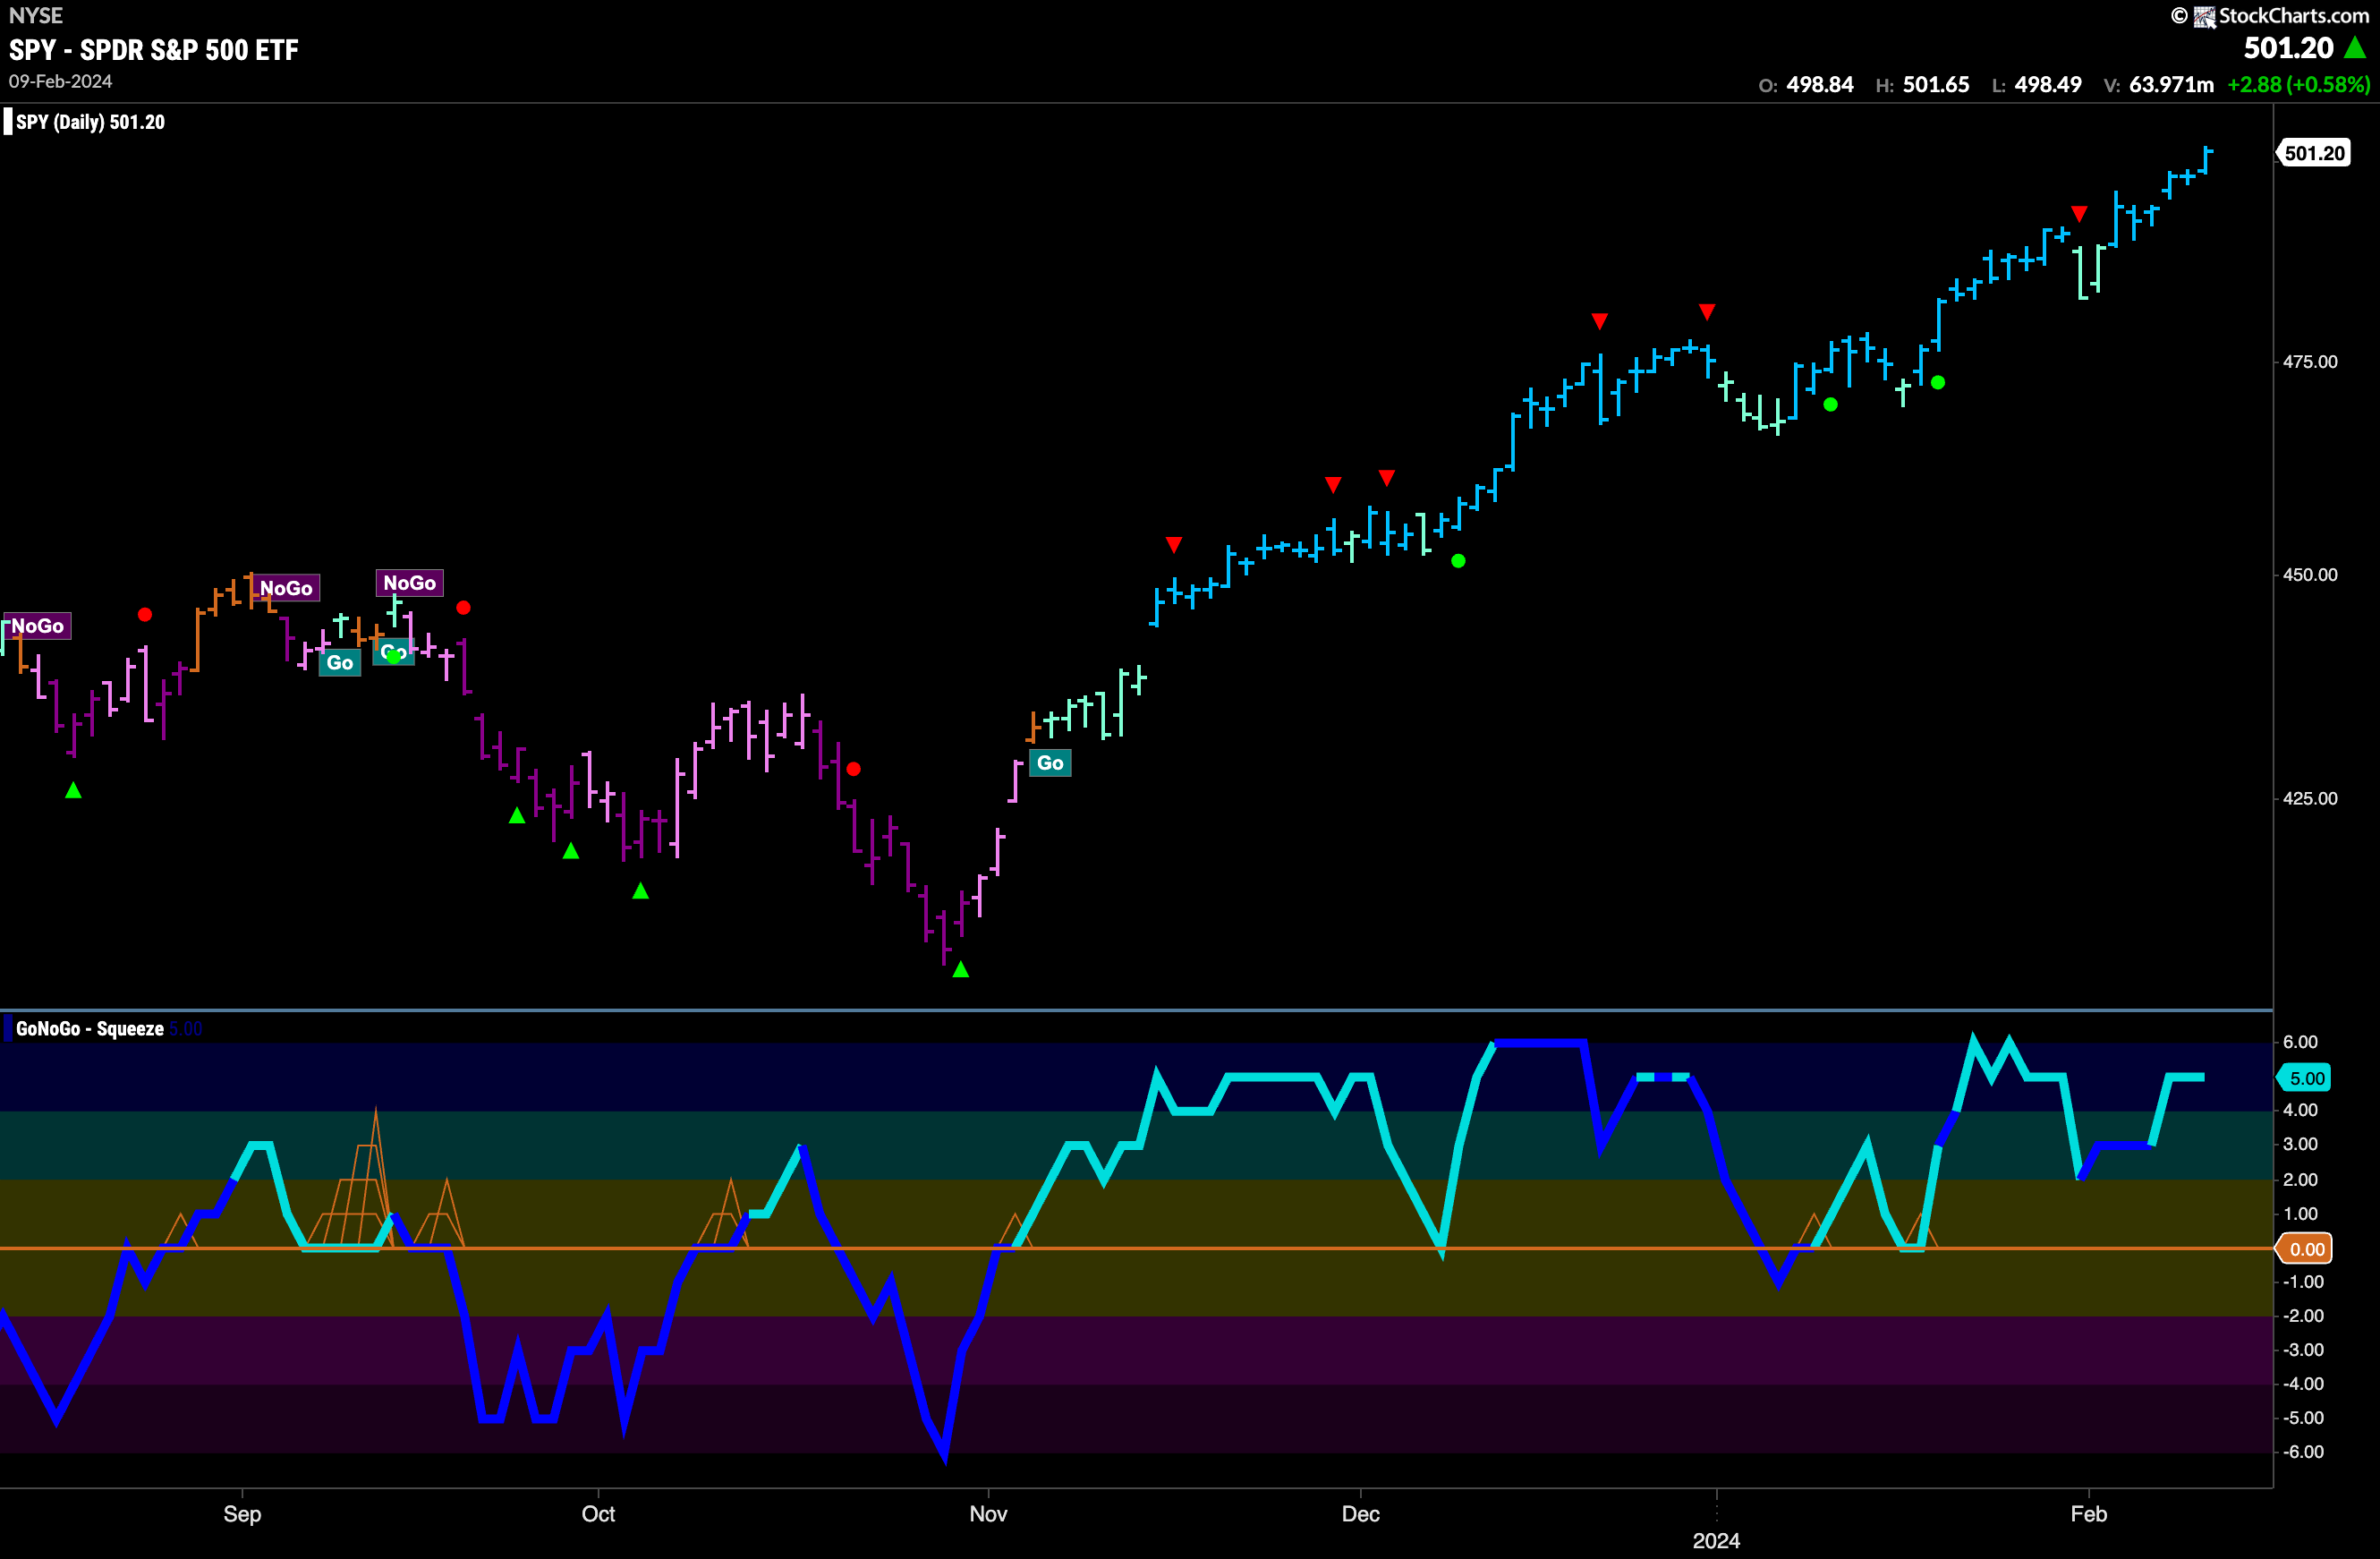
No wobble this week for U.S. equities. We saw a run of strong blue “Go” bars as price climbed to ever higher highs. Price just about raced past the threat posed by a Go Countertrend Correction Icon (red arrow) that we saw late the week before. GoNoGo Oscillator is once again in overbought territory but not quite in such extremes as the last time. We will watch to see what happens as momentum cools after this latest run.
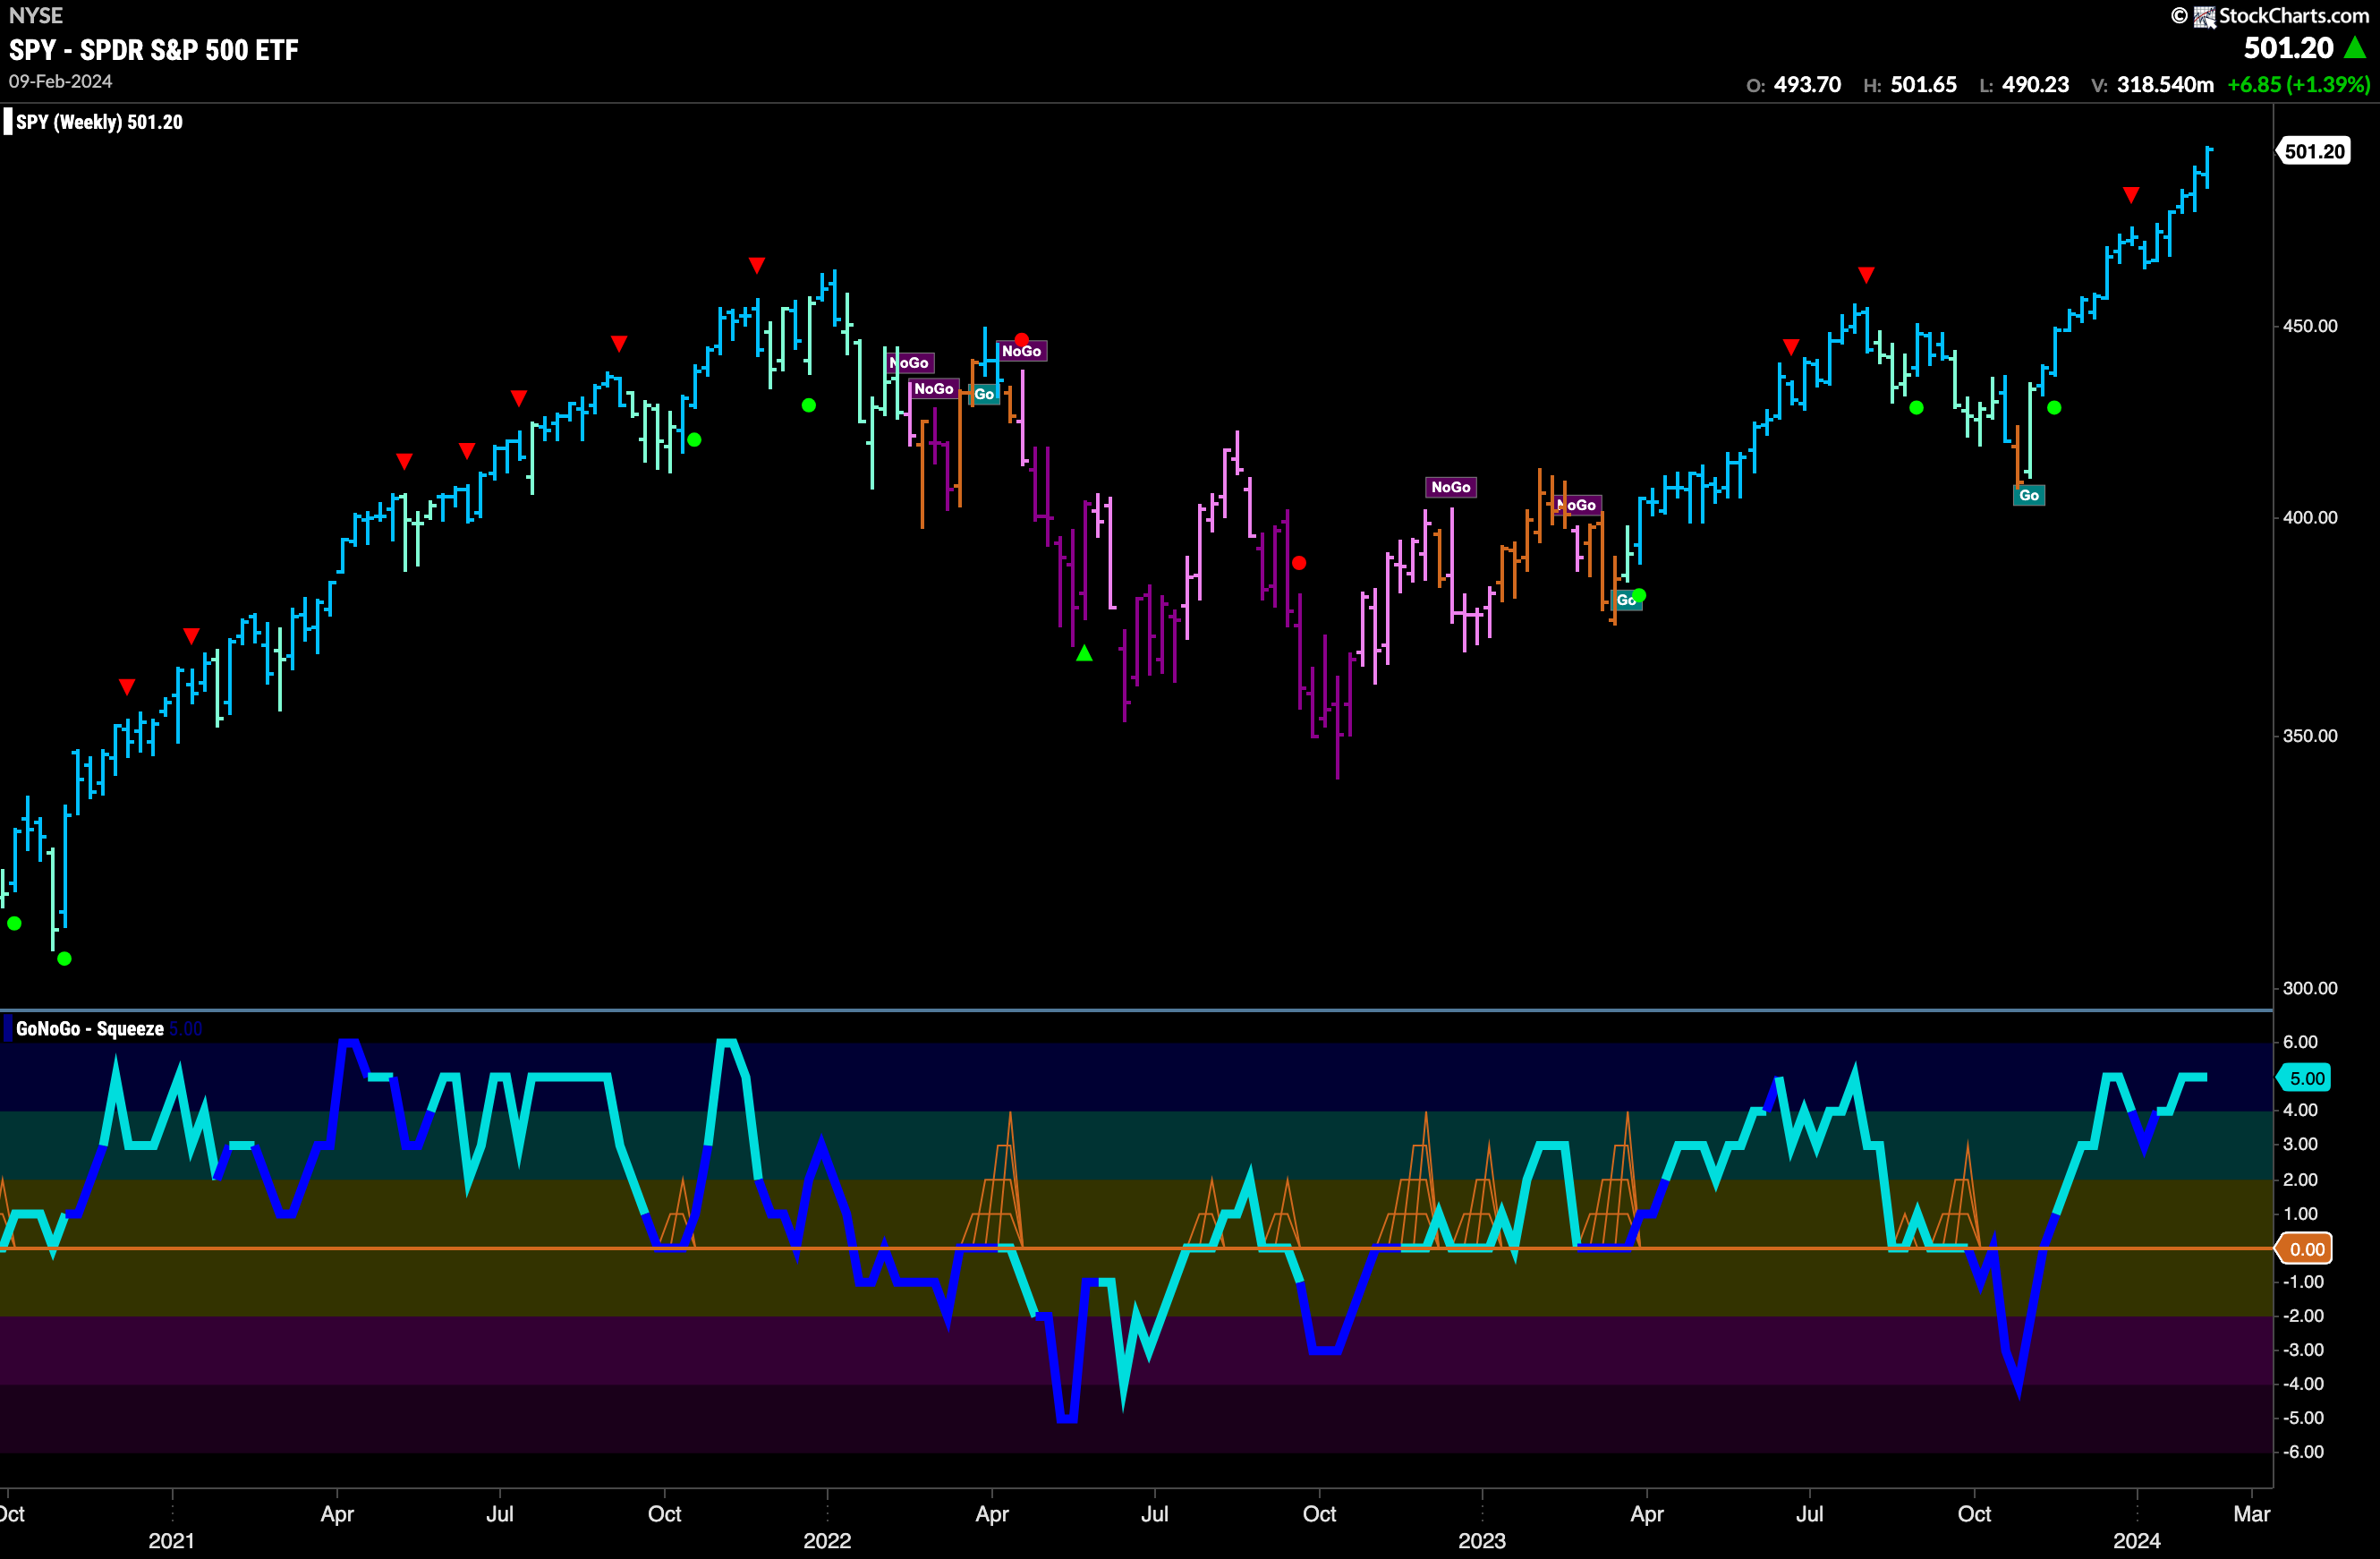
The weekly chart has shown nothing but strength for months now. Another weekly higher high was set and this makes five in a row and 14 out of the last 15 weeks with higher closes. GoNoGo Oscillator is overbought at a value of 5 and we will watch to see if momentum wanes as investors digest these latest gains.
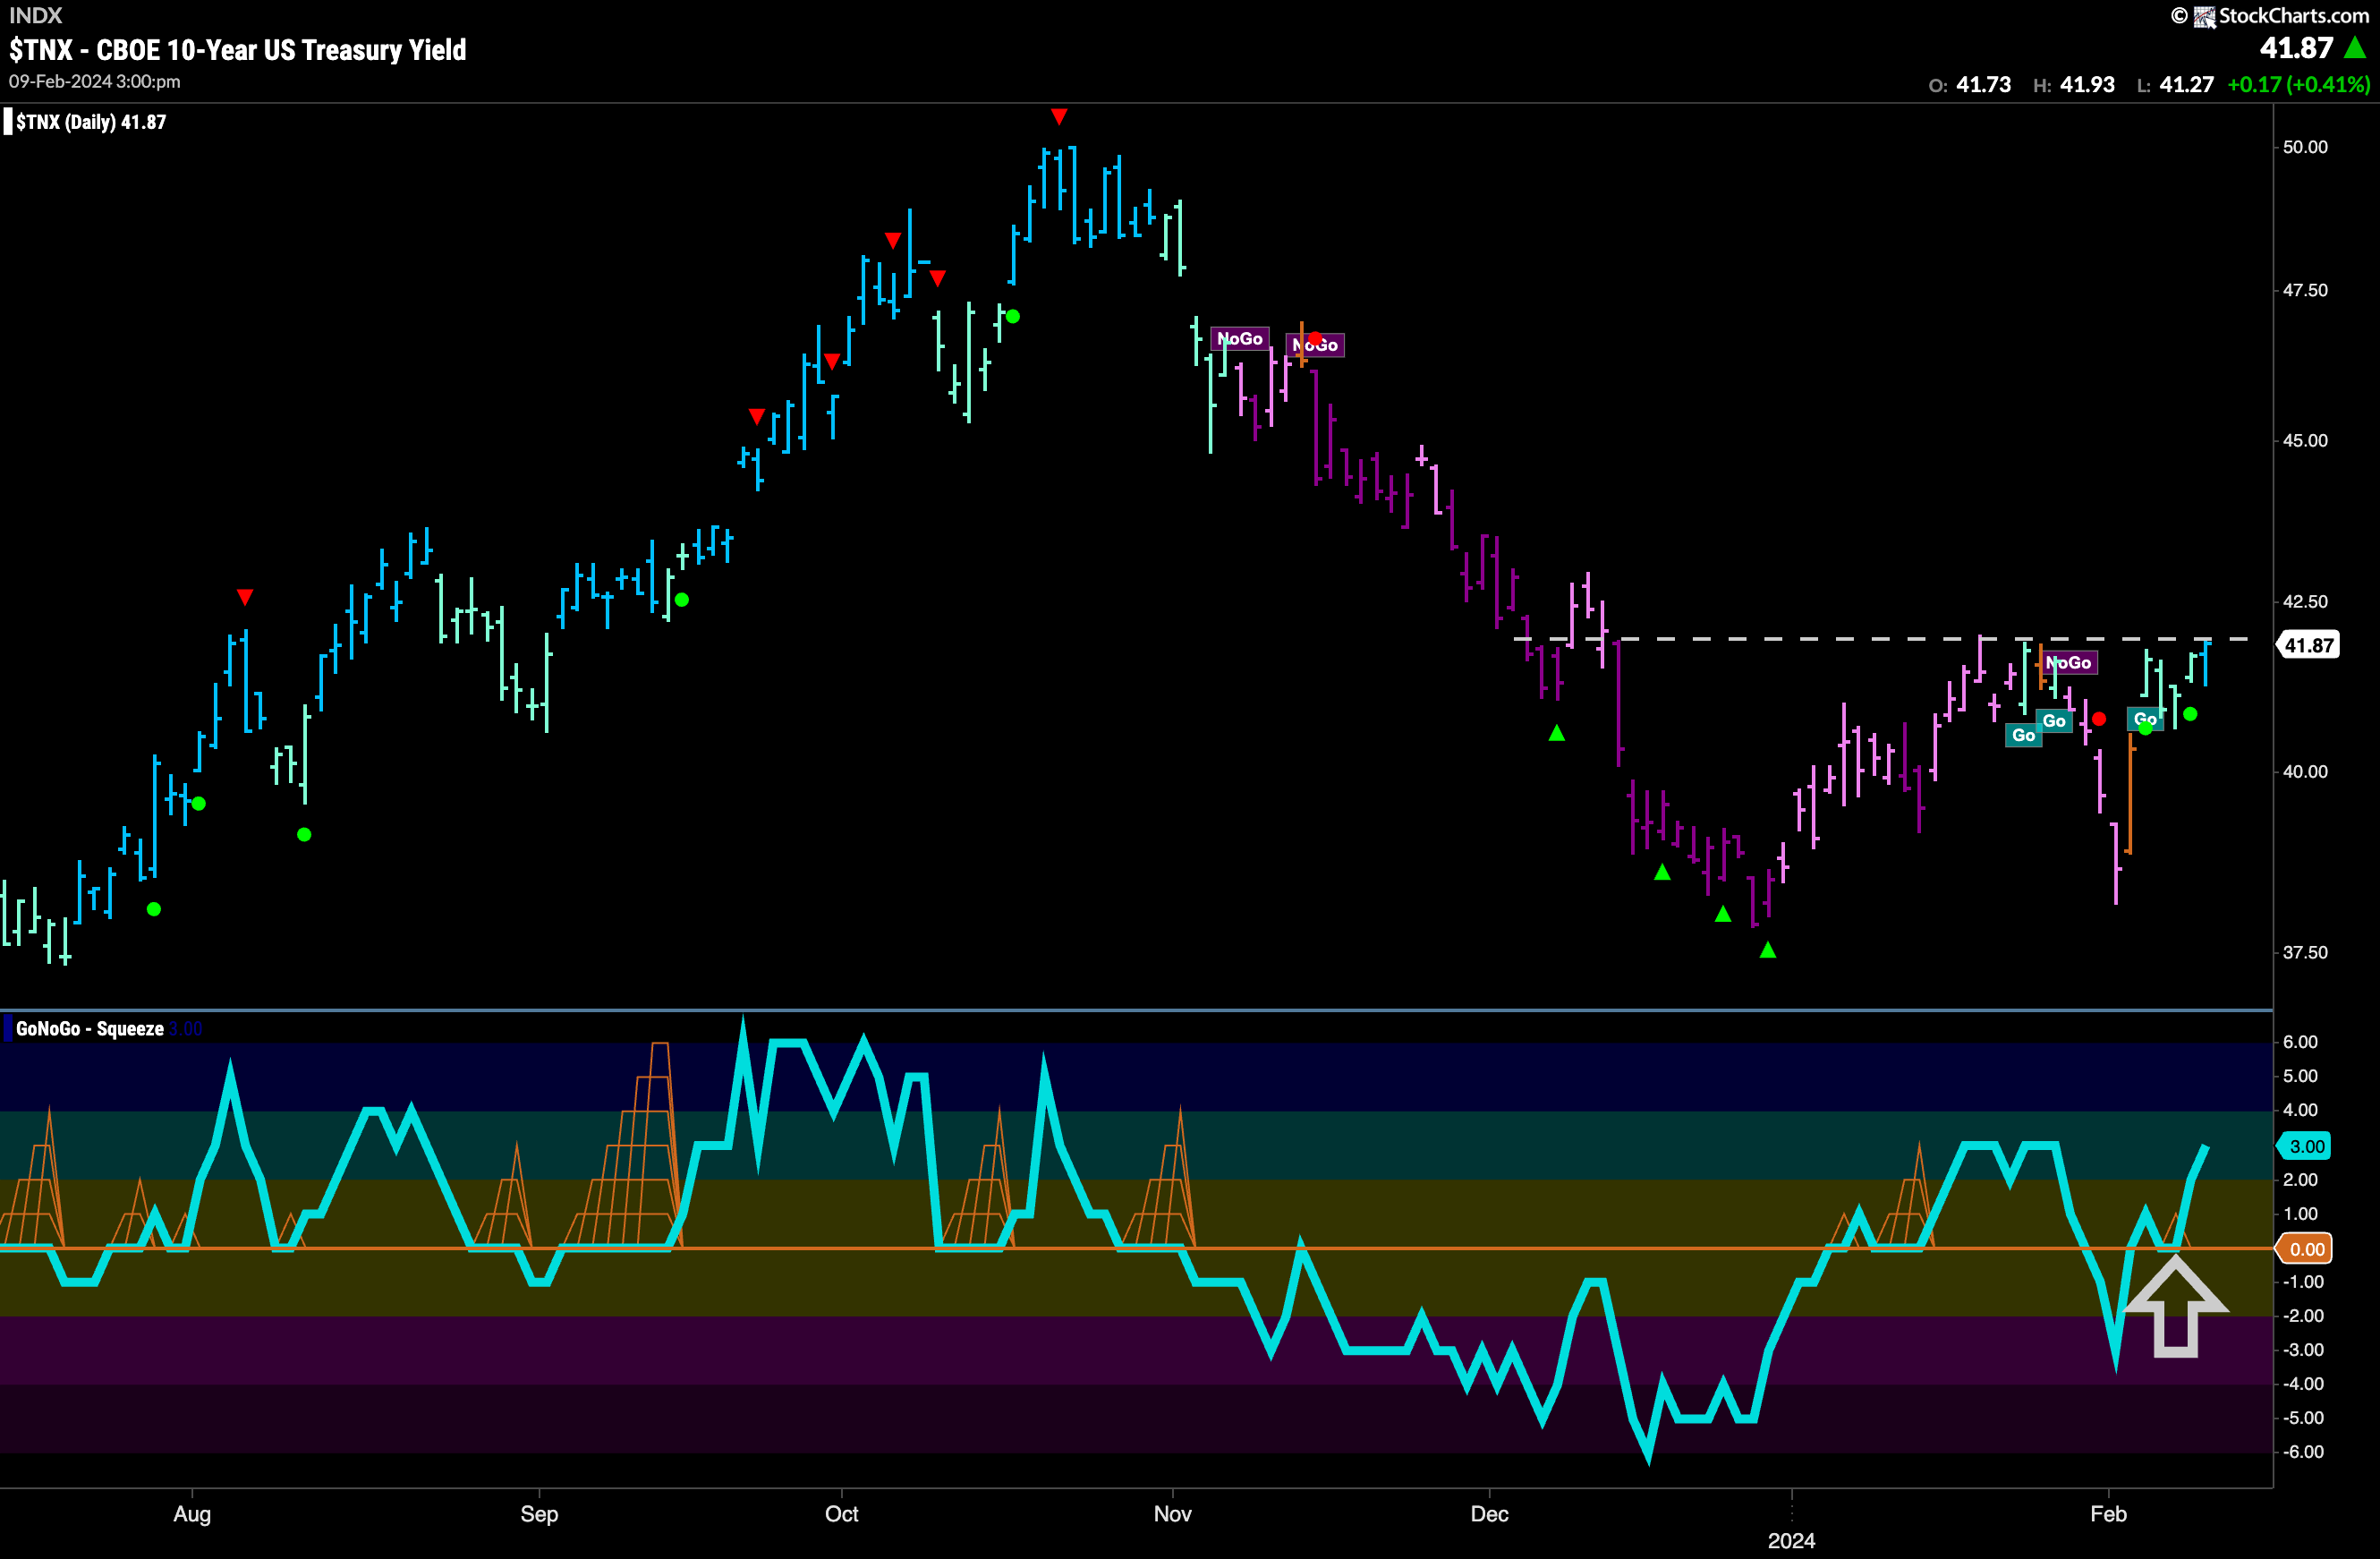
Rates Return to Test Resistance
After a quick foray into “NoGo” bars, we saw a strong rally that saw GoNoGo Trend paint a long amber “Go Fish” bar that reflected uncertainty in that new “NoGo” trend and indeed this past week saw the indicator paint “Go” bars, first aqua and then the stronger blue at the end of the week. GoNoGo Oscillator broke back into positive territory about a week ago and then found support at this level. We will watch to se if this renewed momentum in the direction of the new “Go” trend will be enough to push price above resistance.
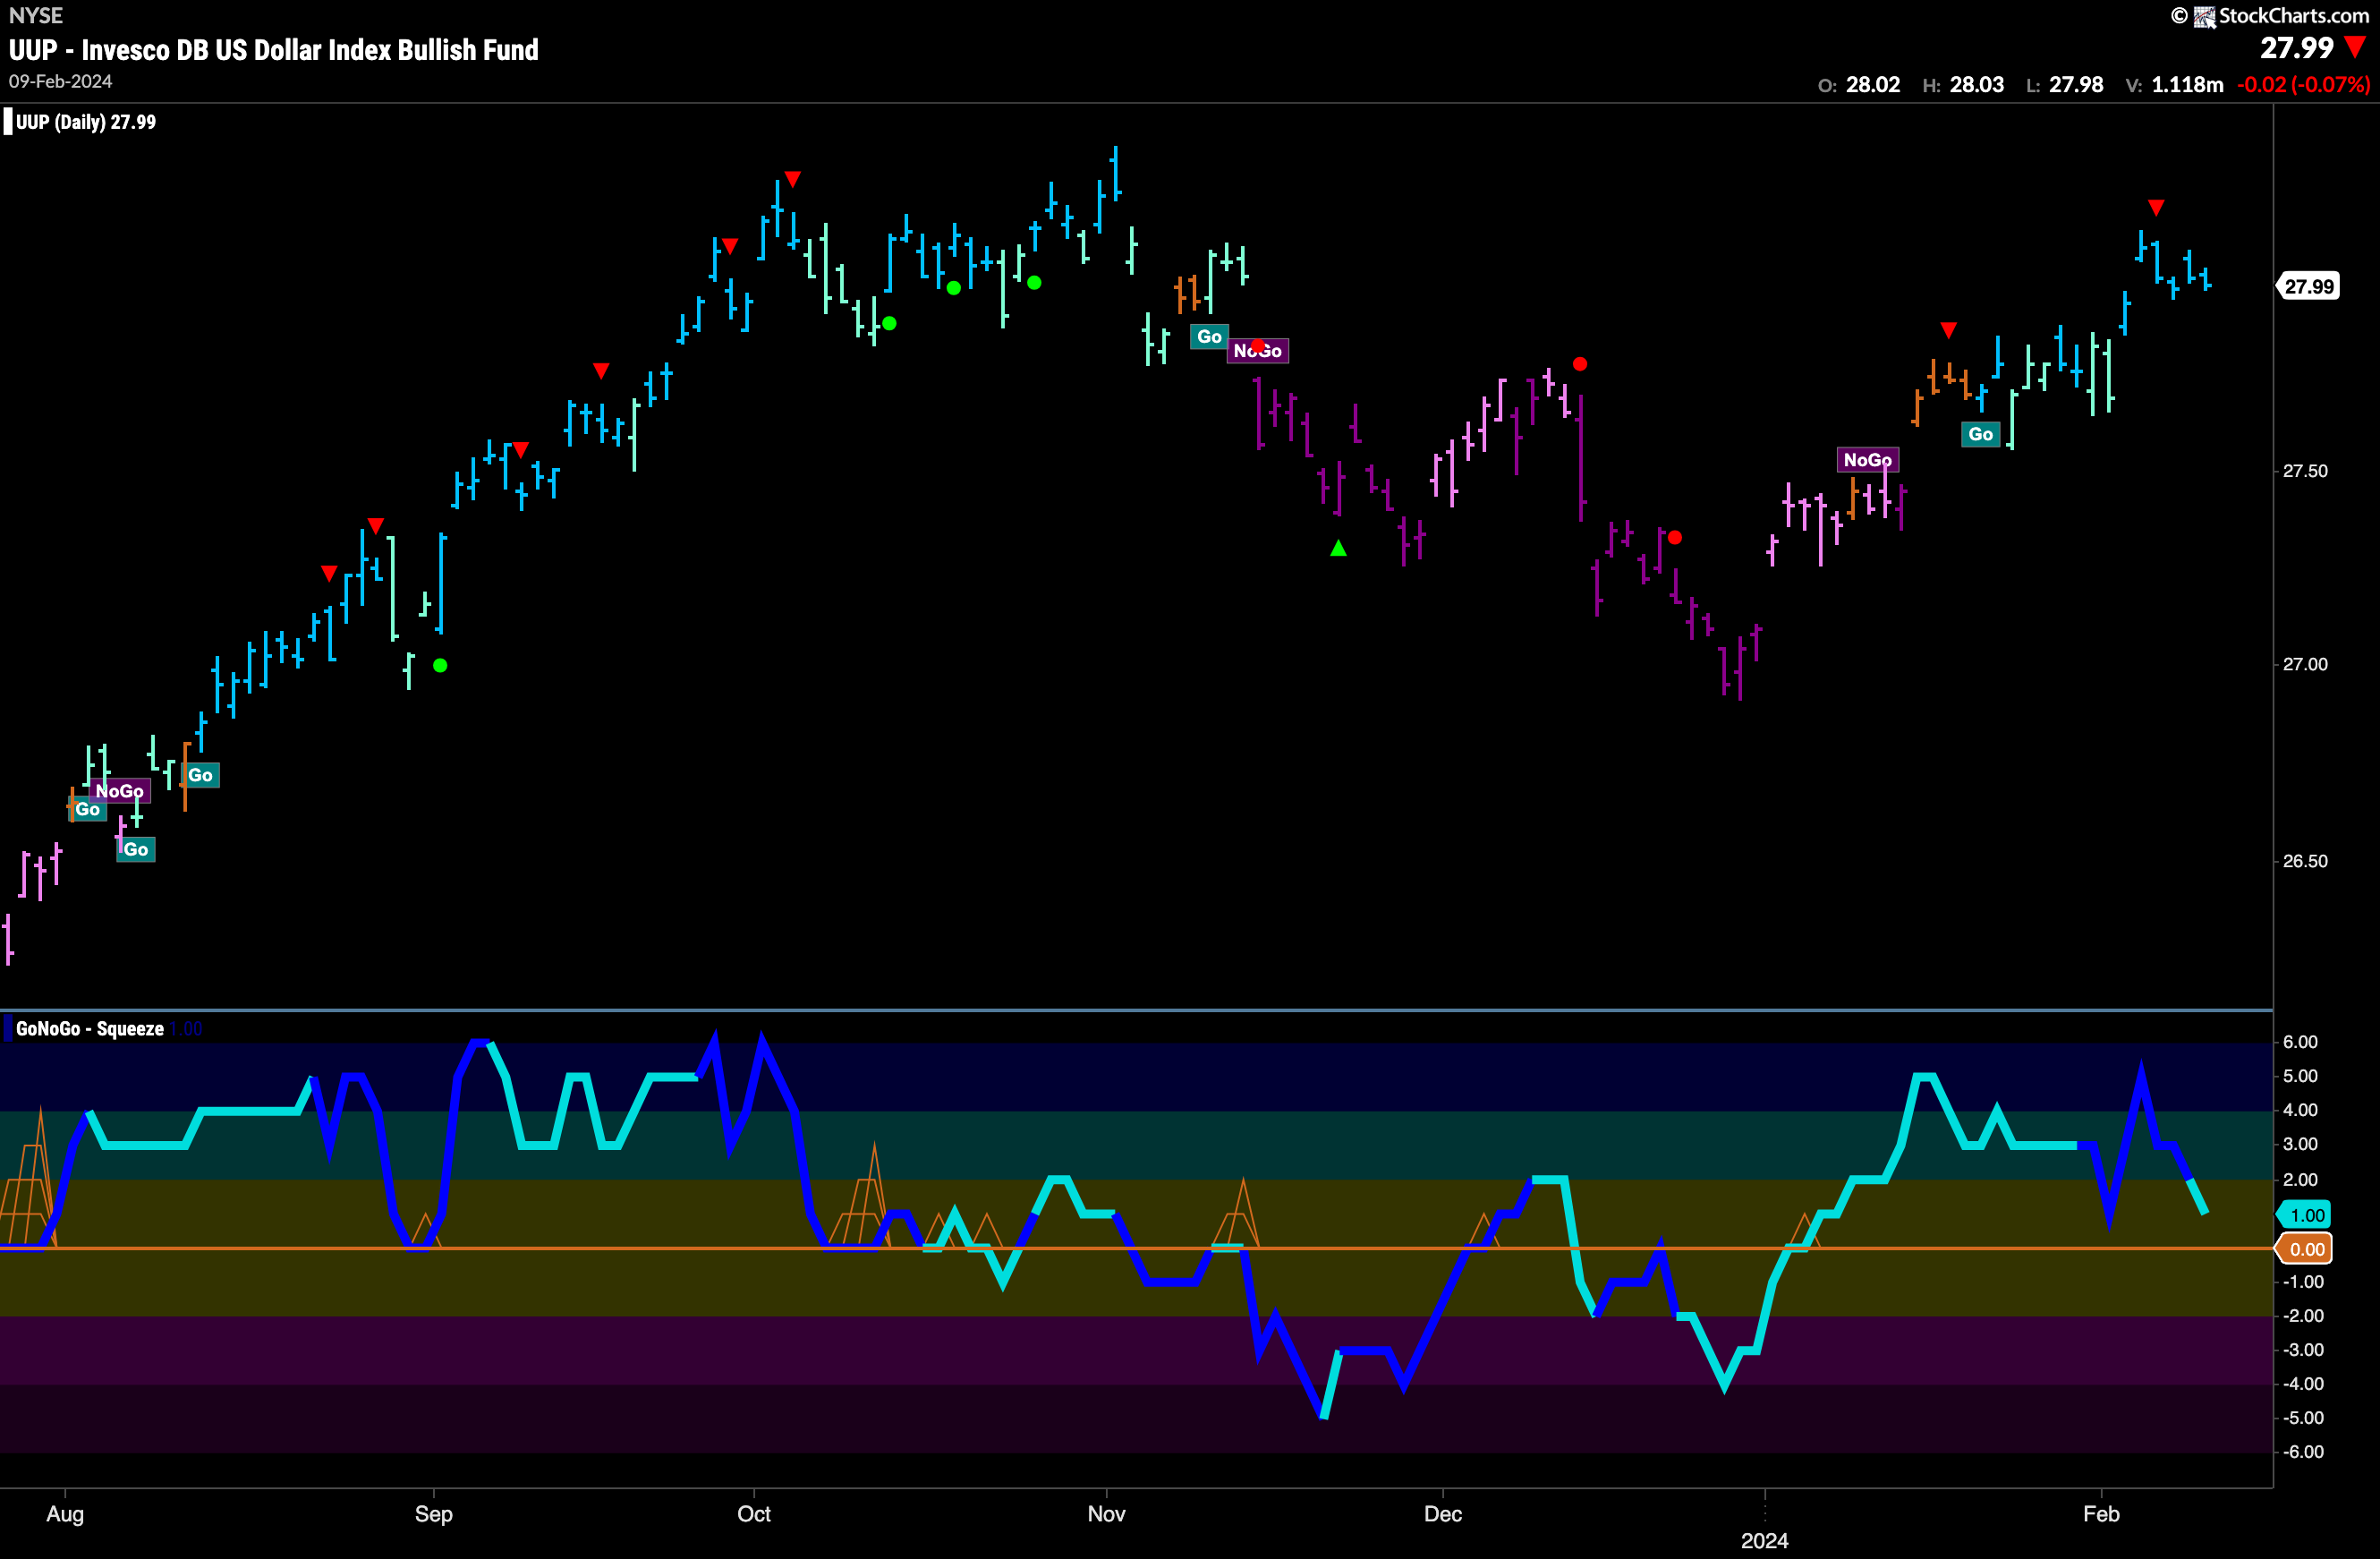
The Dollar Consolidates in “Go” trend
The chart below shows that the “Go” trend persisted this week and price looks to be consolidating at new highs after gapping higher at the beginning of the week. A new higher high is now in place and we will look to see if price can set a new higher low before attempting to go higher again. GoNoGo Oscillator is fast approaching the zero line from above where we will watch to see if it finds support. Should the oscillator remain in positive territory that might give price the support it needs to take another leg higher.
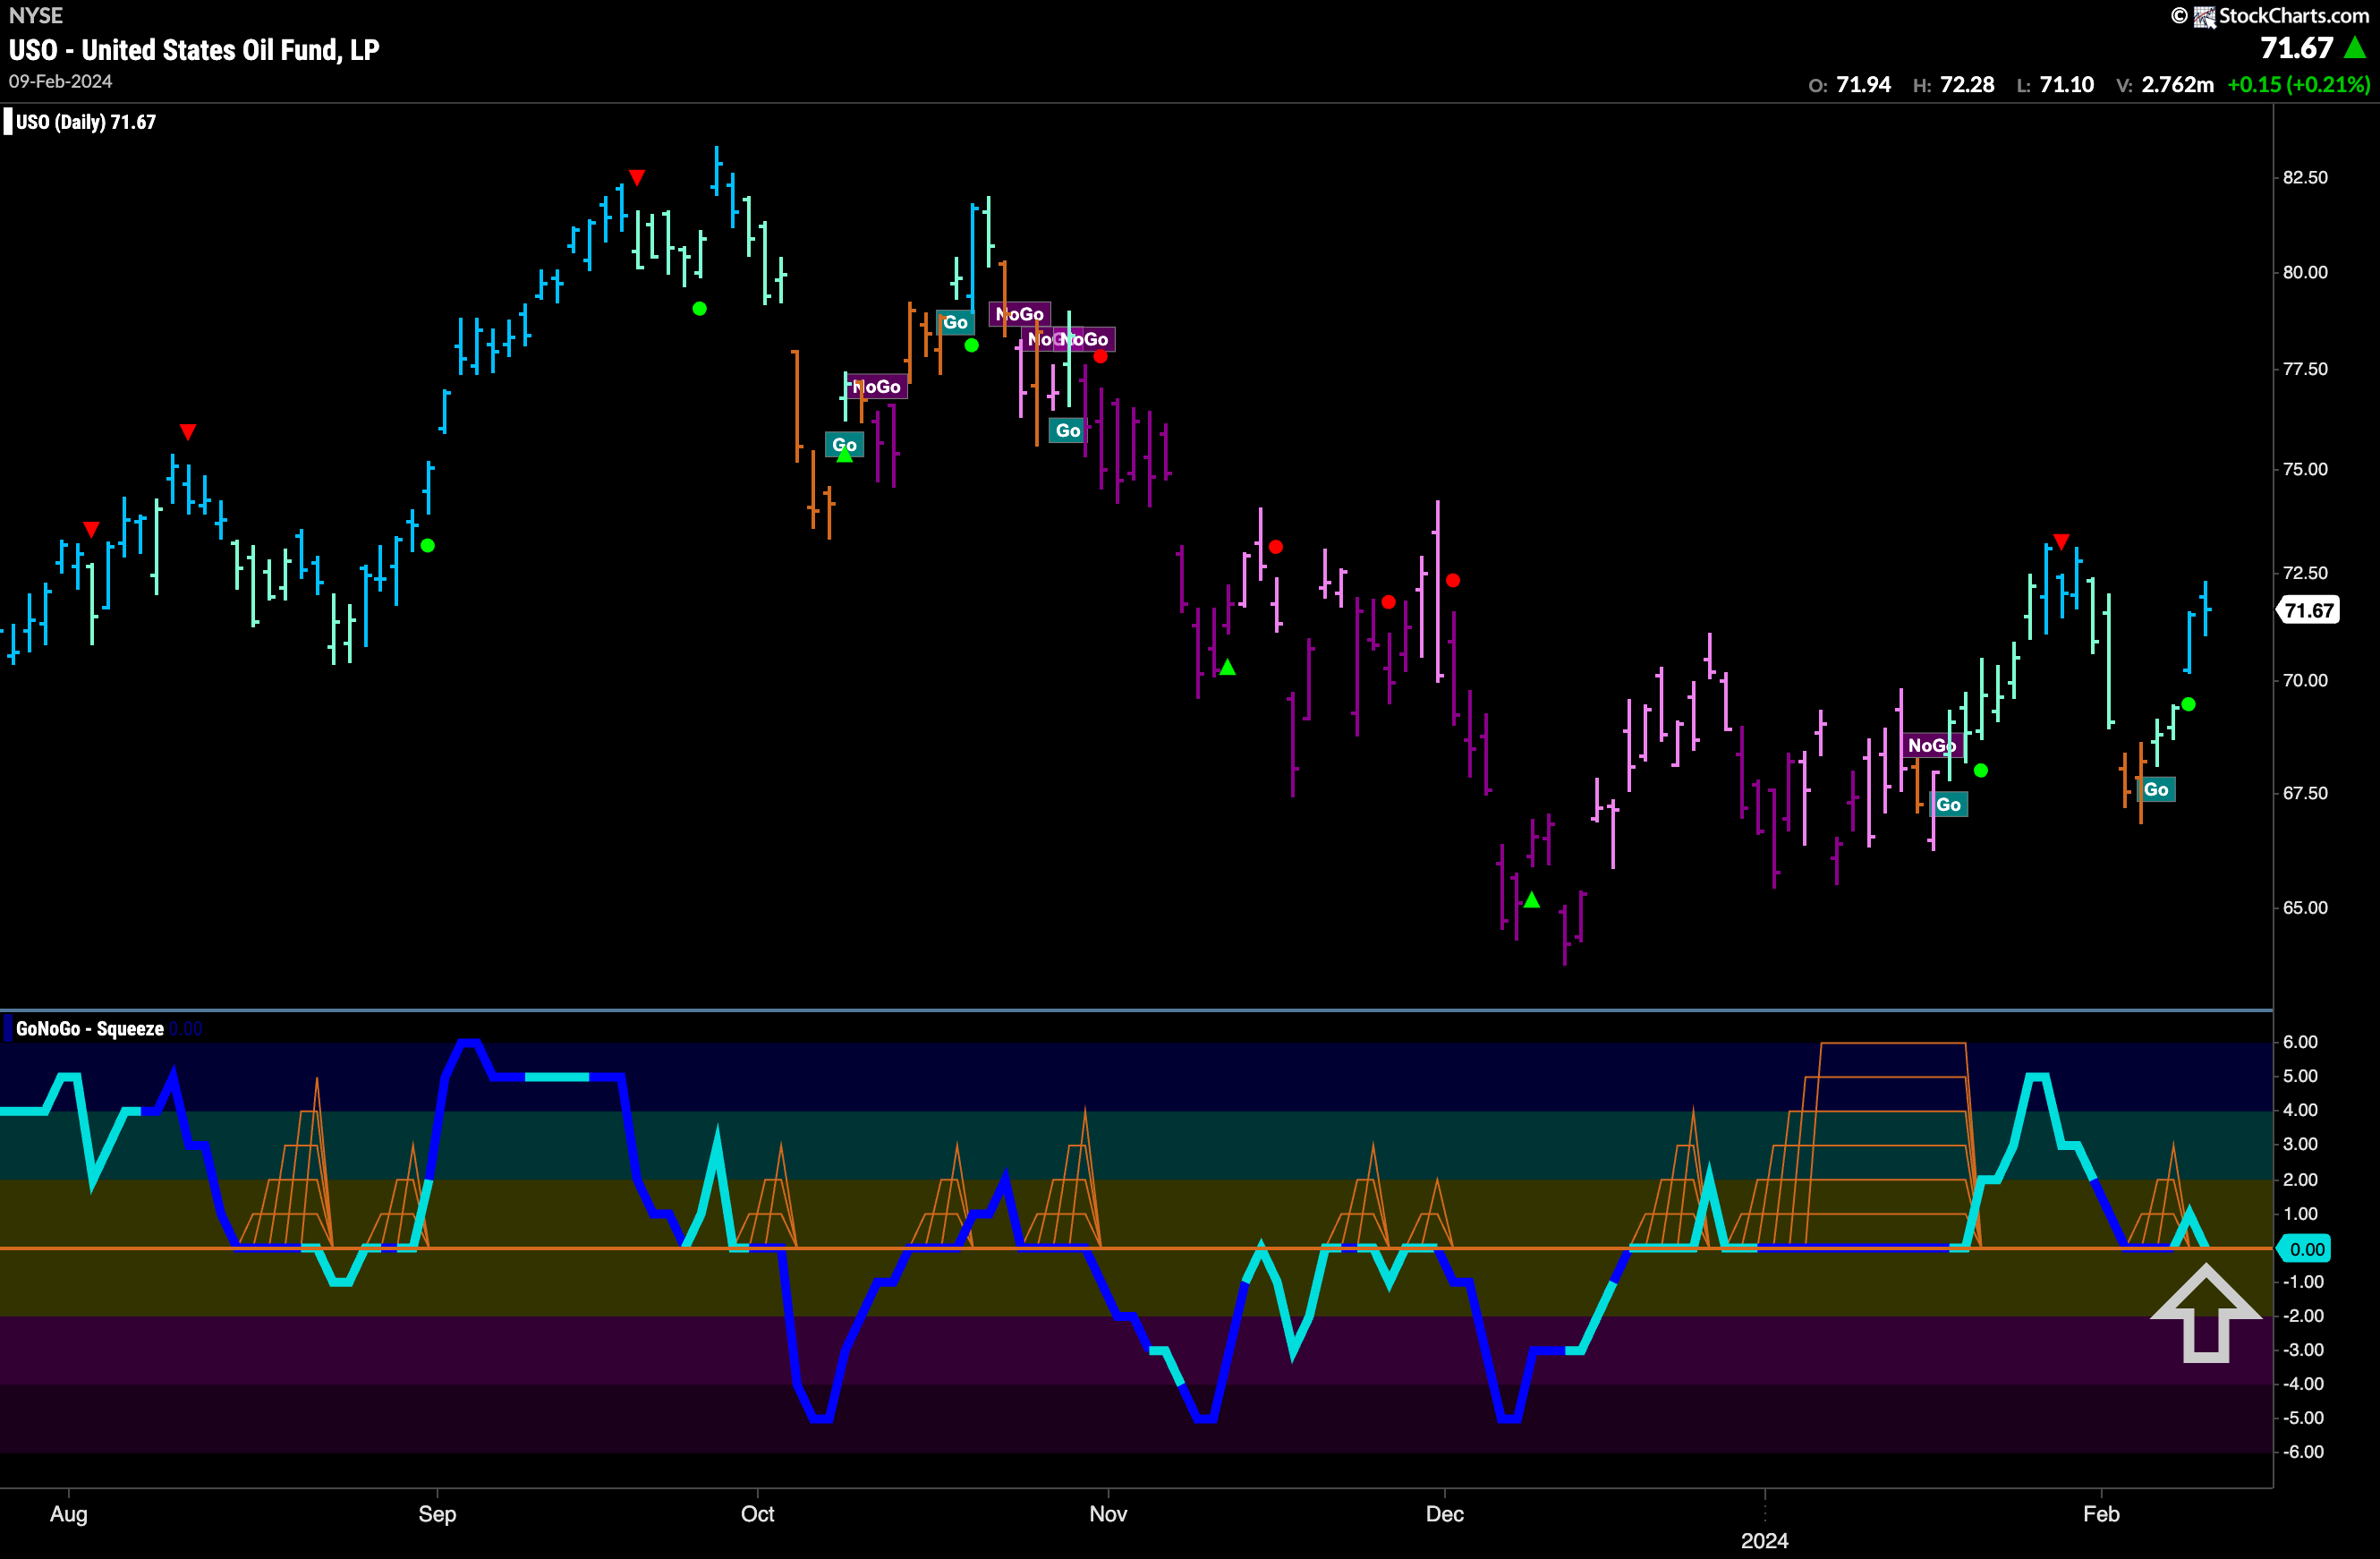
Oil Rallies Back into “Go” Trend
GoNoGo Trend moved through amber “Go Fish” bars that reflected uncertainty and painted “Go” bars this week. First, a couple of weaker aqua bars identified the new trend and then these were followed by two strong blue “Go” bars. This happened as GoNoGo Oscillator appeared to be finding support at the zero line having broken out of that Max GoNoGo Squeeze into positive territory. The oscillator is now once again back at the zero line testing that level for support. If it holds the zero we could say that momentum is resurgent in the direction of the underlying “Go” trend and would look for an attempt at a new high.
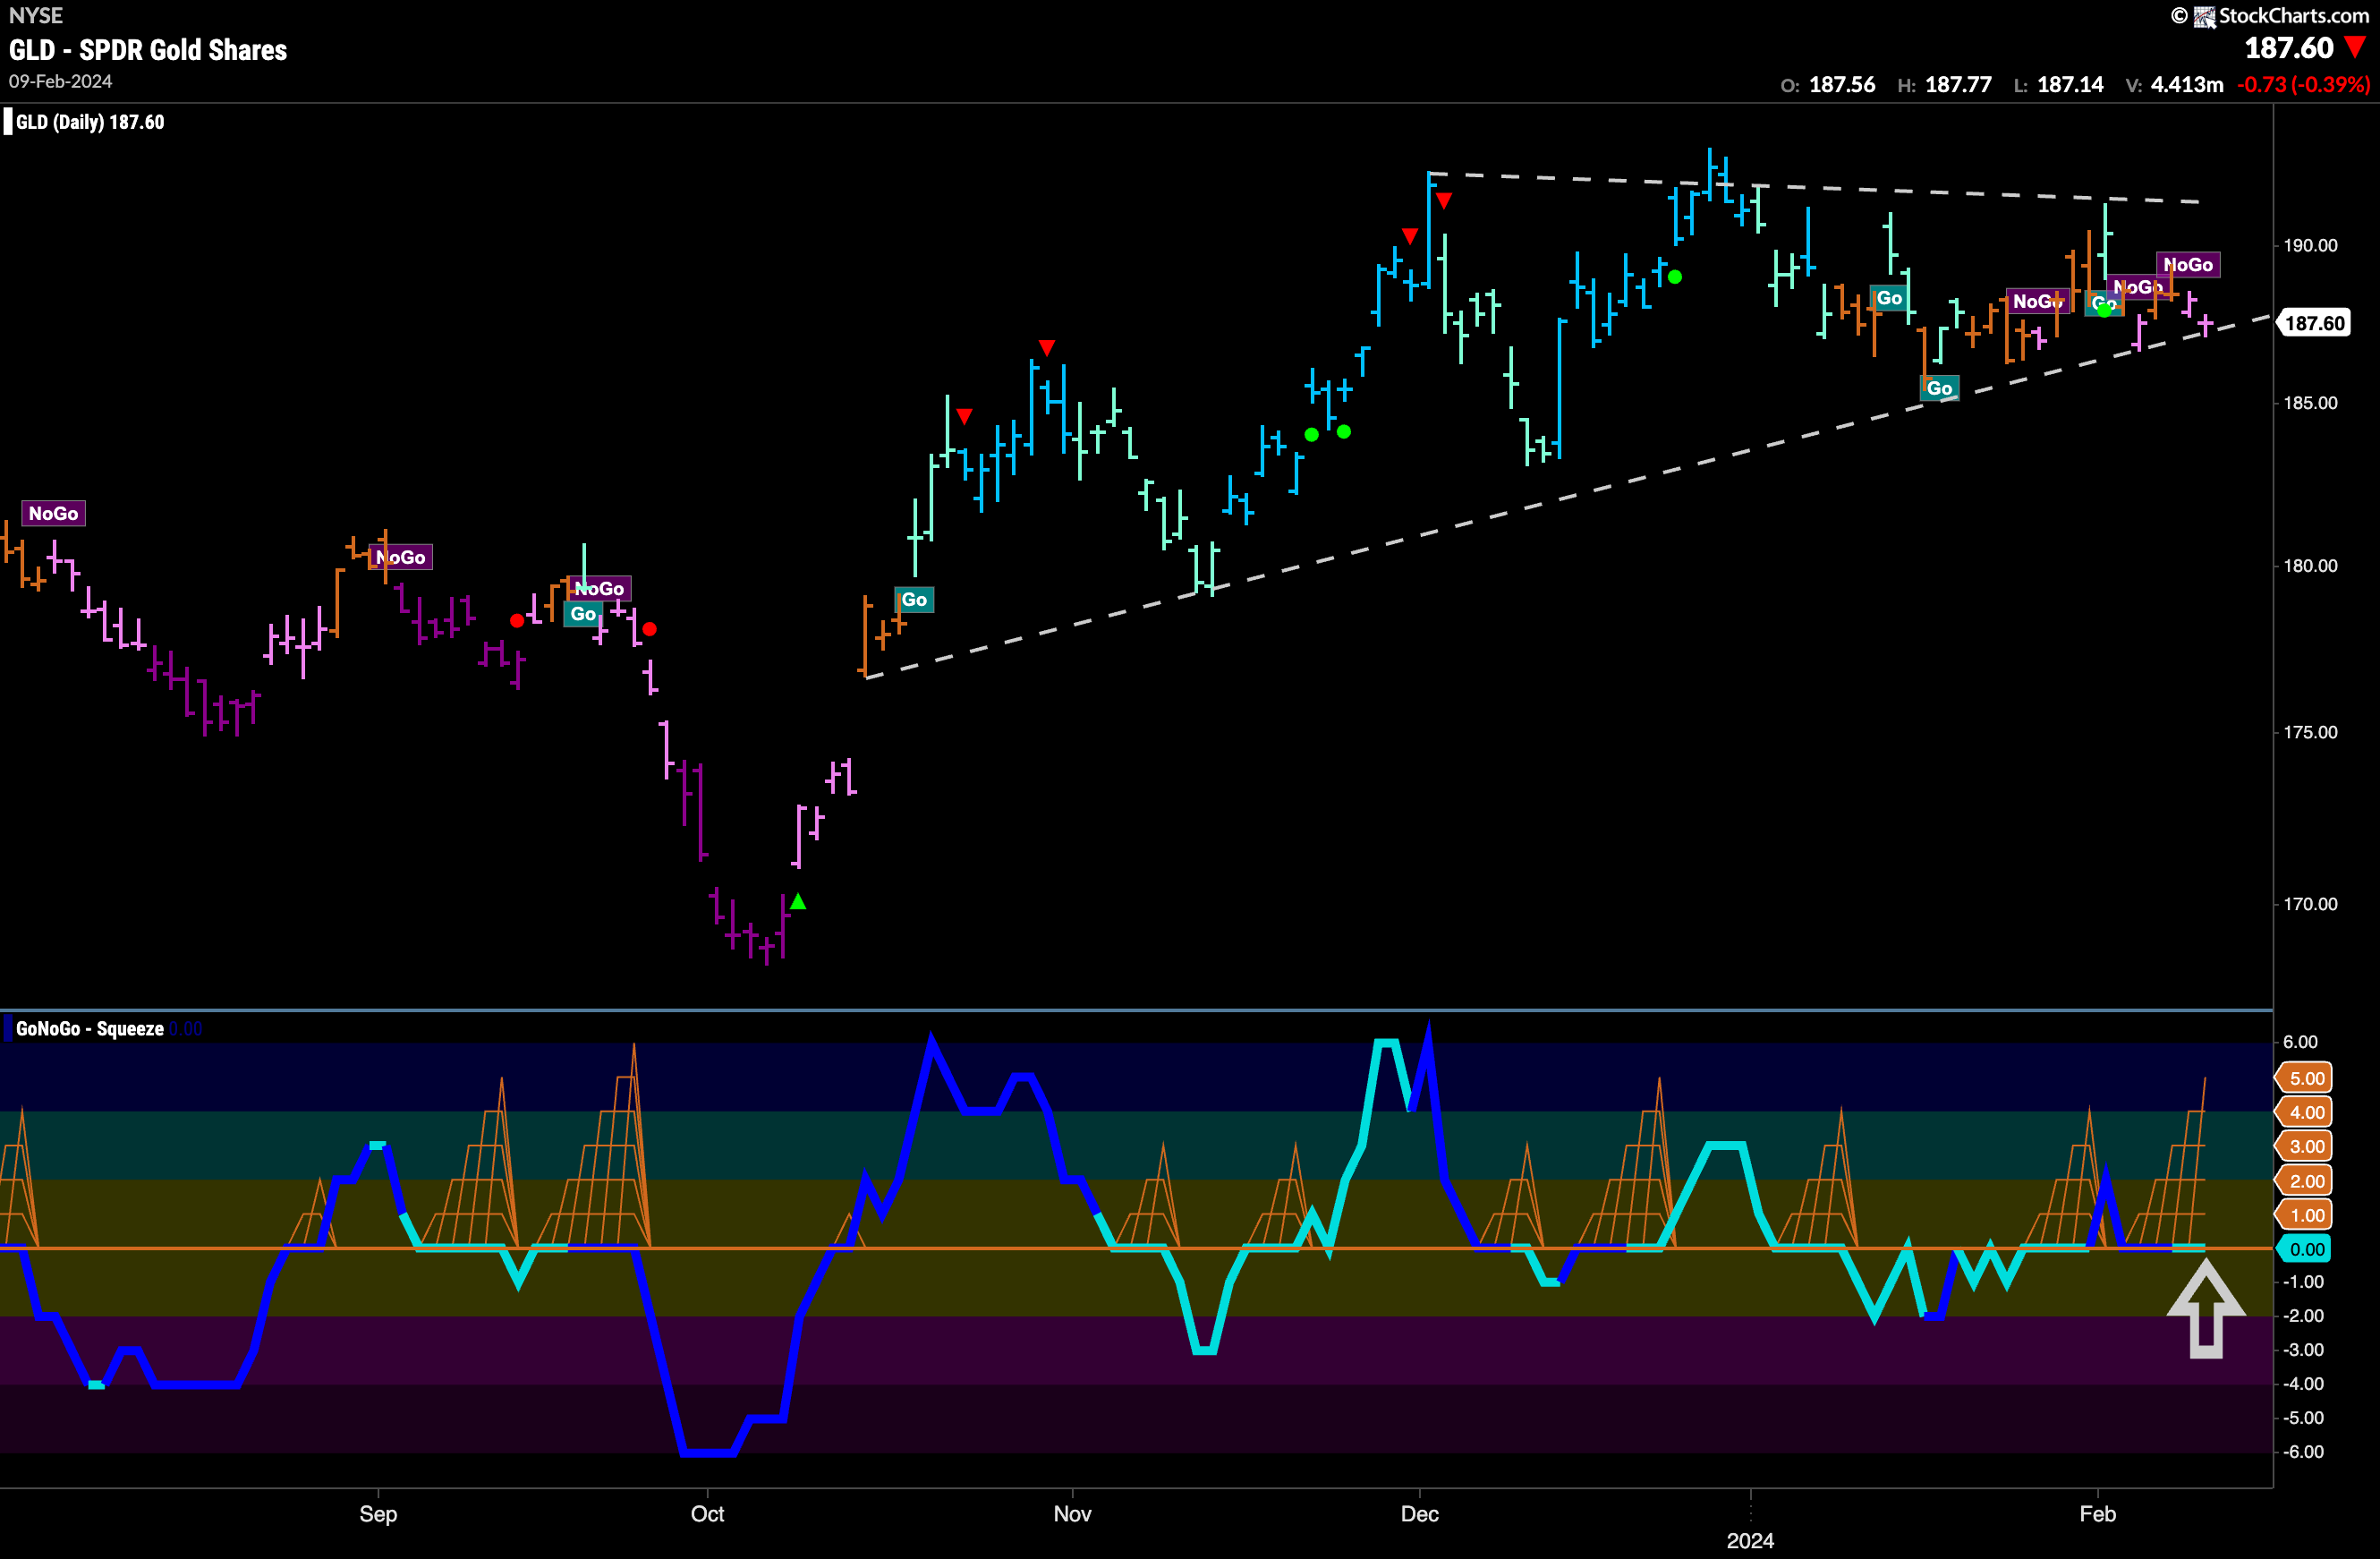
Gold Showing Few Clear Signs of Direction
GoNoGo Trend painted a mix of amber “Go Fish” bars of uncertainty and weak pink “NoGo” bars this week. Knowing the larger context (price trying to break higher out of a multi year consolidation) we can see how hard it is for the precious metal each time it approaches prior highs. GoNoGo Oscillator is testing the zero line from above where we will watch to see if it finds support allowing price to remain at higher lows. A break below zero would likely lead price lower and below the rising trendline support we see on the chart.
Sector RelMap
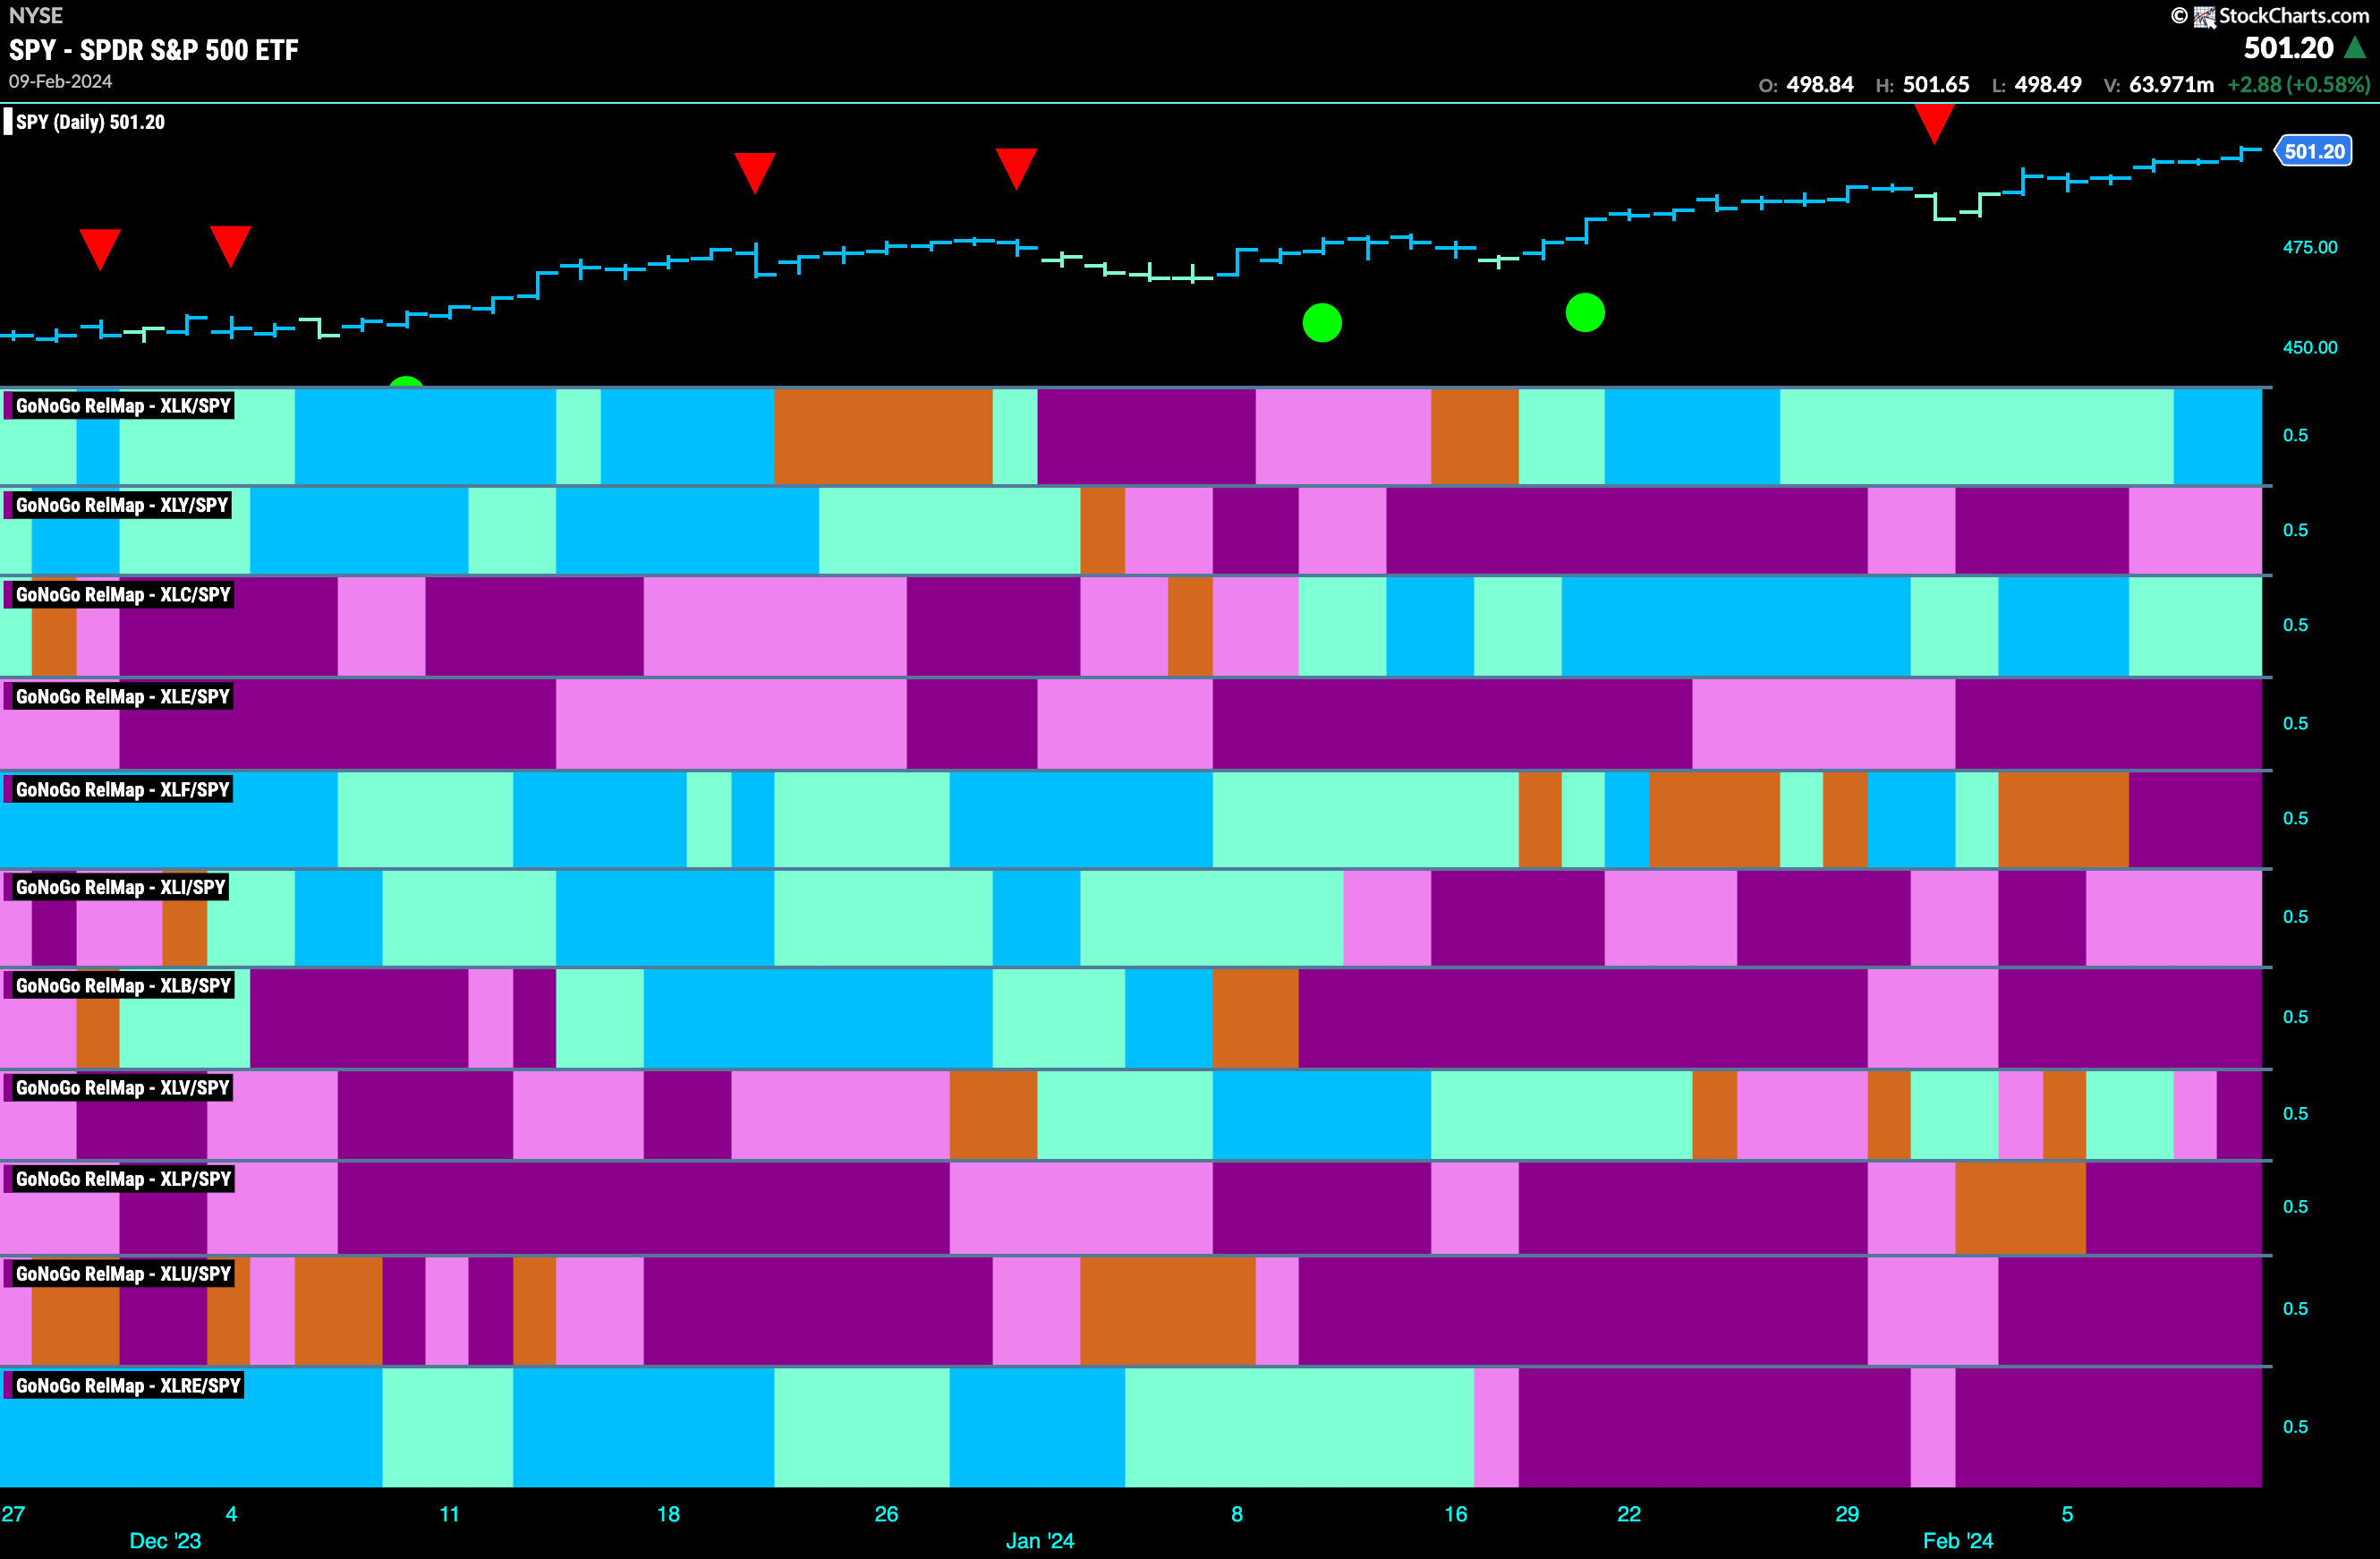
Below is the GoNoGo Sector RelMap. This GoNoGo RelMap applies the GoNoGo Trend to the relative strength ratios of the sectors to the base index. Looking at this map, we can quickly see where the relative outperformance is coming from as well as which sectors are lagging on a relative basis. 2 sectors are outperforming the base index this week. $XLK, and $XLC, are painting relative “Go” bars.
$XLK in Strong “Go” Trend
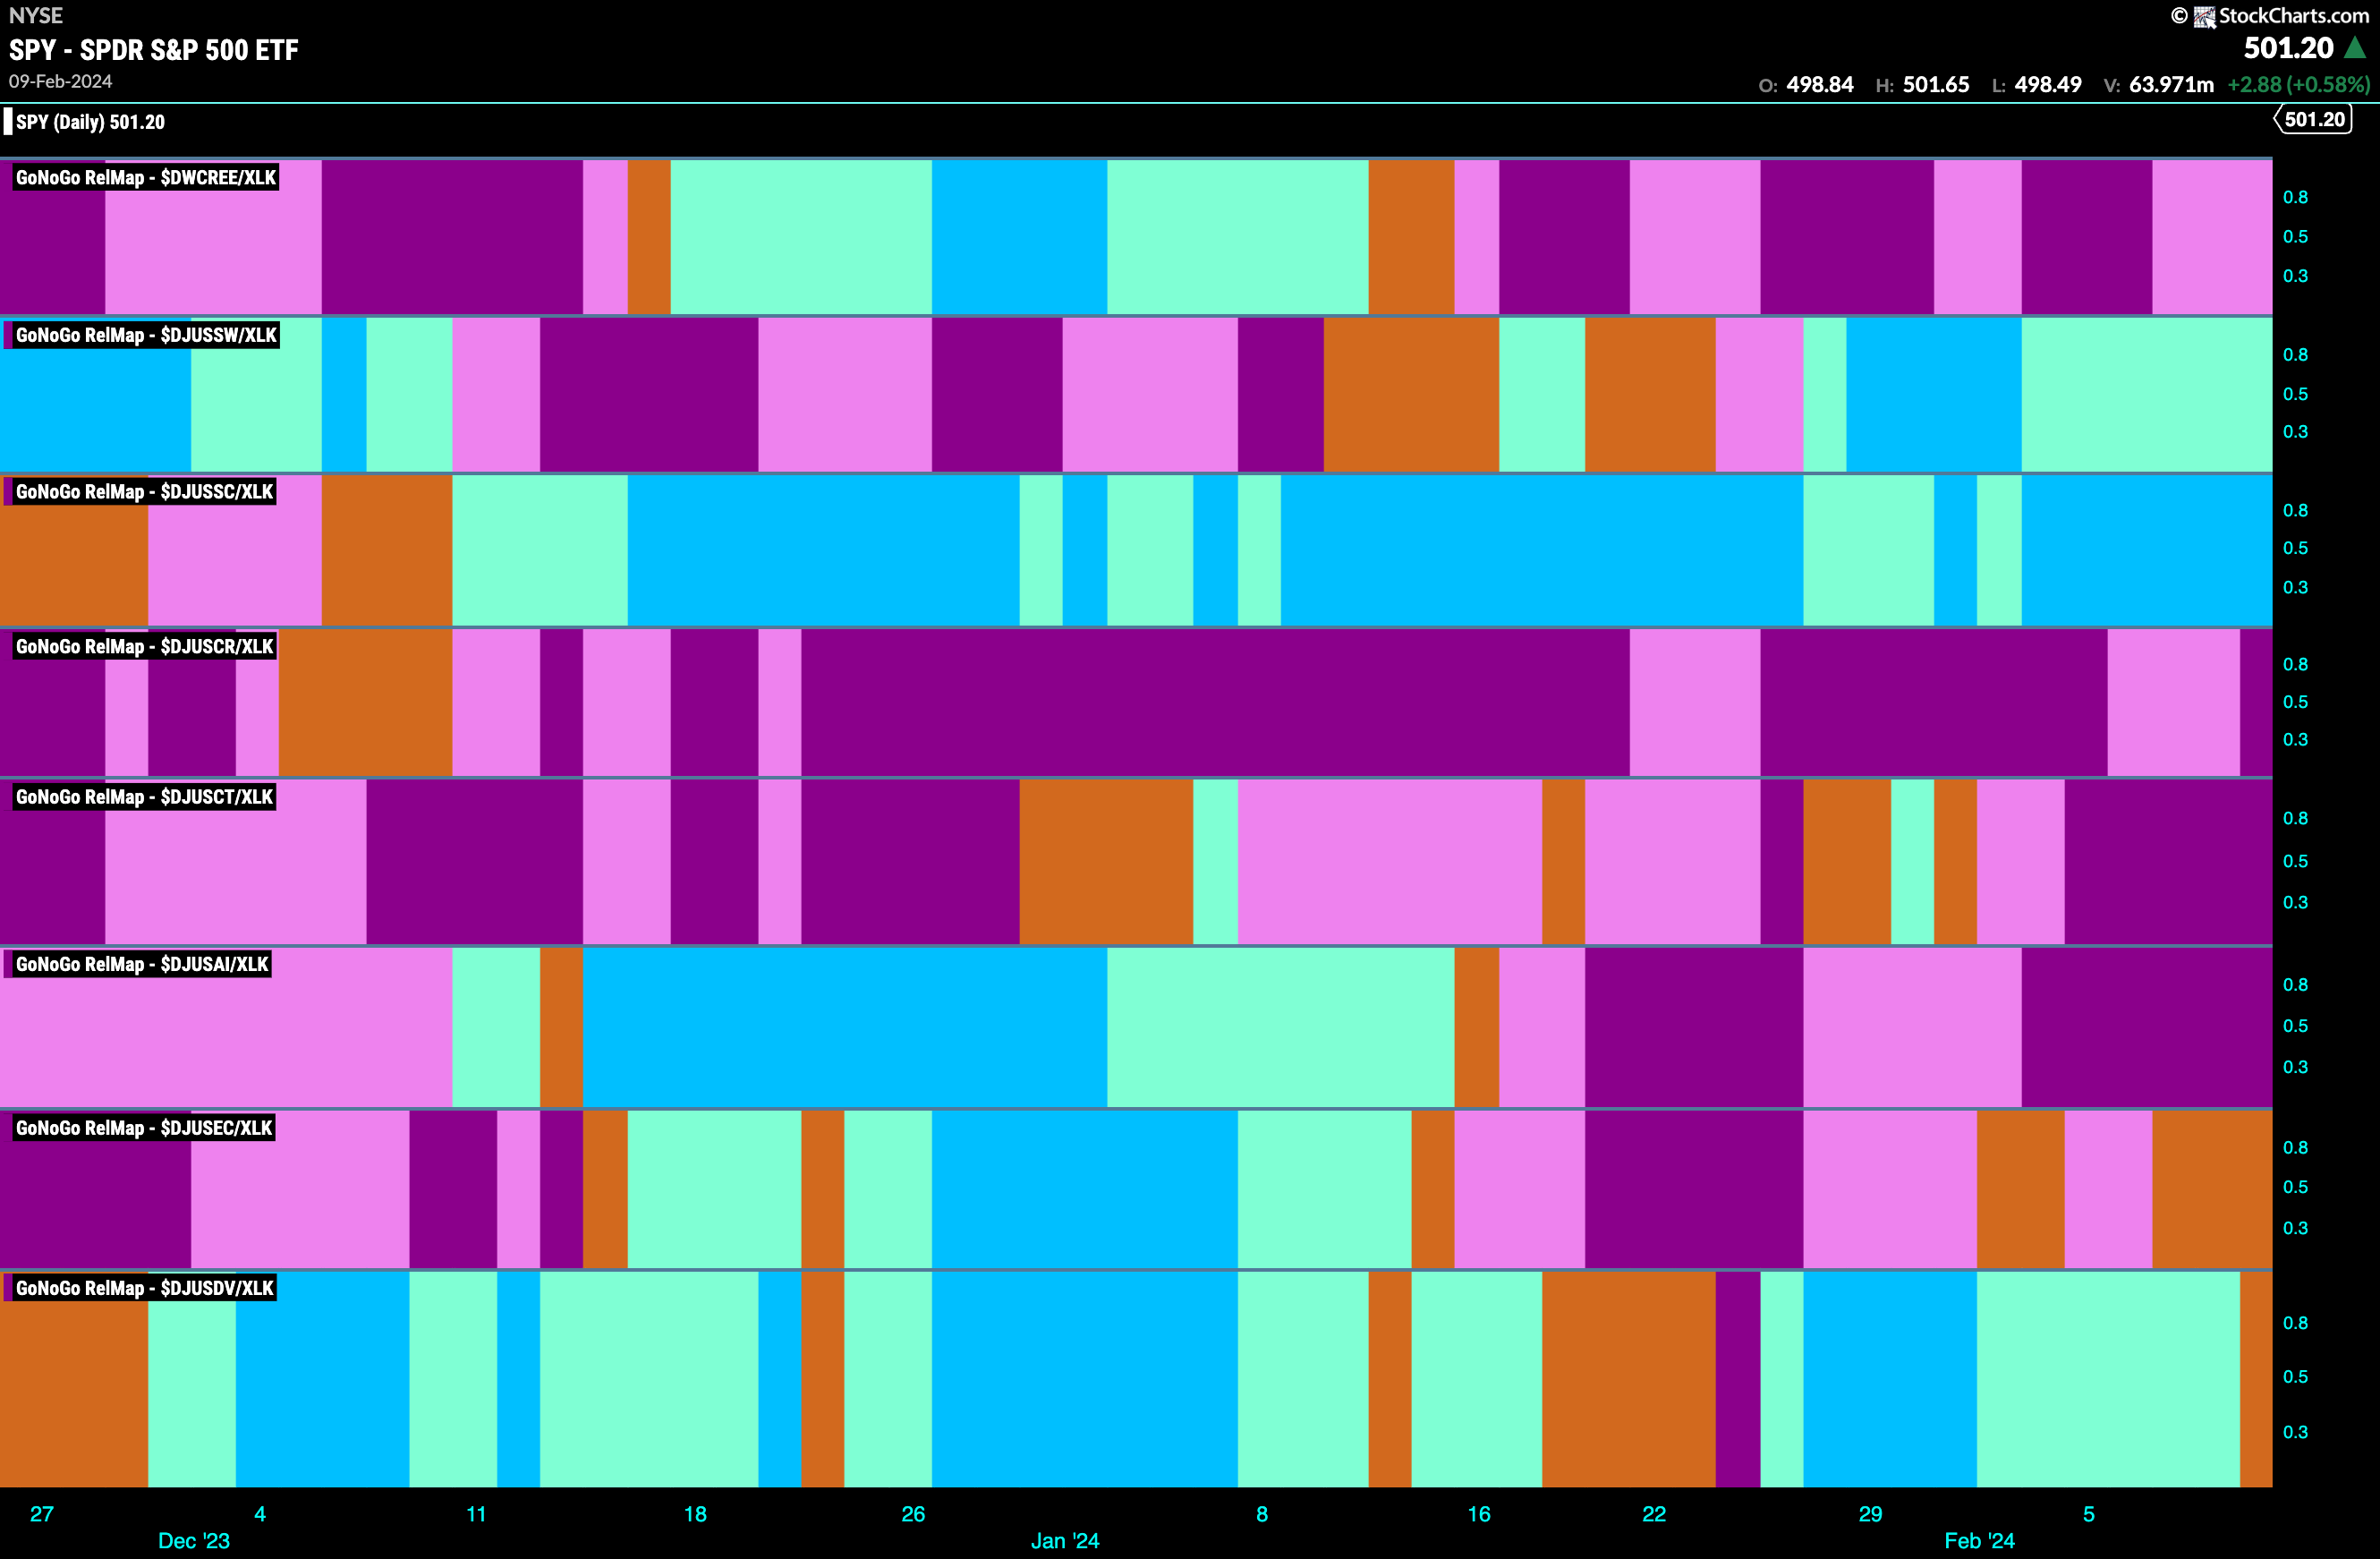
$XLK is in a beautiful “Go” trend and we can see how this sector is contributing most to the rising equity prices and strength of the S&P 500. A series of higher highs and higher lows as the GoNoGo Trend indicator paints aqua and blue bars since the “Go” was identified last year. GoNoGo Oscillator has found support again recently at the zero line and that propelled price higher as trend continuation took prices to a new high.
Technology Sub-Group RelMap
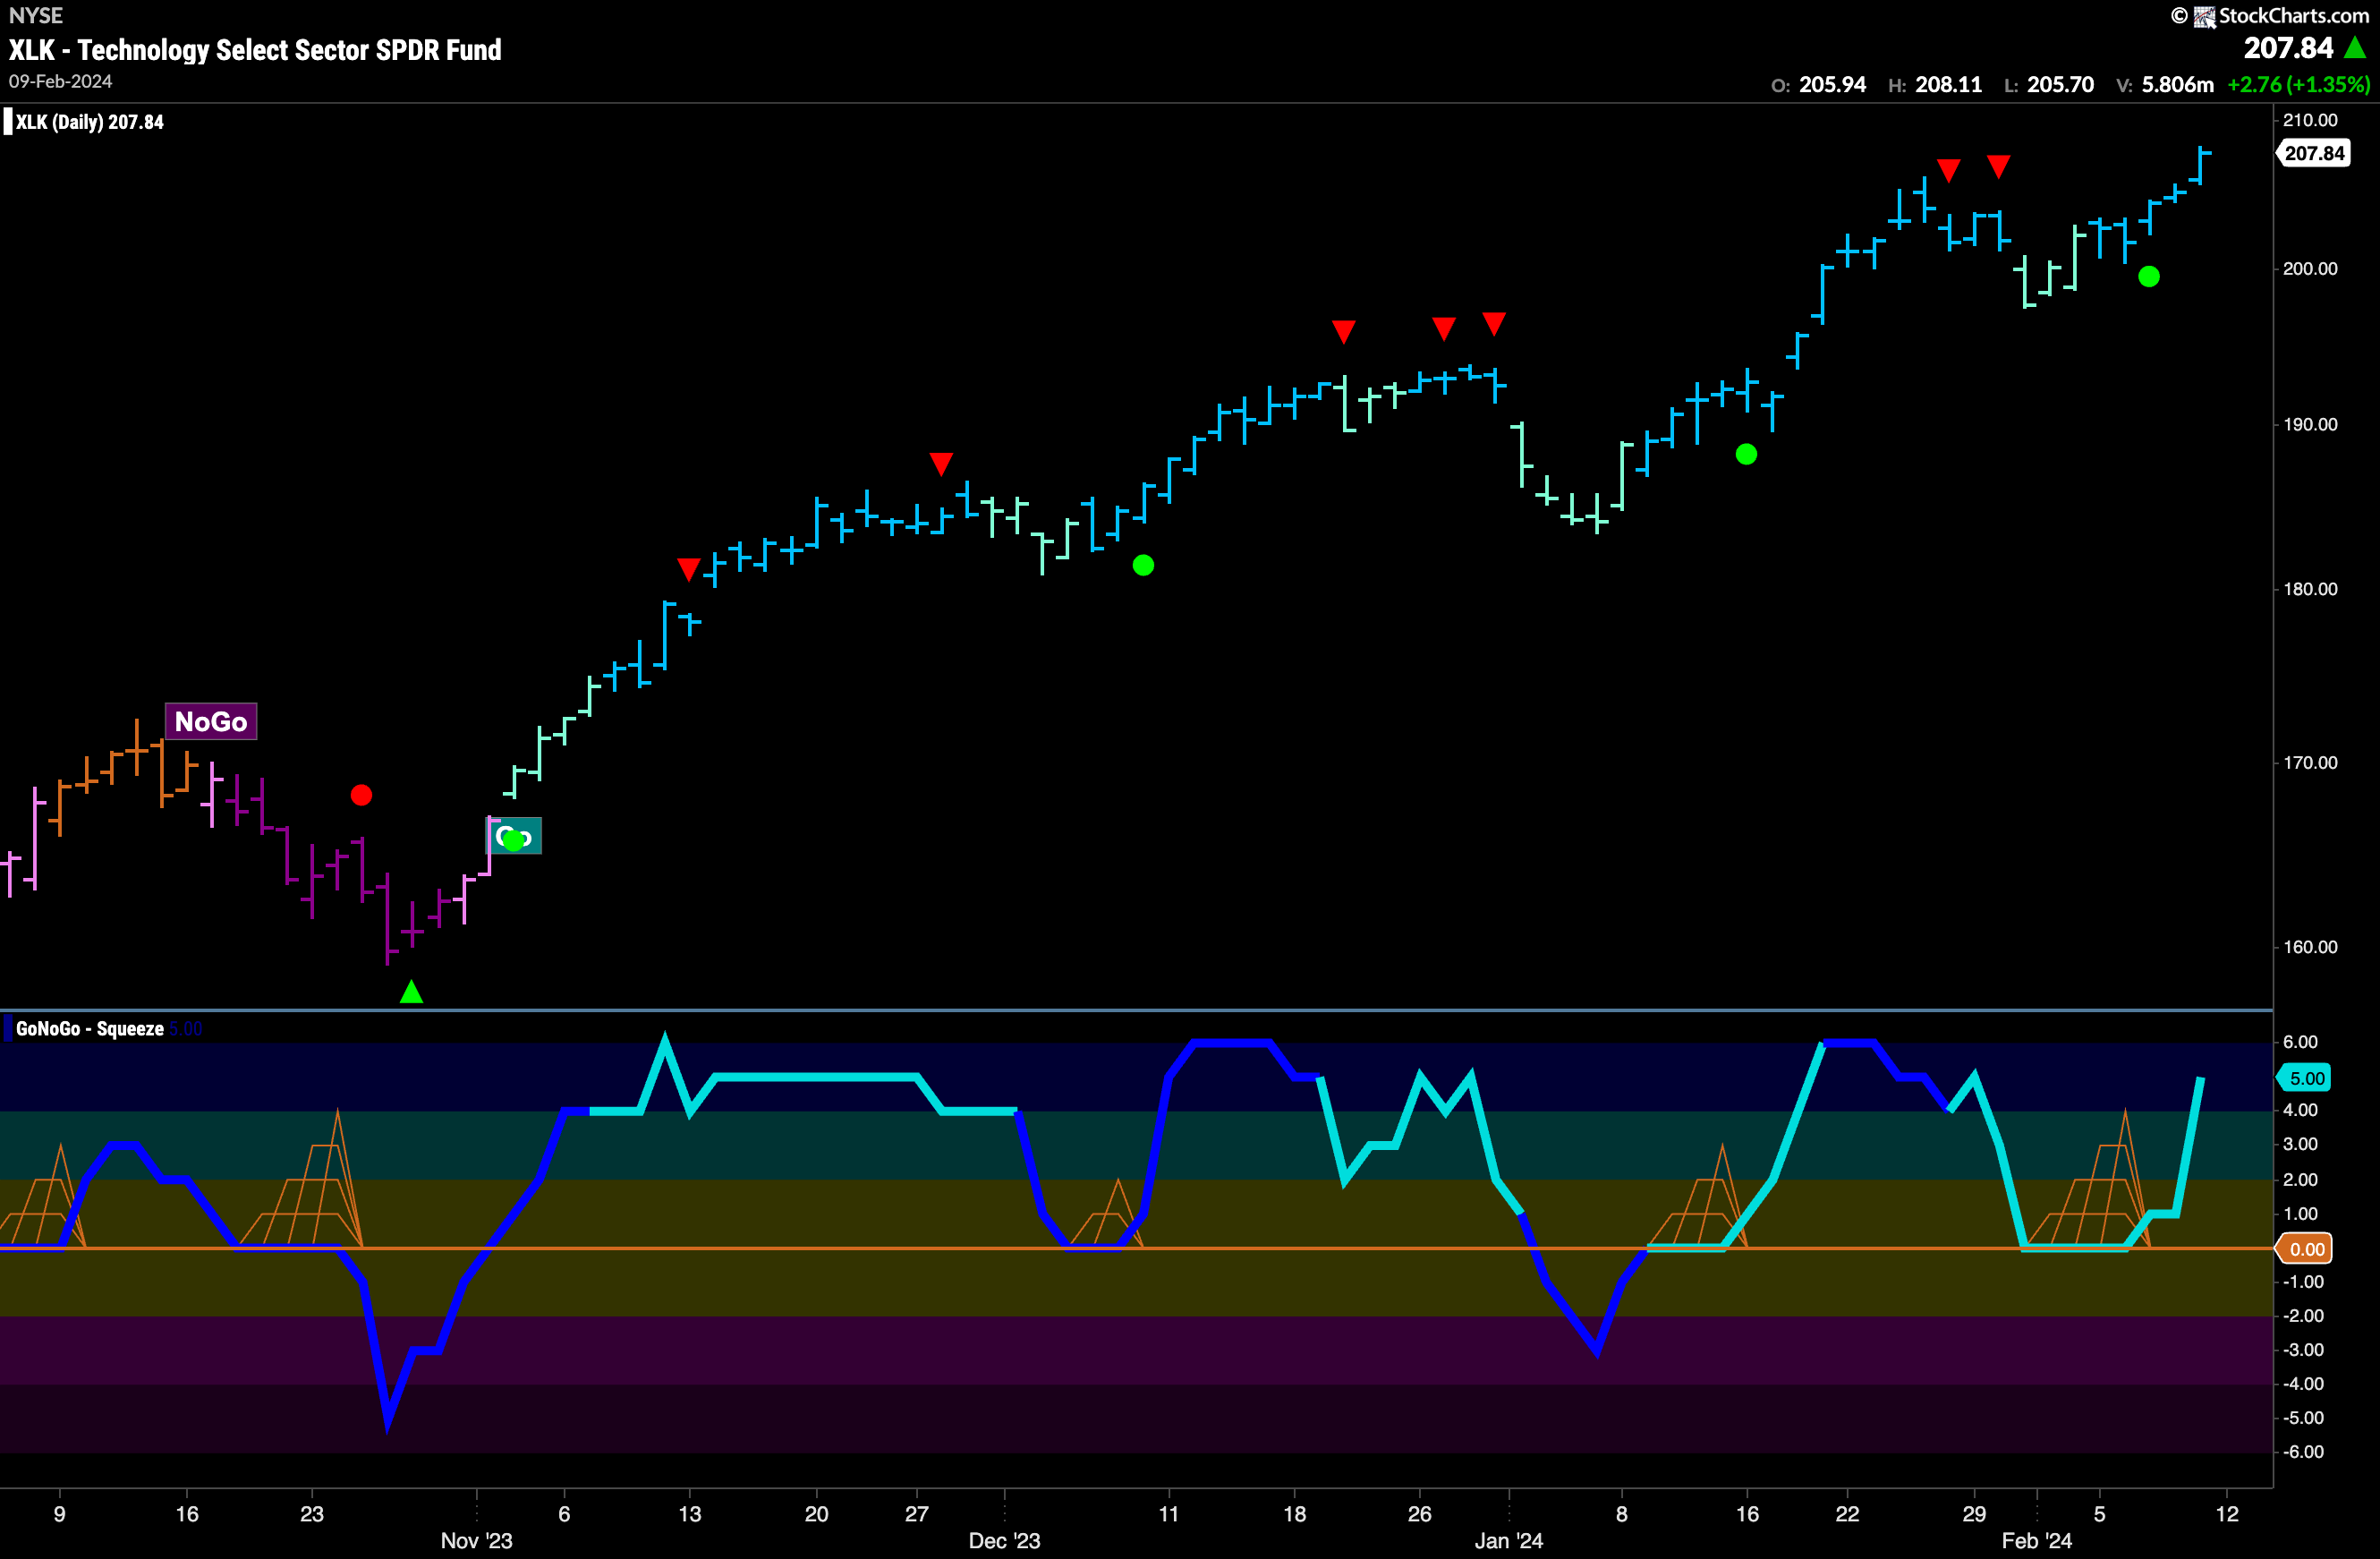
The GoNoGo Sector RelMap above shows that the communications sector continues to outperform on a relative basis for another week. Below, we see the individual groups of the sector relative to the sector itself. We apply the GoNoGo Trend to those ratios to understand where the relative outperformance is coming from within a sector. Last week we noted that the software index was in a relative “Go” trend, having joined semi-conductors as the drivers of the sector outperformance. This week, we see that these two sub groups remain in “Go” trends, with semi-conductors painting strong blue “Go” bars for the entire week.
$SKYT Breaking Out to New Highs
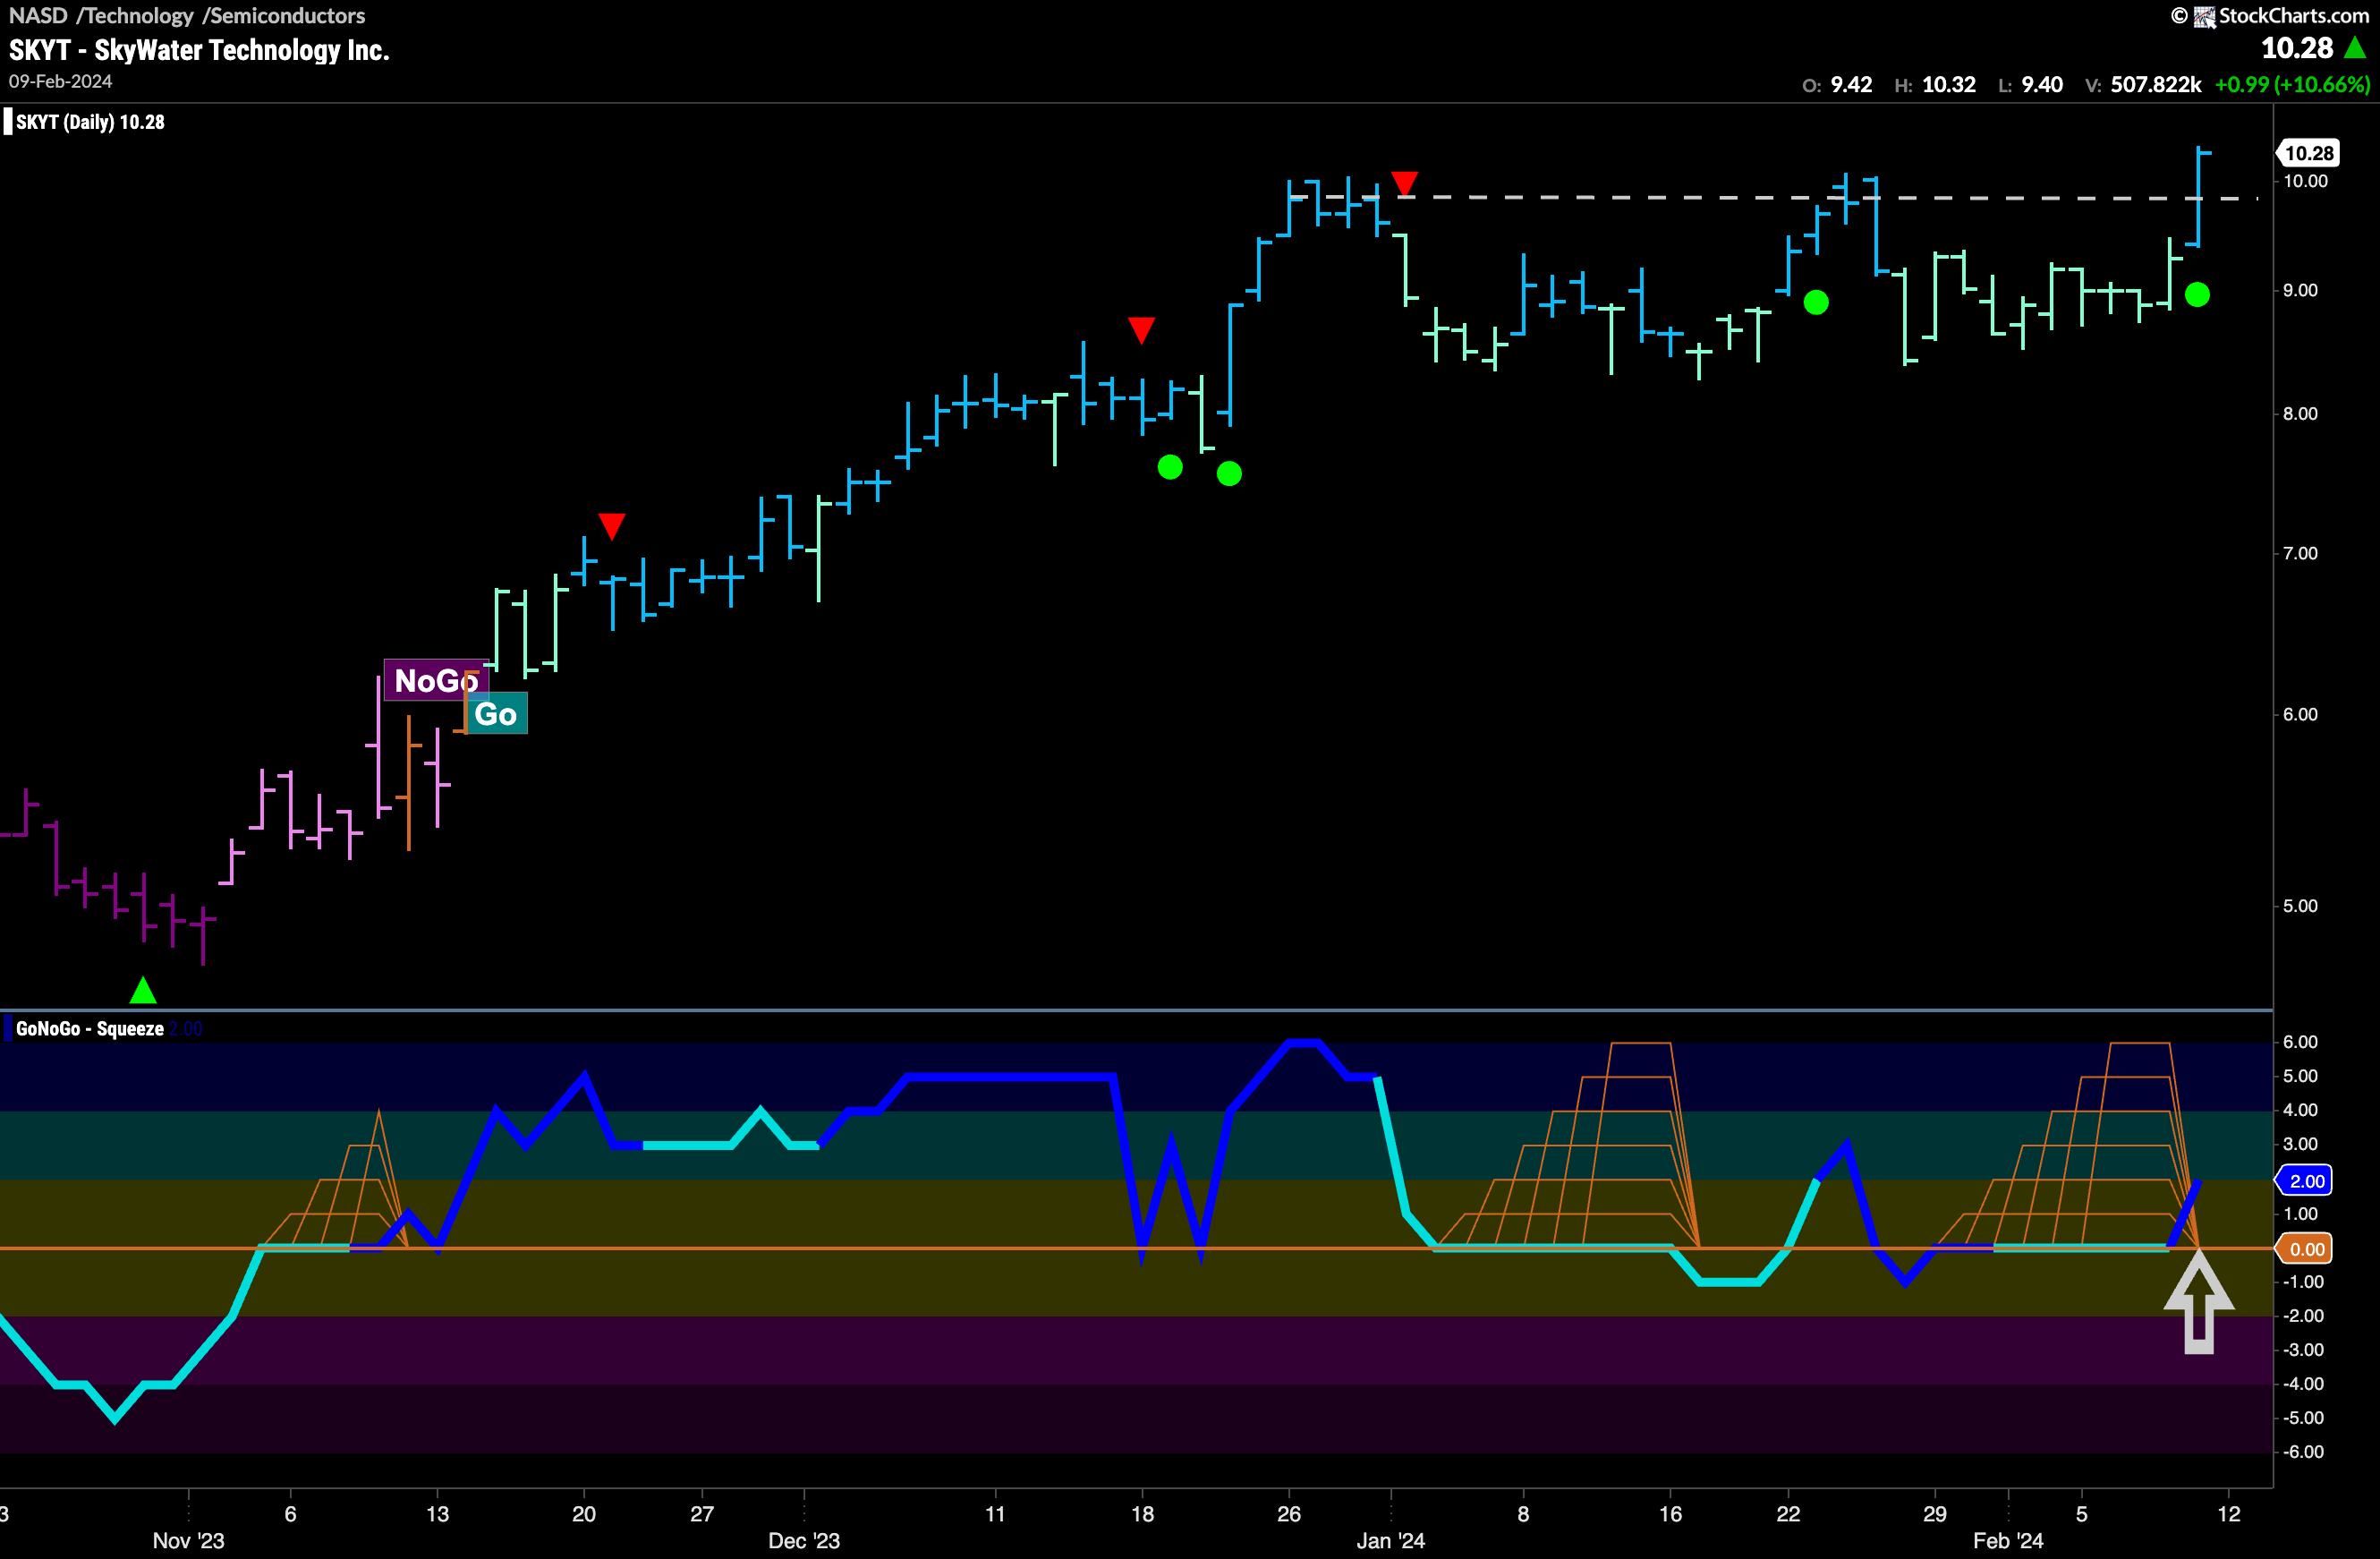
$SKYT is the first of the semiconductor companies we’ll look at here today. In a “Go” trend, we can see that price is breaking out above resistance from prior highs. Having moved mostly sideways since the Go Countertrend Correction Icon (red arrow) we saw the GoNoGo Oscillator finding support for almost all of this time. Now, after a Max GoNoGo Squeeze we see the oscillator breaking the squeeze into positive territory and on heavy volume. This surging momentum in the direction of the underlying “Go” trend is helping price move higher.
$ONTO Better things?
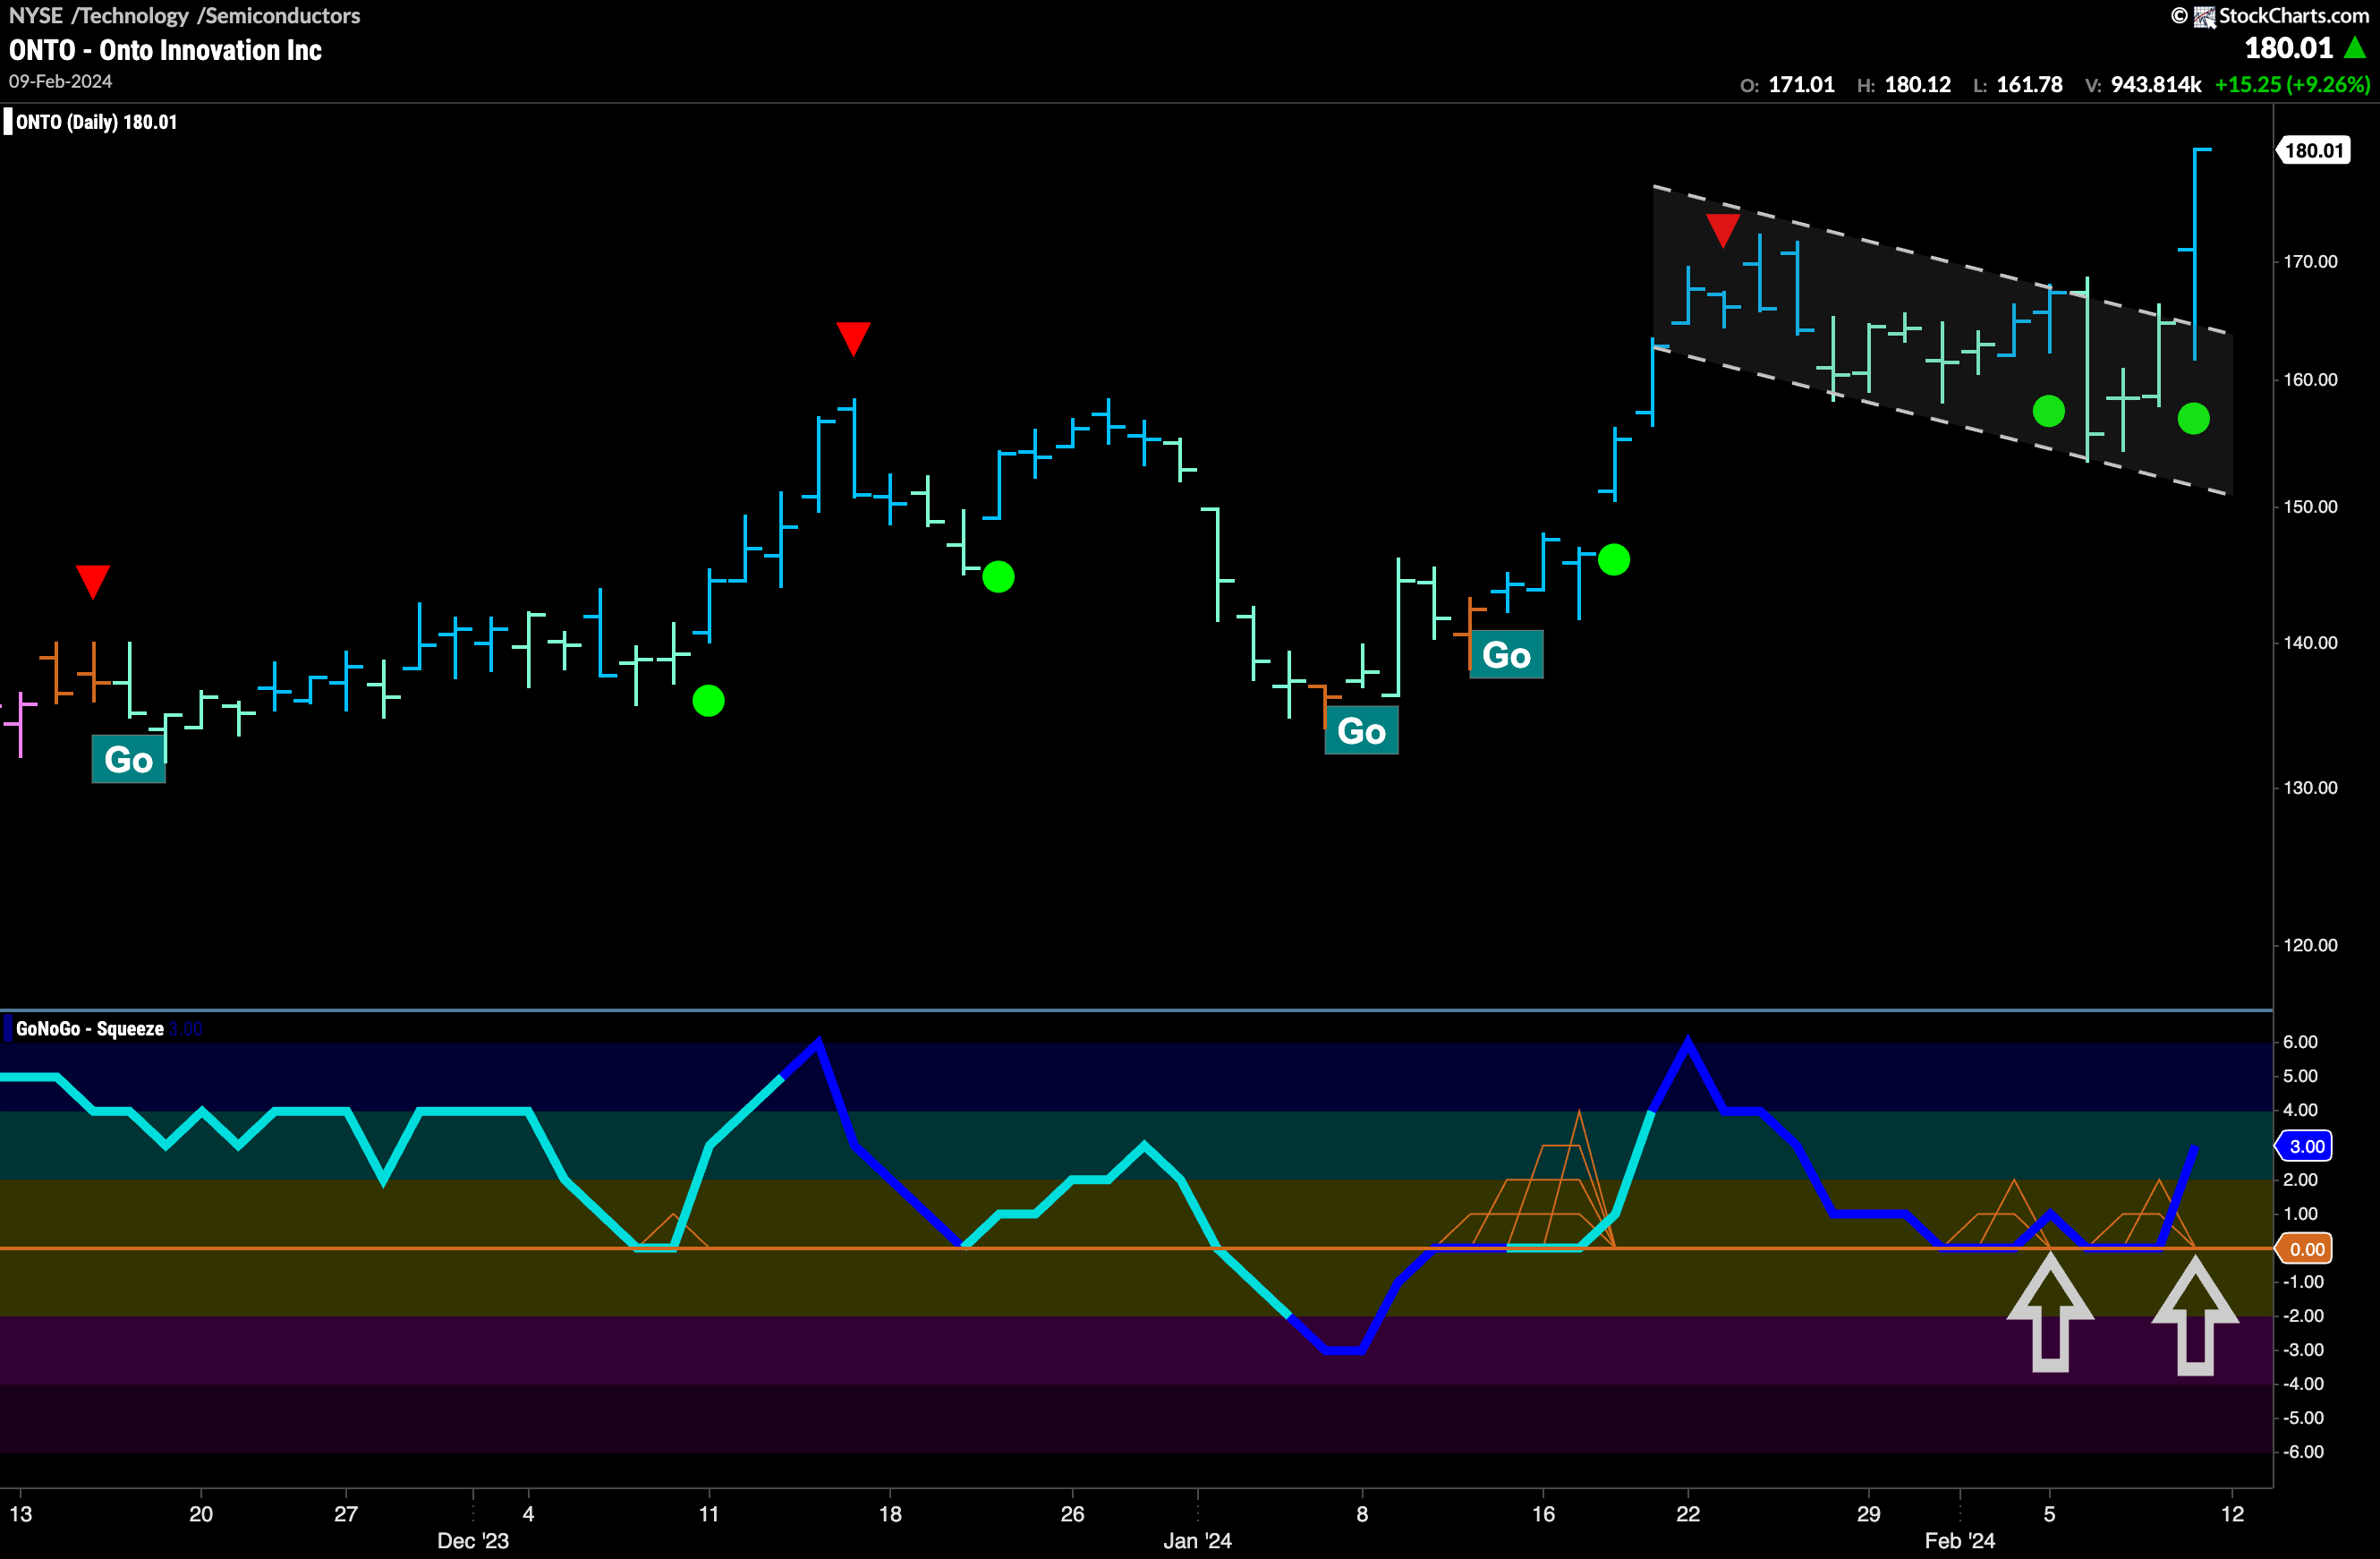
$ONTO is setting up nicely as we can see in the chart below. As price corrected against the “Go” trend (following the Go Countertrend Correction Icon), GoNoGo Oscillator fell to test the zero line from above. With heavy volume, we saw the oscillator find the support it was looking for and two Go Trend Continuation Icons told us the trend was likely to continue. This surging momentum gave price the help it needed to break out of what looks like a bull flag and set a new high. We will look for further price gains from here.
$PLAB Looking to Conquer Resistance
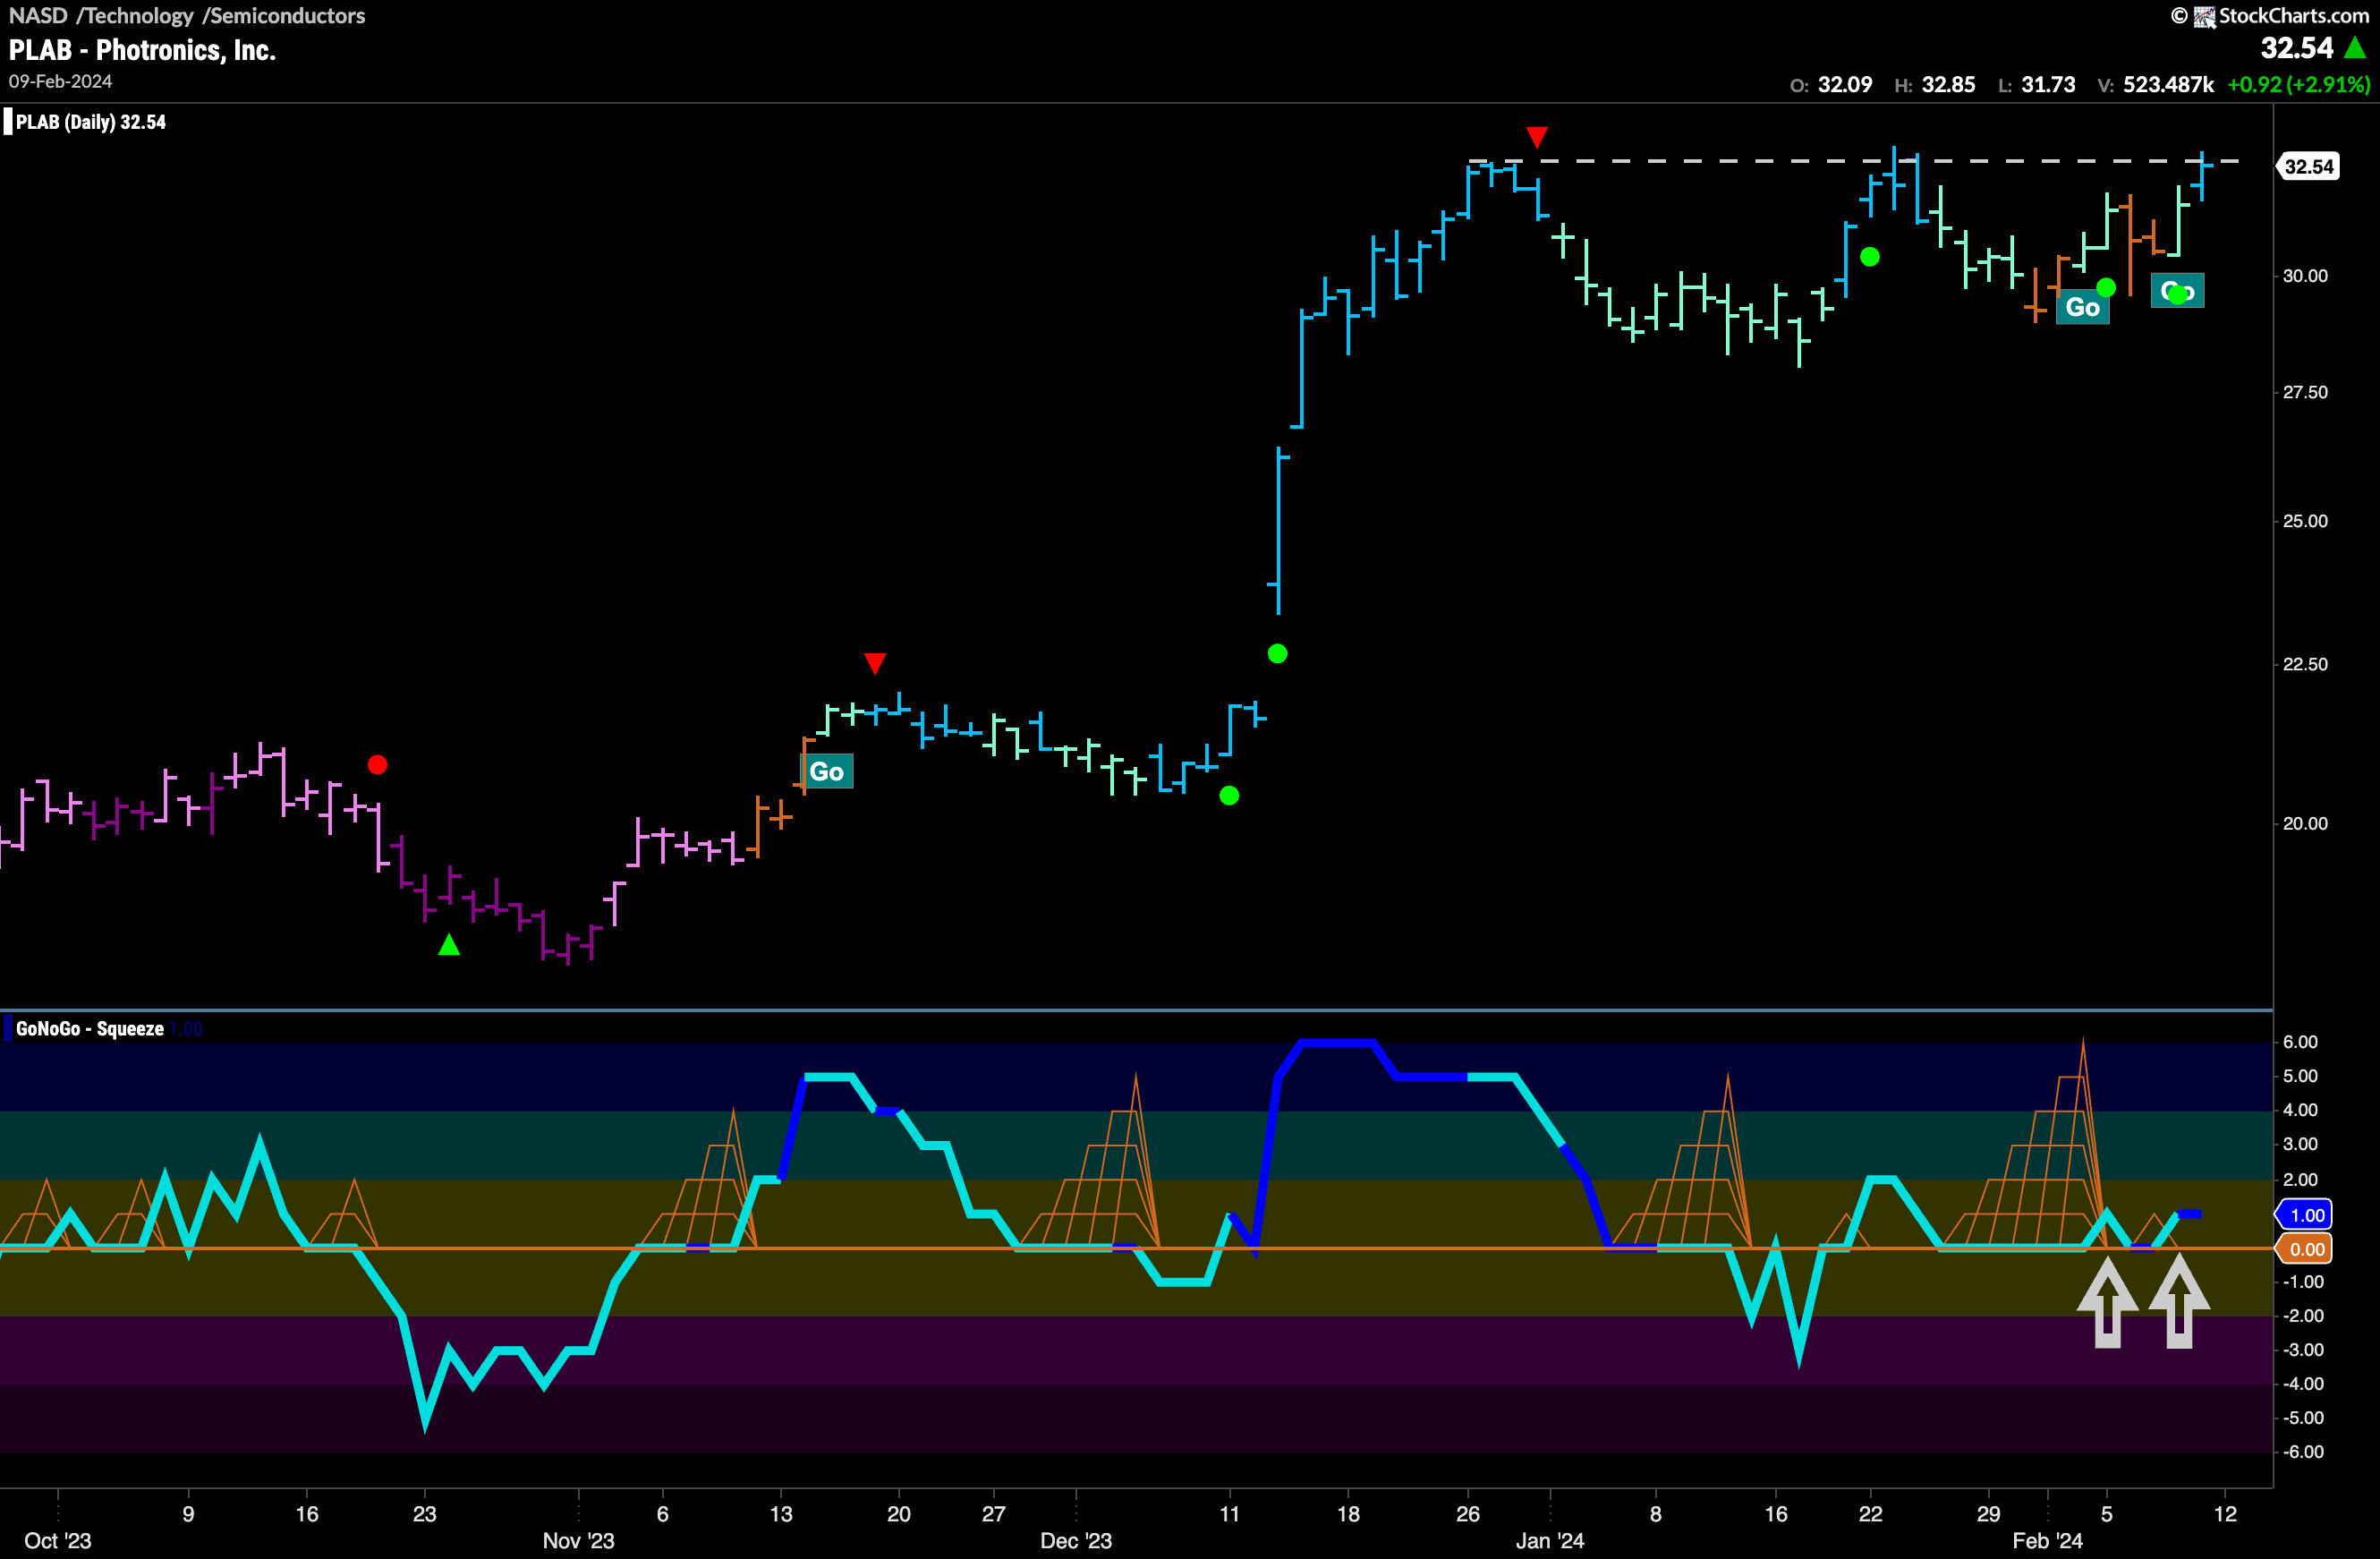
$PLAB could be setting up for new highs. We can see that after a strong run in December price hit a high and we saw a Go Countertrend Correction Icon (red arrow) telling us that price may struggle to go higher in the short term. Indeed, since then, price has moved mostly sideways and GoNoGo Trend has painted mostly weaker aqua bars and even a few “Go Fish” bars of uncertainty. We see now that the oscillator is finding support at the zero line and that has helped price to regain its “Go” colors. As momentum is moving back into positive territory, we will watch to see if that is enough for price to break out above horizontal resistance and set a new higher high.
