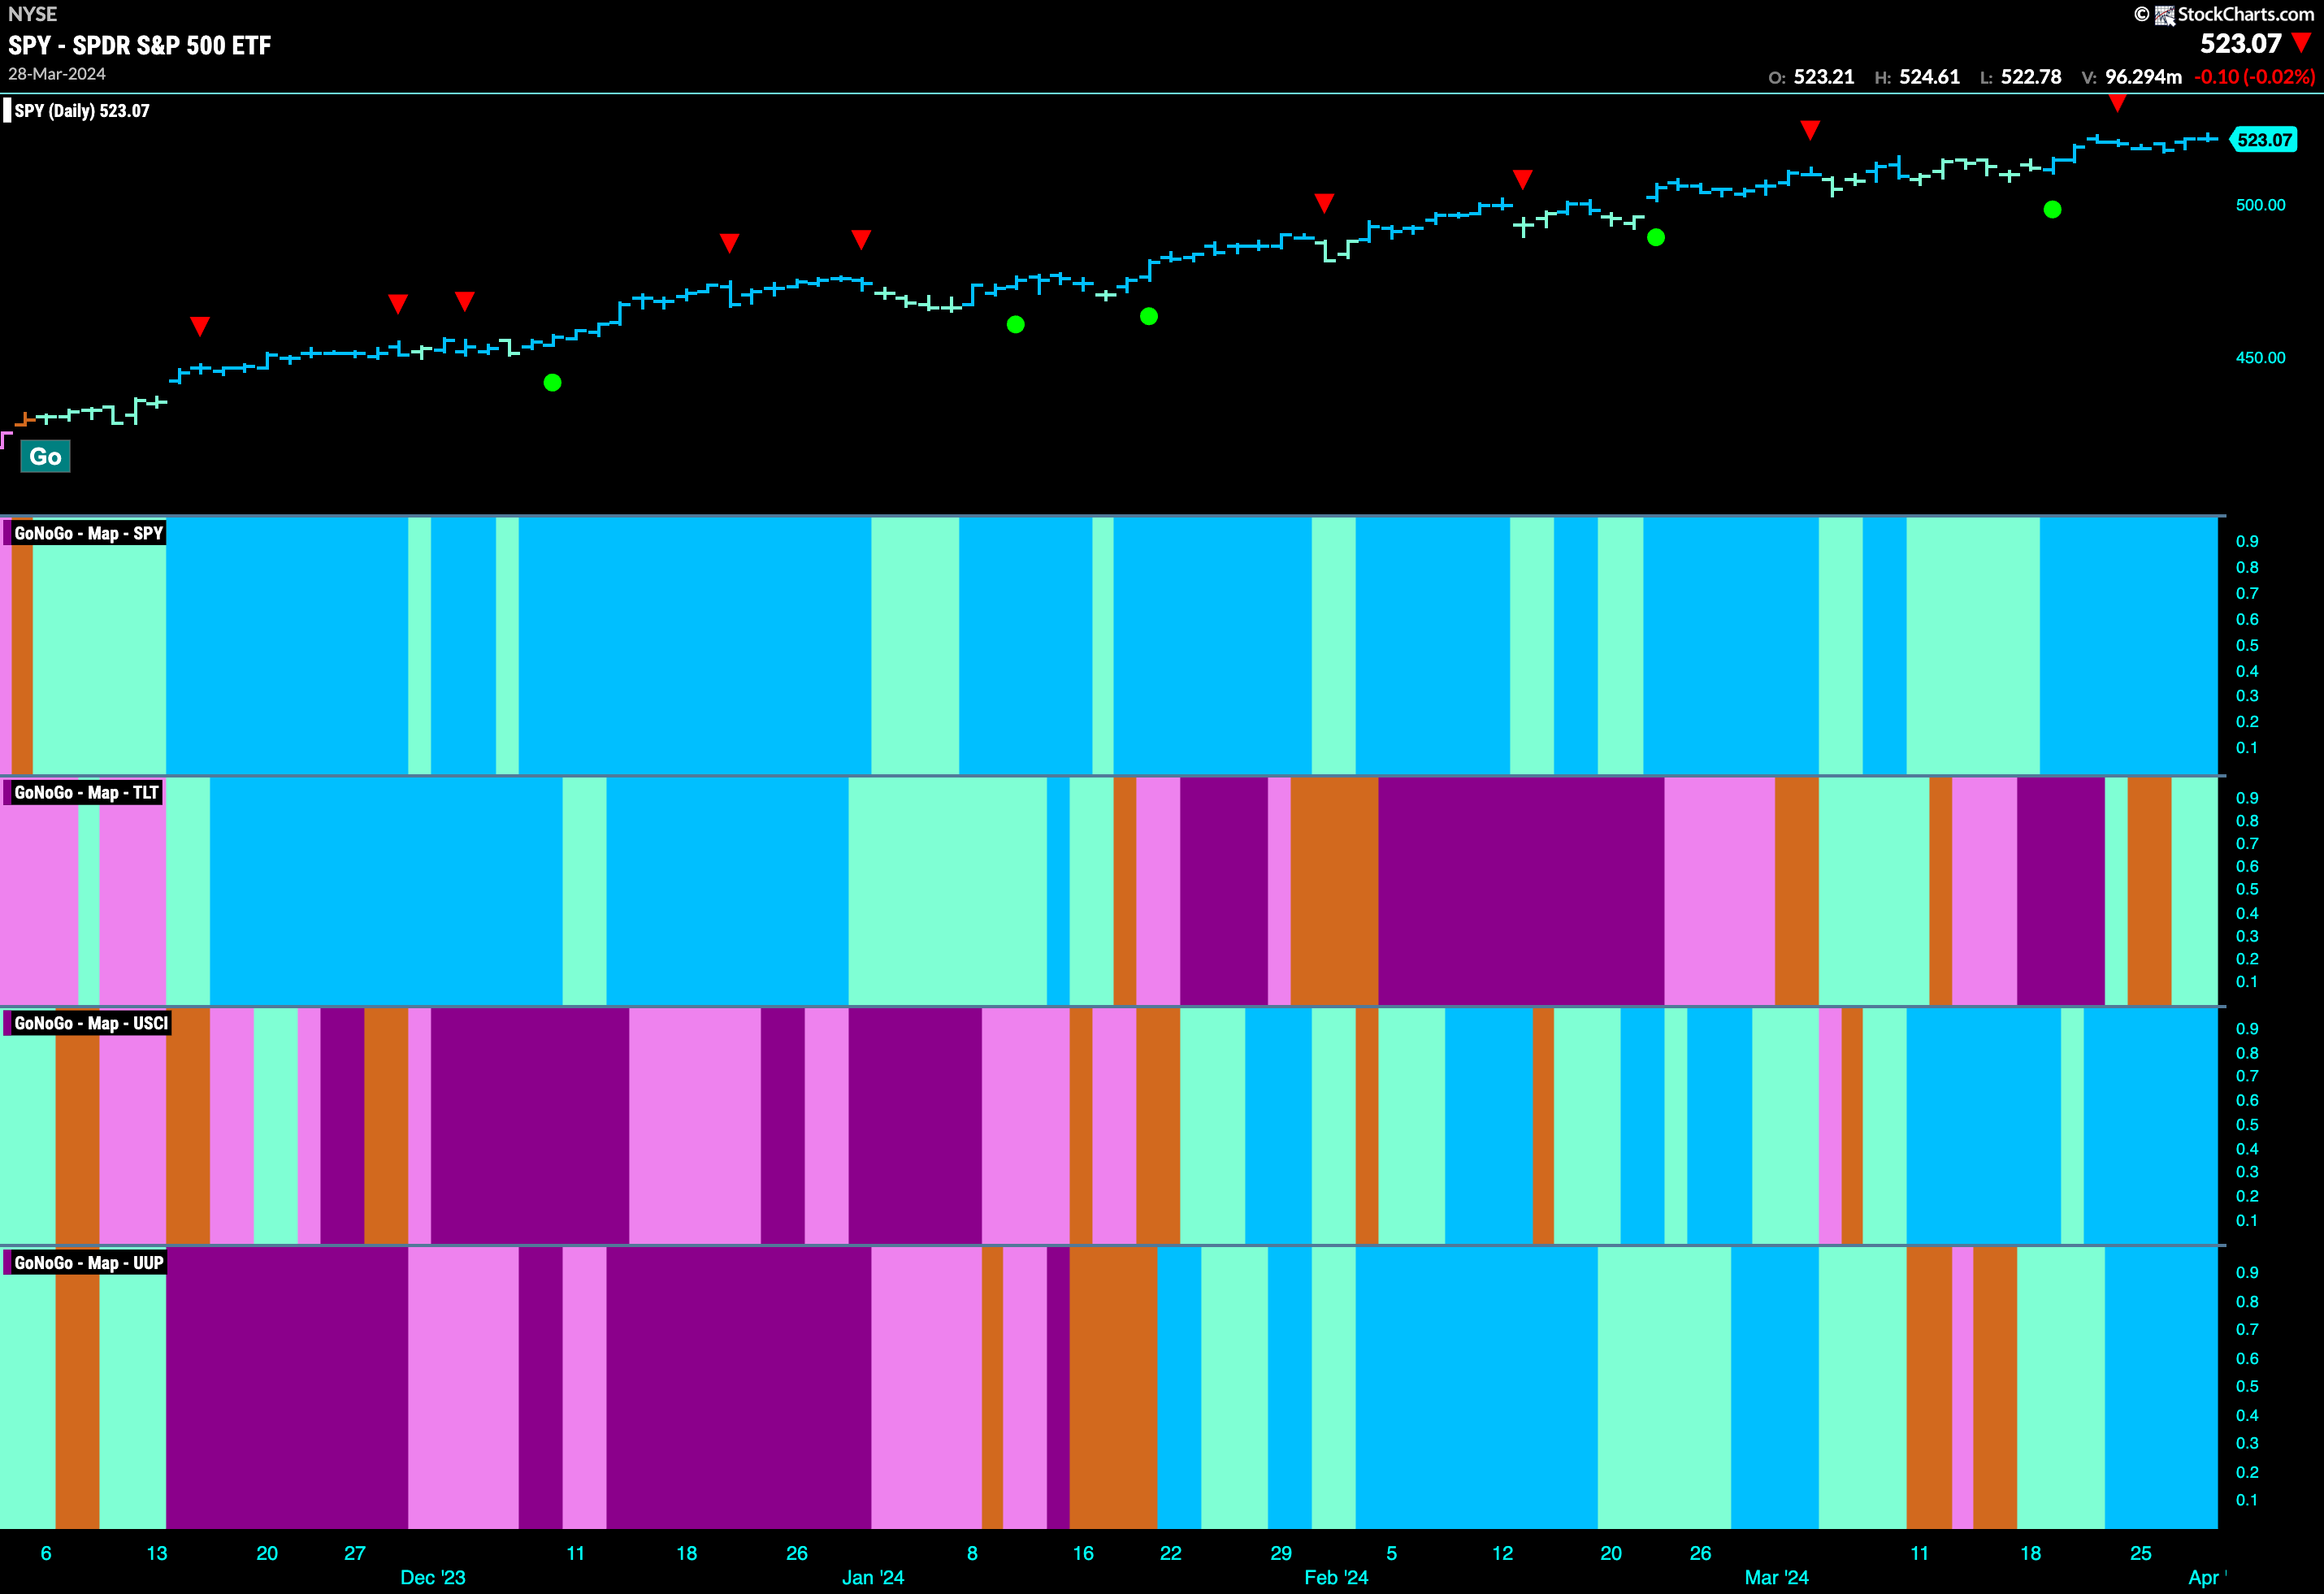
Good morning and welcome to this week’s Flight Path. The equity “Go” trend was strong again this week as we saw a week of uninterrupted bright blue “Go” bars as price continued to edge higher. Treasury bond prices returned to the new “Go” trend after a couple of amber “Go Fish” bars. The U.S. commodity index flashed strength as well with strong blue bars and the U.S. dollar likewise painted strong blue “Go” bars. We see all four major asset classes in a ‘Go” trend at the same time for the second week in a row. It has been a fast start to the year and we will watch to see if this can continue in quarter 2.
Equities Touch New Higher High
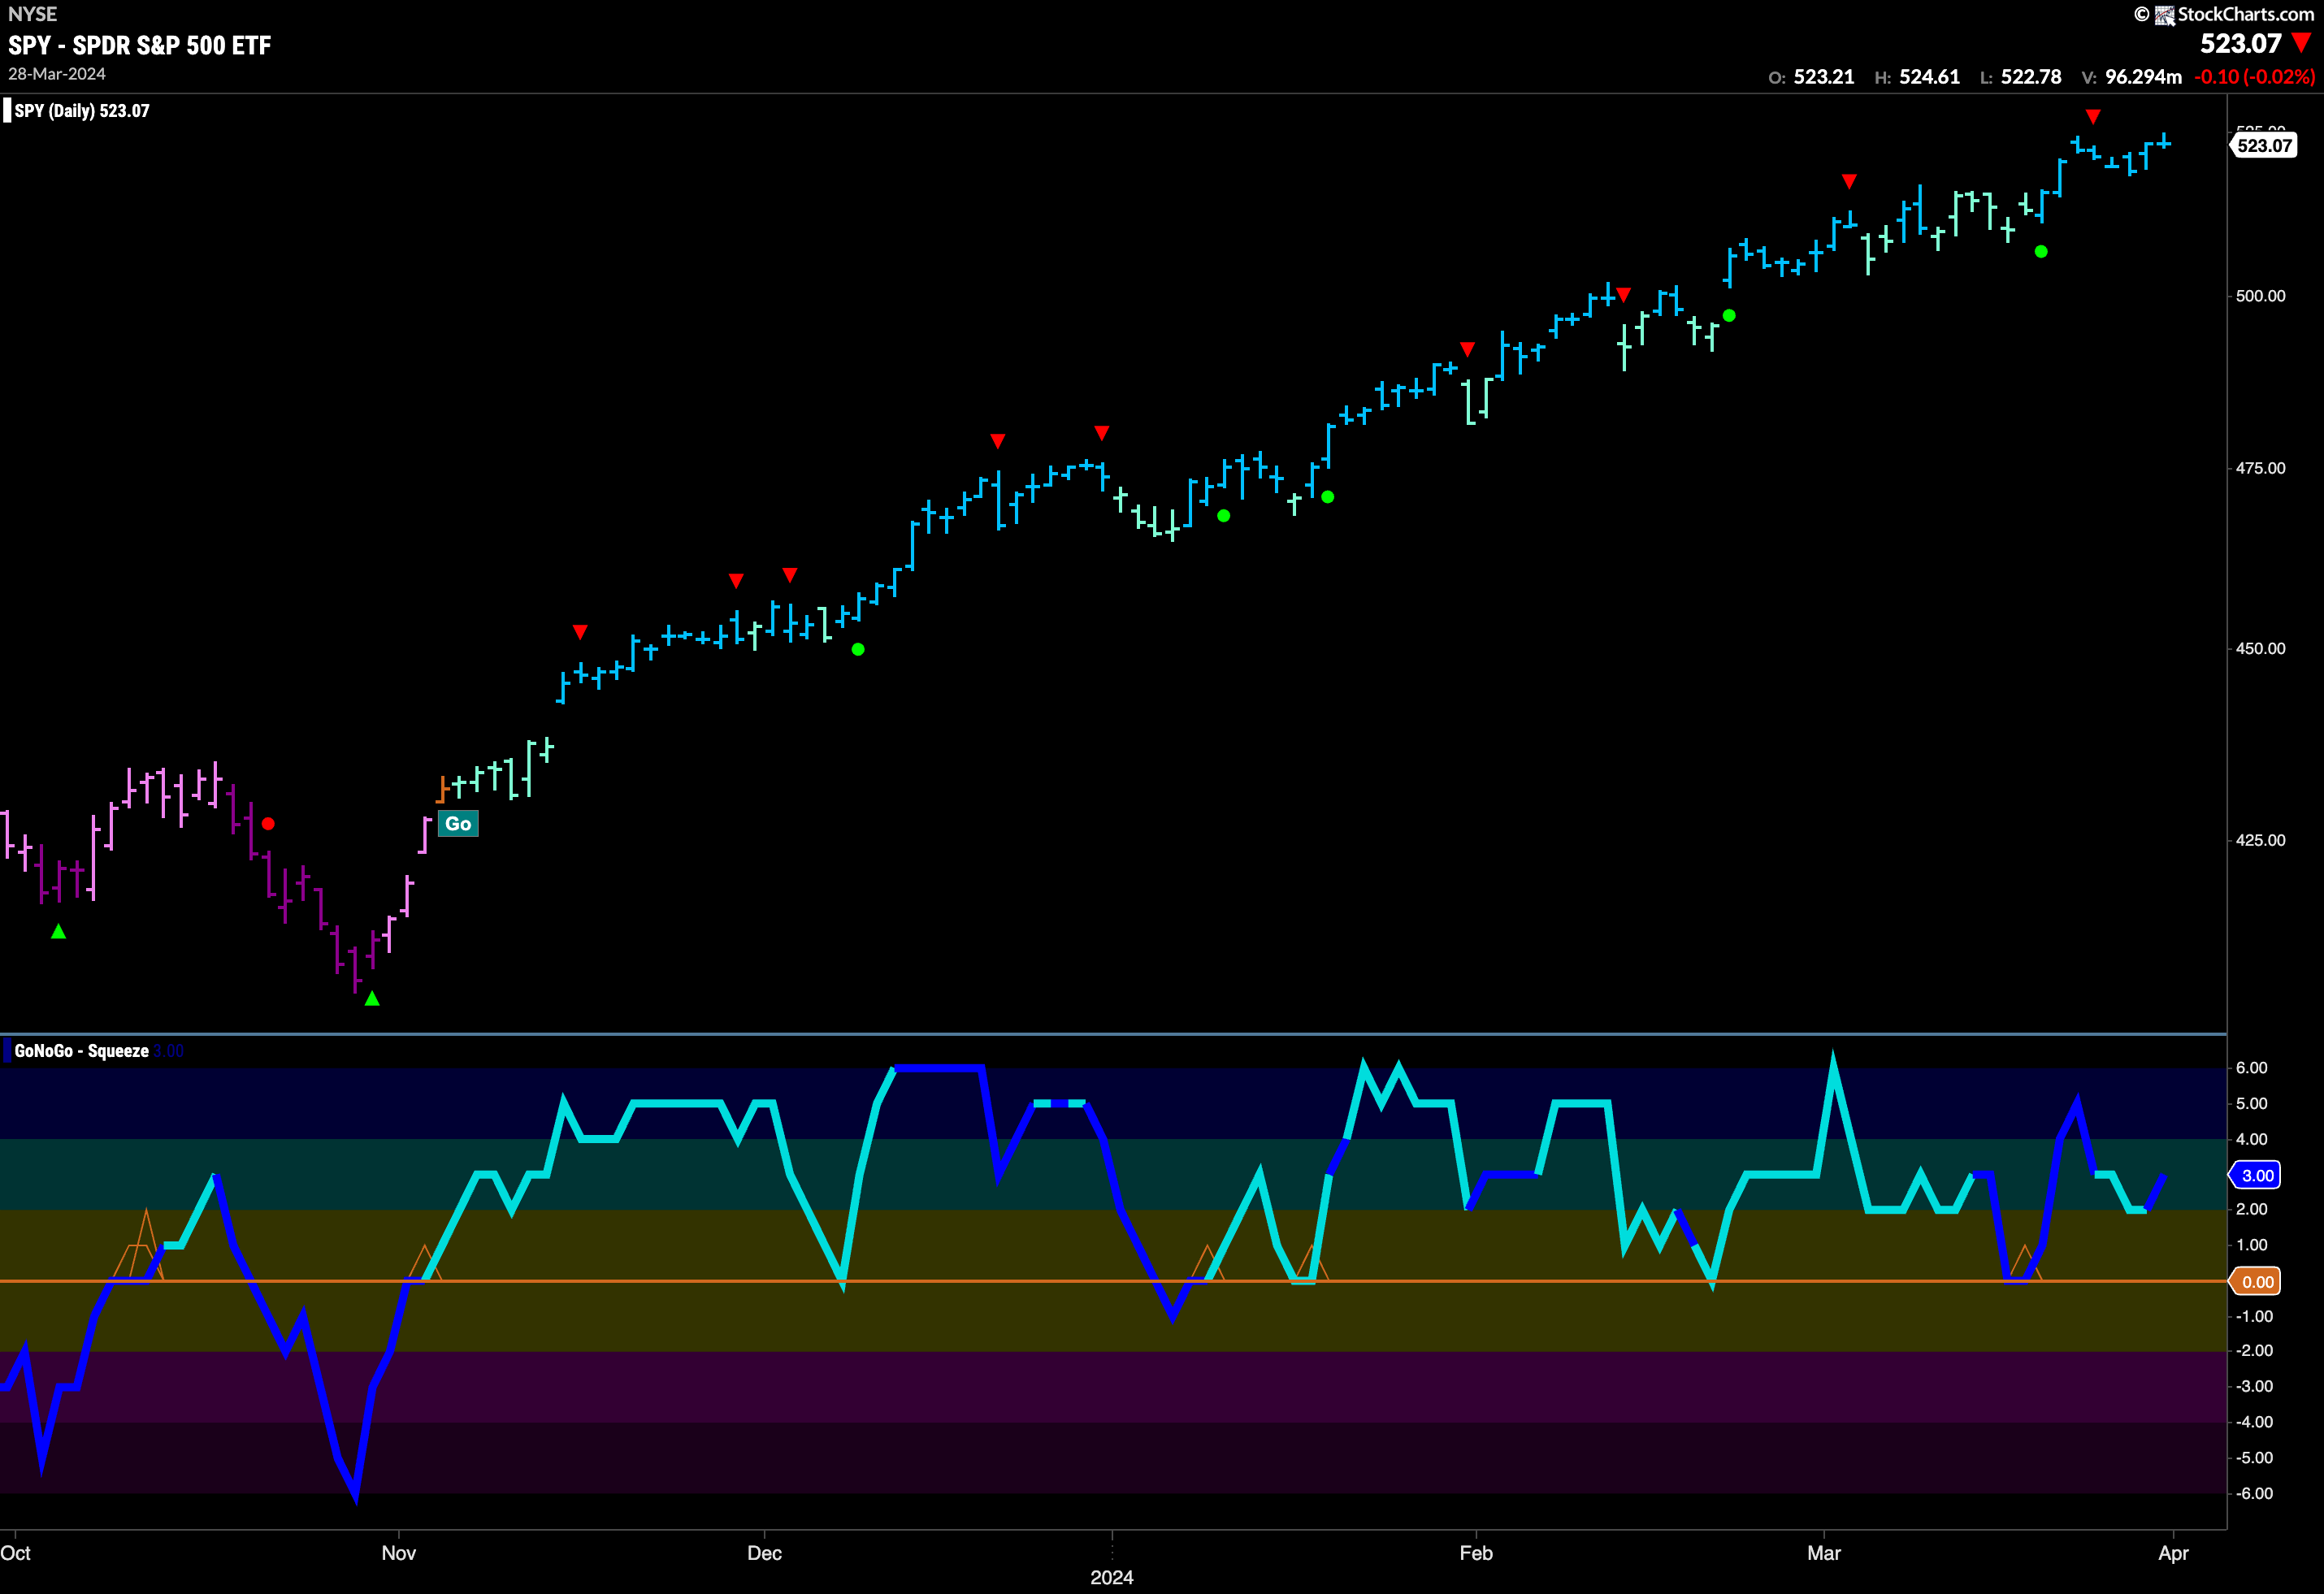
Strong “Go” bars dominated the week as price fell briefly from the last high and the Countertrend Correction Icon (red arrow). Even as price fell toward the beginning of the week the GoNoGo Trend indicator did not lose hold of strong blue bars. GoNoGo Oscillator fell from overbought territory but never made it to the zero line before turning around on heavy volume. With strong blue “Go” bars and positive momentum price rallied quickly and is back testing prior highs.
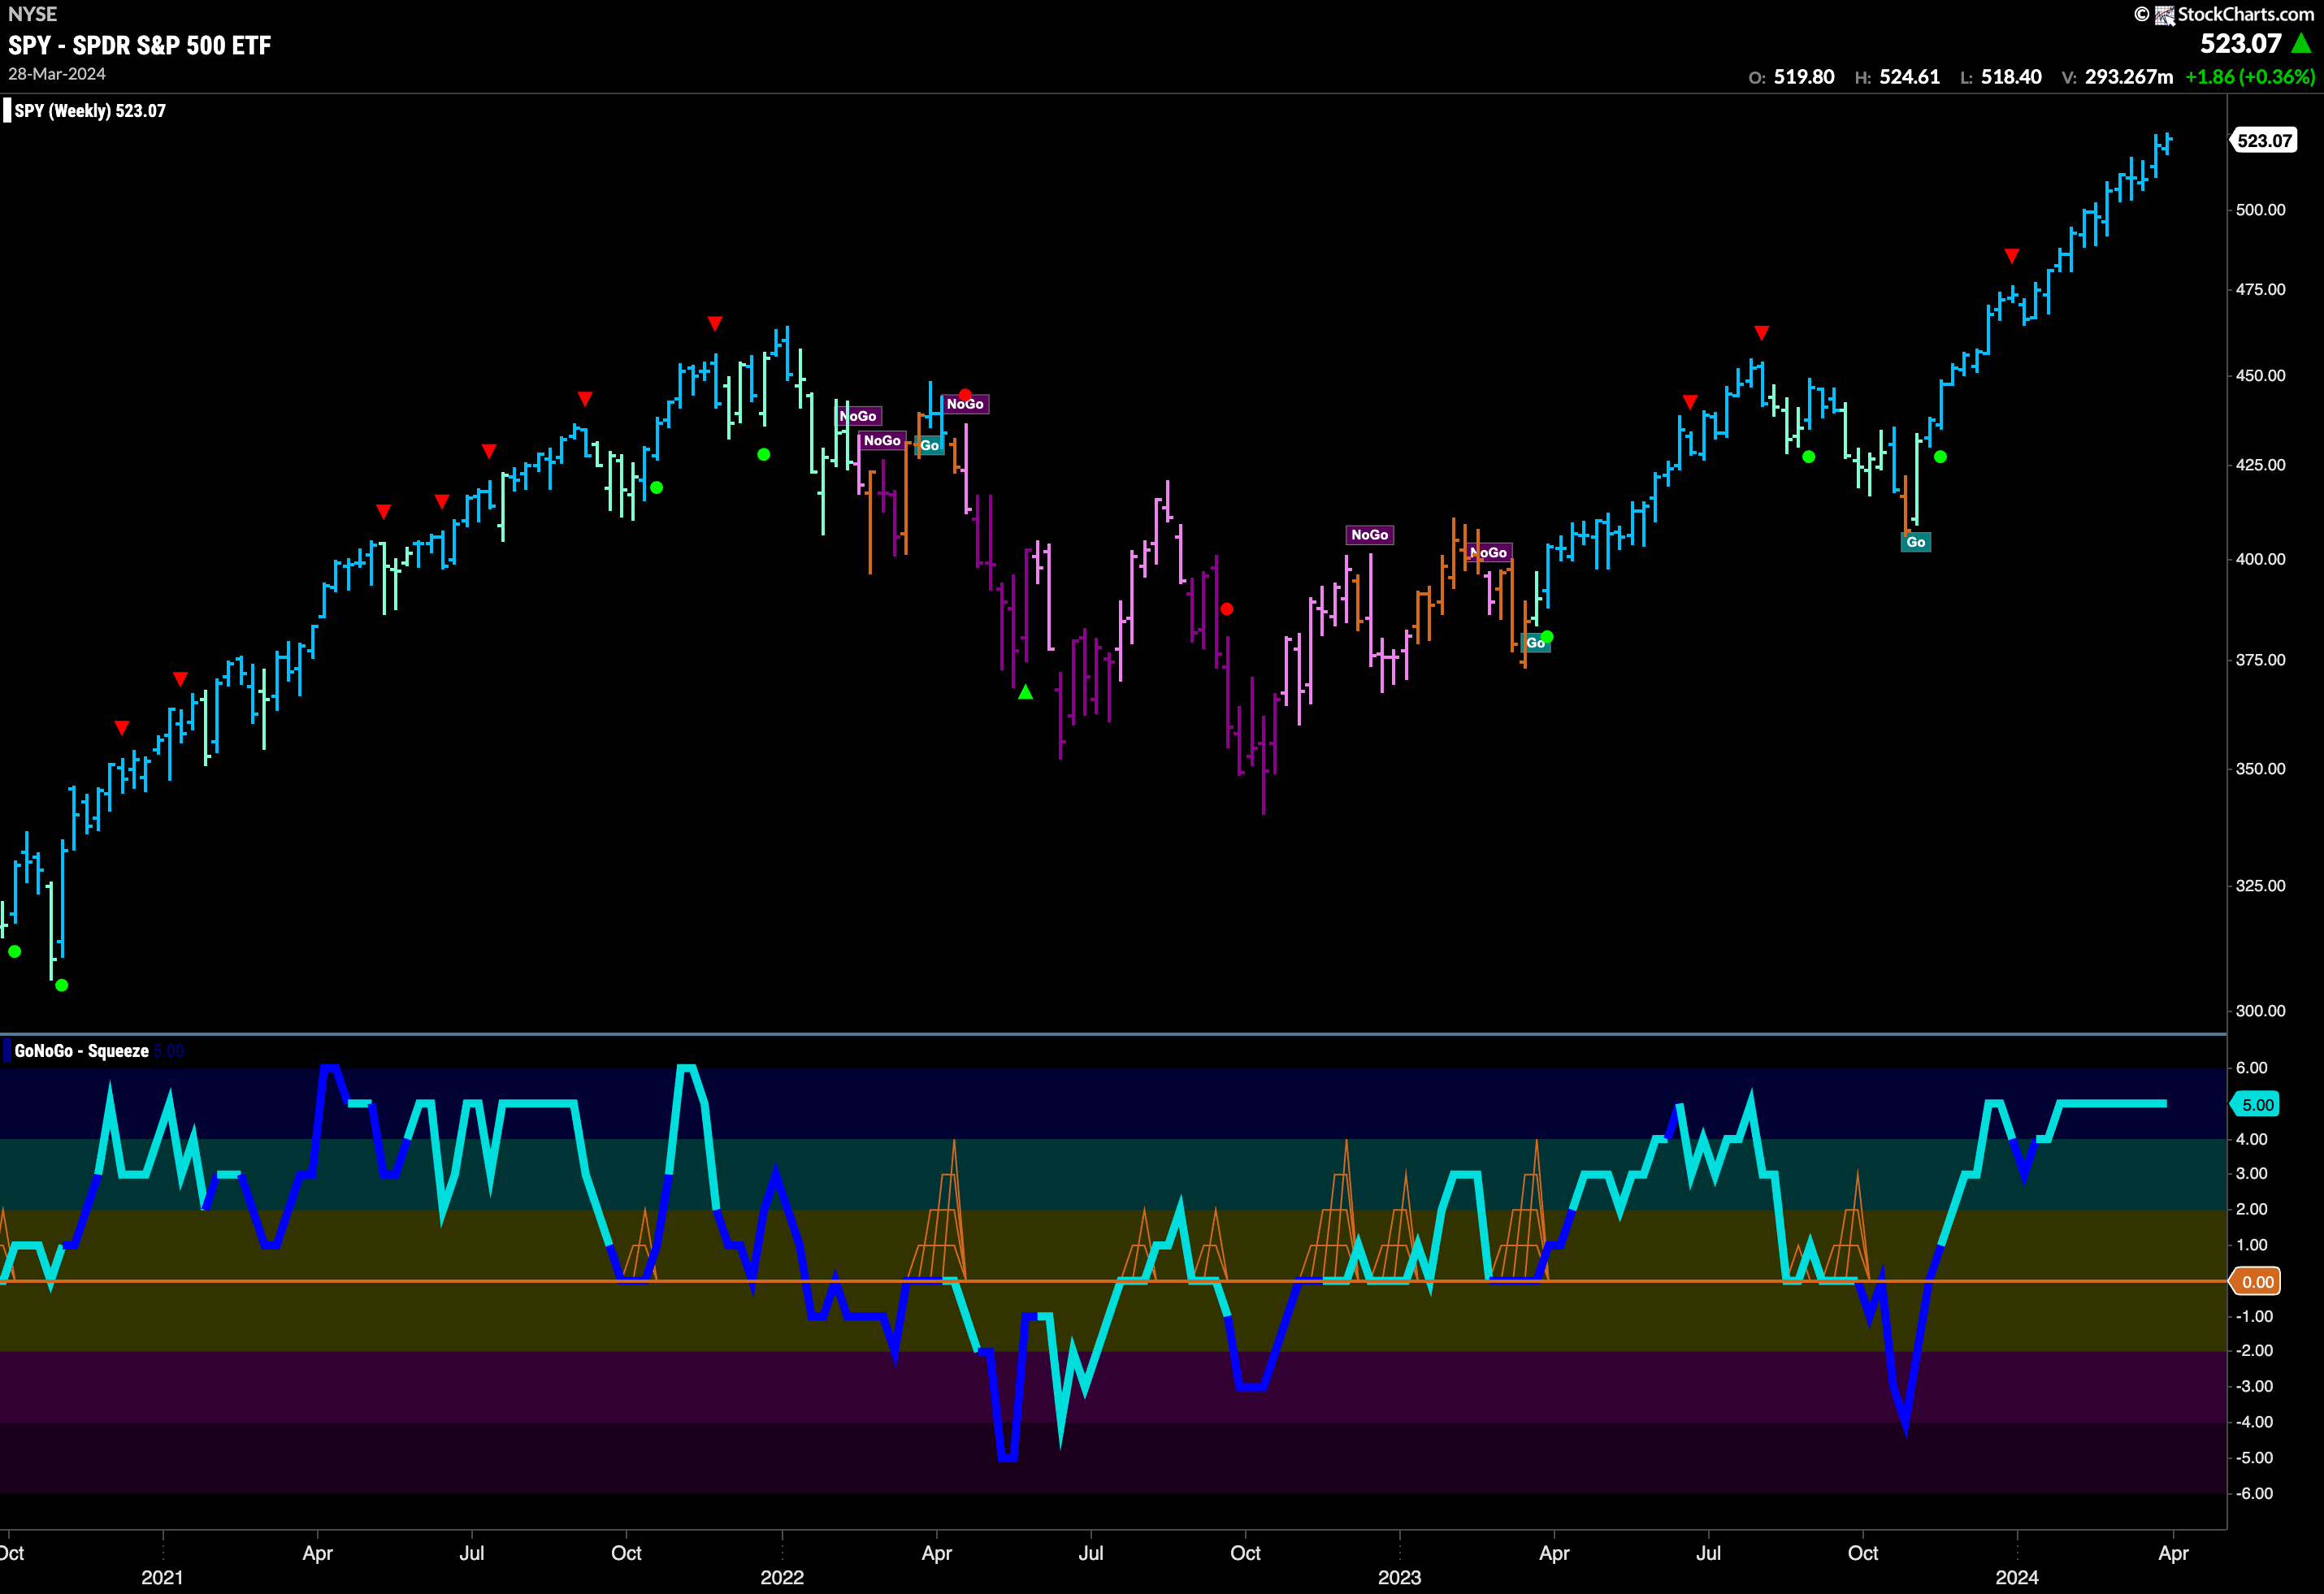
What to say about the weekly chart that we don’t already know? The trend remains strong, we see another bright blue “Go” bar on another higher weekly close. GoNoGo Oscillator remains overbought for another week at a value of 5. We will watch for the next Go Countertrend Correction Icon (red arrow) when the oscillator finally crosses below 5.
Rates Fall From Resistance
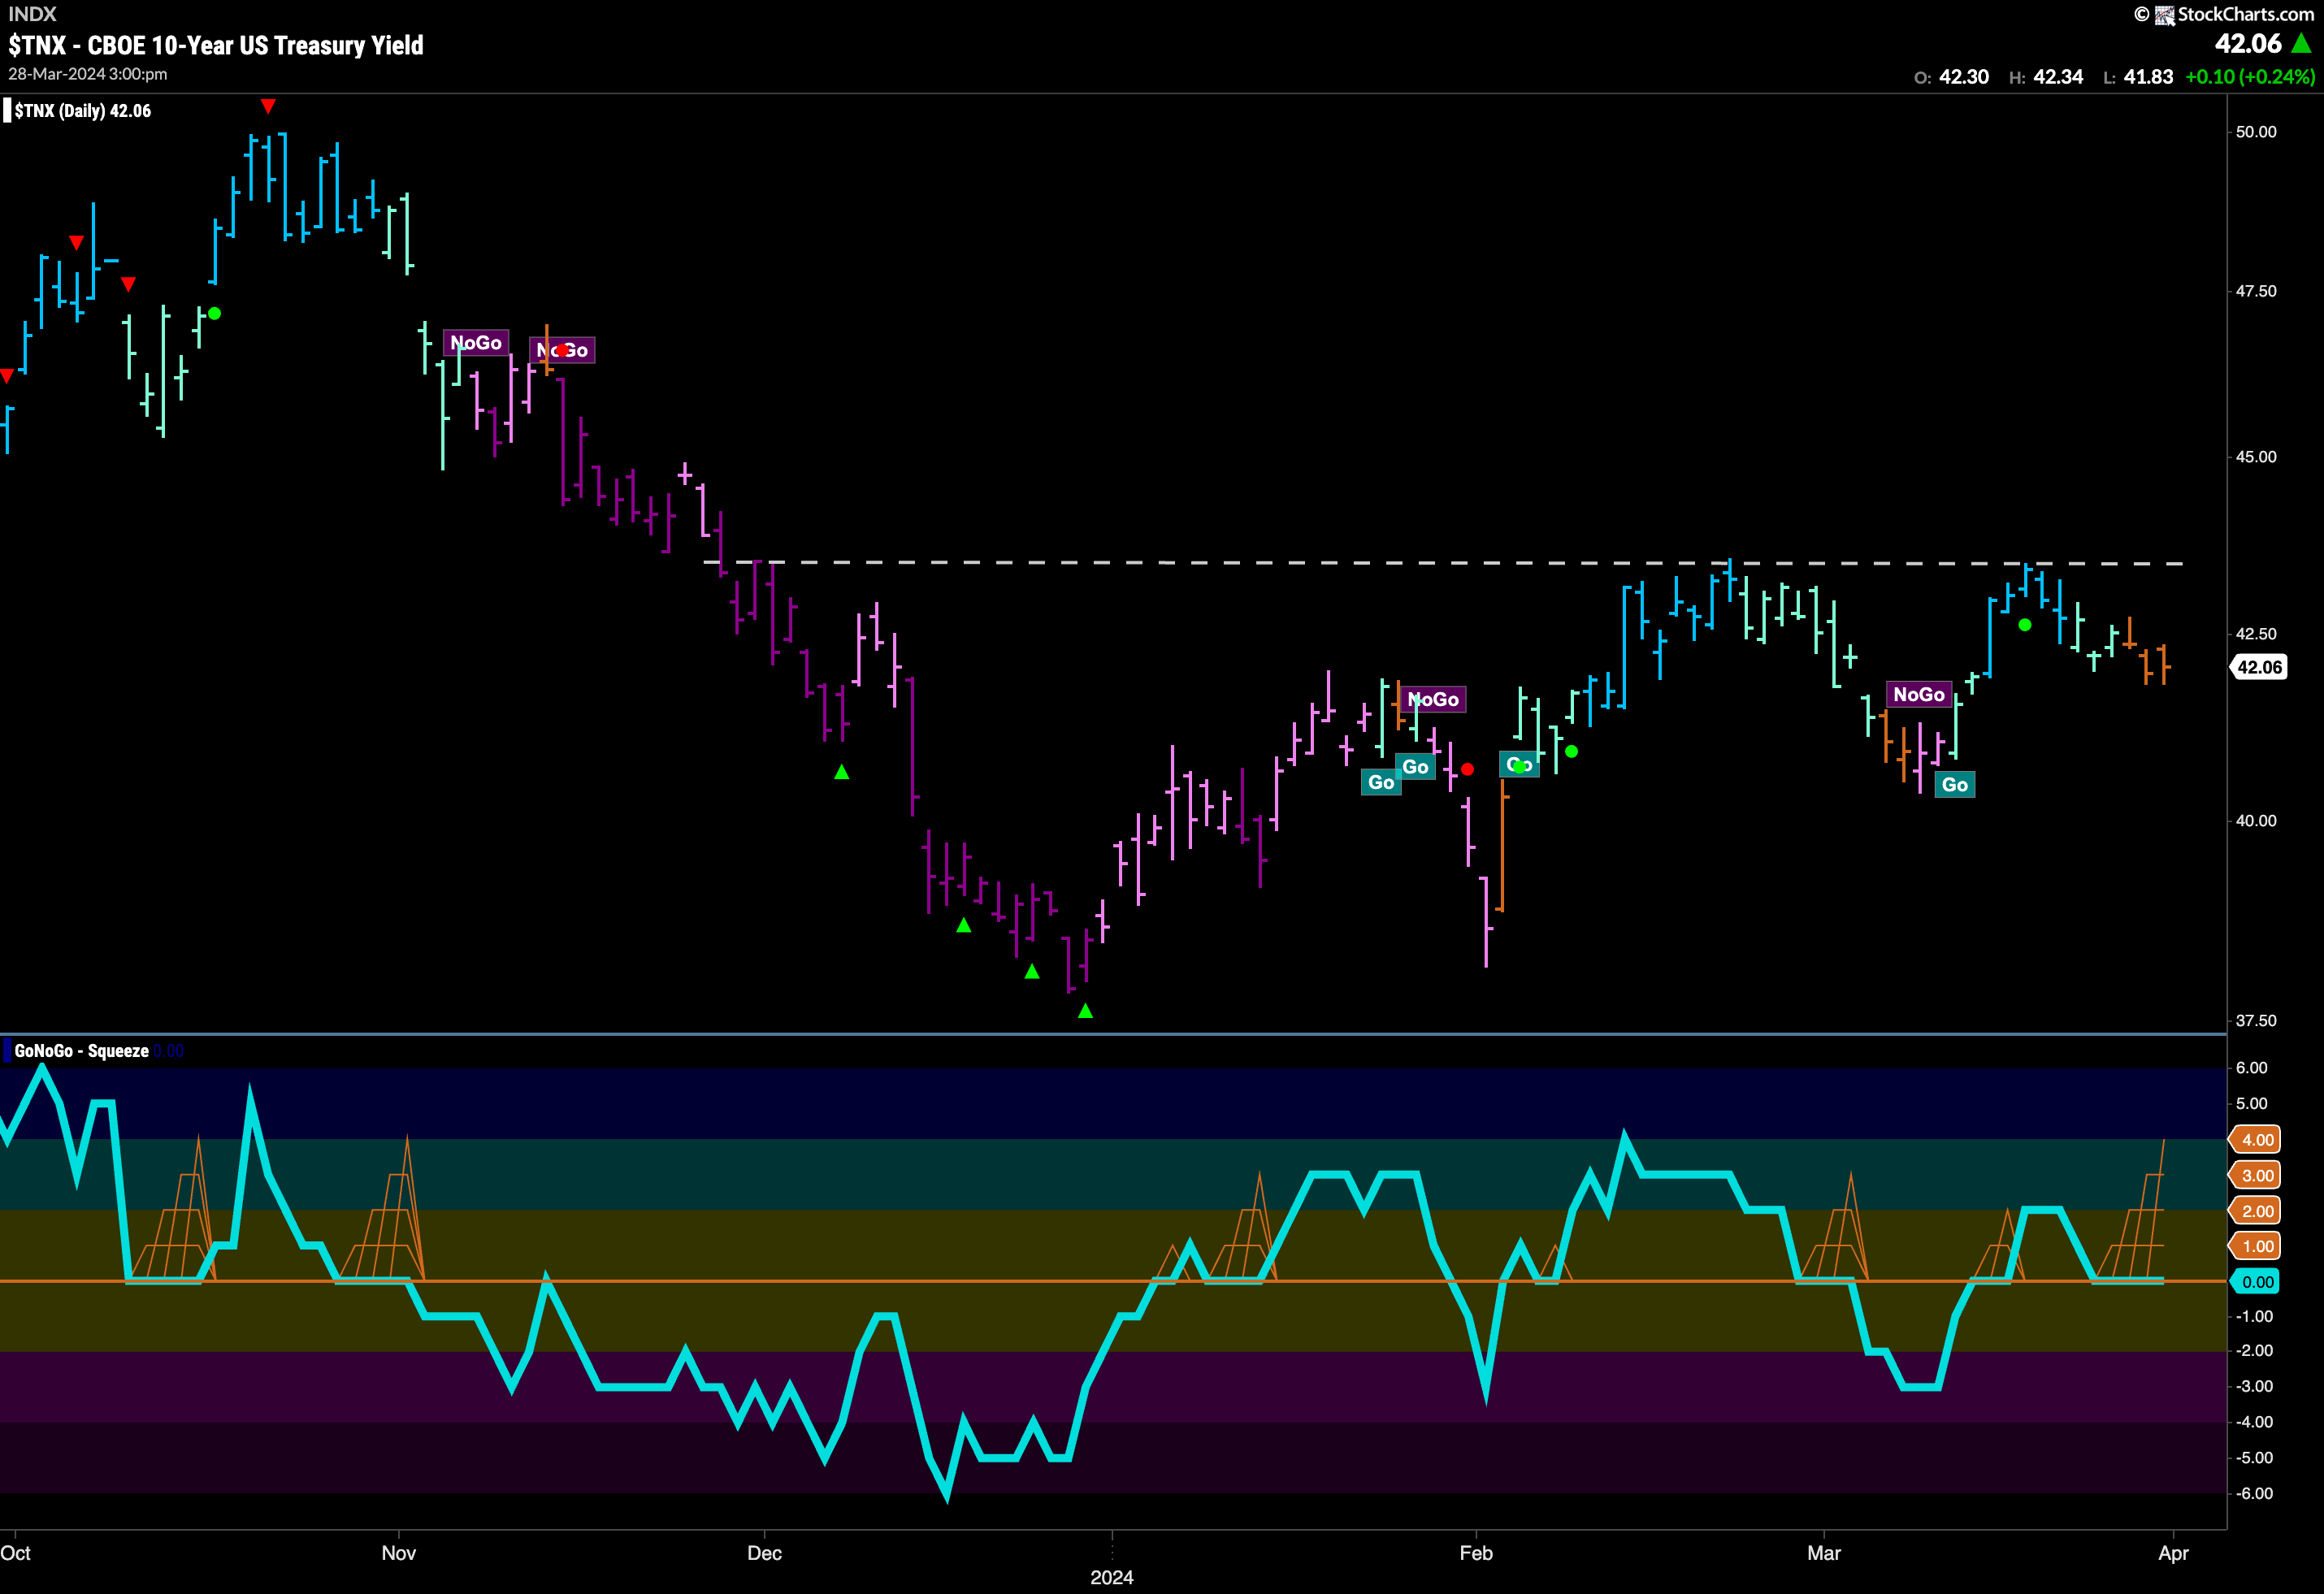
Treasury rates did indeed fall from the resistance we pointed out last week. As prices fell, we saw GoNoGo Trend paint weaker aqua “Go” bars and then amber “Go Fish” bars of uncertainty in the latter part of the week. GoNoGo Oscillator fell to test the zero line from above and has found itself stuck there as we see indecision between buyers and sellers. We will watch to see in which direction the new building GoNoGo Squeeze is broken. This will help determine price’s next direction.
Dollar Consolidates Breakout
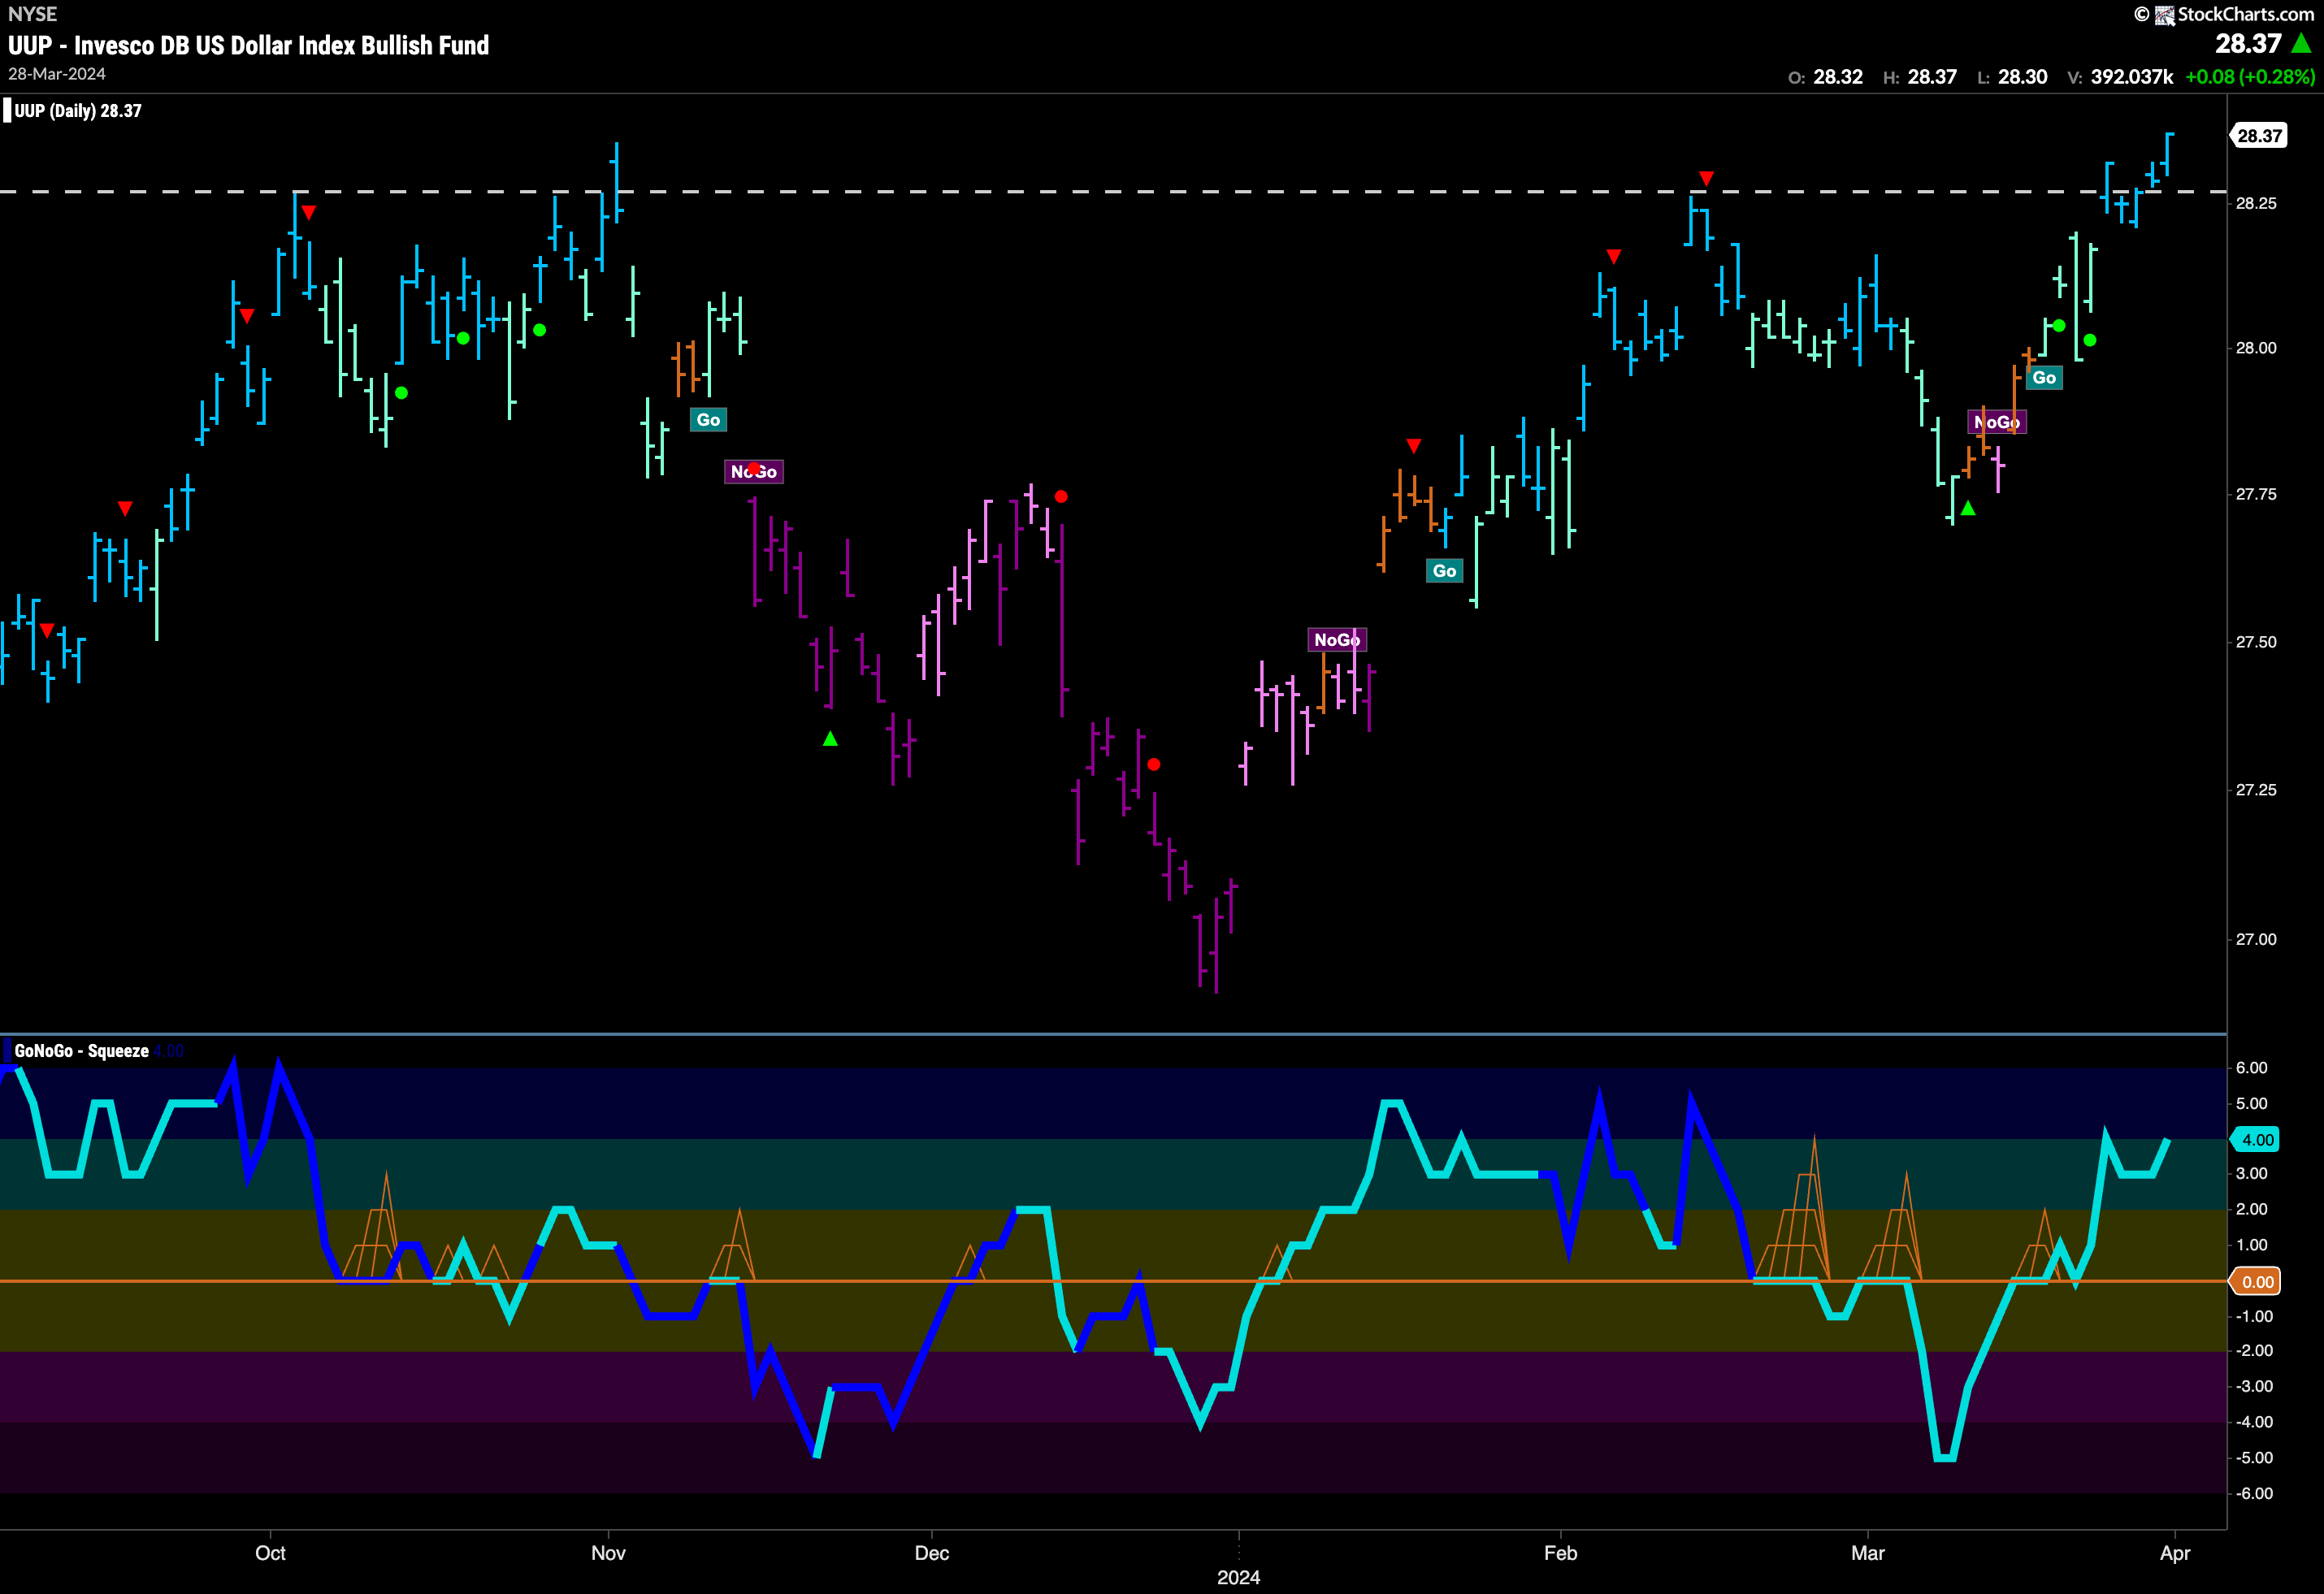
The beginning of the week saw the greenback needing some time to consolidate after its break higher at the end of last. We see that happened and price was able to build on strong blue “Go” bars and on the last session of the week moved higher still. Now, with GoNoGo Trend painting strong blue bars at new highs, GoNoGo Oscillator is in positive territory but still not yet overbought. We will watch to see if this surging momentum in the direction of the underlying “Go” trend will propel price higher still.
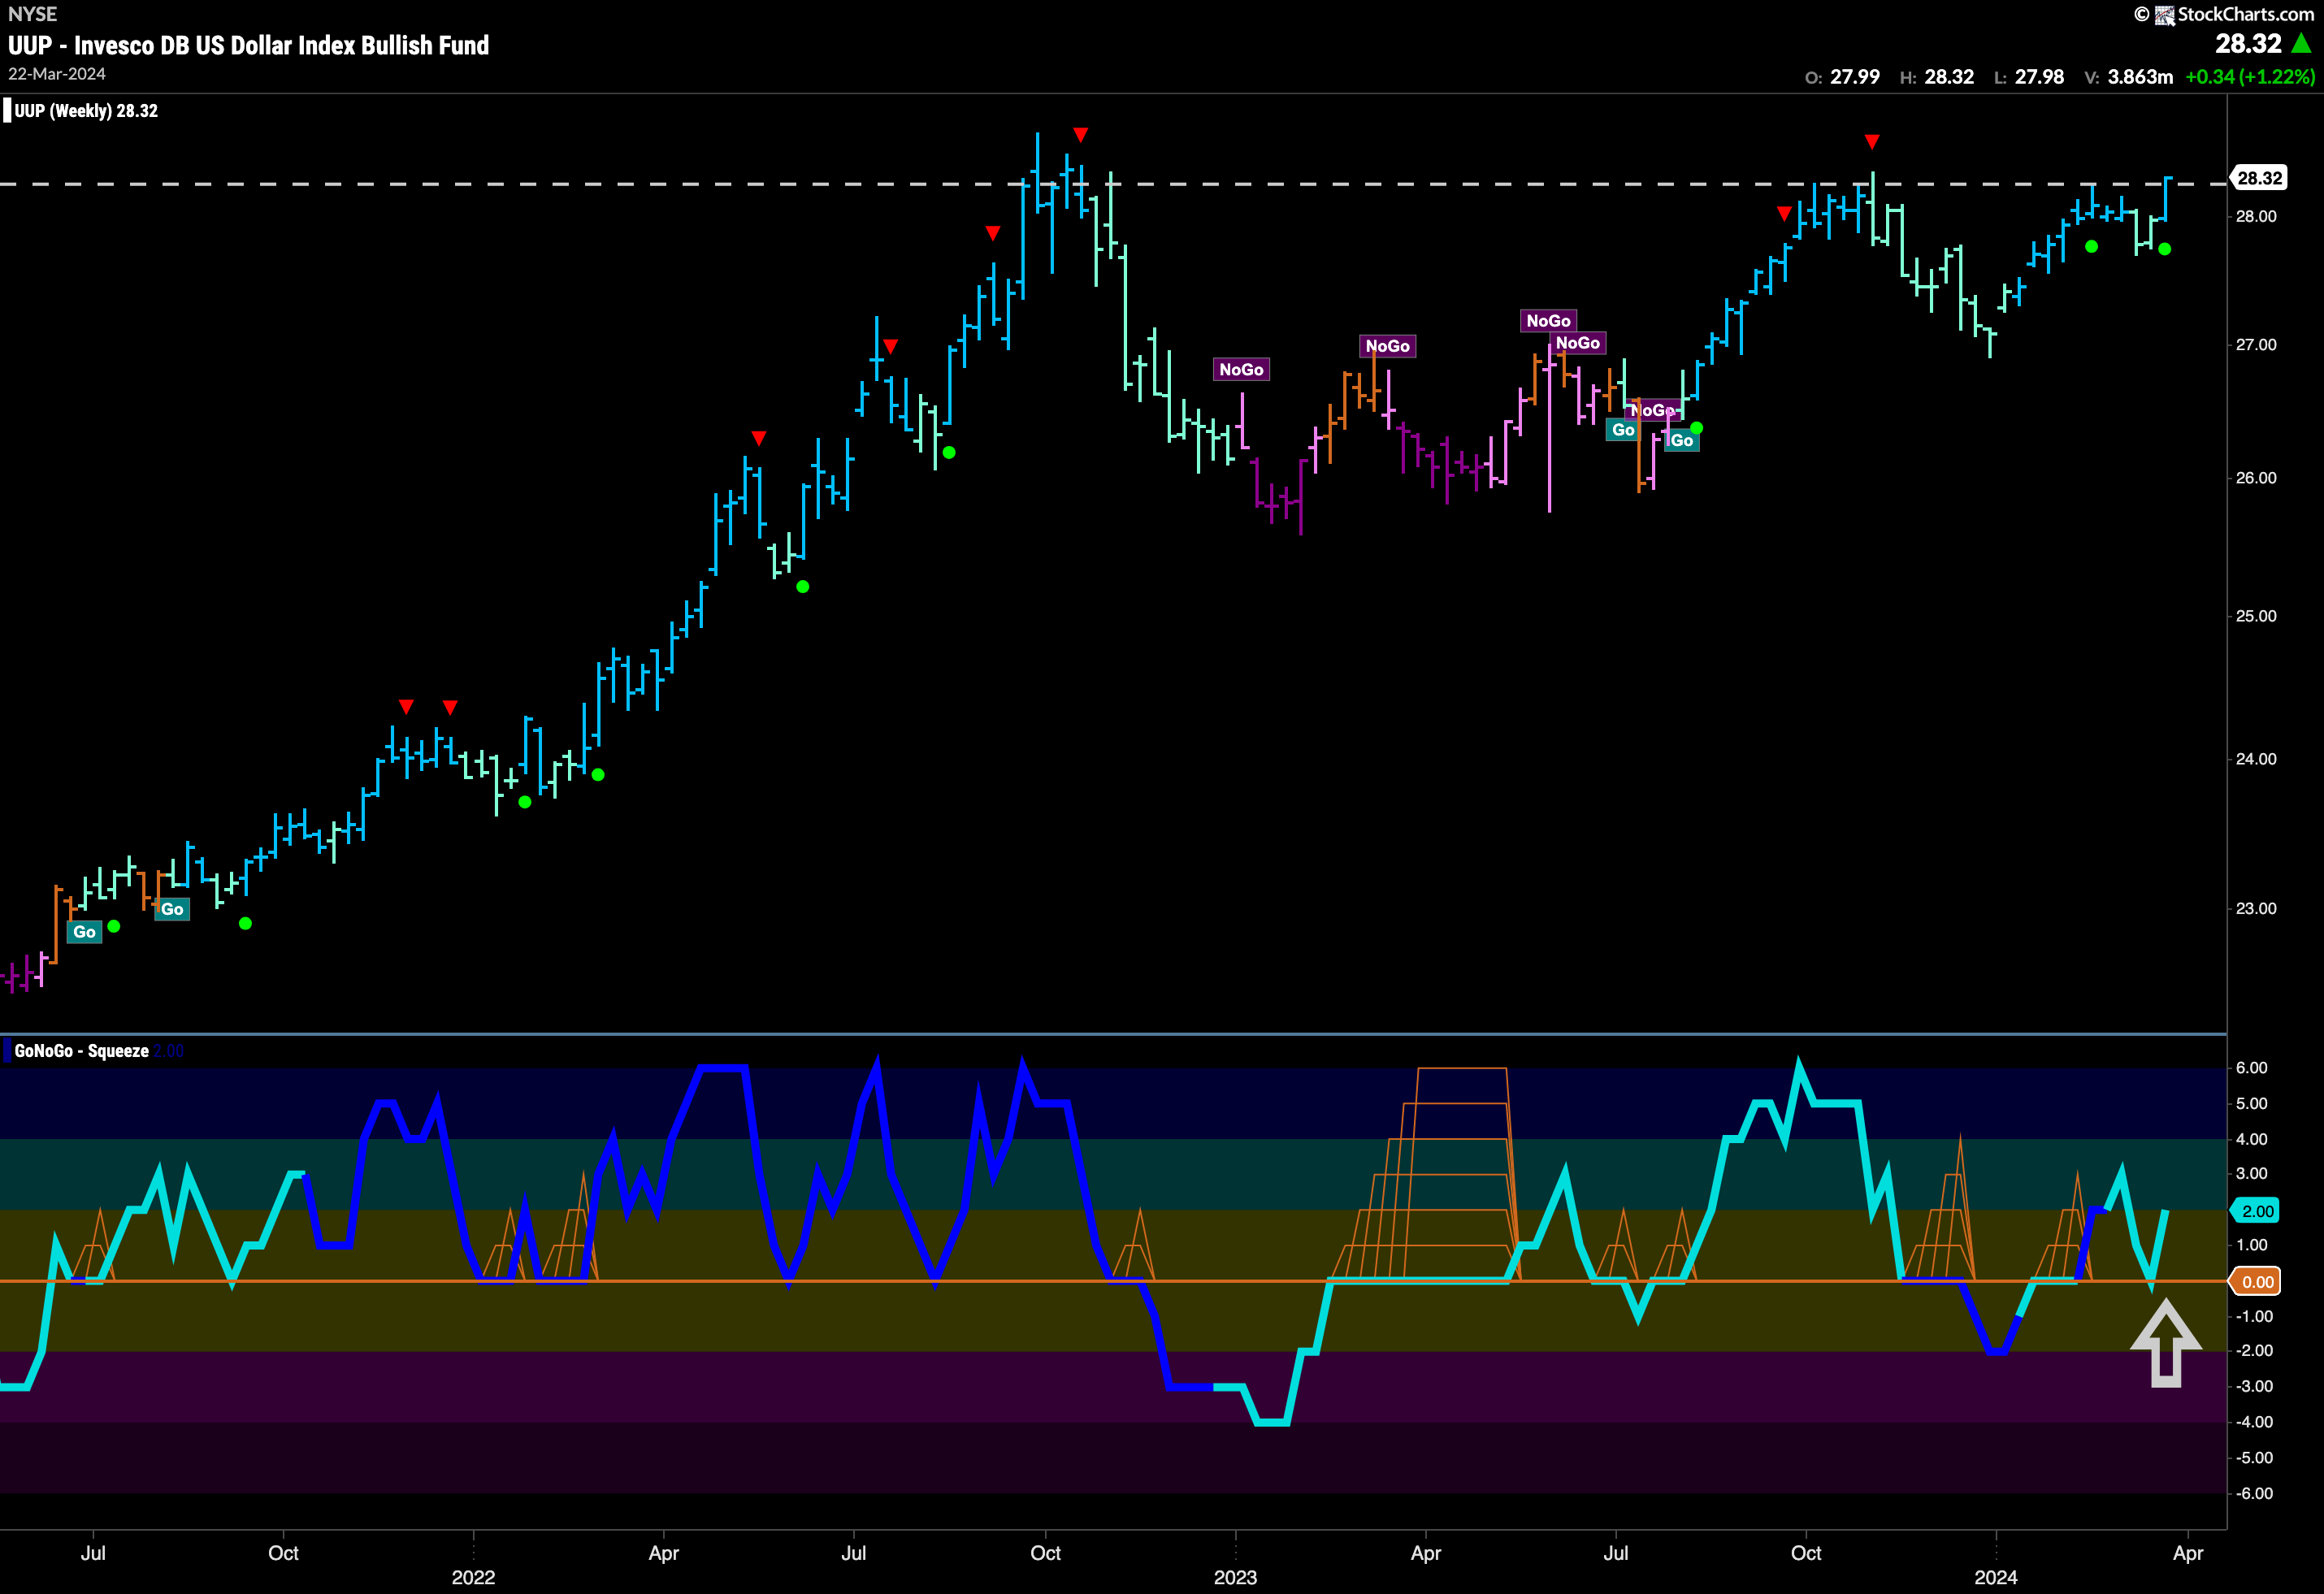
The longer term chart shows just how important this level is. With everything looking strong on the daily chart we can turn our attention to the weekly to get a sense of the larger picture. There is still resistance that price needs to climb through. However, it is looking good as we are seeing the signs line up for a potential breakout. Price is at resistance and GoNoGo Trend is painting a strong blue “Go” bar. GoNoGo Oscillator has found support again at the zero line so we see a Go Trend Continuation Icon (green circle) under the price bar. This tells us that momentum is resurgent in the direction of the “Go” trend and so we will look to see if this gives price the push it needs to break to a new high.
Oil Remains in “Go” Trend
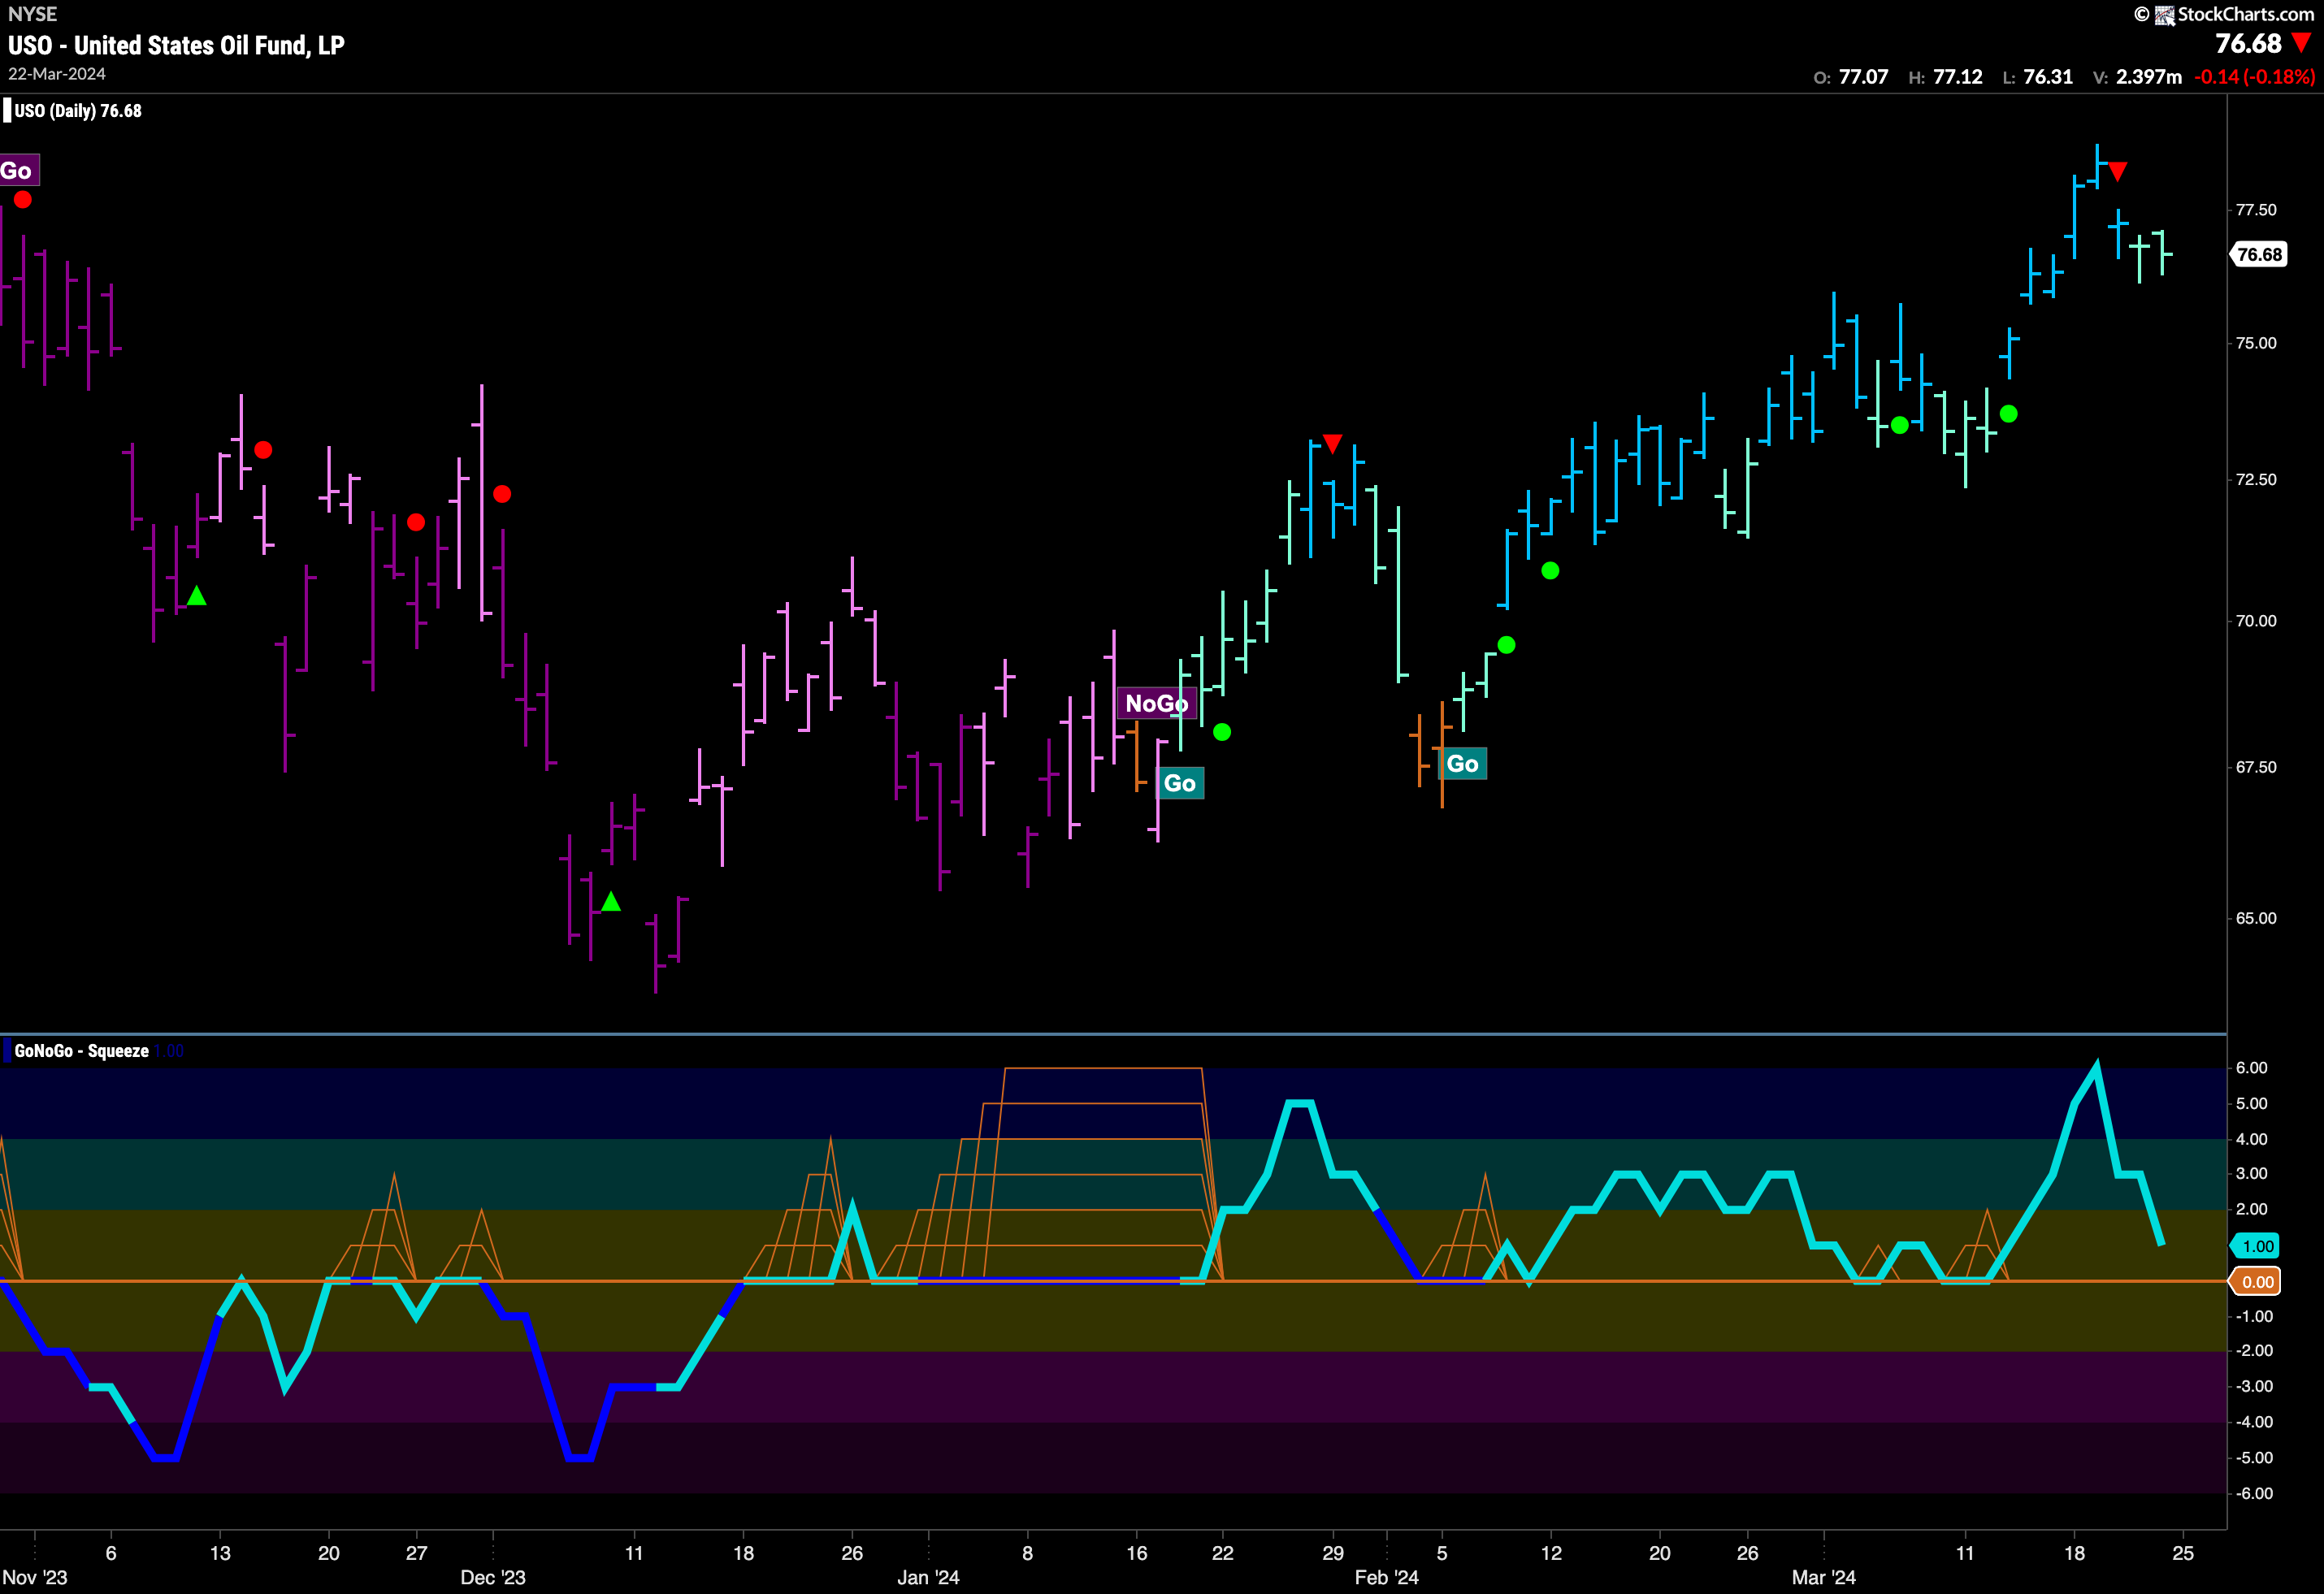
The beginning of this week saw oil prices climb even higher and set a new high. As momentum waned right after that we saw a Go Countertrend Correction Icon (red triangle) that suggested price may struggle to go higher in the short term. Indeed, GoNoGo Trend then painted a couple of weaker aqua “Go” bars and GoNoGo Oscillator has fallen toward the zero line. As GoNoGo Oscillator approaches the zero. line we will watch to see if it finds support. If it does, and rallies back into positive territory then we will expect price to make an attack at another higher high.
Gold Breaks to New High
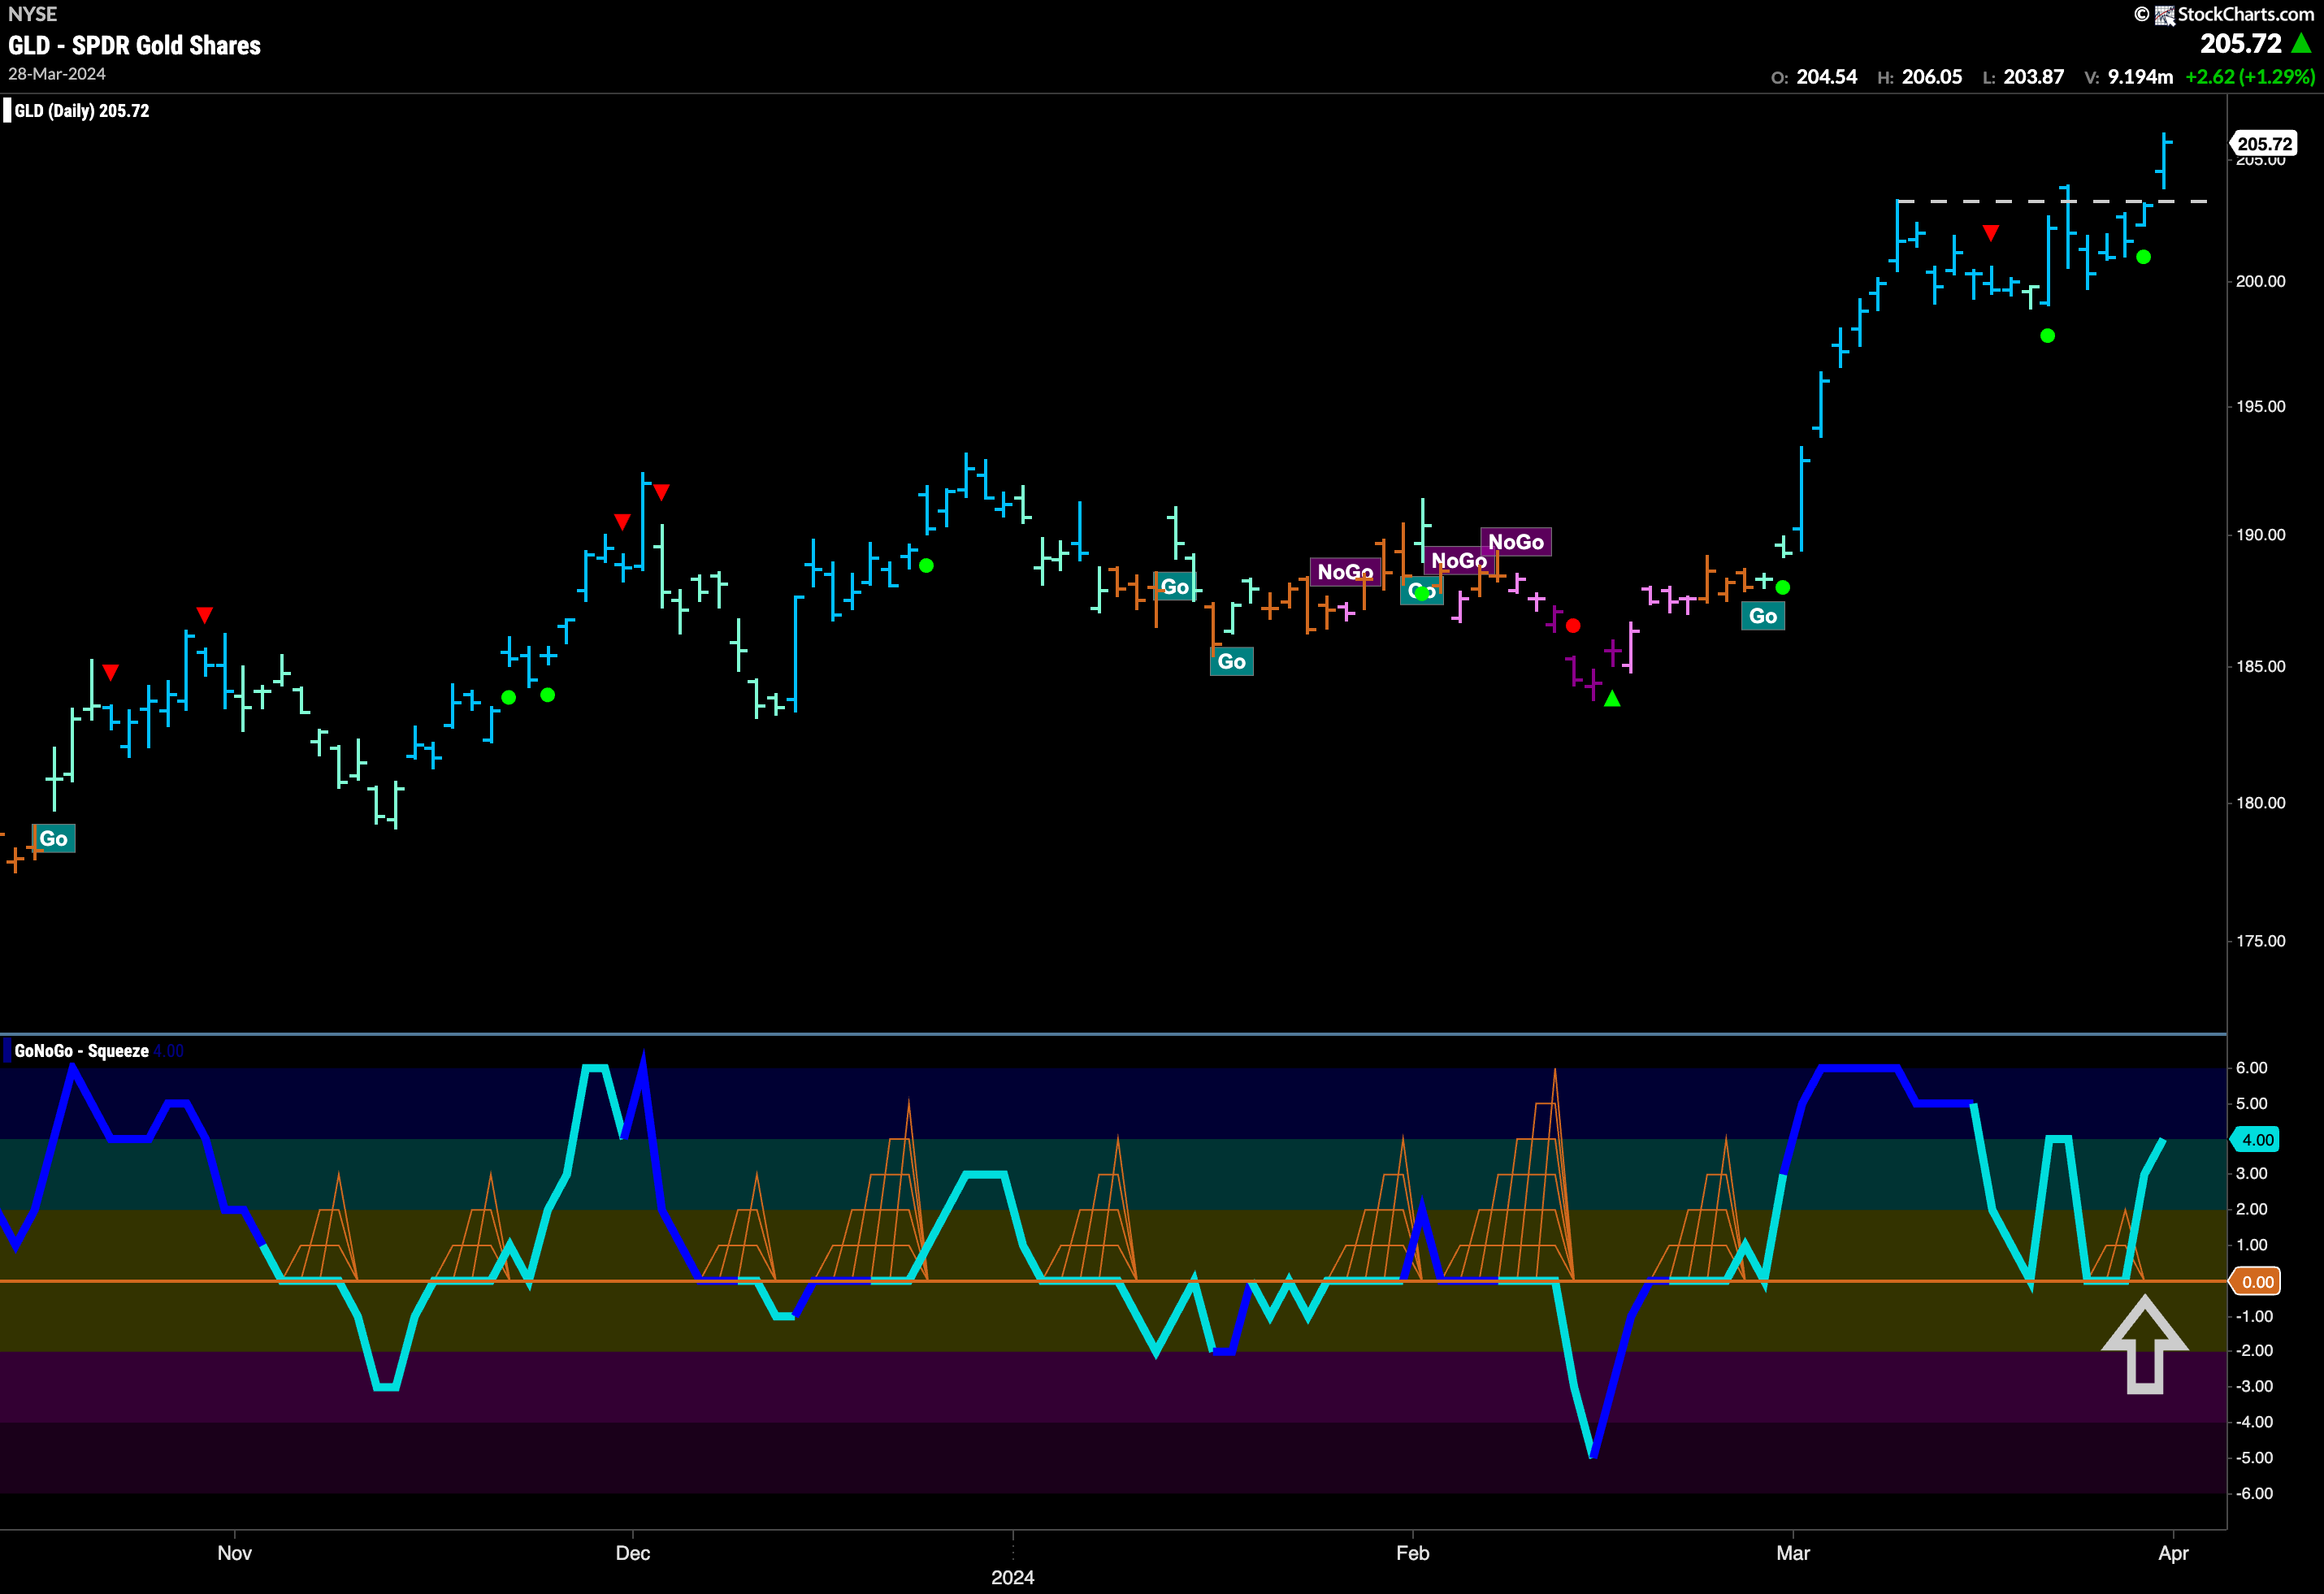
GoNoGo Trend painted nothing but strong blue “Go” bars this week as price took a run at resistance and succeeded. The last bar of the week saw a new high as the precious metal ETF gapped higher and then closed toward the highs of the day. This followed signs of trend continuation in the form of the green circles on the chart. As price had been consolidating sideways for the last few weeks we noted how GoNoGo Oscillator had been able to find support at the zero line and this gave price the support it needed to remain strong and burst through resistance.
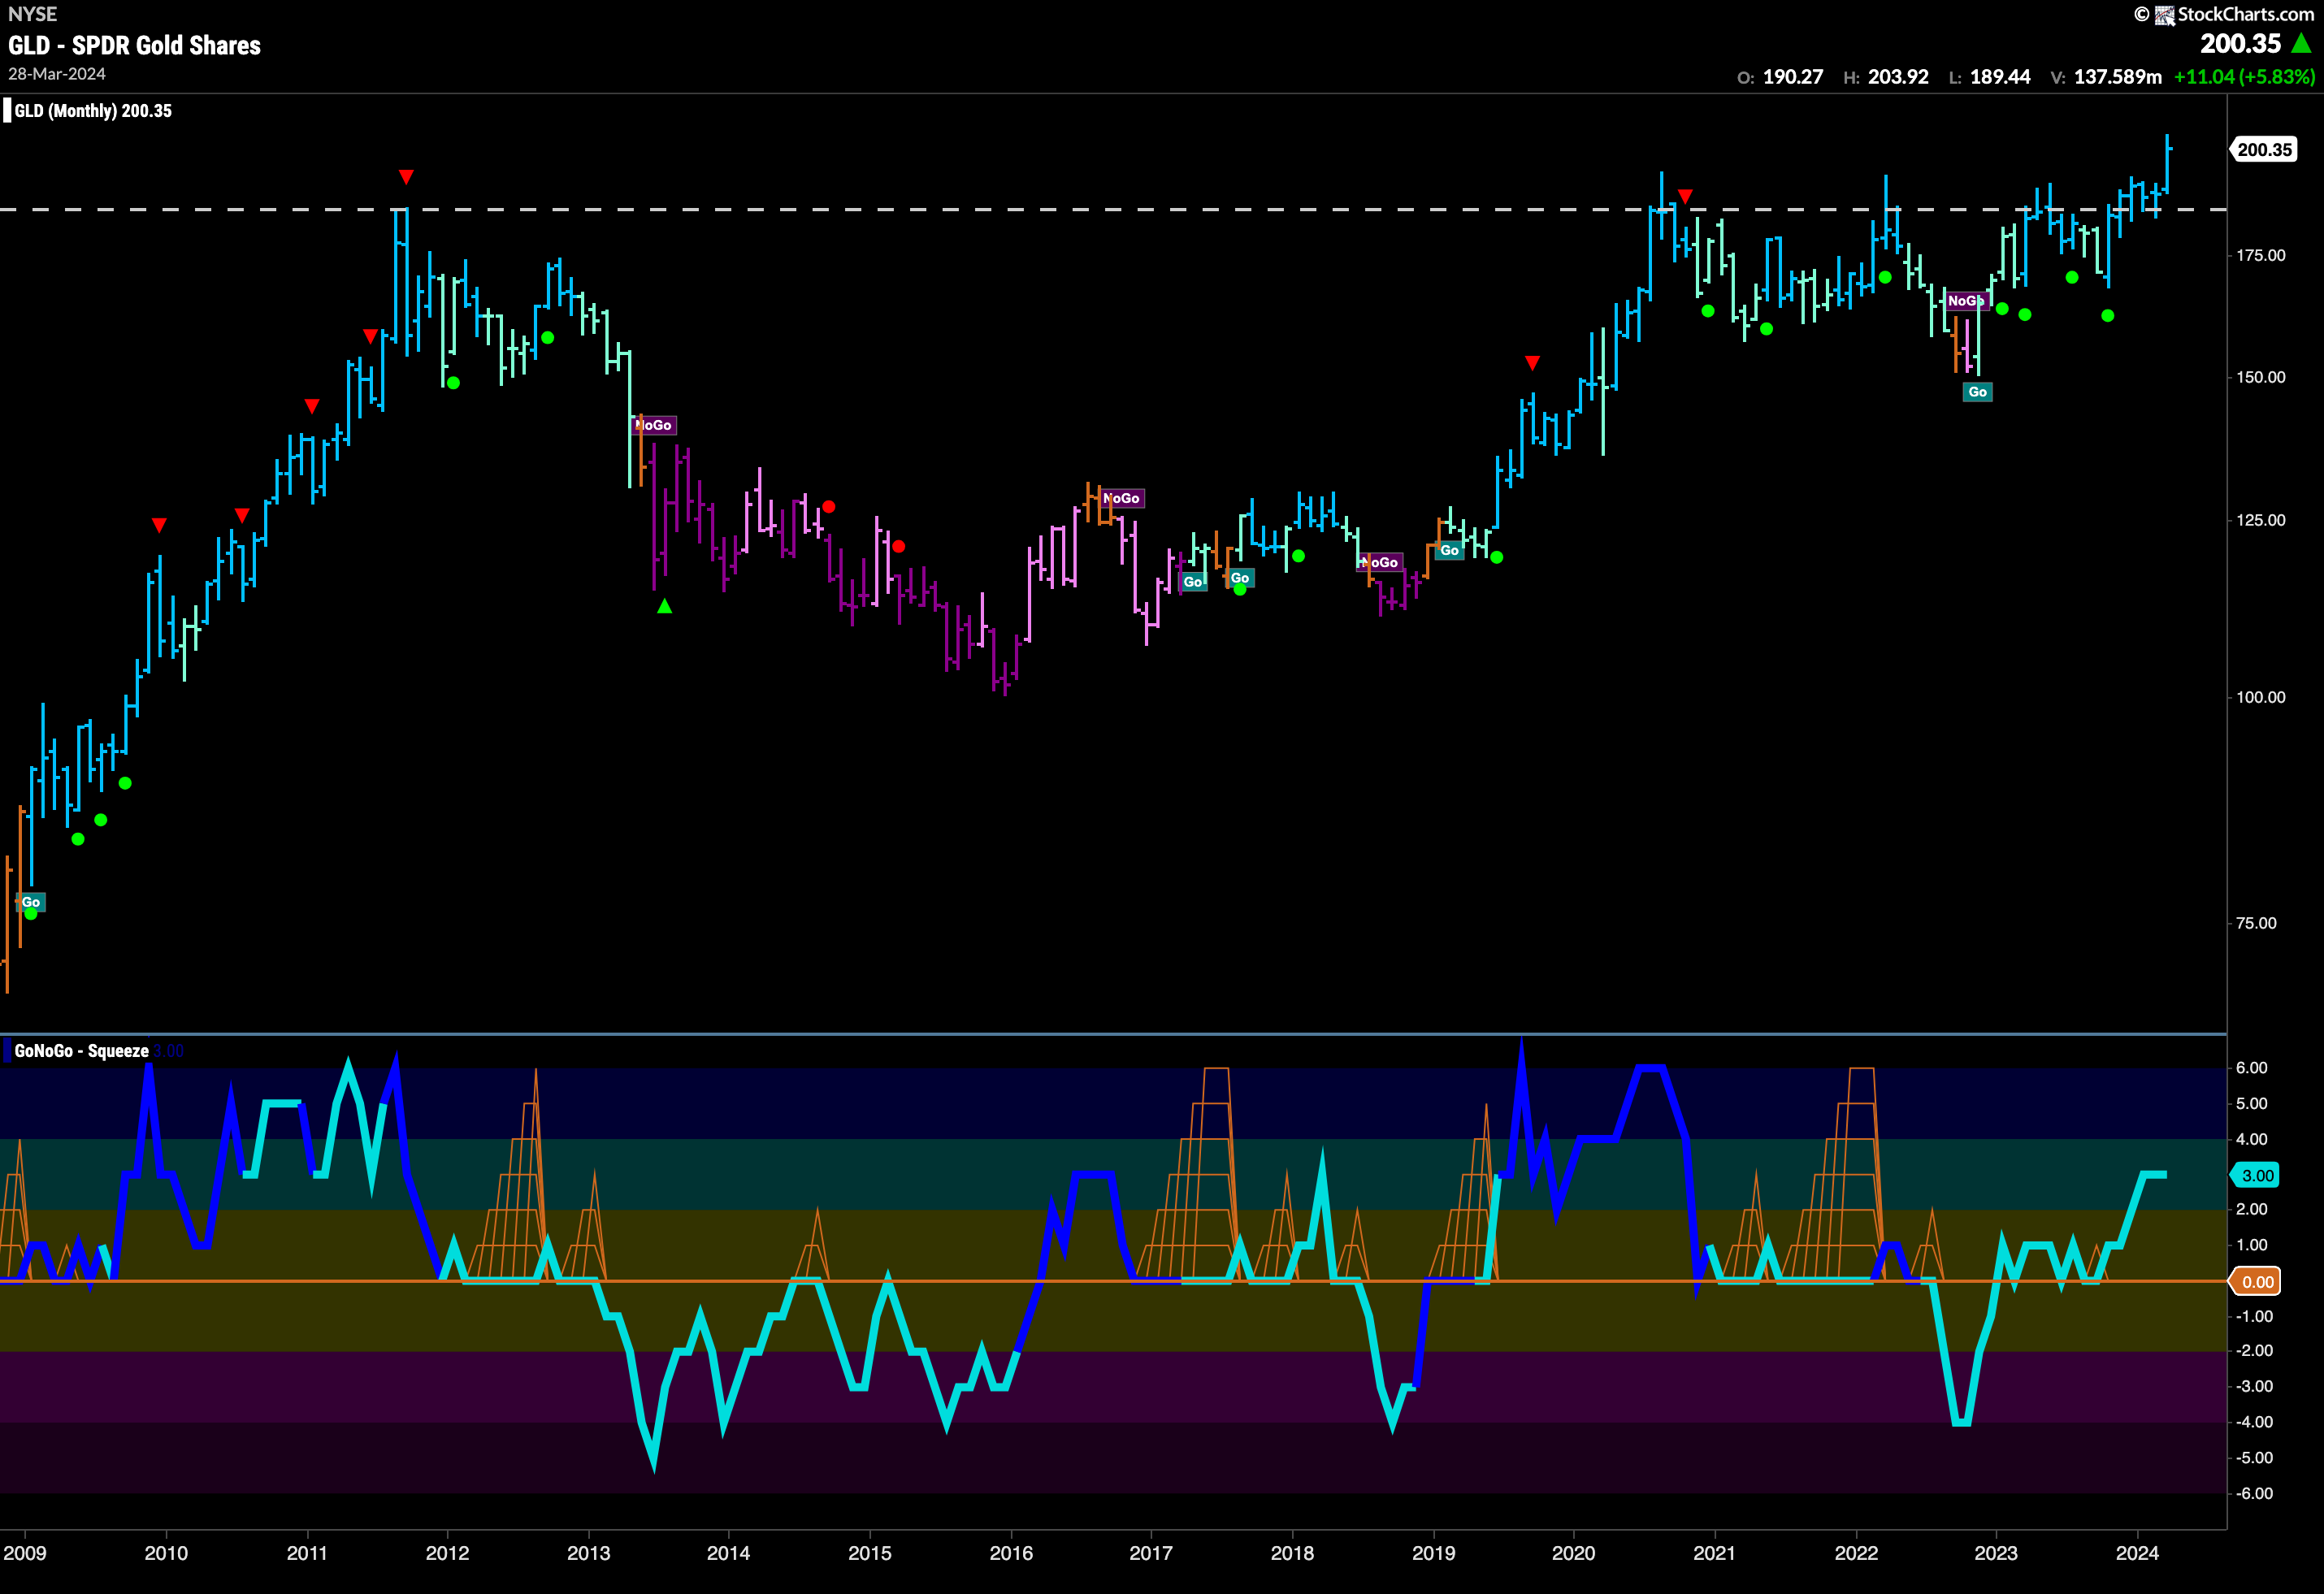
We now have a monthly higher high! The month of March finished strongly and we now see a clear break above levels that we have been paying attention to in the form of decade plus long resistance! With GoNoGo Trend painting another strong “Go” bar and price above these levels that have been such strong resistance that has got the gold bugs excited. We see GoNoGo Oscillator is in positive territory at a value of 3 and not yet overbought. We will look for prices to consolidate at these levels which should now provide support going forward.
Sector RelMap
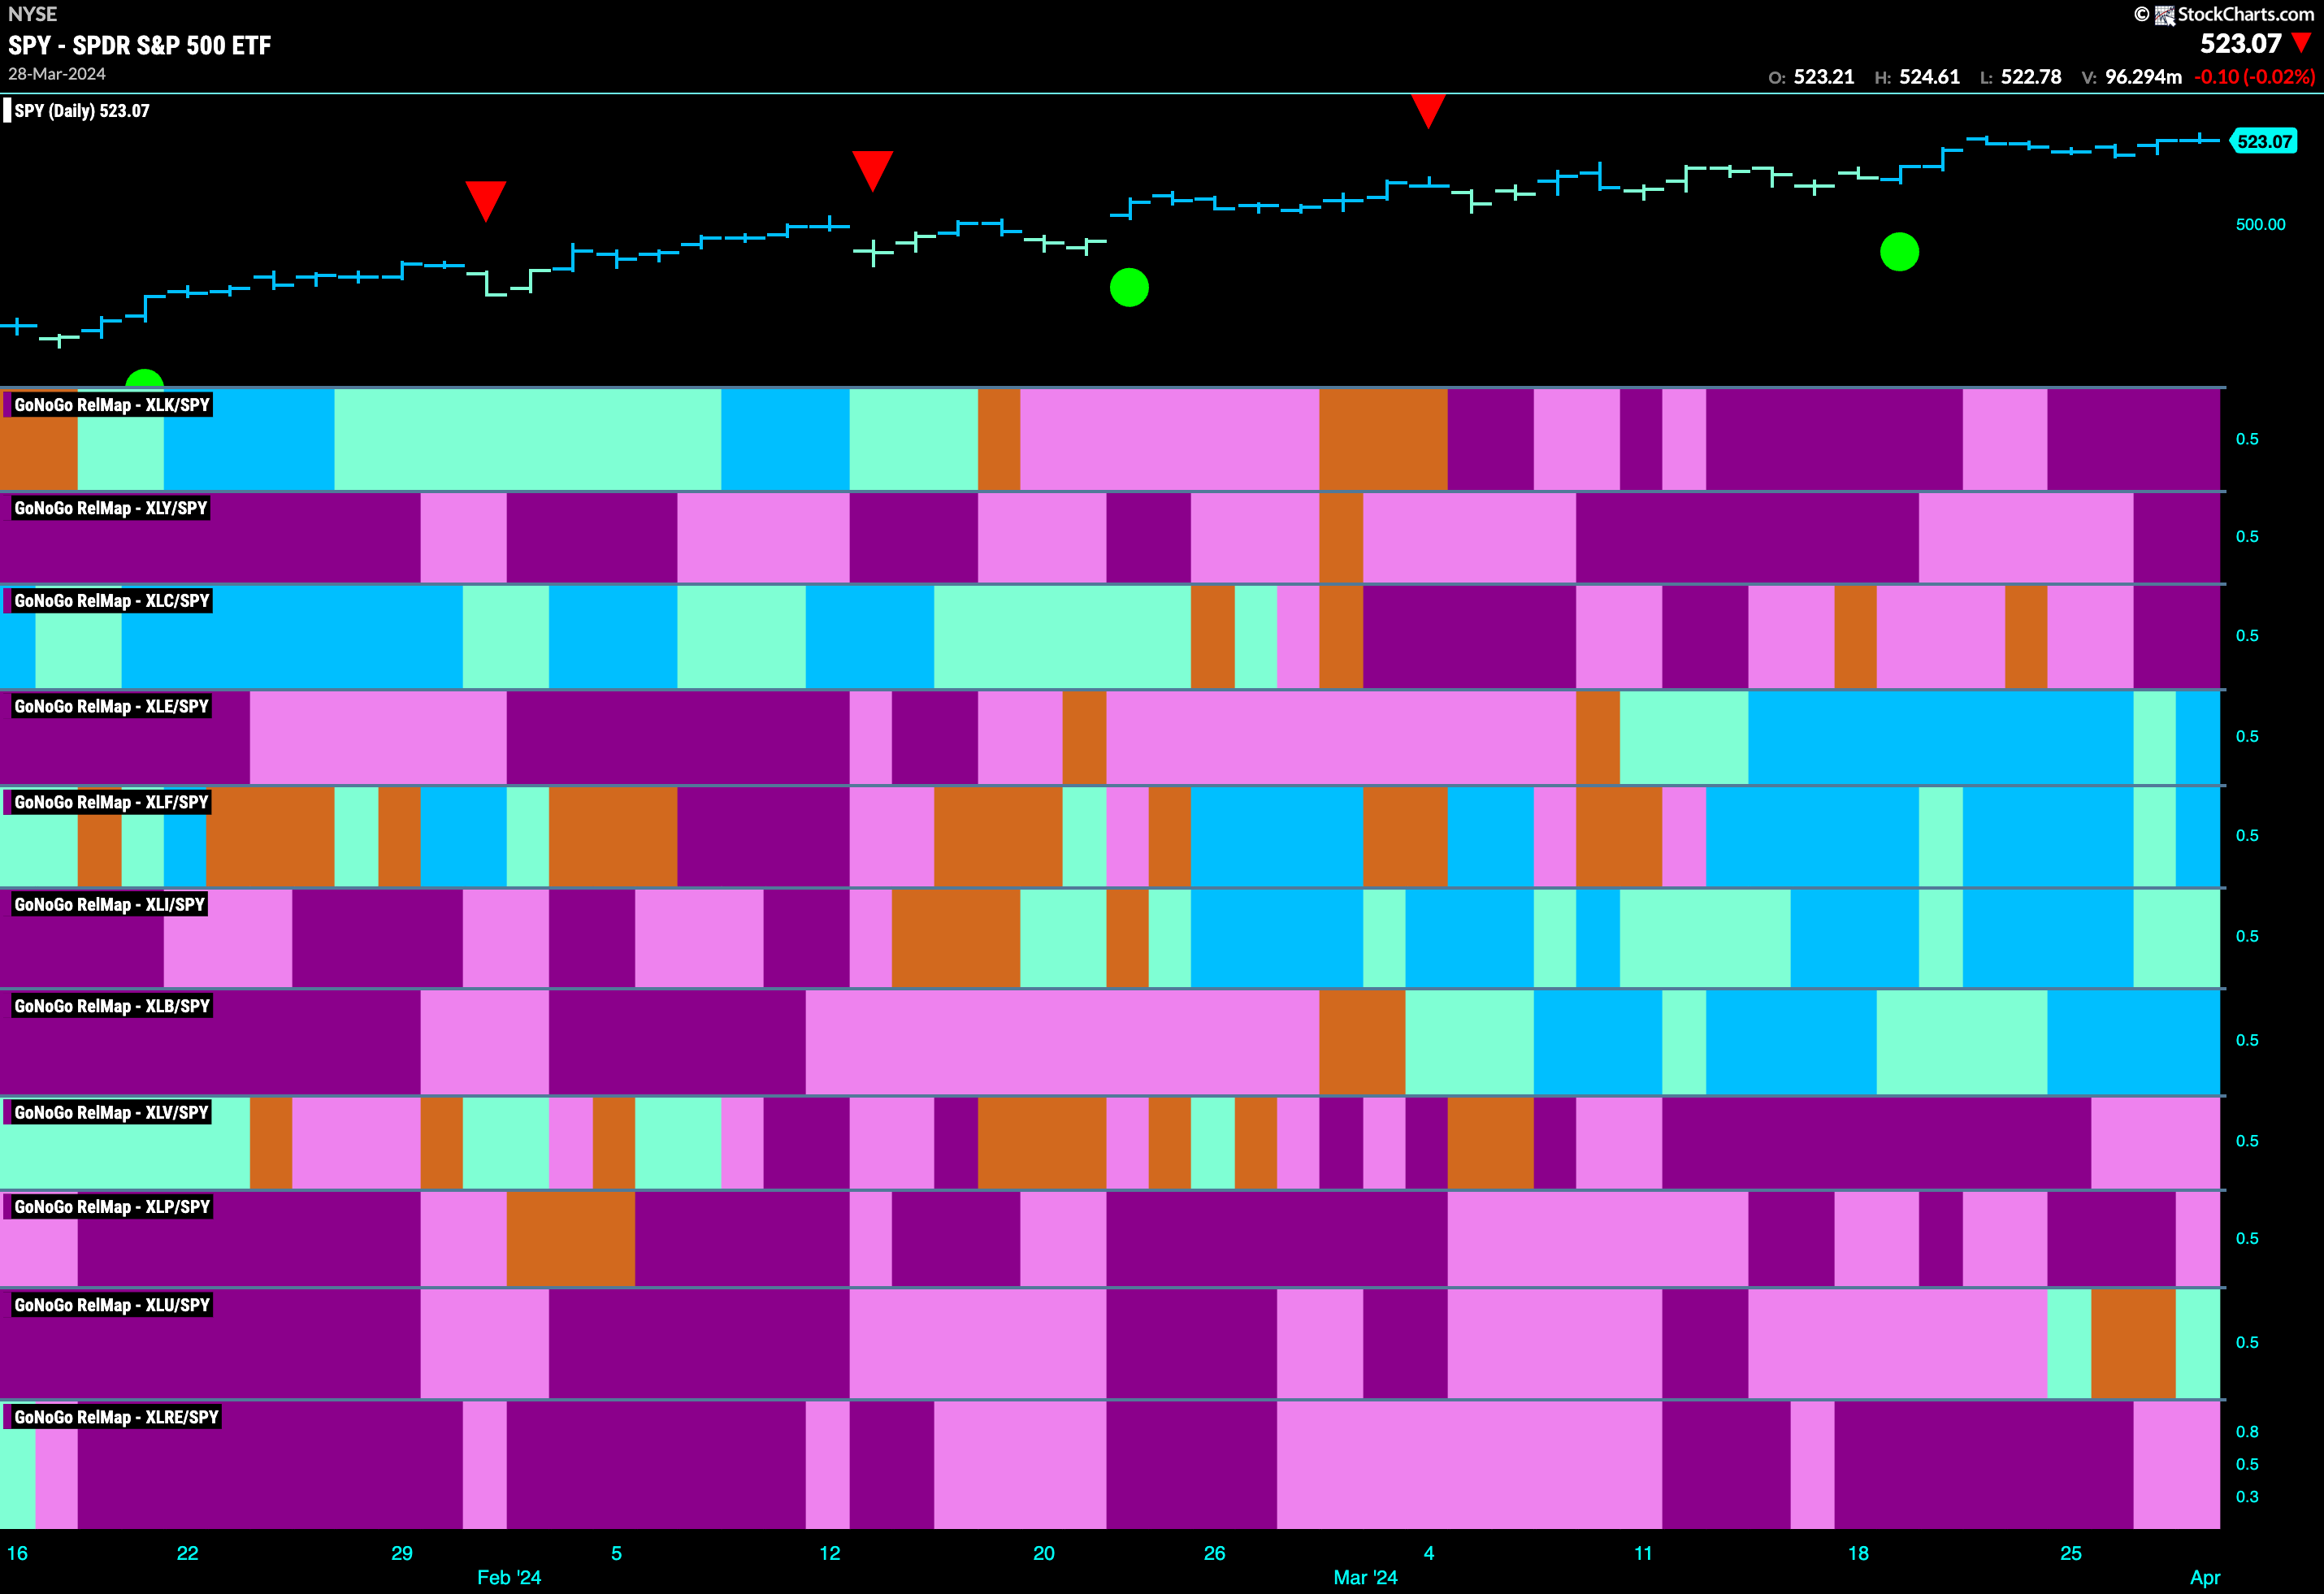
Below is the GoNoGo Sector RelMap. This GoNoGo RelMap applies the GoNoGo Trend to the relative strength ratios of the sectors to the base index. Looking at this map, we can quickly see where the relative outperformance is coming from as well as which sectors are lagging on a relative basis. 5 sectors are outperforming the base index this week. $XLE, $XLF, $XLI, $XLB, and $XLU are painting relative “Go” bars.
Financials Sub-Group RelMap
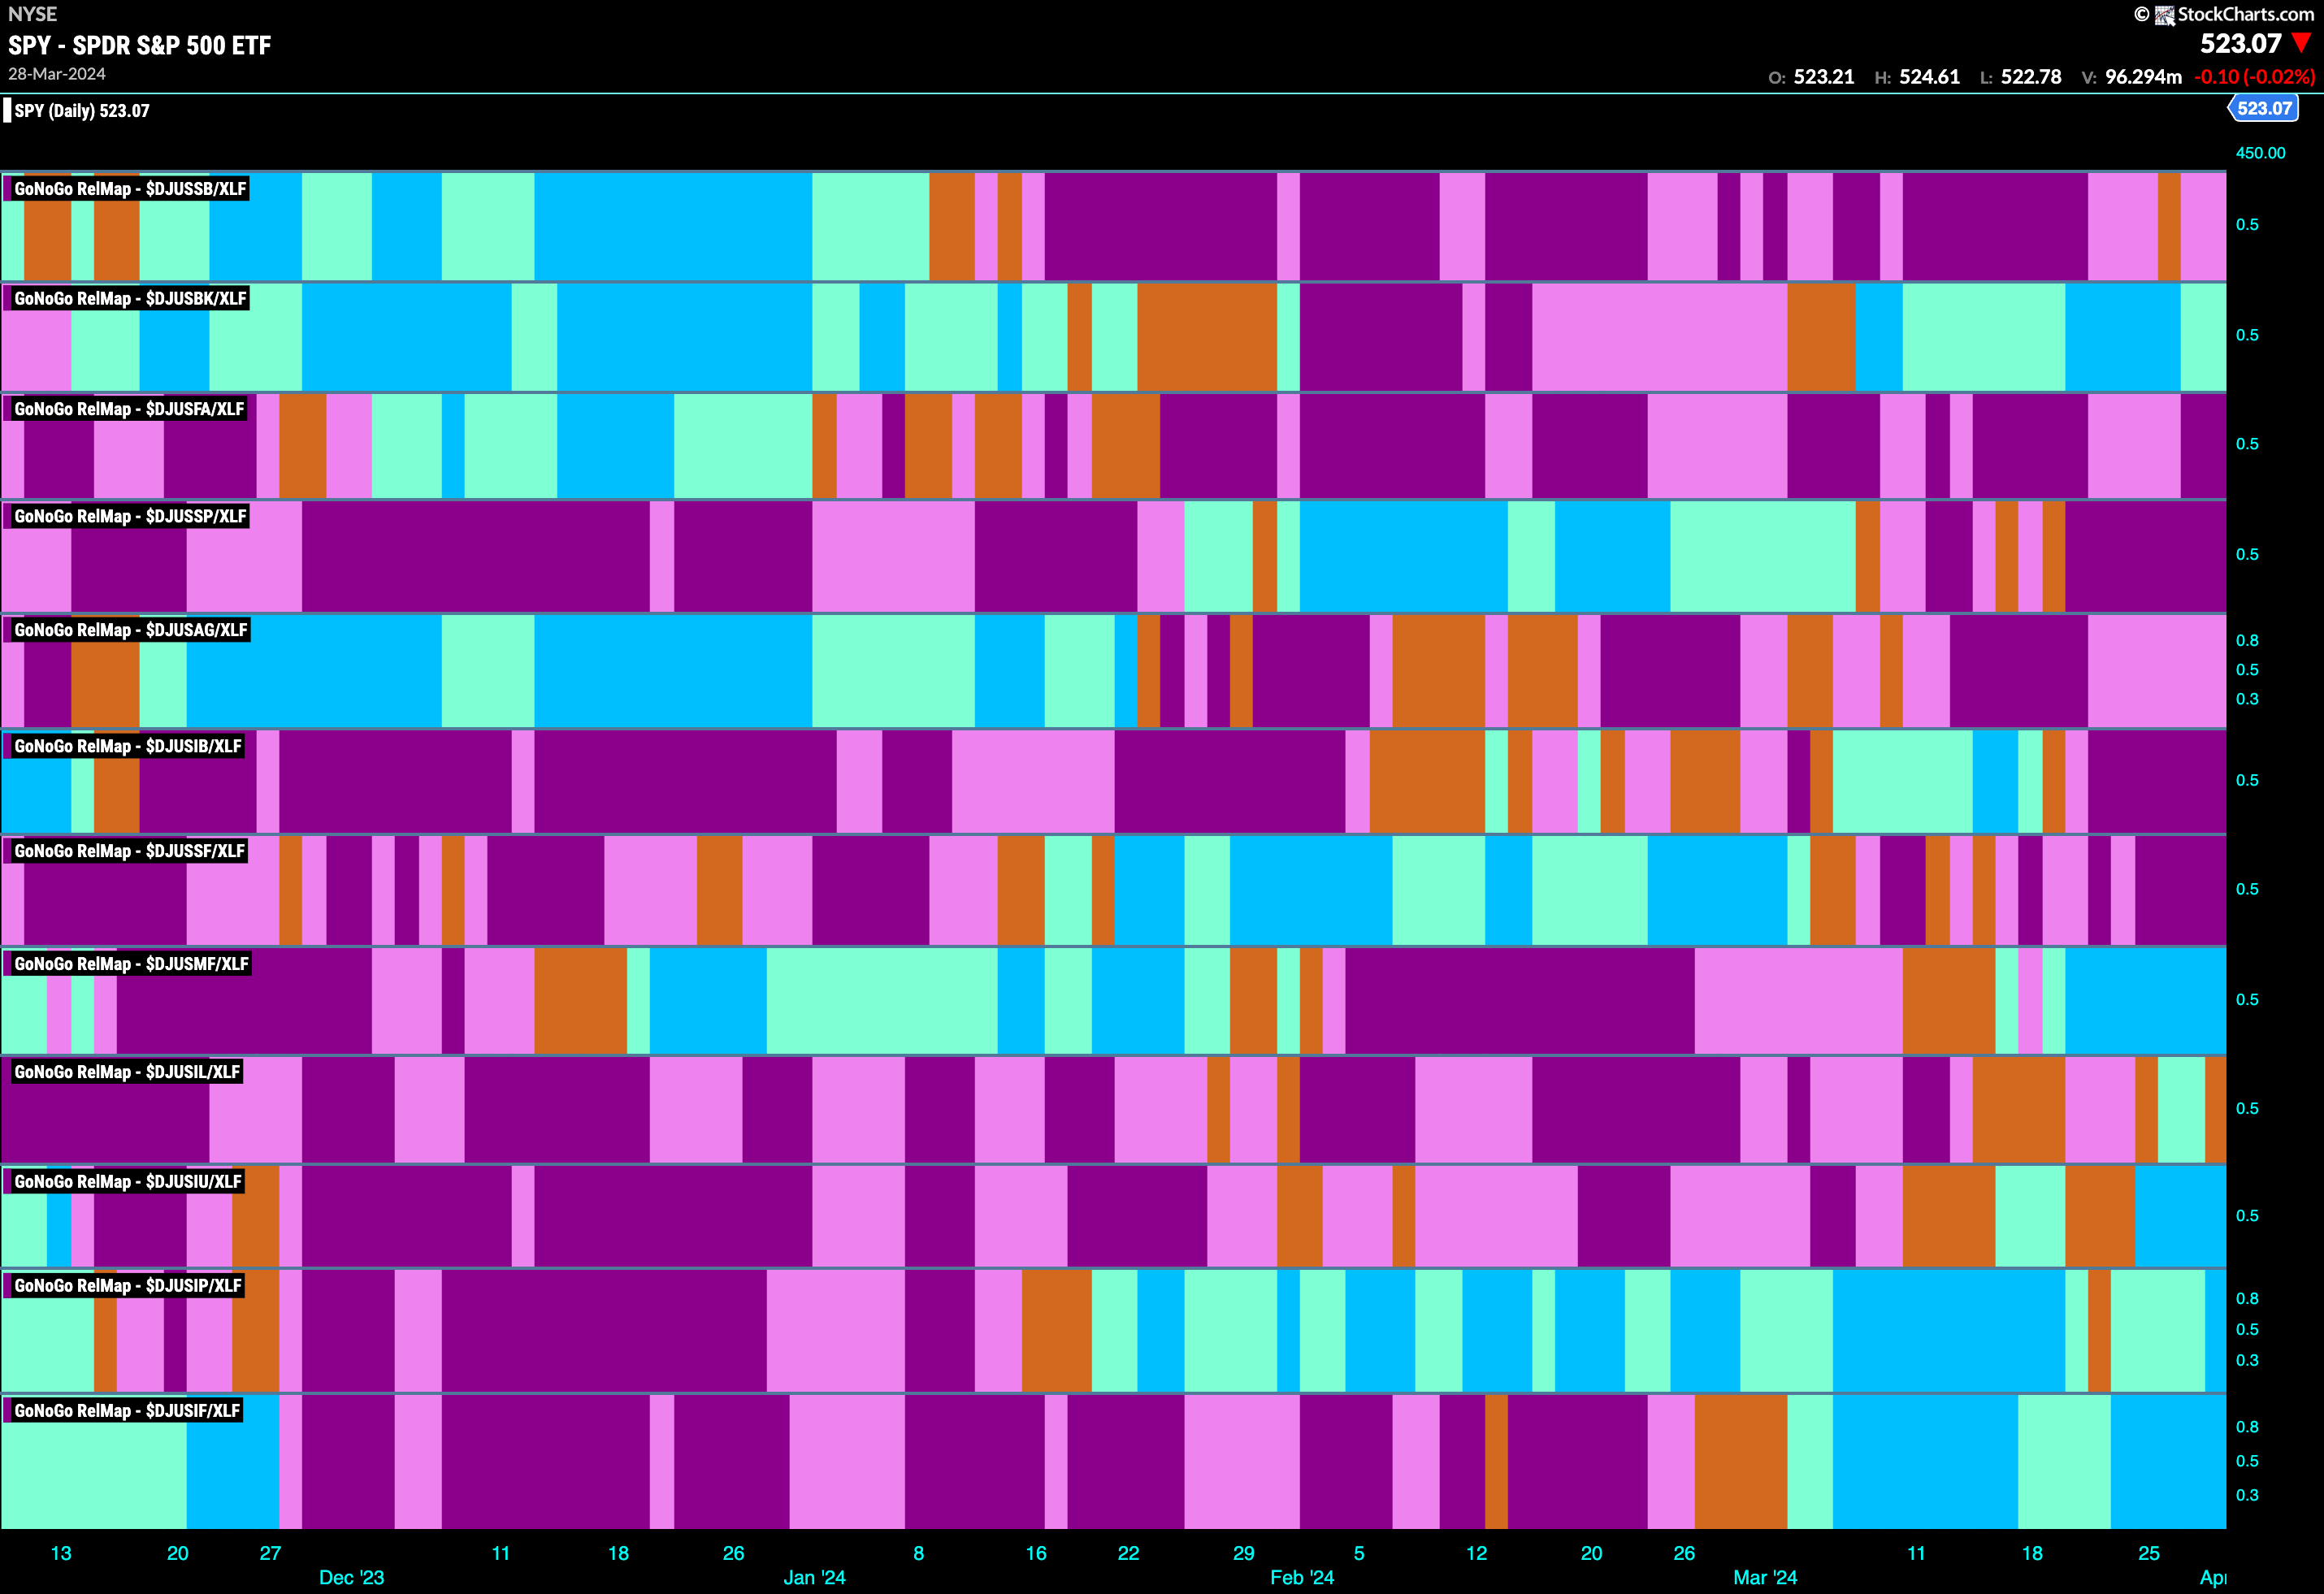
The GoNoGo Sector RelMap above shows that the financials sector continued to outperform the index as a whole this week. We took a look at this sector last week as well. This week we see strength emerging in the life insurance sub-group. The lowest panel of this map has regained its strong blue “Go” bars in its 3rd week in a relative “Go” trend. In hopes of fishing where the fishermen are, we’ll take a look at a few companies in this group.
Manulife Financial Corp Breaks to New Highs
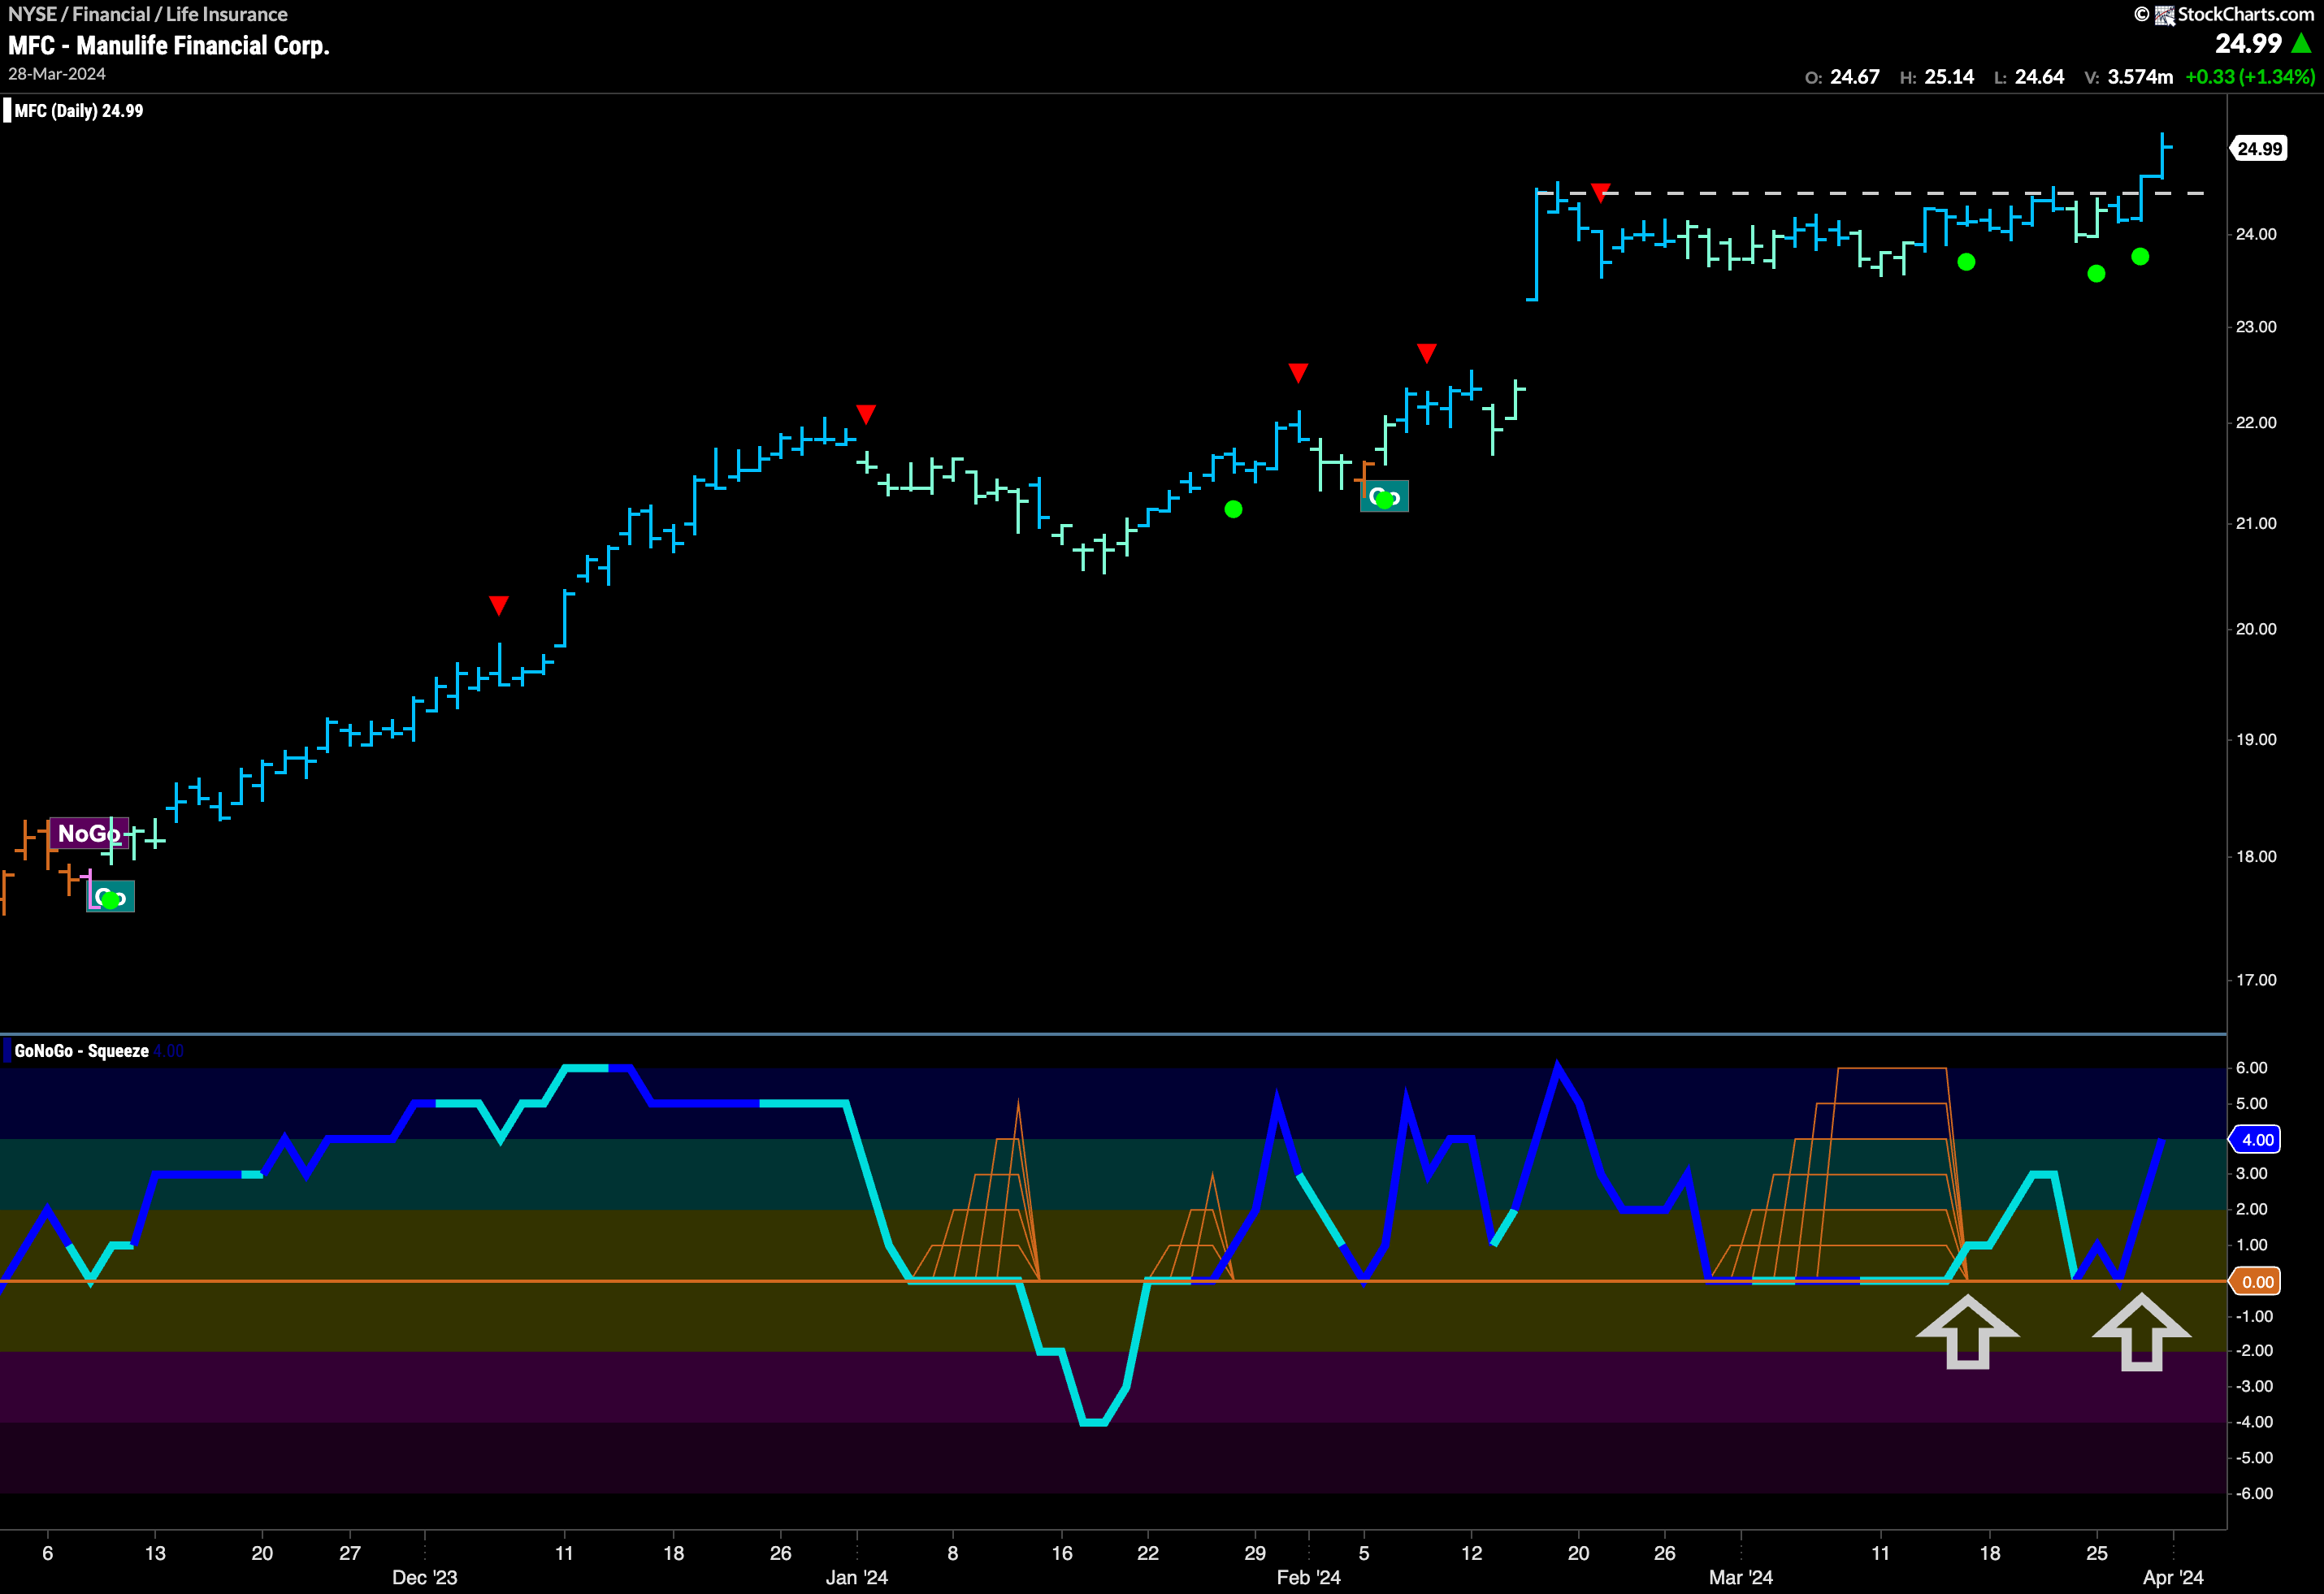
Below is the chart of $MFC and we can see that it has been in a “Go” trend for several months. However, after gapping higher in February, it has moved mostly sideways since. We saw a Go Countertrend Correction Icon (red arrow) at the beginning of the consolidation and since then we have seen several weaker aqua bars as prices failed to make higher highs. GoNoGo Oscillator fell to test the zero line during that time and found it hard to break free from that level and so a Max GoNoGo Squeeze formed. The Squeeze was broken into positive territory and that triggered a Go Trend Continuation Icon (green circle) under price as price ran up to test resistance several times. With the oscillator continuing to find support at zero we saw volume increase (dark blue oscillator) and with this continued support price was finally able to break to new highs. We will look for price to move higher from here with momentum surging in the direction of the “Go”t rend.
$EIG Sees Oscillator Regain Positive Territory
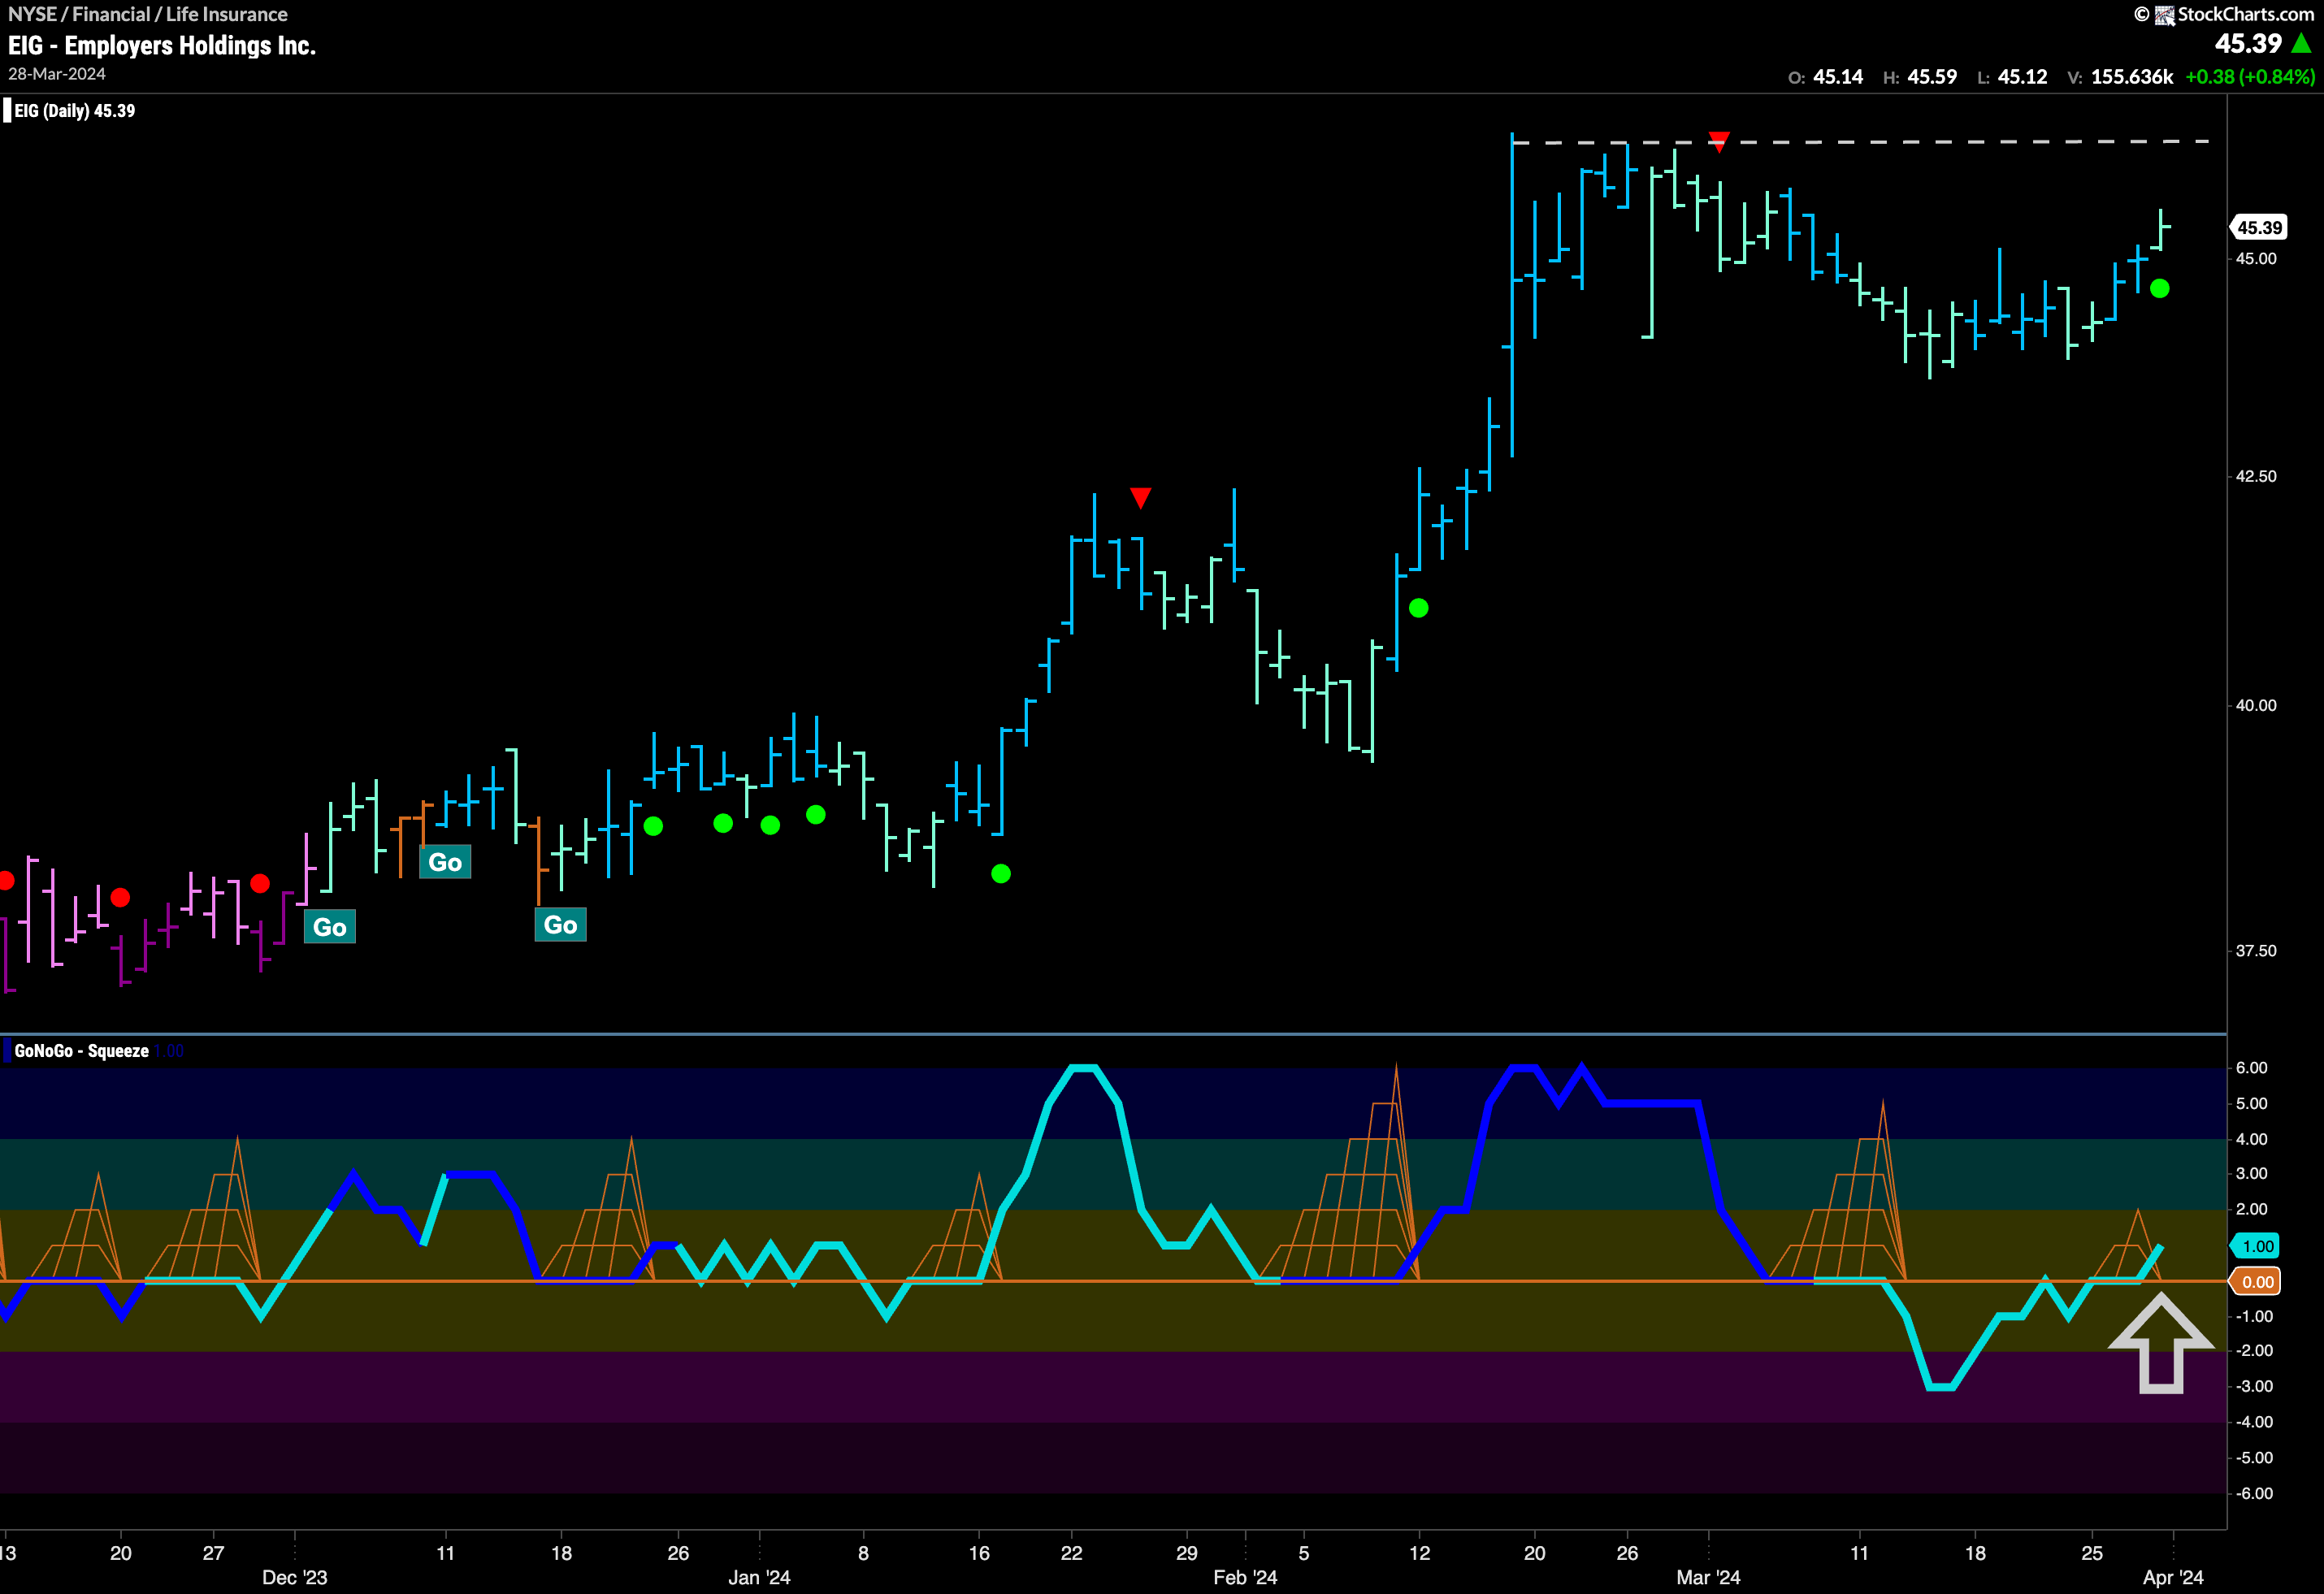
GoNoGo Trend shows that for $EIG the “Go” trend has been able to survive through a countertrend correction that was strong enough to push the GoNoGo Oscillator into negative territory. Even as the oscillator went negative, GoNoGo Trend was able to hang on to blue and aqua “Go” bars. Now, after climbing to test the zero line from below, GoNoGo Oscillator has broken back into positive territory. This tells us that momentum is now resurgent in the direction of the “Go” trend and we will look for price to move higher from here and test the resistance that we see on the chart from prior highs.
