
Good morning and welcome to this week’s Flight Path. Let’s take a look at the GoNoGo Asset map below. The strength we saw in equities stabilized last week as prices moved mostly sideways. Is this a new lower low or a more significant relief rally? Commodities look strong as they regained bright blue bars this week. The dollar is at an inflection point as we see a “Go Fish” bar to end the week. Will the dollar continue in its “Go” trend or is this the start of a longer correction?

Sector Performance
Below is the GoNoGo Sector Relmap. This GoNoGo Relmap applies the GoNoGo Trend to the relative strength ratios of the sectors to the base index. Looking at this map, we can quickly see where the relative outperformance is coming from as well as which sectors are lagging on a relative basis. As the week ended, the same three sectors maintained their relative “NoGo” trends. Technology, after a string of amber “Go Fish” bars, ended the week painting a pink “NoGo” bar on a relative basis to the broader index. Communications and discretionary finished the week in “NoGo” trends also painting pink bars. Energy and materials look strong on a relative basis but we are seeing more deterioration across the sectors. Industrials flipped between “Go Fish” and pale pink “NoGo” this week, and staples rolled over, painting strong purple “NoGo” bars.

$SPY Consolidates after Strong Rally
Below is the daily chart of $SPY. The “NoGo” remains in place as we see a string of pink bars. Is this a new low or the start of a larger move higher that could promise a return to “Go” colors. Offering some hope for the bulls, GoNoGo Oscillator is in positive territory but not yet overbought. Price action this week will determine if this is new lower low on an intermediate time frame. Pure price analysis would suggest a move above $420 would be a strong signal that the bulls are increasing in strength.

Dollar Dabbles with Trend Change
As the dollar continues to struggle, we see the first crack in GoNoGo Trend’s ability to maintain “Go” bars. After GoNoGo Oscillator broke below the zero line over a week ago, we wondered if GoNoGo Trend could hold. Now, with GoNoGo Oscillator still in negative territory but not oversold, we see an amber “Go Fish” bar painted by GoNoGo Trend. This is the first time since late February that $UUP has fallen out of its “Go” trend.

Treasury Rates back in Trend?
Rates corrected for a few weeks since the high we saw in May. The consolidation against the trend was enough to cause GoNoGo Trend to paint a string of amber “Go Fish” bars. Prior to that, GoNoGo Oscillator had also fallen below the zero line, tipping us off to the extended correction. Now, it appears that $TNX has resumed its “Go” trend. After a few aqua “Go” bars, we saw a strong “Go” bar to end the week and GoNoGo Oscillator is back at the zero line testing it from below. Should the oscillator regain positive territory then we would expect price to make an attack on prior highs. This could be a headwind for stocks in general.

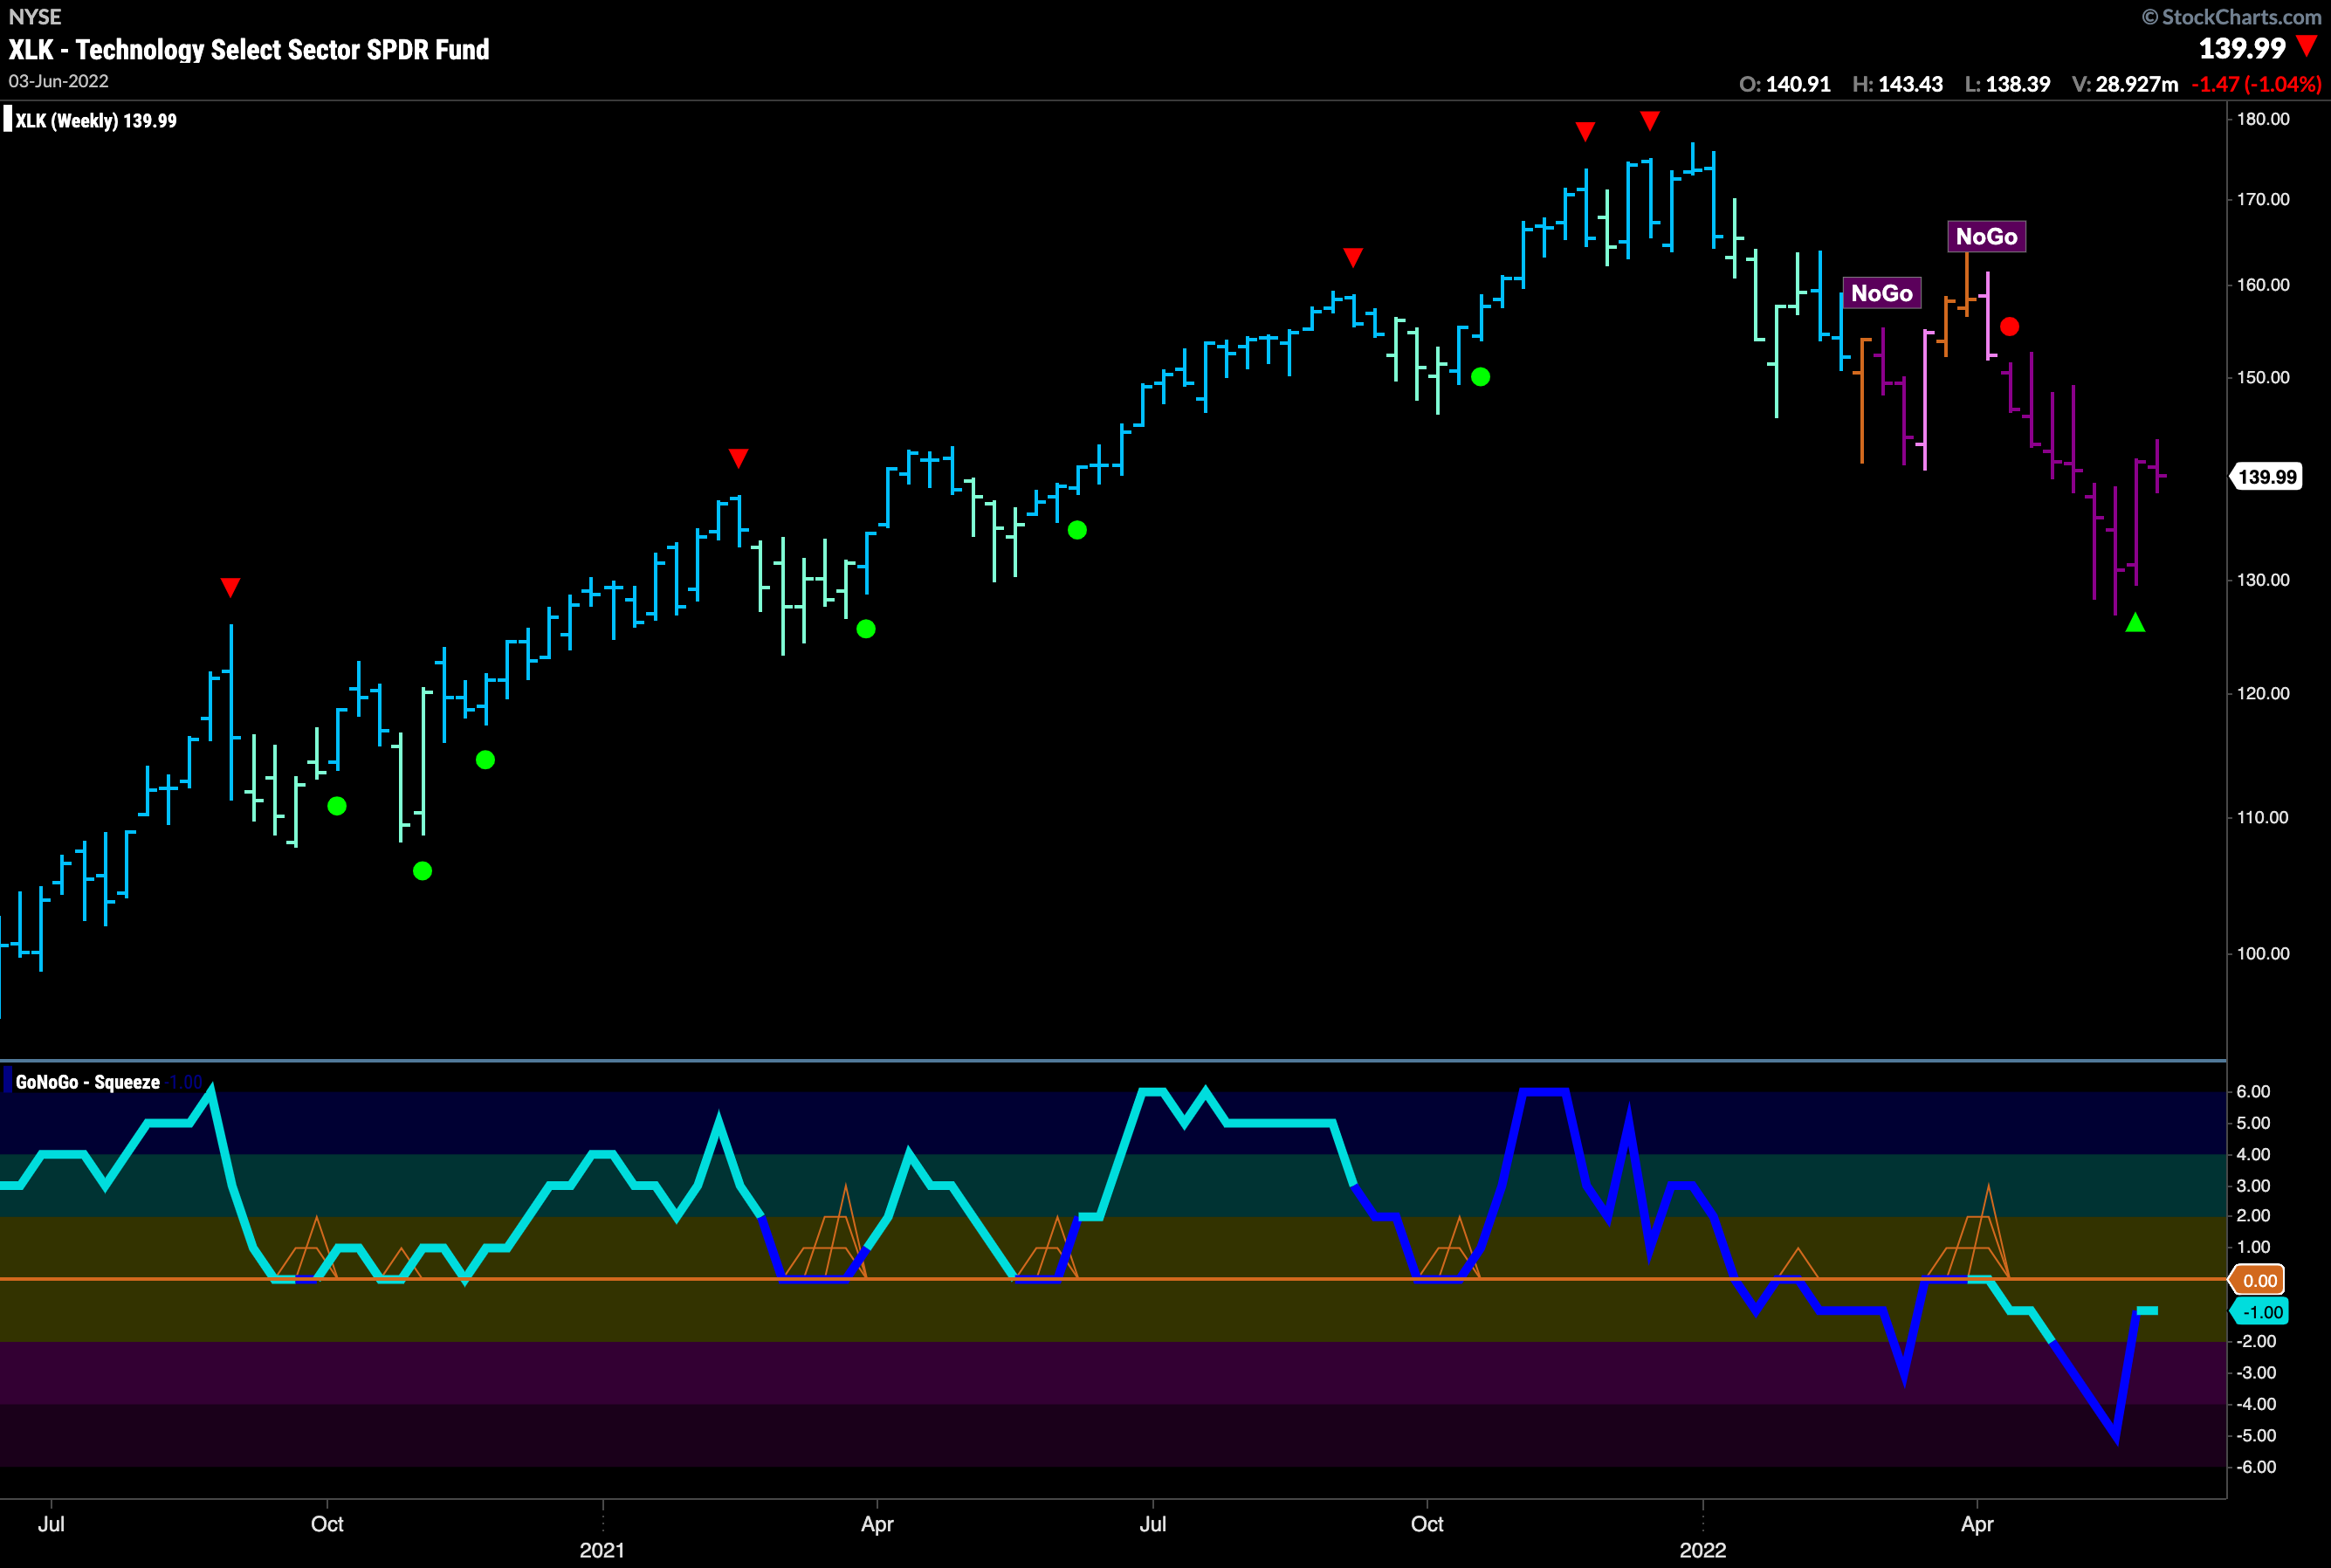
Technology Not There Yet
Multi time frame analysis suggests using a larger time frame chart to determine a market bias, and then stepping down in time frames to make trades. The chart below is the weekly GoNoGo Chart of $XLK, the technology sector. We can see that the trend is a strong “NoGo” with GoNoGo Oscillator in negative territory. As it stands, the weight of the evidence tells us that the environment is still bearish for technology stocks. That being the case, we should look at a lower time frame chart to assess trades.

On the daily chart, there are some similarities to the chart of $SPY that we saw above. This should be no surprise as the S&P 500 is dominated by mega cap tech stocks. If we are using the weekly chart to inform us that the larger trend is a “NoGo”, we can look for “NoGo” opportunities on the smaller time. frames until the charts tell us differently. Below, the daily trend is a weak “NoGo”, but GoNoGo Oscillator is above the zero line. For this NoGo trend to remain in place, and offer an opportunity to participate in it, we would like to see the oscillator back below zero.

Meta Platforms Remains in Strong NoGo
Meta is in a “NoGo” painting strong purple bars on the weekly chart below. GoNogo Oscillator has been finding resistance at the zero line since it crossed below in October of ’21. Now, on heavy volume, we see the oscillator rising to test the zero level again. If this trend is strong, we will expect the zero line to offer resistance again and price to roll over.

Having seen the strong “NoGo” on the weekly chart, let’s look at the daily chart to see if it will give us the chance to be early if the weekly trend persists. The daily chart below shows that $FB is painting amber “Go Fish” bars after having been in a predominantly “NoGo” trend since the beginning of the year. Currently, we see GoNoGo Oscillator riding the zero line and another GoNoGo Squeeze building. We will watch to see in which direction this resolves. If GoNoGo Oscillator falls into negative territory this would indicate that we will see another leg down within the larger time frame “NoGo”.

Materials to Move?
We saw on the GoNoGo Sector RelMap that materials was an out-performer relative to the broader index on daily bars. On a relative basis, the sector painted a strong blue “Go” bar to end the week. Below is the weekly GoNoGo Chart of $XLB, showing that we have been in a choppy range for just about a whole year. Over the last few months, GoNoGo Trend has been unable to maintain trend, flipping between Go, NoGo and amber Go Fish bars. As it stands, we are in a weak form “Go” trend, and GoNoGo Oscillator is at the zero line again. We have seen that it has struggled to move significantly from that level for some time. We will watch to see if the materials sector can gain enough momentum to get the oscillator back above zero and for price to challenge the highs of this range.

Homebuilders ETF Shows Signs of Renovation?
If the scenario described above on the weekly chart plays out for the materials sector, we could look for entry into any move higher using the daily chart of $XHB. This is the S&P Homebuilders ETF. We can see that after being in a strong “NoGo” since the start of the year, price has come off the floor enough to see GoNoGo Trend paint two aqua “Go” bars. GoNoGo Oscillator is in positive territory but not overbought. If price has formed a base, we would like to see it rally above $65 to be clear of potential resistance.

We Could Talk about Energy Again …
See below weekly chart of XLE…. its still going up.


