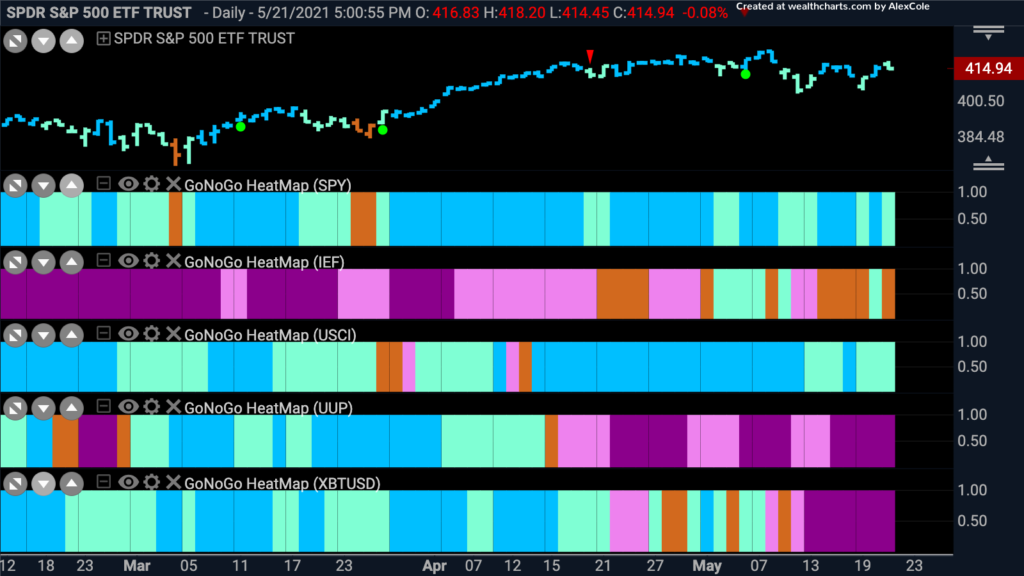
The dollar is truly struggling again, drowning in lower prices this week. As the GoNoGo Trend continues to paint strong purple “NoGo” bars, price set a lower near term low. At these levels it is testing the lows from early January. A weak dollar could add fuel to the fire of the super cycle bull market that the commodities bulls are telling us about. A weak dollar could also propel equities higher as the Fed continues to shy away from raising rate.
Investing isn't about beating others at their game. It's about controlling yourself at your own game – Benjamin Graham
“Sell in May and go away” – an old favorite; how has it worked out this year? With just a few days left, markets are indeed generally down on the month. The S&P 500 is down just over half a percent from the close of April, having set a new high early in the month. Although the economy continues to strengthen and company earnings are incredibly positive, perhaps a lot of this was already baked into equity prices.
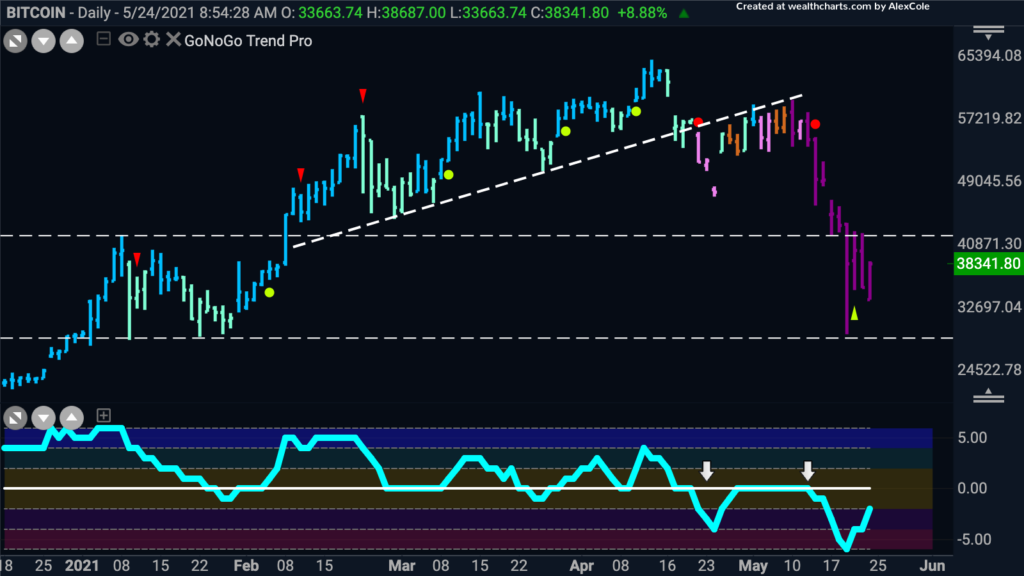
Cryptocurrencies; here to stay or going to zero? The volatility has been quite something to watch this week, but using traditional technical analysis to see how the market respected prior levels of support and resistance was fascinating and buyers showed themselves at around $30,000.
Welcome to your weekly Flight Path market review from GoNoGo Research.
Equities and Commodities continue to drive the markets
Take a look at the GoNoGo Heat Map below which offers a quick comparison of the major asset classes’ trends. You can see we’re still in a risk-on market generally speaking as equities and commodities are in Go trends while cash and bonds are generally in “NoGo” trends . Digital assets, below expressed using Bitcoin in the 5th panel have fallen sharply over the last few weeks and the NoGo trend has been represented by strong purple bars.
Cyclical Sectors… and even some Defensive
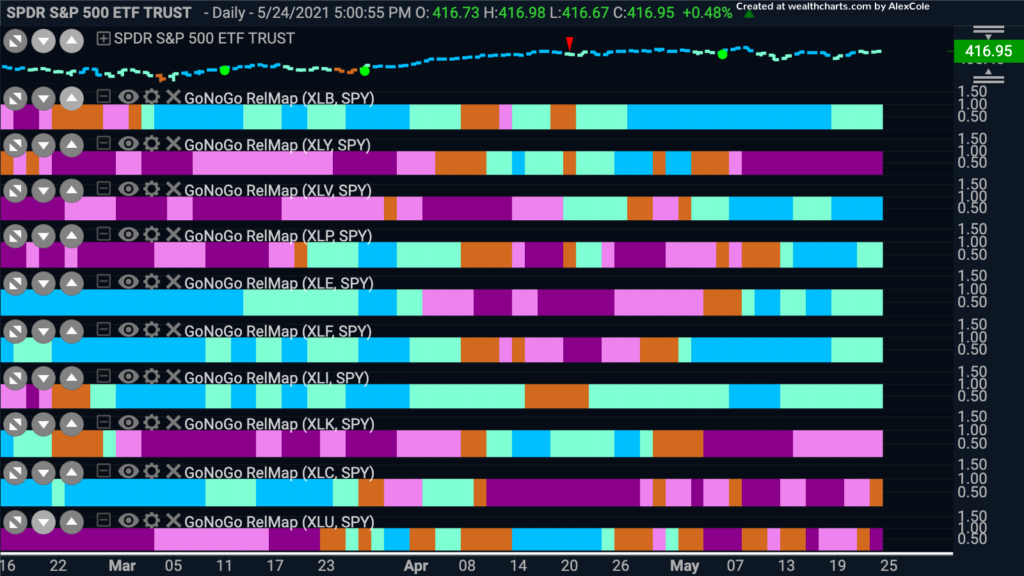
Are we sounding like a broken record yet? The sectors well positioned to take advantage of a reopening economy continue to outperform.
The GoNoGo RelMap below shows leaders and laggards relative to the broad S&P Index. Look at $XLB materials, $XLV healthcare, $XLP staples, $XLE energy, and $XLI industrials leading the way in blue “Go” trends.
Last years leaders are this years laggards, almost like the concept of polarity where support becomes resistance and resistance becomes support and so we see $XLK technology, $XLY discretionary, and $XLC communications countering the cyclical Go trends with NoGo bars.
Healthcare Trying to Head Higher
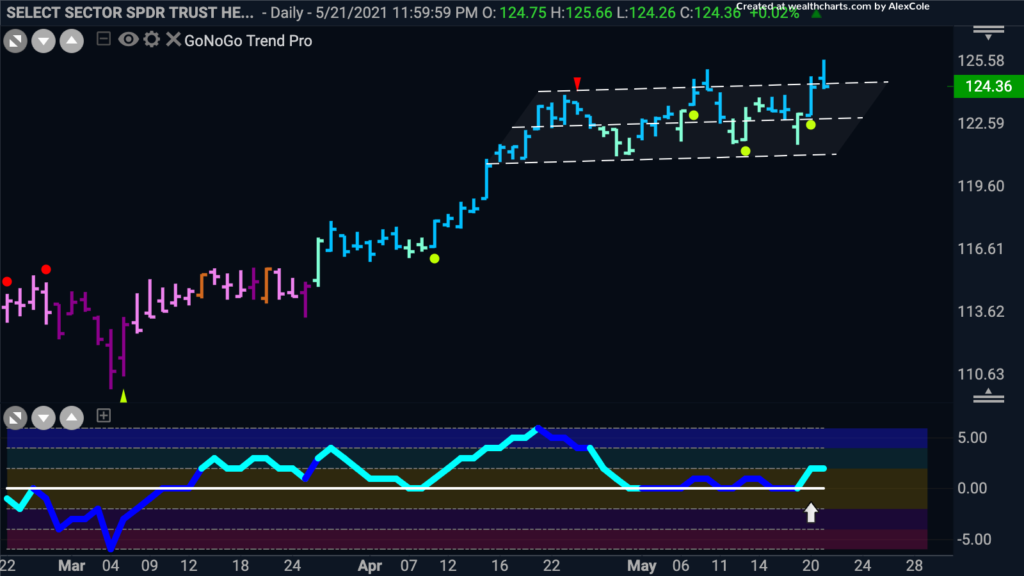
With an ever growing number of adults and now children getting vaccinated, it makes sense that the healthcare sector $XLV is outperforming the broader index. Below is a GoNoGo chart of daily prices for $XLV.
- The Go trend that has been in place since March is still looking healthy with GoNoGo Trend painting bright blue bars
- Price is at the upper bound of a channel and trying to break out higher
- Toward the right side of this consolidation we have started to see Go trend continuation green circles. This means that the GoNoGo Oscillator is finding support at zero
- This time, as price attacks the upper bound, the oscillator is moving into positive territory
$ALGN Well Aligned for Gains?
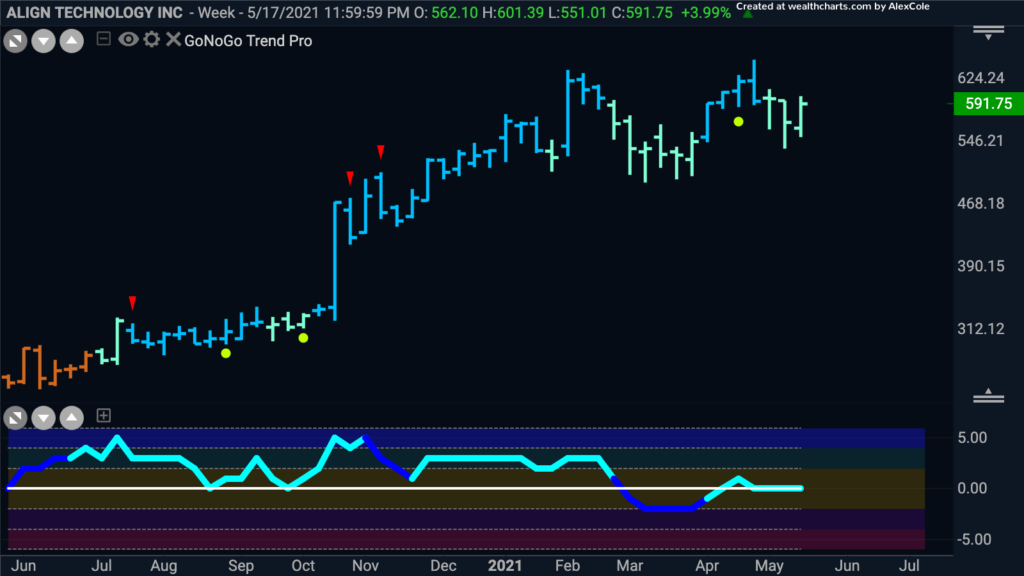
Align Technology Inc is a medical device company, and Invisalign is one of its products. Below is the weekly GoNoGo chart.
- The Go trend is in place on this longer timeframe, with the GoNoGo Trend painting aqua go bars for the past few weeks as prices consolidate
- As price sets a higher low, the GoNoGo Oscillator is riding the zero line
- If we are to see an attack on prior highs, the oscillator will need to rally into positive territory
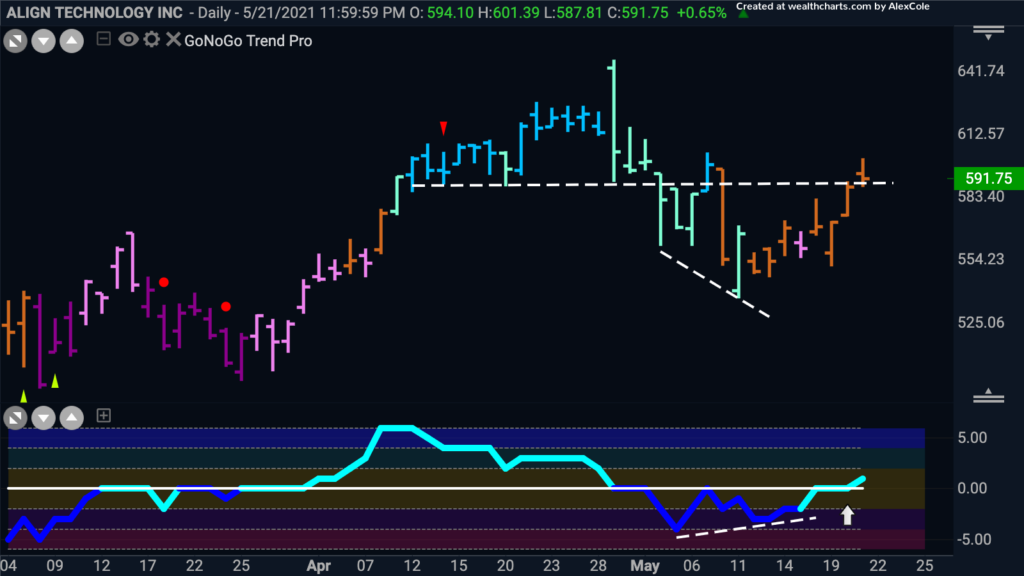
On the daily GoNoGo chart, we will look for signs to enter the longer term trend.
- After pulling back from the highs of end of April GoNoGo Trend was unable to paint Go bars and started painting amber, neutral “Go Fish” bars
- The GoNoGo Oscillator has shown bullish divergence from price as price made a lower low but the oscillator didn’t confirm
- The GoNoGo Oscillator ended the week by breaking back into positive territory which is a sign that there may be enough momentum to push the GoNoGo Trend back to a Go
- If that happens, look for price to test prior highs
Can Energy Power Past Resistance
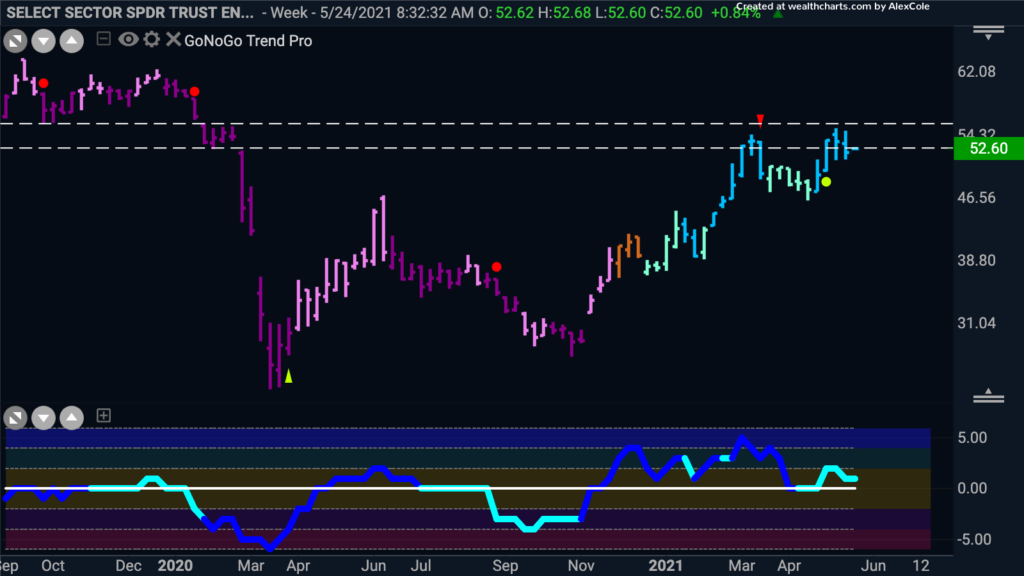
The energy sector continues to lead the market on a relative basis as we saw from the Sector RelMap, but are there any hurdles we need to be aware of from a technical perspective
- The weekly “Go” trend is strong, with GoNoGo Trend painting bright blue bars
- We do see a potential range of resistance on the chart, prior areas of support that have become resistance
- The GoNoGo Oscillator has found support at zero already and so we will look to see if there is enough positive momentum to get price higher
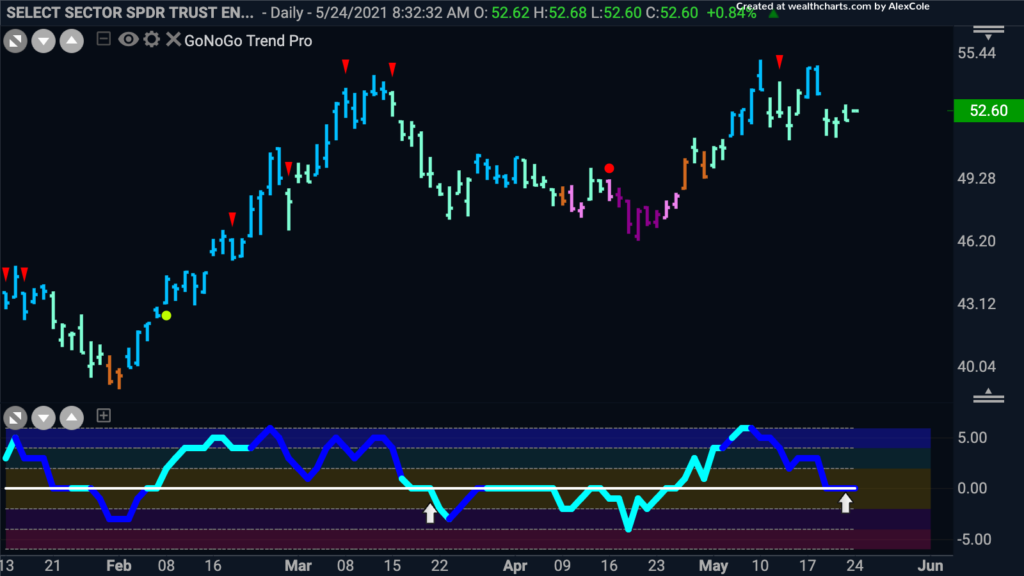
Drilling down into a daily GoNoGo Chart we see trend conditions are still favorable.
- GoNoGo “Go” trend is in place but currently painting weaker aqua bars
- This consolidation has caused the GoNoGo Oscillator to fall to zero where it is currently finding support
- If the GoNoGo Oscillator can rally into positive territory that would trigger a Go Trend Continuation icon to appear under the price bar
Valvoline VaVoom?
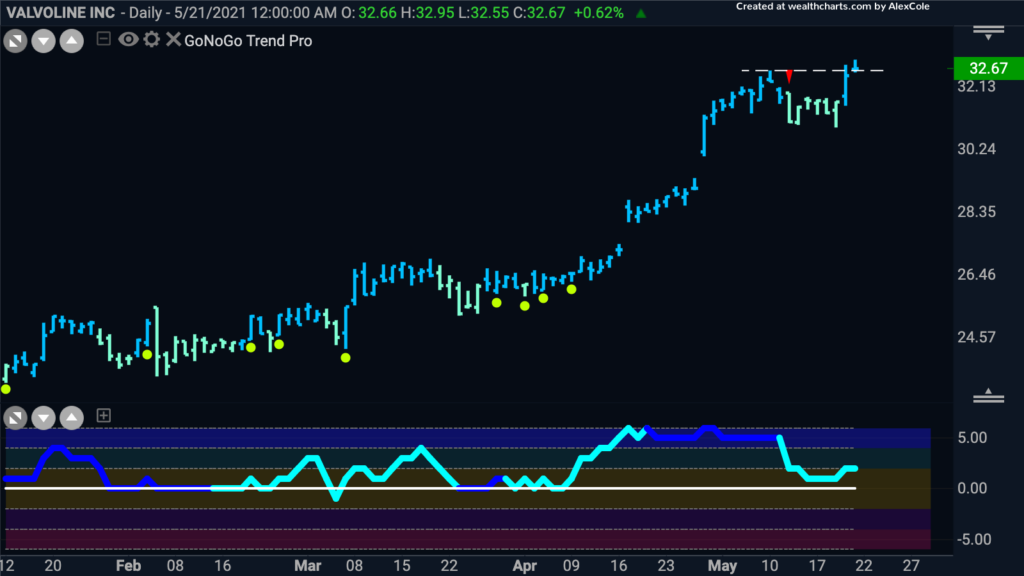
If we are to stay the course with energy, let’s take a look at Valvoline Inc and get a read on the technical environment. The GoNoGo Chart below shows daily prices for $VVV.
- What a Go trend this has been. GoNoGo Trend continues to paint bright blue bars as price sets a new higher high
- We would like to see price consolidate above this resistance level from prior high in order for it to surge once more
- GoNoGo Oscillator fell close to zero but has risen again into positive territory but is not yet overbought and perhaps therefore price has room to run
Bye Bye Bitcoin?
After a week like we had, we have to look at the GoNoGo chart of the world’s largest digital asset. Incredible volatility saw price fall to $30,000 then back up to $38,000 in one session. Is this the end for the crypto or are we seeing a shake out that will set a base for more gains?
- The GoNoGo Trend is a NoGo painting strong purple bars throughout the week on the daily chart
- The GoNoGo Oscillator was turned away by the zero line tipping us off to the sharp correction
- The precise way support was found at the lows from early in the year was amazing to see, showing a lot of buyers at those levels
- We are certainly not out of the woods yet though, with the GoNoGo Trend a strong NoGo and the GoNoGo Oscillator below zero. Price would need to clear the resistance at around $40,000. If price can do that, we’d likely see the GoNoGo Oscillator breaking above zero and the NoGo Trend threatened
