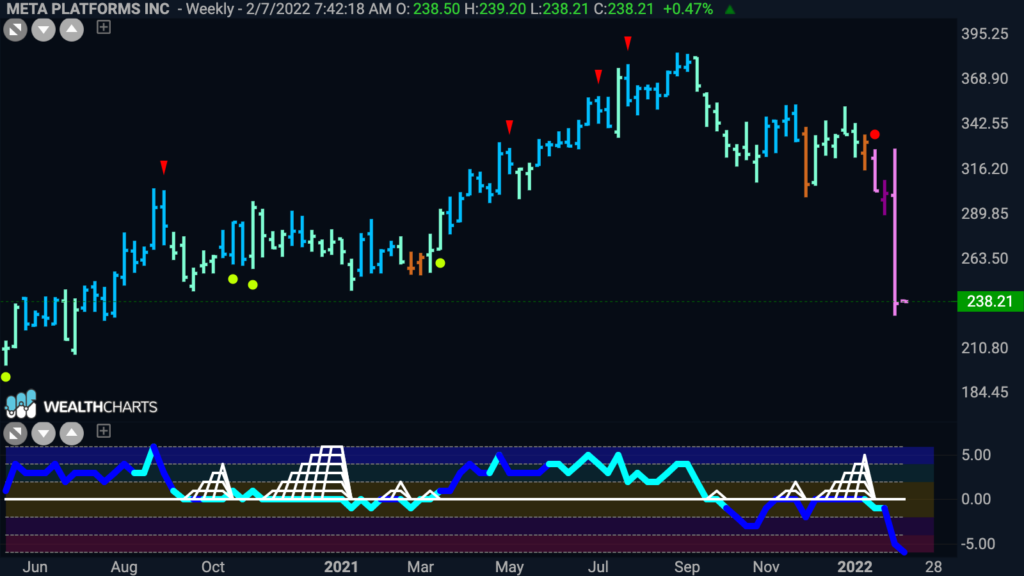
Good morning and welcome to this week’s Flight Path. Let’s take a look at the below GoNoGo Asset Map for this week. Equities rallied hard into the middle of the week but then fell away on Thursday and Friday. We can see that the week ended with GoNoGo Trend painting weaker pink “NoGo” bars. Treasury prices have continued in the strong “NoGo” setting lower lows this week. As has been the case for a while now, commodities represent the strongest “Go” market, with energy and oil leading the charge. The dollar’s quick foray into “Go” territory didn’t last and while Bitcoin had a strong end to the week GoNoGo Trend is still painting pink “NoGo” bars.
Sector Leadership
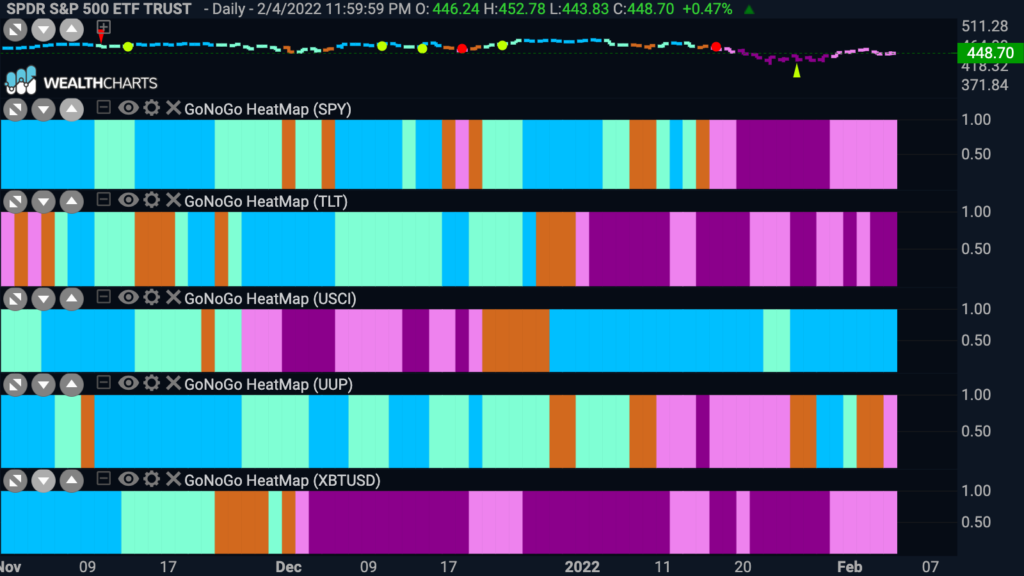
As we have noted over the past few weeks, the strength is to be found in the cyclical sectors as the rotation away from growth into value continues to hold. Looking at the GoNoGo Sector RelMap below, we see that the middle area of the map remains where the “Go” trends are. Certainly, until the weight of the evidence changes, value and defensive sectors are the outperformers. Healthcare, staples, energy, financials and utilities are in relative “Go” trends to end this week.
Fancy Financials?
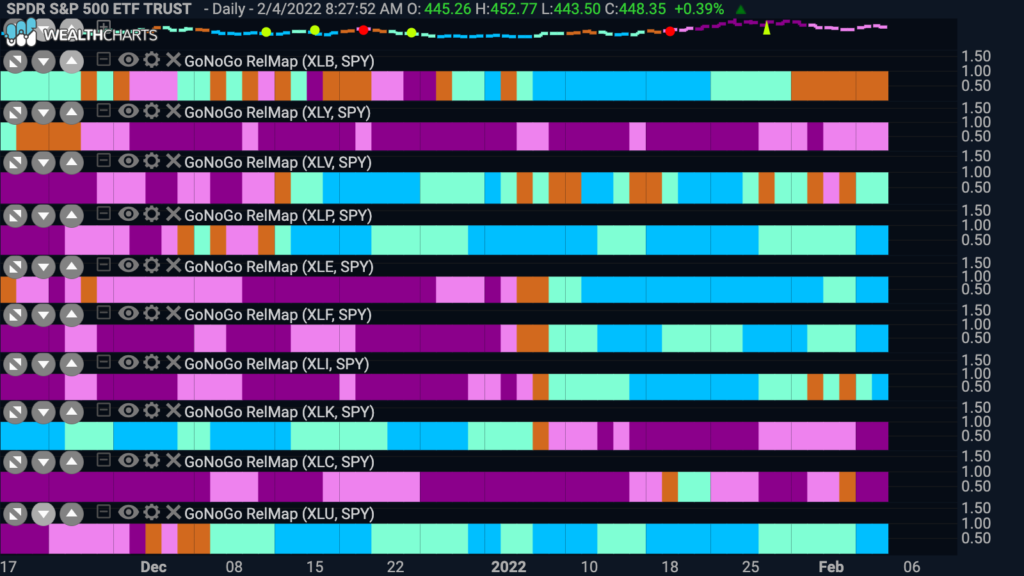
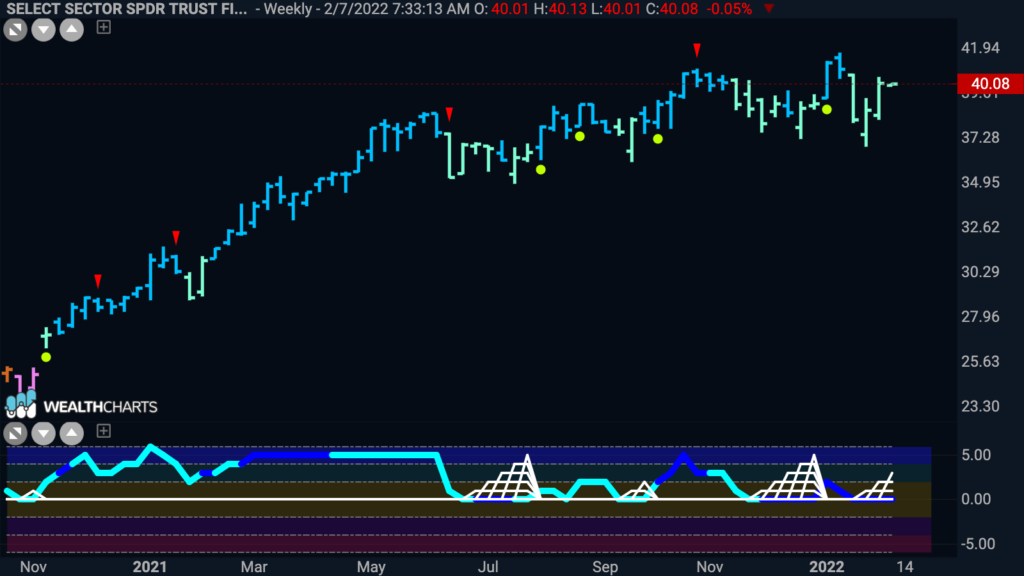
Historically, a rising rate environment can favor financial stocks. If we take a look at the GoNoGo Chart of the financials sector by way of $XLF, we can see that $XLF is already in a pale aqua “Go”, whereas $SPY is in a pink “NoGo”. GoNoGo Oscillator is riding the zero line as a GoNoGo Squeeze builds and so we will be watching to see if momentum can break out of the squeeze to the upside to lend a hand to the weak “Go” trend.
If we want to look at the larger picture, we can view the weekly GoNoGo Chart below. The long term trend is a “Go” albeit painting weaker aqua “Go” bars. Throughout the “Go” trend that has been in place for over a year we have seen that the GoNoGo Oscillator has been able to find support at the zero line as price has crept higher. We are at the zero line again, and a GoNoGo Squeeze is starting to build. We must note that we see bearish divergence as GoNoGo Oscillator is making lower highs while price recently put in a higher high. It looks like an important moment for the financial sector.
Banking on $BAC
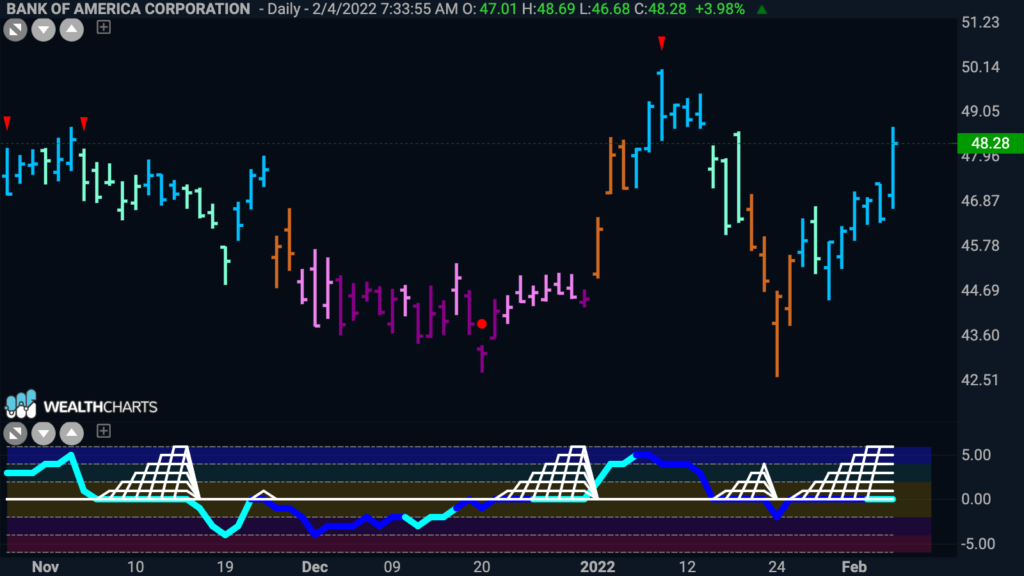
Within the financial sector there are of course securities that could offer opportunities. The below GoNoGo chart shows Bank of America and we can see that despite some chop price is in a “Go” trend. GoNoGo Oscillator is riding the zero line as we see a max GoNoGo Squeeze. If the oscillator can break out of the squeeze into positive territory we could look for an attack on the prior high.
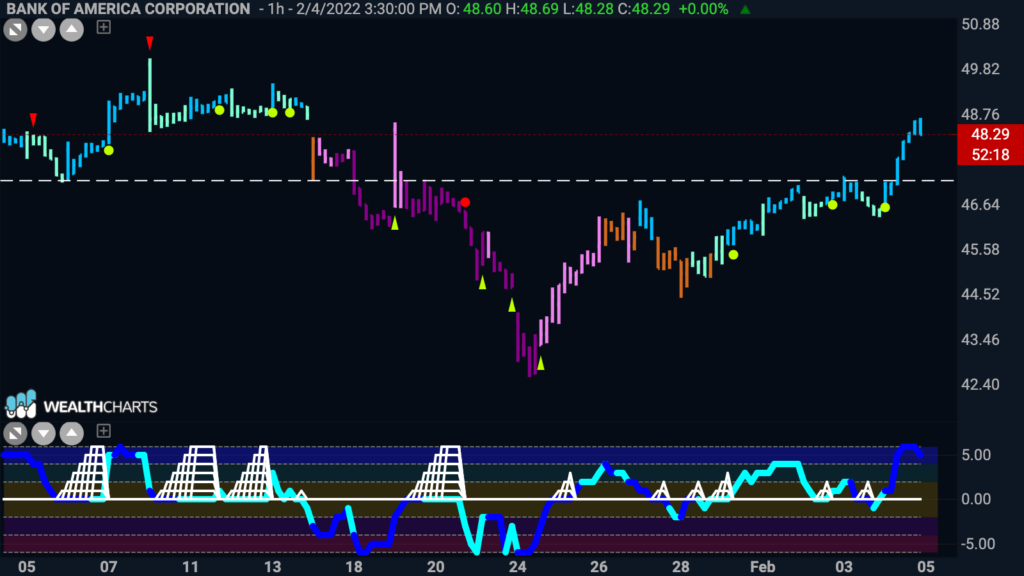
Stepping down a timeframe, we can see a very interesting pattern formation on the 60 minute chart. Recently, a “Go” trend was identified and confirmed by GoNoGo Oscillator breaking above the zero line and then finding support. We see several Go Trend Continuation icons under the price bars as the “Go” trend persisted. A few bars ago, price broke above levels that have been resistance in February and much of January but was also support early in the year. This is the concept of polarity playing out in front of us. A first target from this break would be the high at around $50. Price could go higher than that if we use a measured move from the low of the pattern, perhaps as high as $51.75.
Energy Extends Gains or Over Extended?
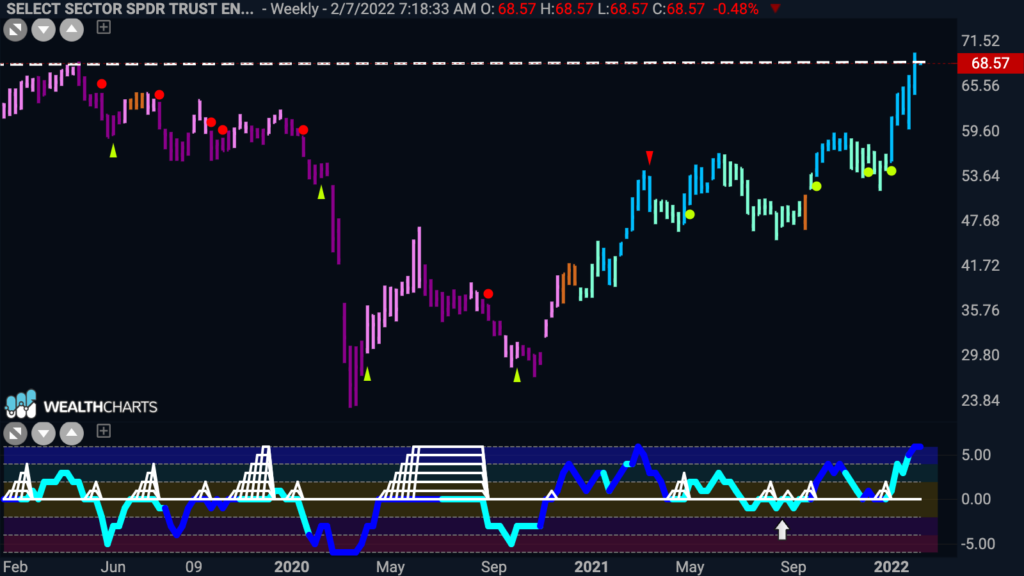
The energy sector has been a driver of alpha in the equity markets now for several months. The weekly GoNoGo Chart below shows the strong “Go” trend in place as prices raced higher over the past month as volatility in the overall equity markets couldn’t slow the sector down. The beginning of the year saw prices surge higher after a Go Trend Continuation green circle as GoNoGo Oscillator again found support at the zero line. We are now bumping up against multi year highs and so we will watch closely, especially as GoNoGo Oscillator is at overbought extremes. If the oscillator falls lower we will see a Go Countertrend Correction Arrow appear above the price bar which could tempt us to be cautious.
It’s a Marathon Not a Sprint!
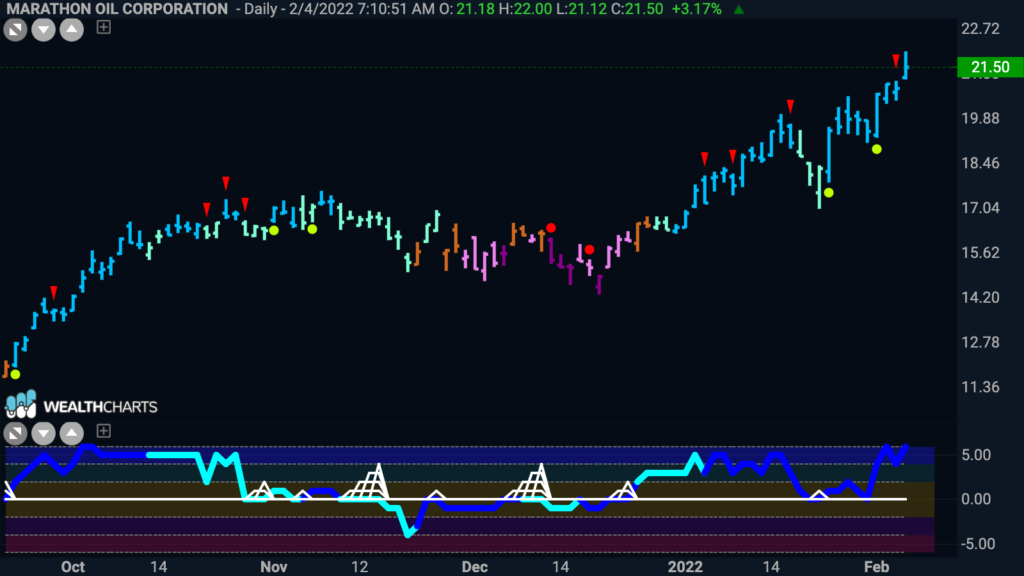
Tell that to energy stocks that have continued to race higher this week! We have been talking about Marathon oil at conferences over the last several weeks as we saw Go Trend Continuation green circles appear with this latest “Go” trend. Currently, the trend is painting strong blue “Go” bars as we hit new highs. In the short term we may be wary, as GoNoGo Oscillator is at overbought extremes. But remember, overbought (especially on heavy volume as below) in a “Go” trend is not a bad thing! It is a representation of enthusiasm in the markets.
Devon Energy
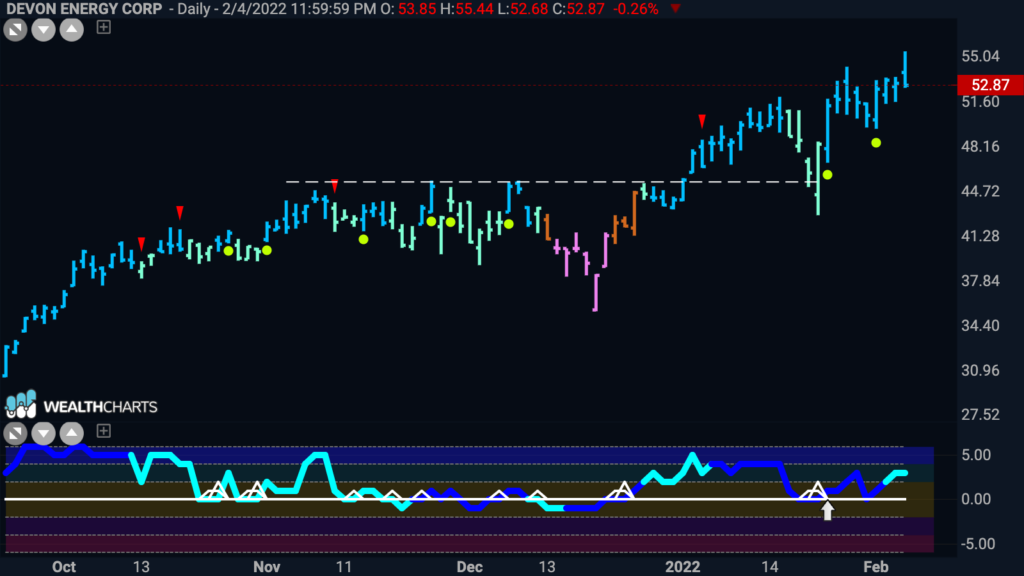
At the end of January we noted that if the rotation into cyclicals was to continue based on macro factors such as a rising rate environment we could turn to energy stocks to perhaps weather the inflation storm better than most. We looked at $DVN to see if GoNoGo Oscillator could find support at zero and if price could put in a higher low at levels that were previously resistance. The chart playing out the way it did bodes well for this thesis over time. The trend is a strong “Go” with price painting bright blue bars and GoNoGo Oscillator is currently in positive territory but not yet overbought. It could be that there is room to run.
What’s the Meta with Facebook? When Facebook Meta “NoGo”!
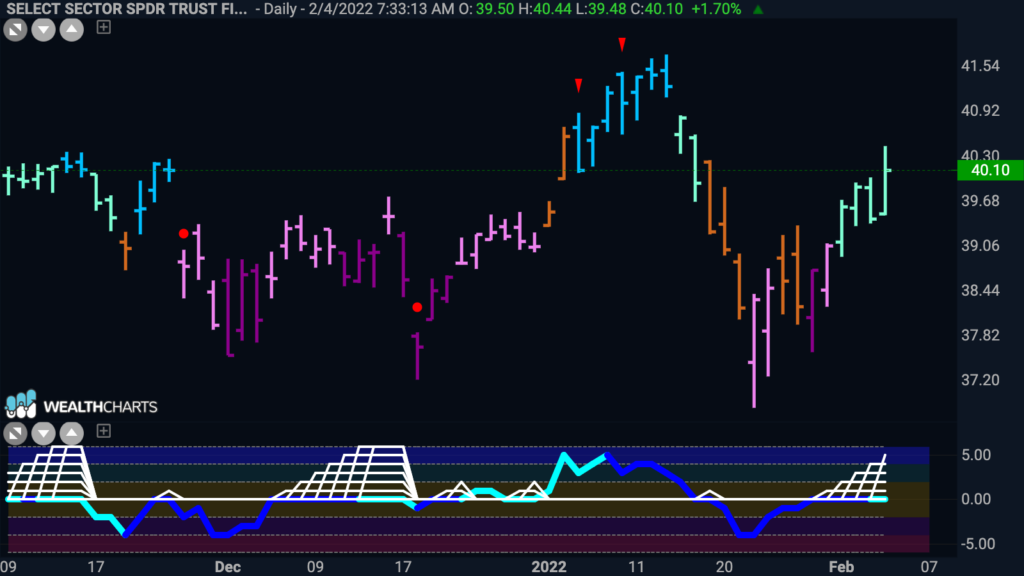
We could go on, but we’d be remiss if we didn’t comment on Facebooks rough week. The stock saw a 26% drop on February 3rd losing 232 billion dollars in market cap in one day, the largest such drop in history. If we try to zoom out and not be completely reactionary, we can see that things don’t look good on a longer term chart either. The GoNoGo weekly chart below shows that $FB is now in a “NoGo” on a weekly basis and has been for 3 bars. Back in October of last year, we saw the GoNoGo Oscillator unable to find support at the zero line which preceded GoNoGo Trend’s inability to paint continuous “Go” bars. We saw amber “Go Fish” bars creep in before the trend turned to “NoGo”. Given the cyclical rotation away from mega cap growth names we certainly would be looking at “NoGo” opportunities for several tech names, Meta included.
