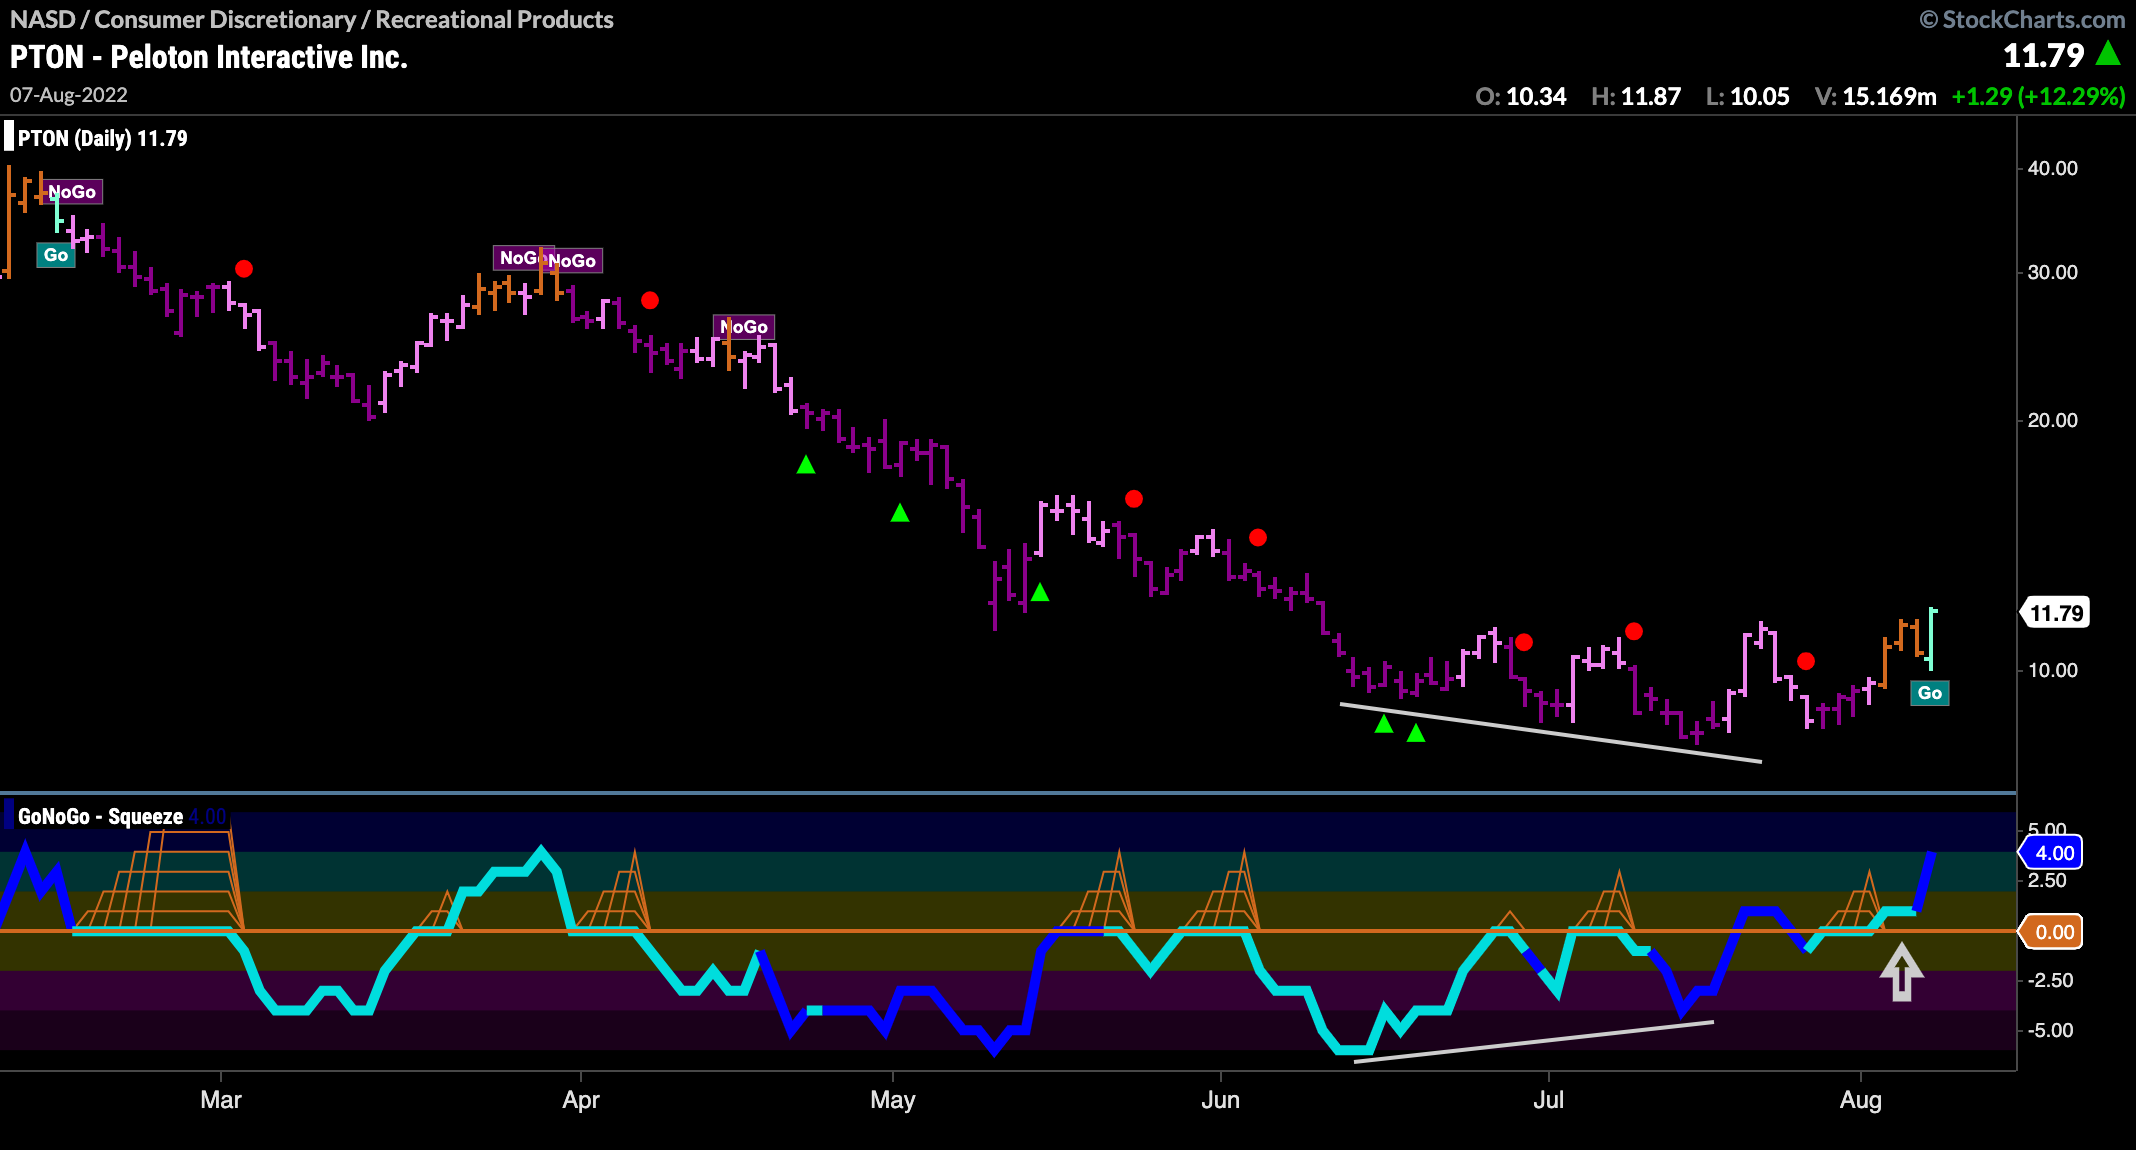
Good morning and welcome to this week’s Flight Path. Let’s take a look at the GoNoGo Asset map below. Equities continue to paint strong blue “Go” bars this week as the trend continues. Treasury bond prices hold on to their “Go” trend as well albeit painting weaker aqua bars to end the week. Commodities see no relief from the “NoGo” trend painting strong purple bars and the dollar holds on to a “Go” trend even as price consolidates.
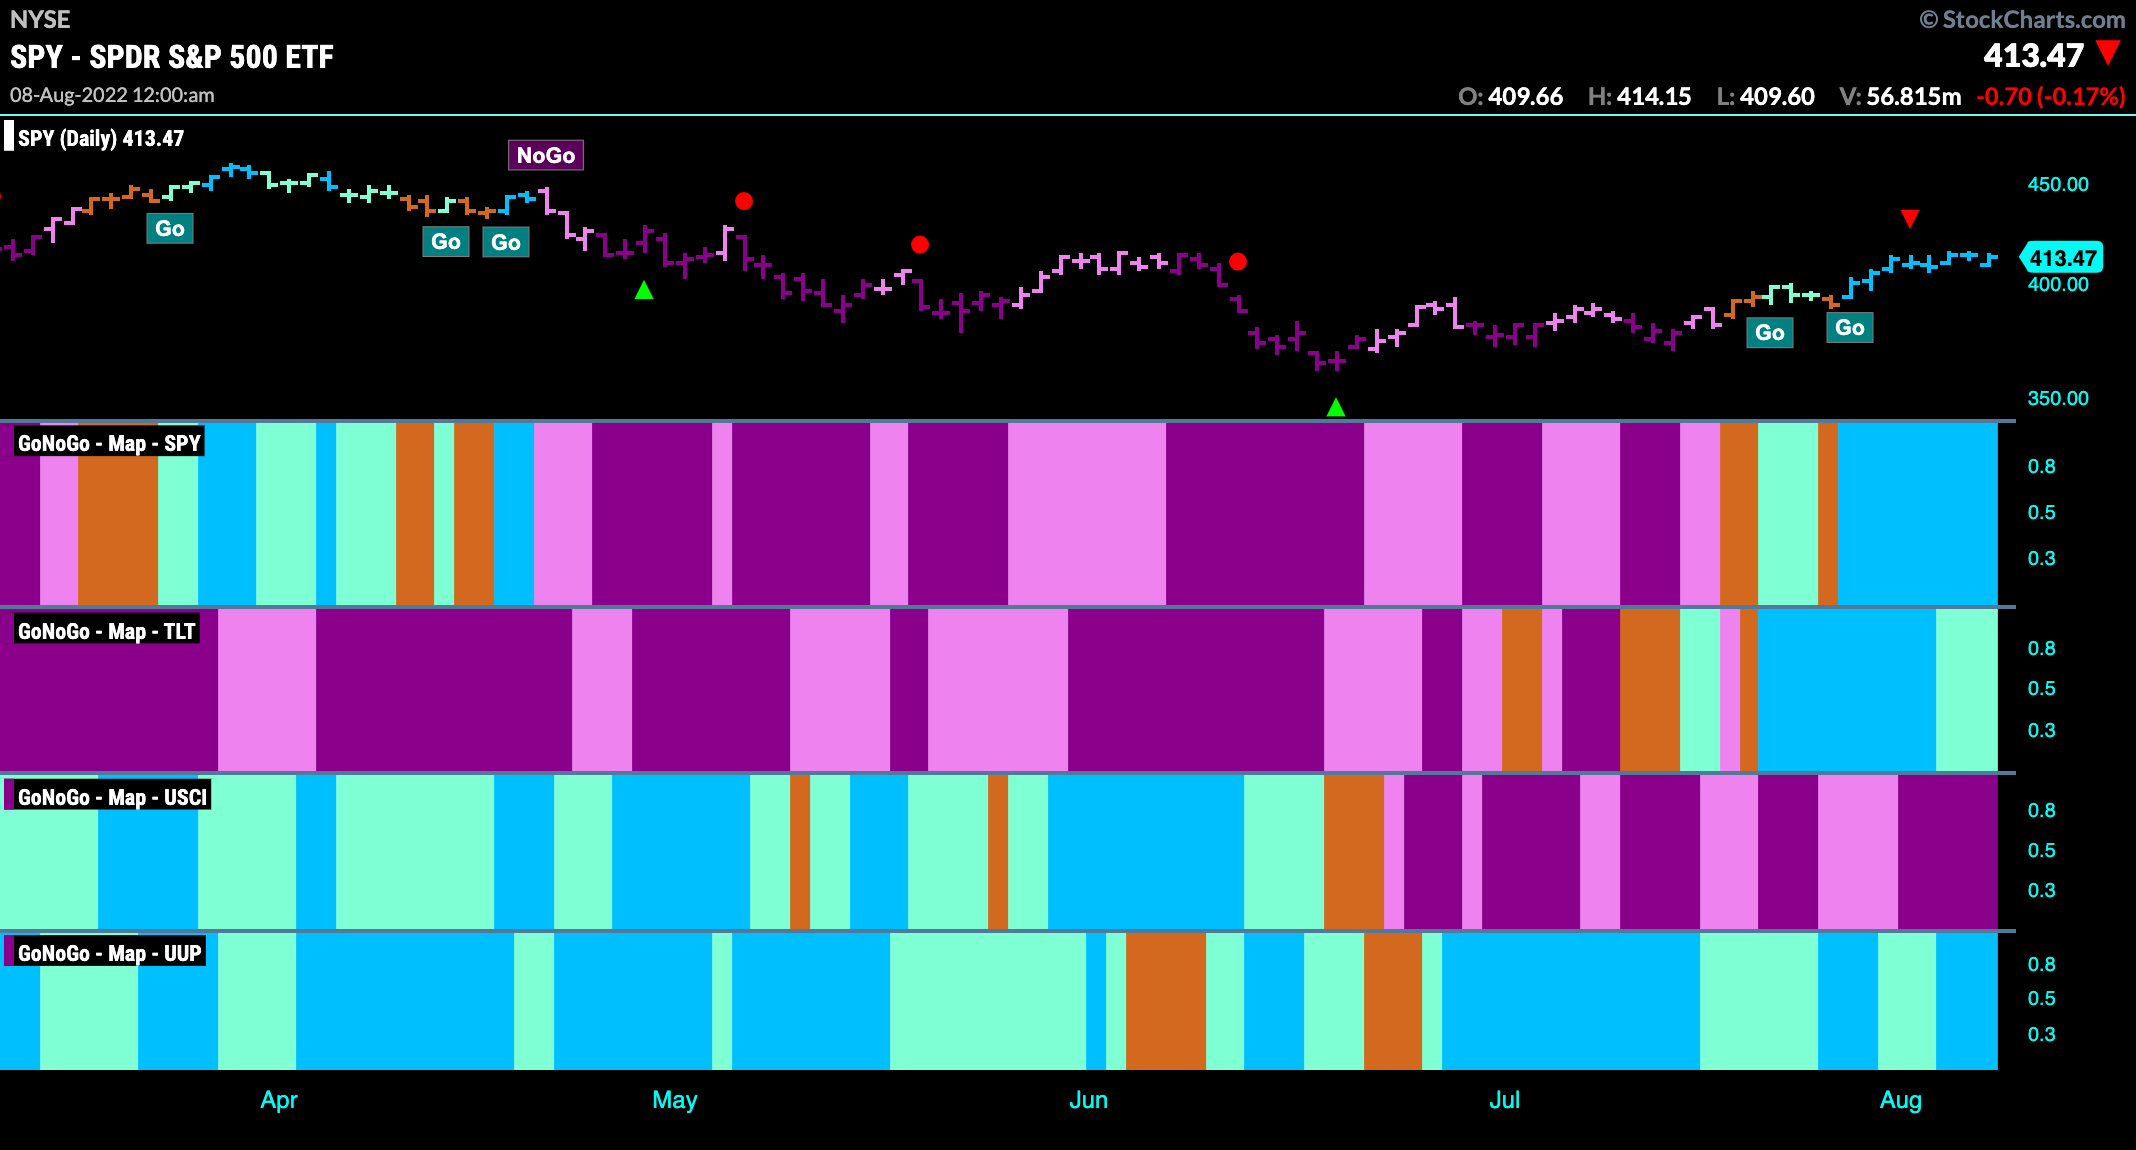
S&P 500 tests resistance in “Go” trend
We saw prices hold this week at levels that were resistance in the most recent “NoGo” trend. We will want to see prices break above 4170 which would mark a new high. GoNoGo Oscillator is in positive territory but volume is relatively light. It seems like we are at an inflection point every week and this is no different.
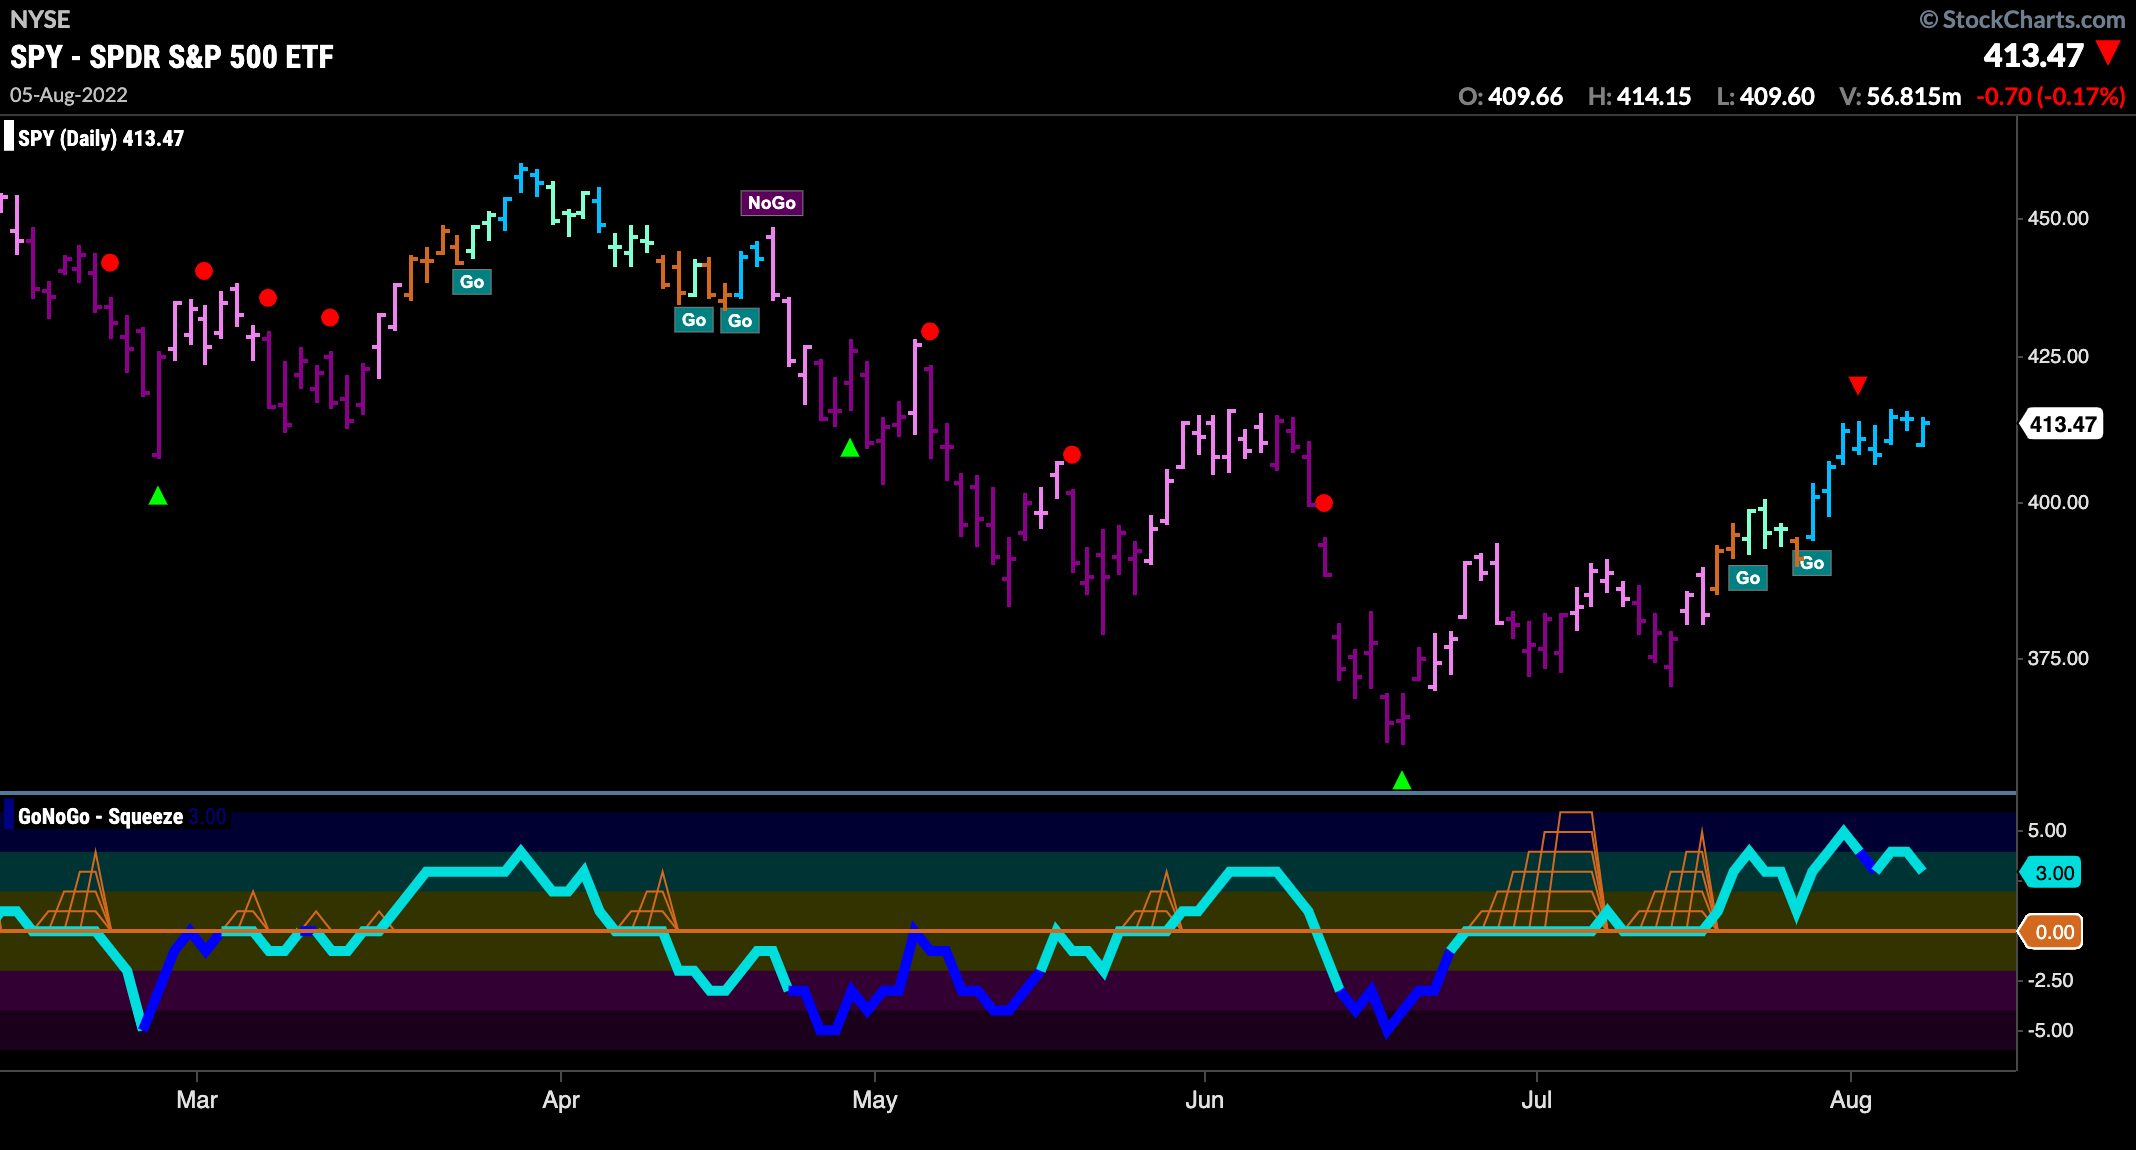
The weekly chart below shows a longer term perspective. As we have said before the weight of the evidence suggests we are not out of the “NoGo” yet. As prices have rallied over the last several weeks we have seen GoNoGo Trend paint paler pink bars but now we are up agains the resistance we saw on the daily chart. GoNoGo Oscillator is at the zero line on weak volume and so we will watch this closely to see if it can break above zero into positive territory or if it will get rejected here.
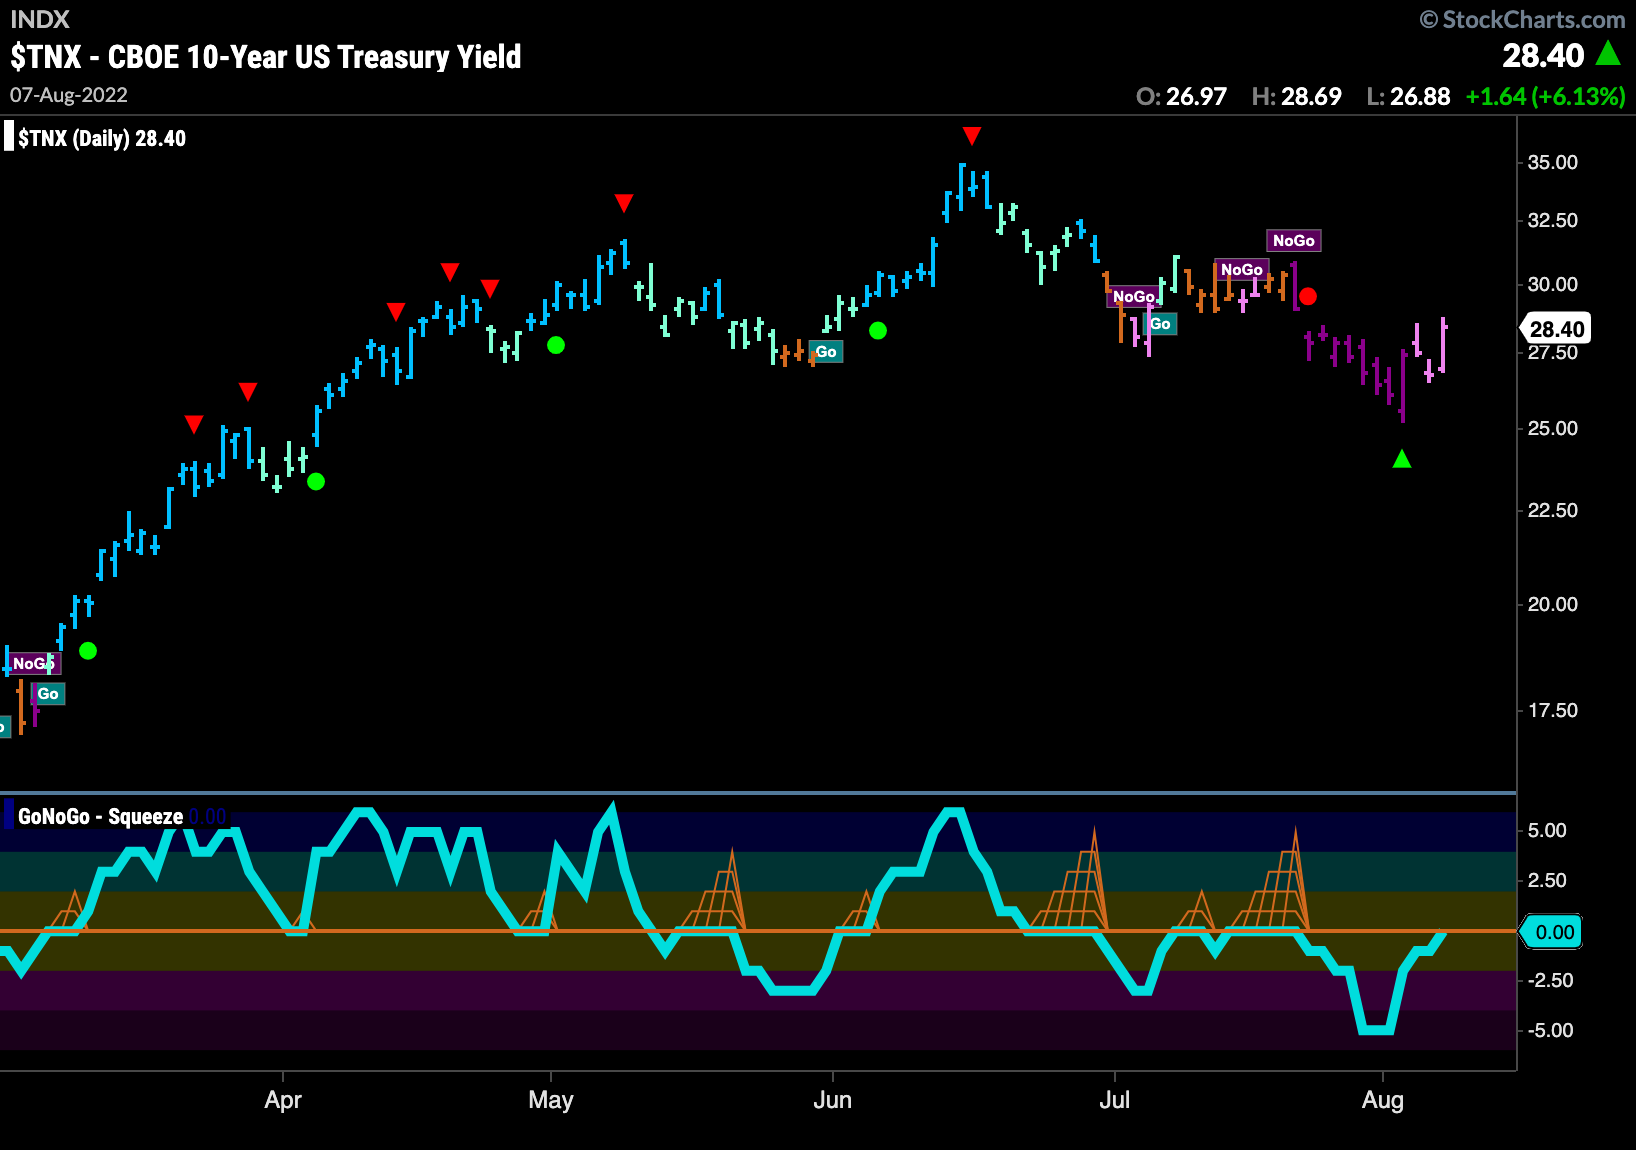
Rates Rallied Last Week
Rates moved higher to end the week. After a NoGo Countertrend Correction Icon (green arrow) indicated that prices may struggle to go lower in the short term, we saw GoNoGo Trend paint pink bars. GoNoGo Oscillator has also risen to test the zero line from below where we will look to see if it finds resistance. If it does, we could expect price to make another move lower.
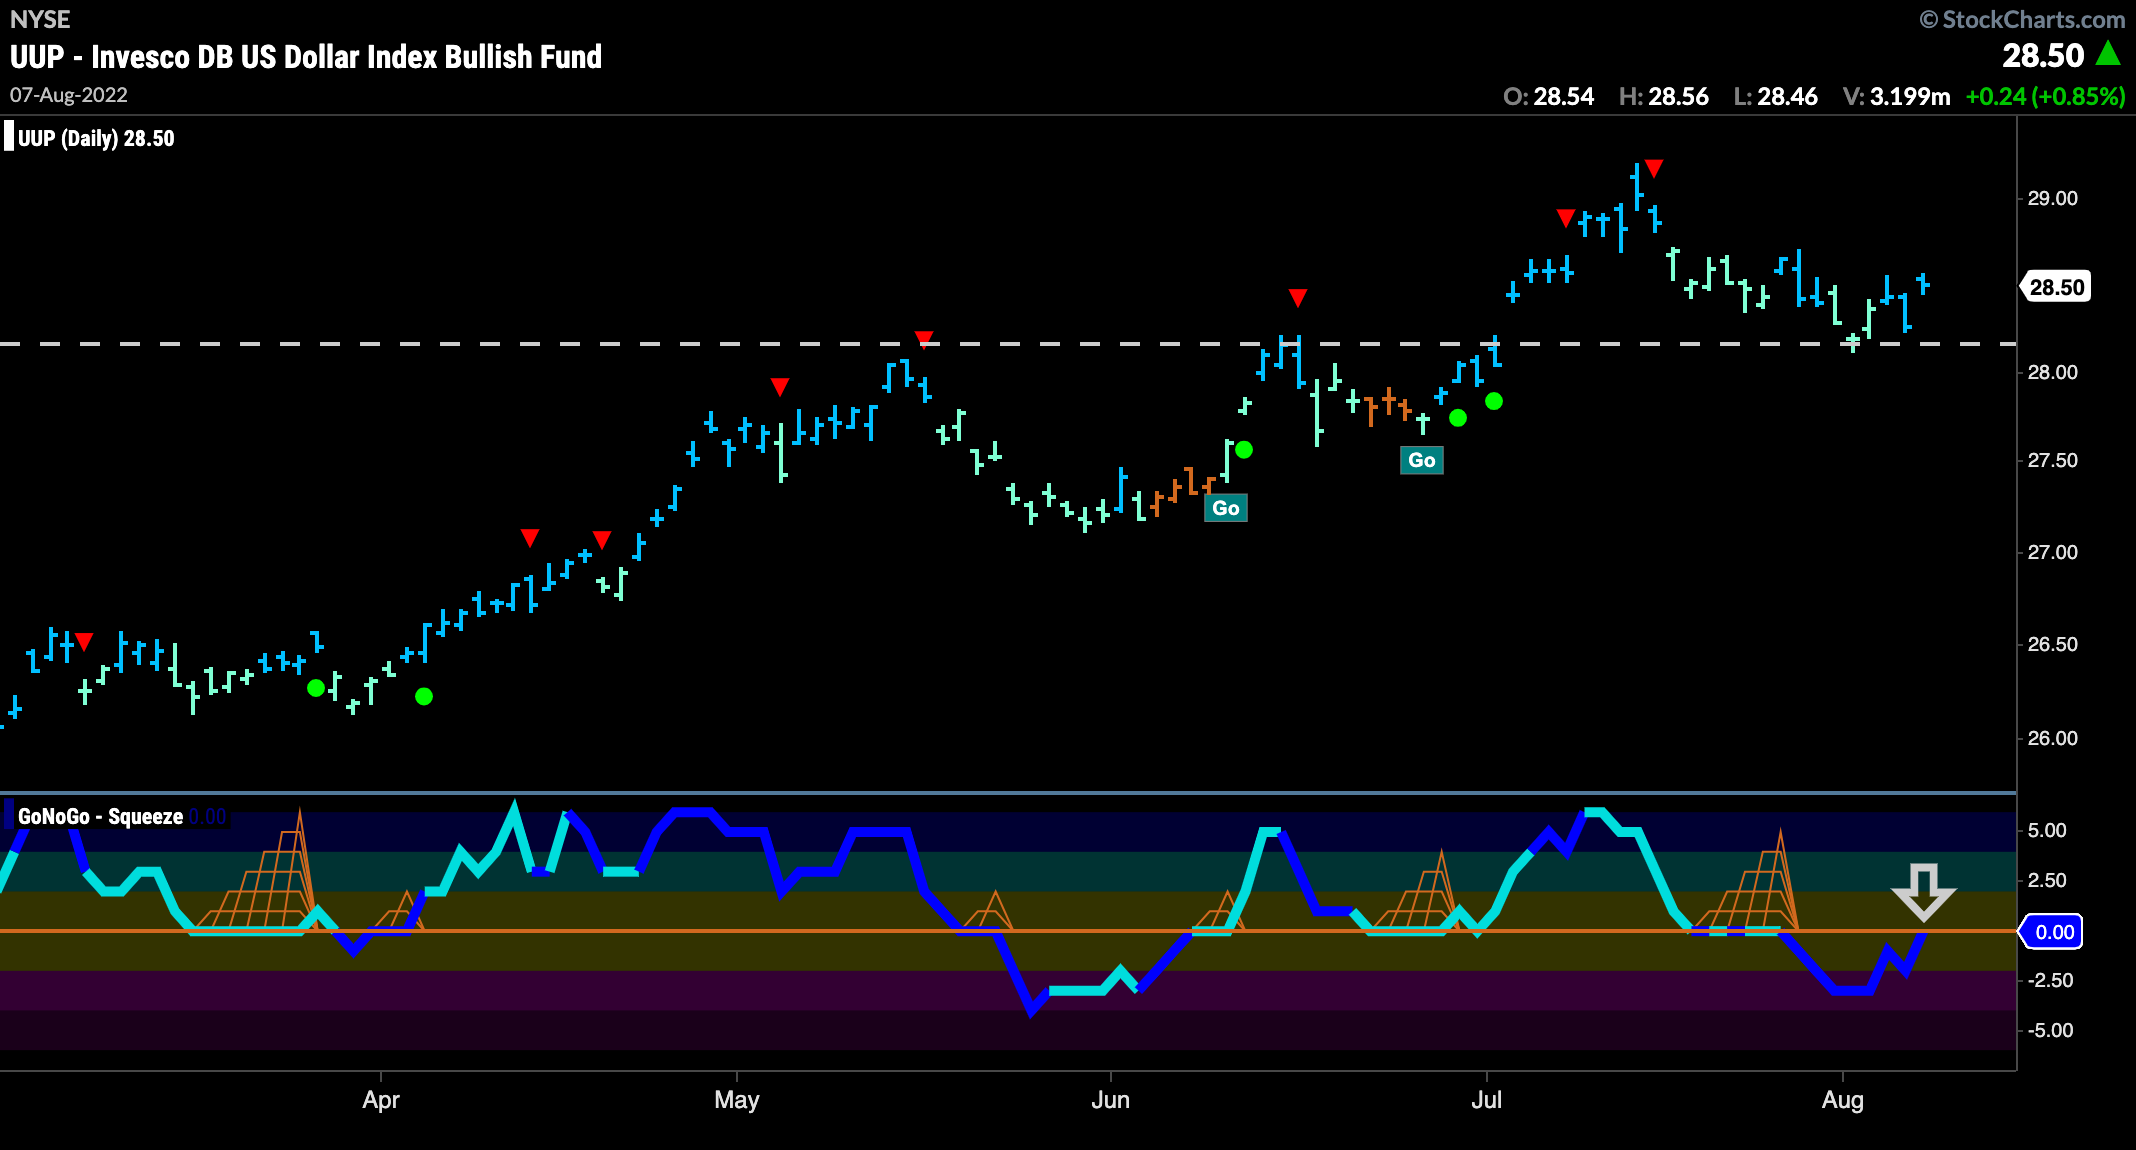
Dollar at Support as Oscillator Tests Zero
Can the dollar continue to be the gift that keeps on giving? As many have called for the mighty greenback to roll over its strength has been surprising. After Go Countertrend Correction Icons (red arrows) suggested the recent correction, price has indeed moved lower but has not failed to paint “Go” colored bars. GoNoGo Oscillator did break below zero on heavy volume and is now testing that level from below. If it is rejected here the negative momentum might prove too much for price. However, if price is able to continue to find support (see horizontal trendline) then we will likely see the oscillator move back into positive territory.
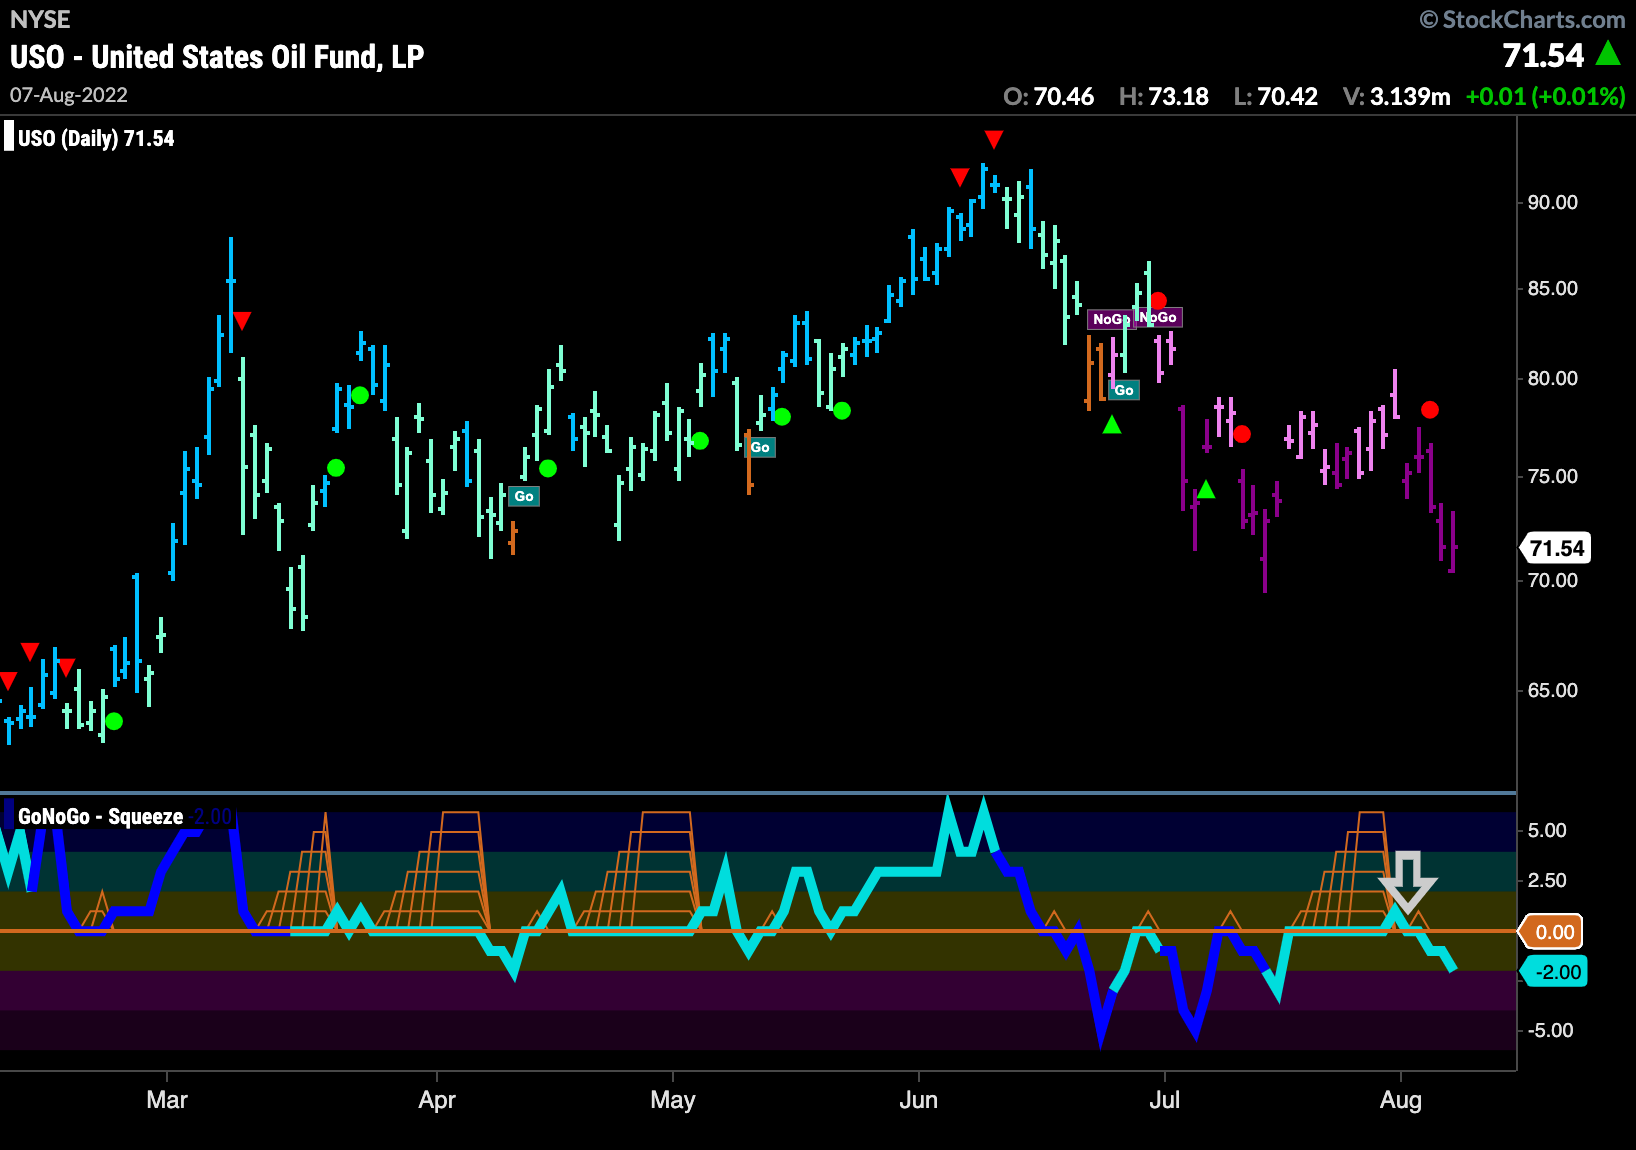
“NoGo” Continues for Oil
The beginning of last week saw GoNoGo Oscillator break out of a max GoNoGo Squeeze back into negative territory. This signaled returning momentum in the direction of the “NoGo” trend and suggested a new move lower in price with a NoGo Trend Continuation Icon (red circle) . That move lower came this week as price fell to test prior lows from July.
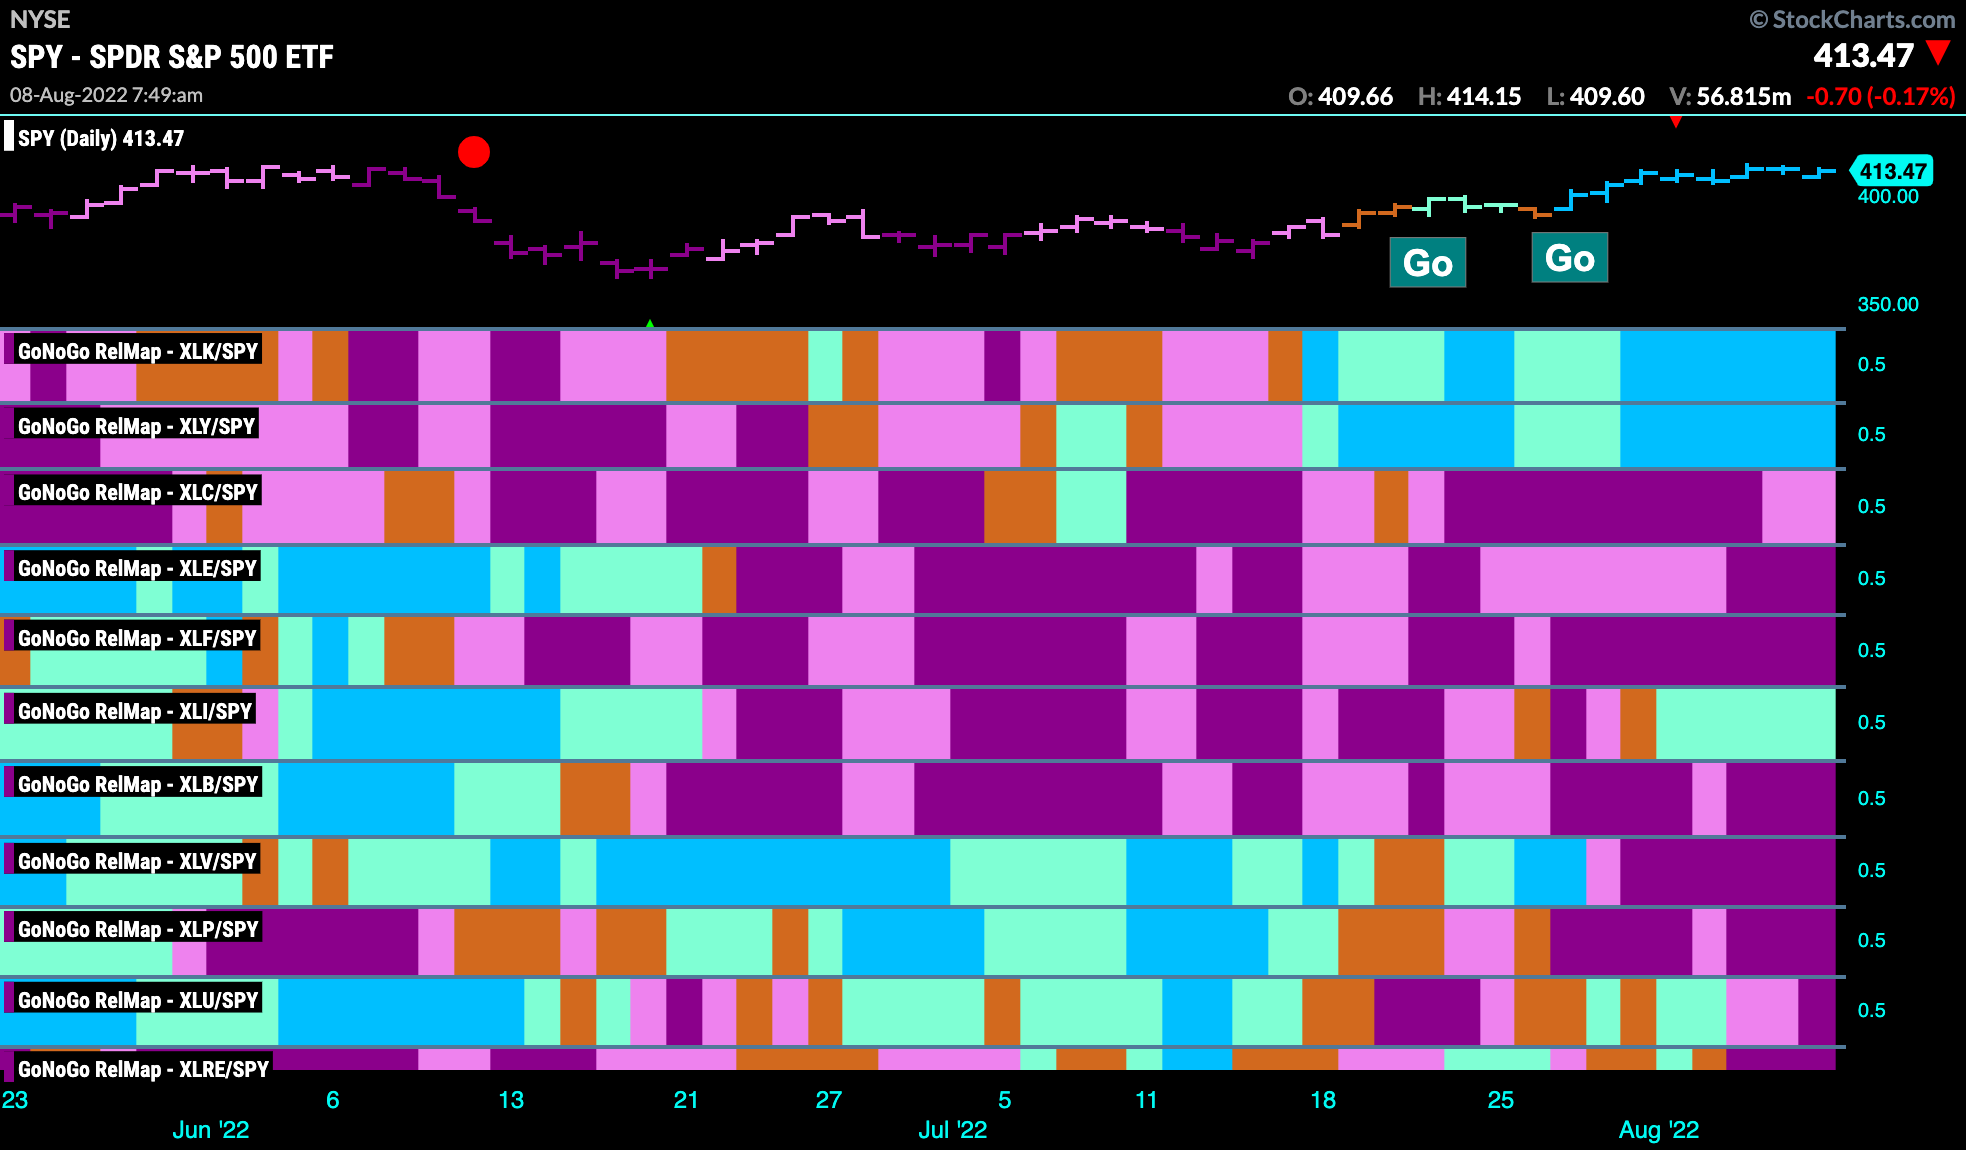
Sector RelMap
Below is the GoNoGo Sector Relmap. This GoNoGo Relmap applies the GoNoGo Trend to the relative strength ratios of the sectors to the base index. Looking at this map, we can quickly see where the relative outperformance is coming from as well as which sectors are lagging on a relative basis. For the third week in a row the GoNoGo RelMap shows the rotation into risky growth assets on a sector basis continue as the “Go” trends survive in the technology and discretionary sector. This trend strengthened as we see uninterrupted strong blue bars. Industrials also entered a relative “Go” trend this week.
Technology above Resistance
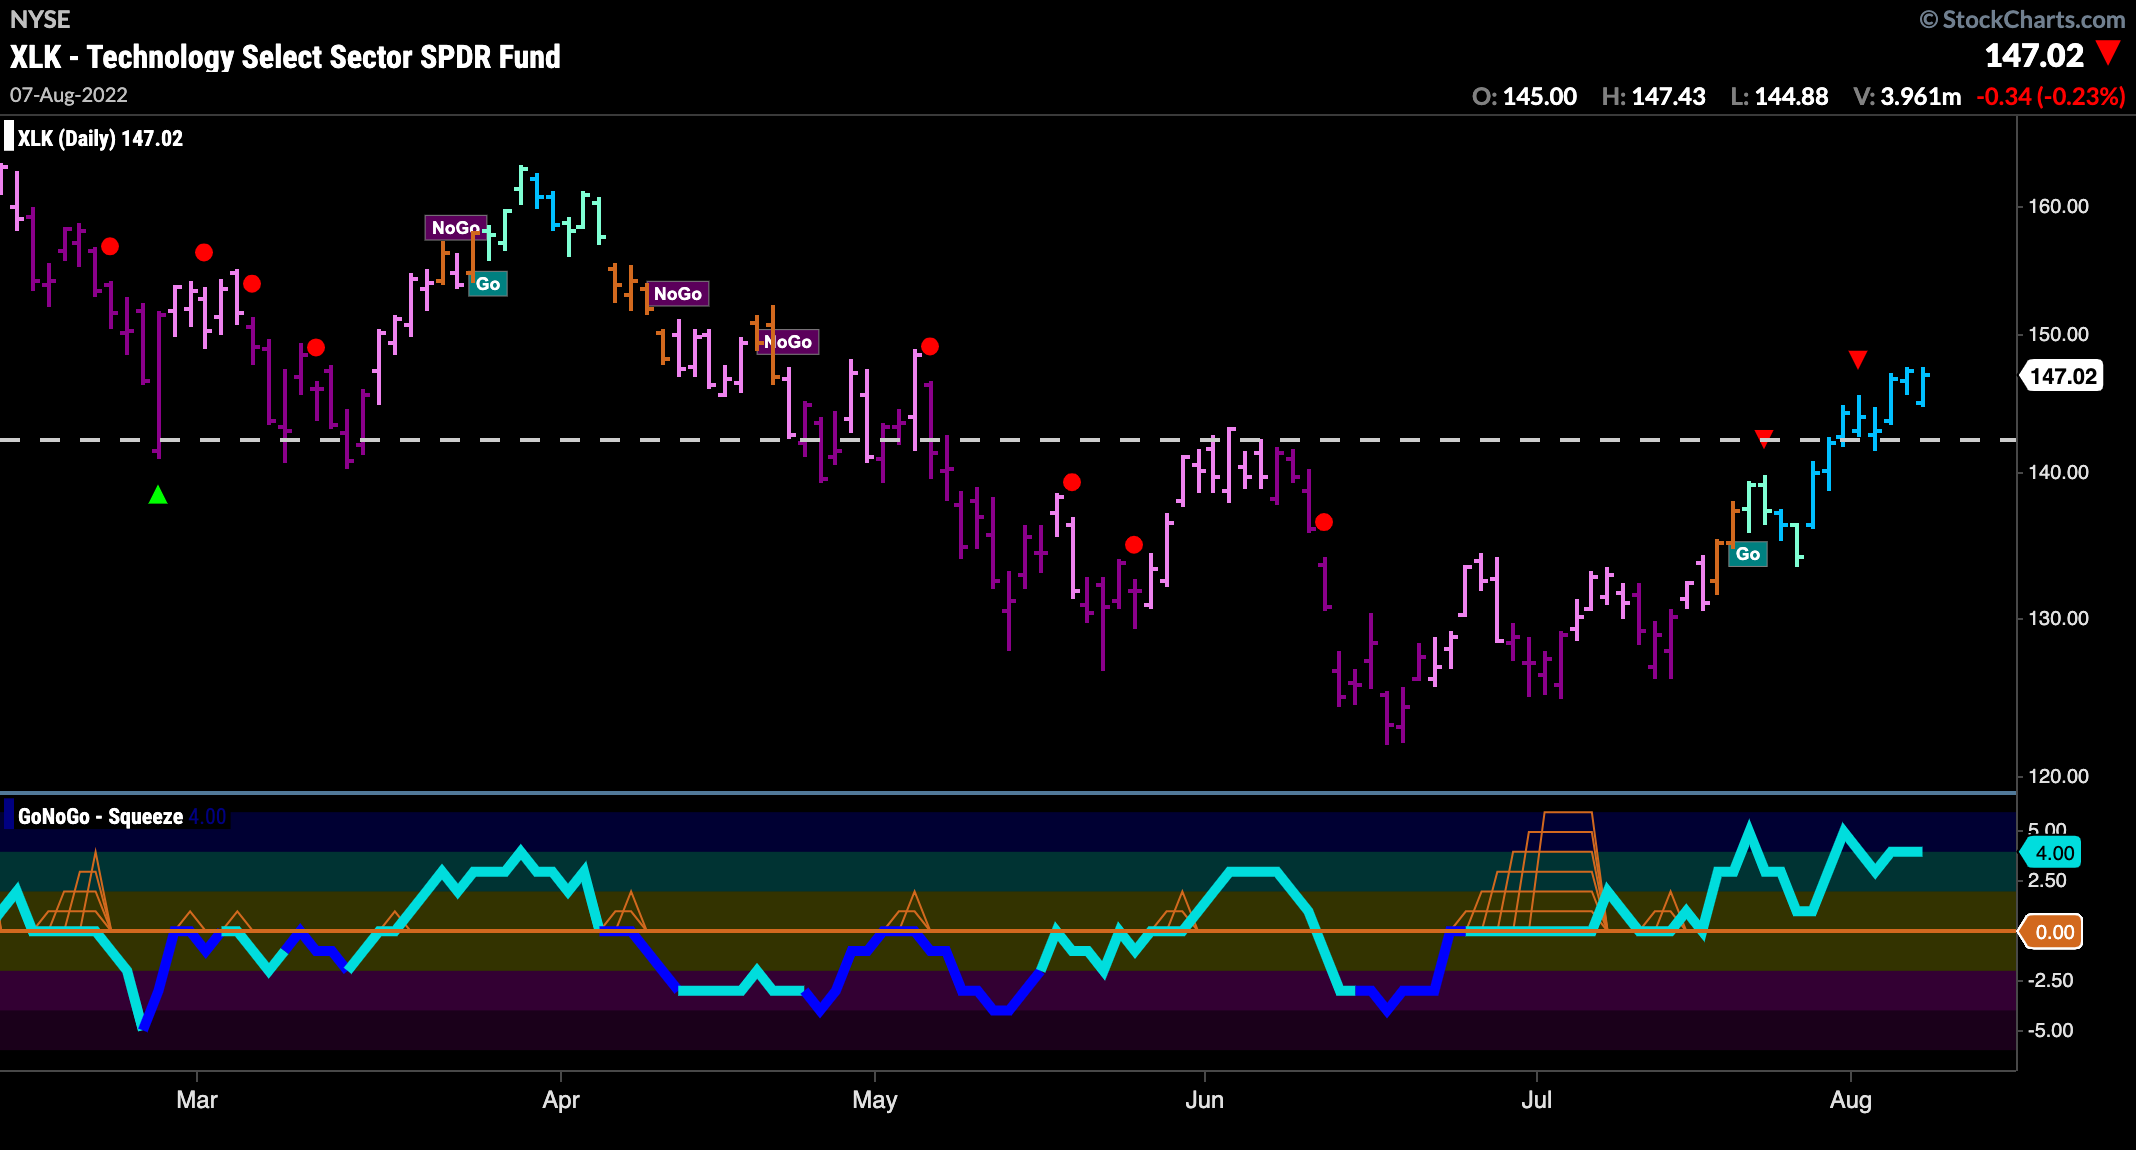
Unlike the broader market, the chart below shows us that $XLK is already above the resistance levels from June. Painting strong blue “Go” bars, price climbed above those levels that have acted as resistance recently and support further back in the chart. This concept of polarity suggests that we will see support at these levels going forward. Look for price to test the highs around $163.
Long Term Trend Change for Apple?
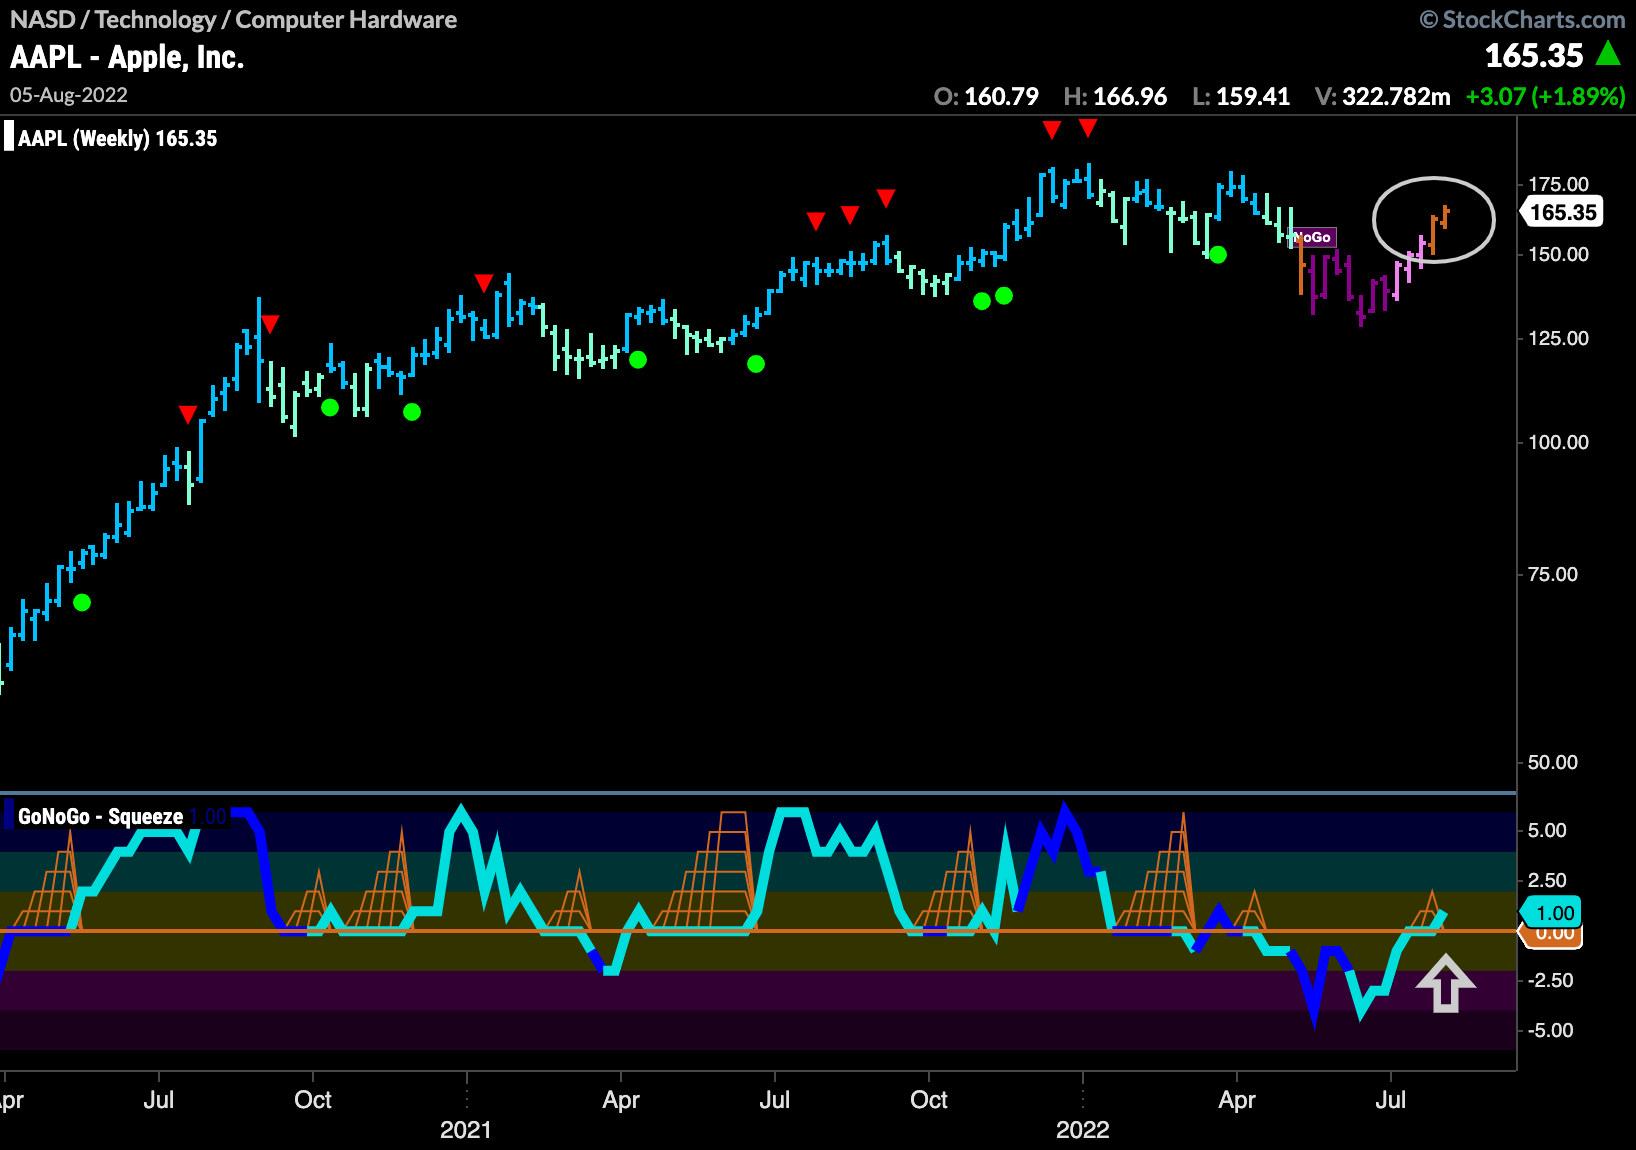
Given the strength of the sector, let’s look at one of the biggest names in the industry on a weekly basis. GoNoGo Trend for Apple shows that the “NoGo” is threatened. We saw two amber “Go Fish” bars over the last two weeks and importantly, GoNoGo Oscillator is dipping its toes into positive waters. This could be significant as the next few weeks unfold.
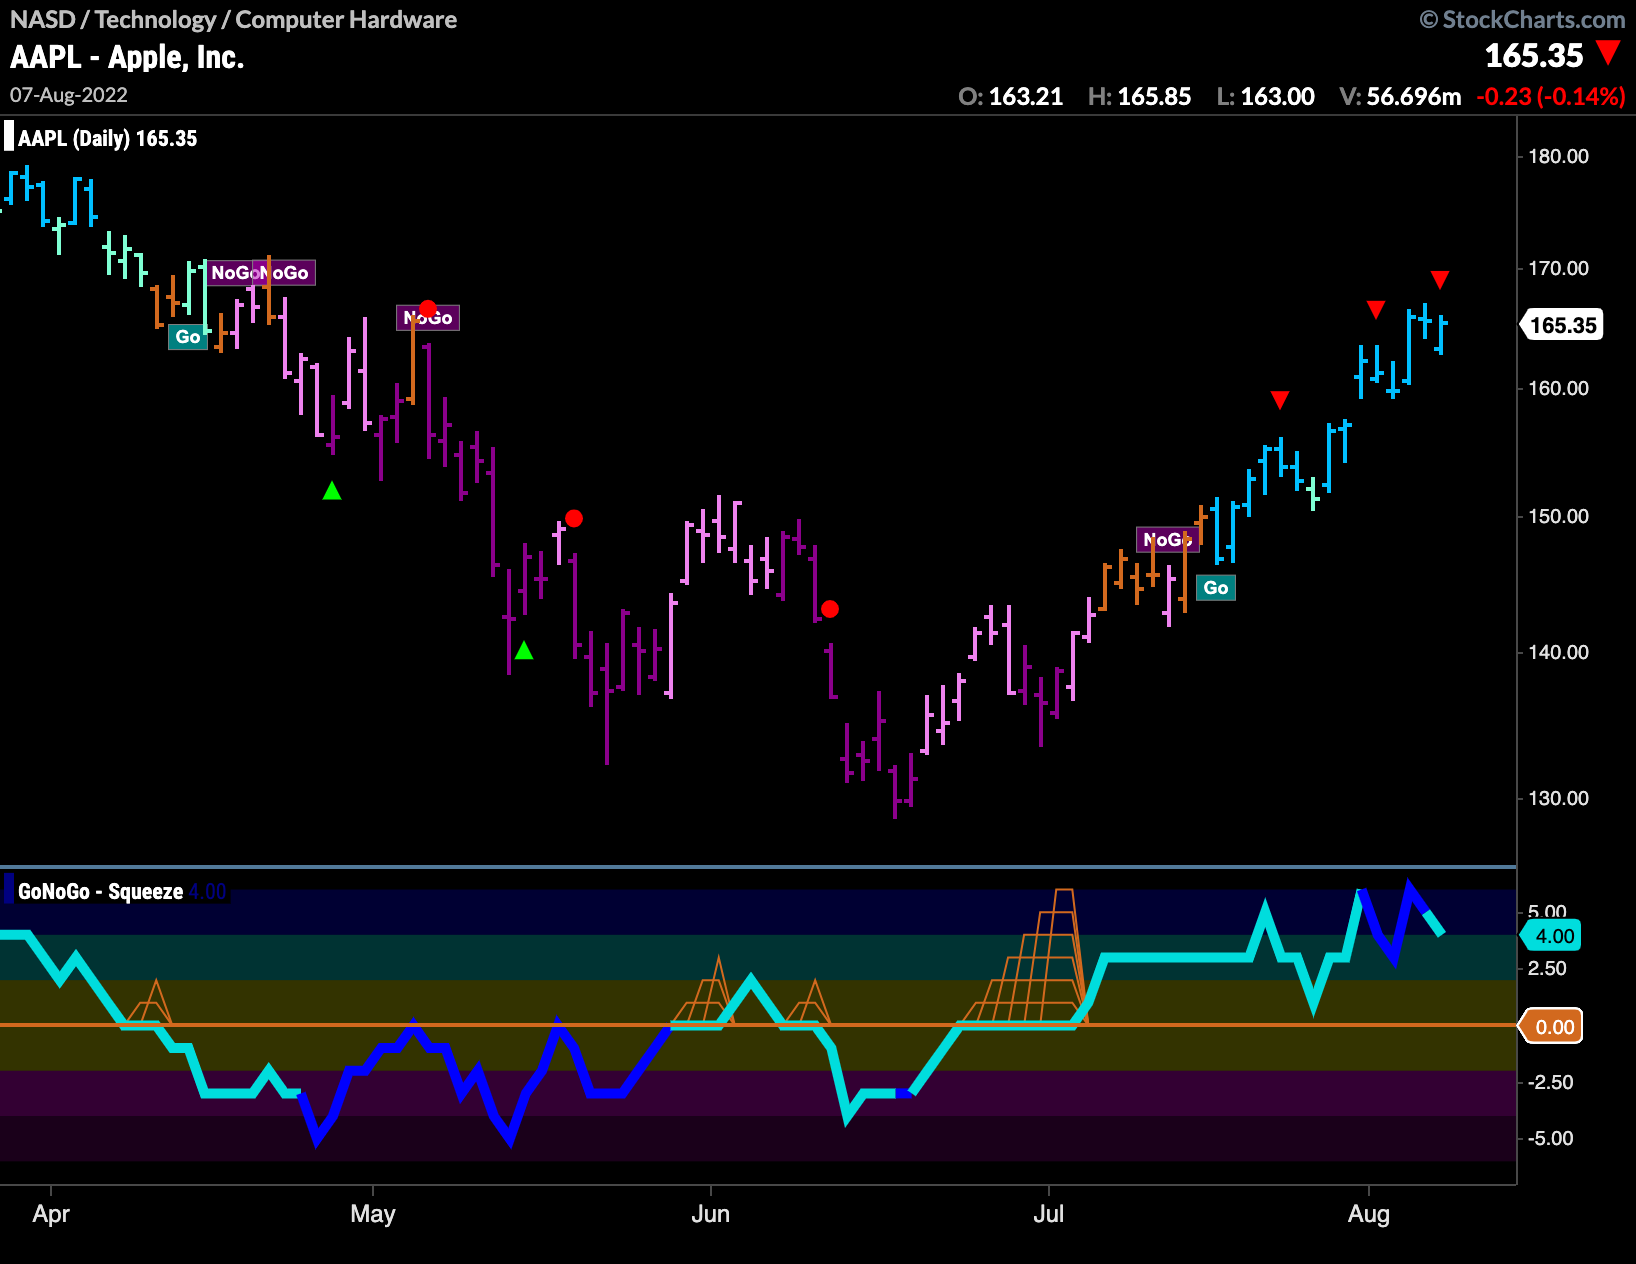
The daily chart shows just how strong the price move has been for $AAPL over the last few months. Price has painted strong blue “Go” bars almost exclusively since the “Go” trend was identified. Blowing past several Go Countertrend Correction red arrows as well as prior resistance the trend looks strong. GoNoGo Oscillator is in positive territory but not overbought.
Are we Ready to Believe in $ARKK?
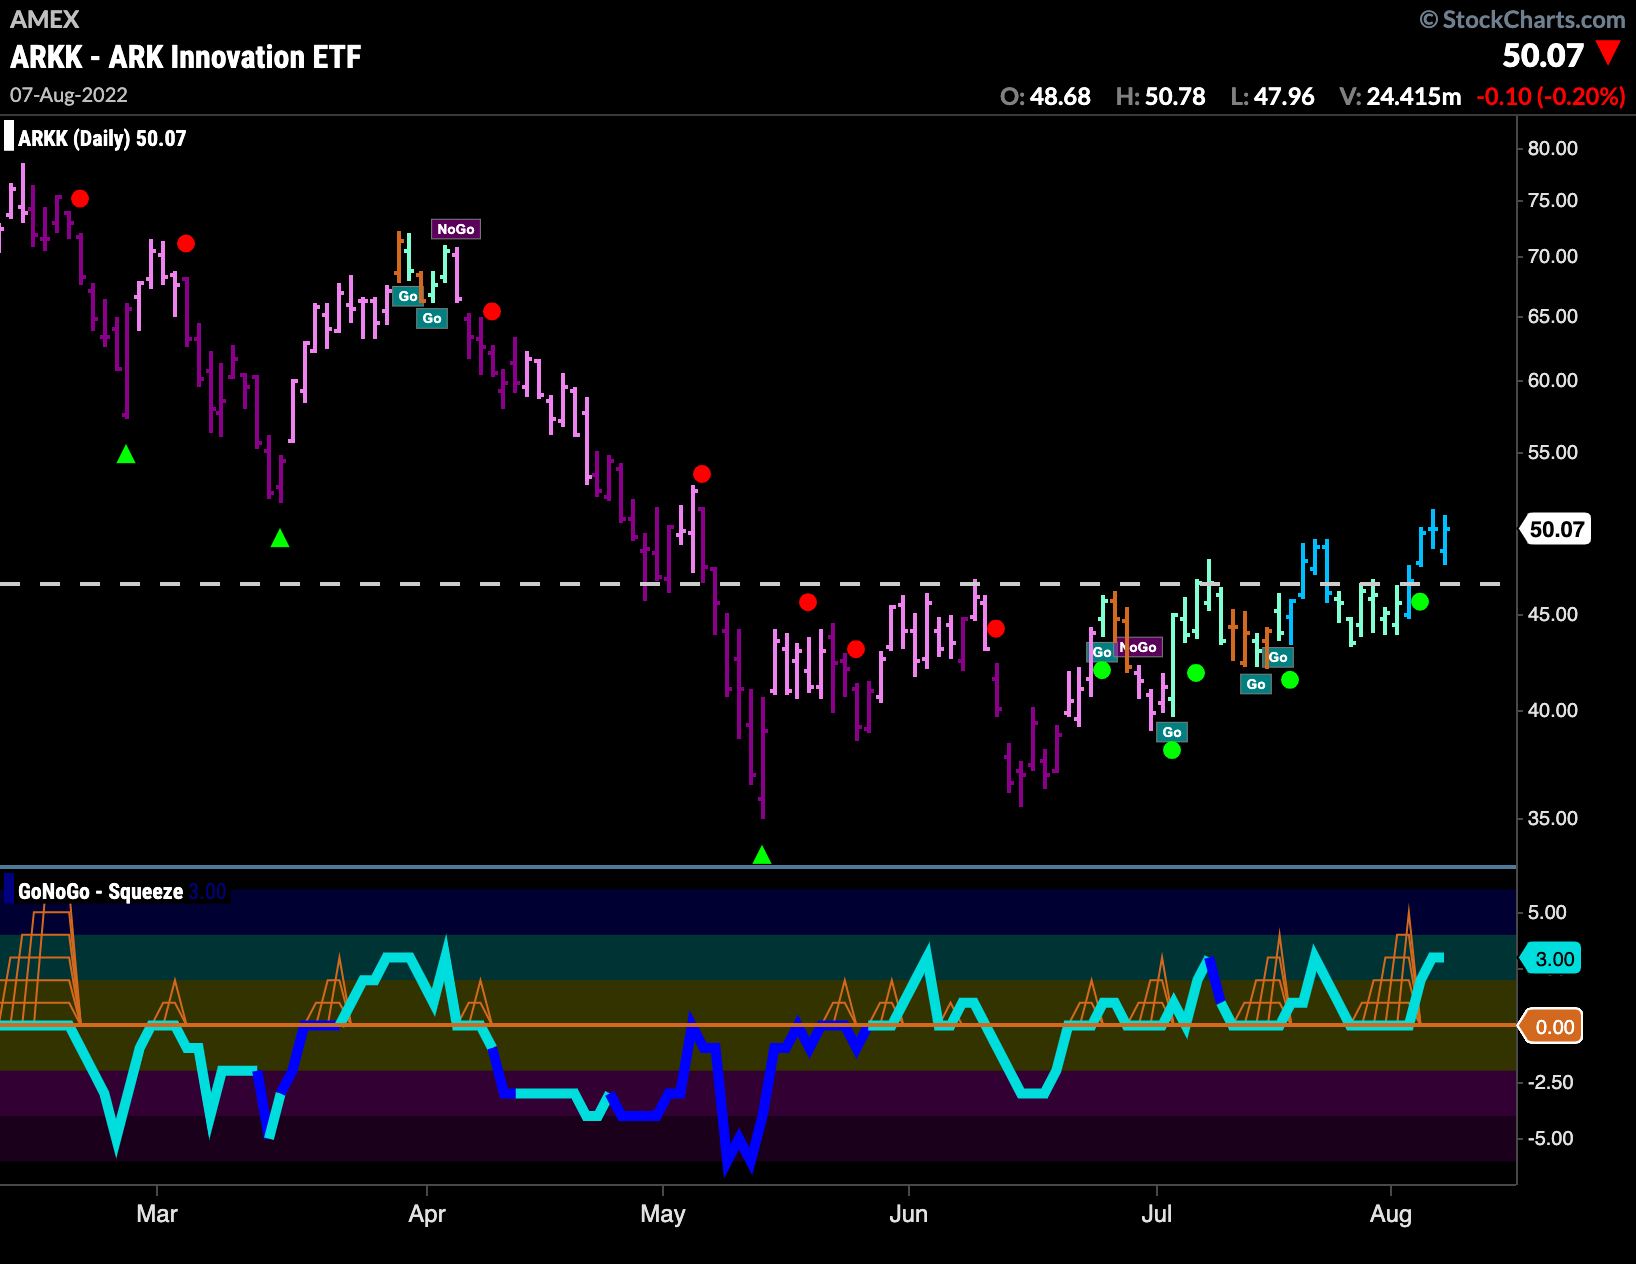
The strength in technology has seen ARK Innovation ETF climb off the floor as well. The GoNoGo chart below shows that the “Go” trend has solidified as price climbs above resistance. Coming out of what looks like an ascending triangle reversal, we saw GoNoGo Oscillator break above zero about half way through the basing pattern and has been finding support at that level since. This has confirmed the move to “Go” bars that we saw in price.
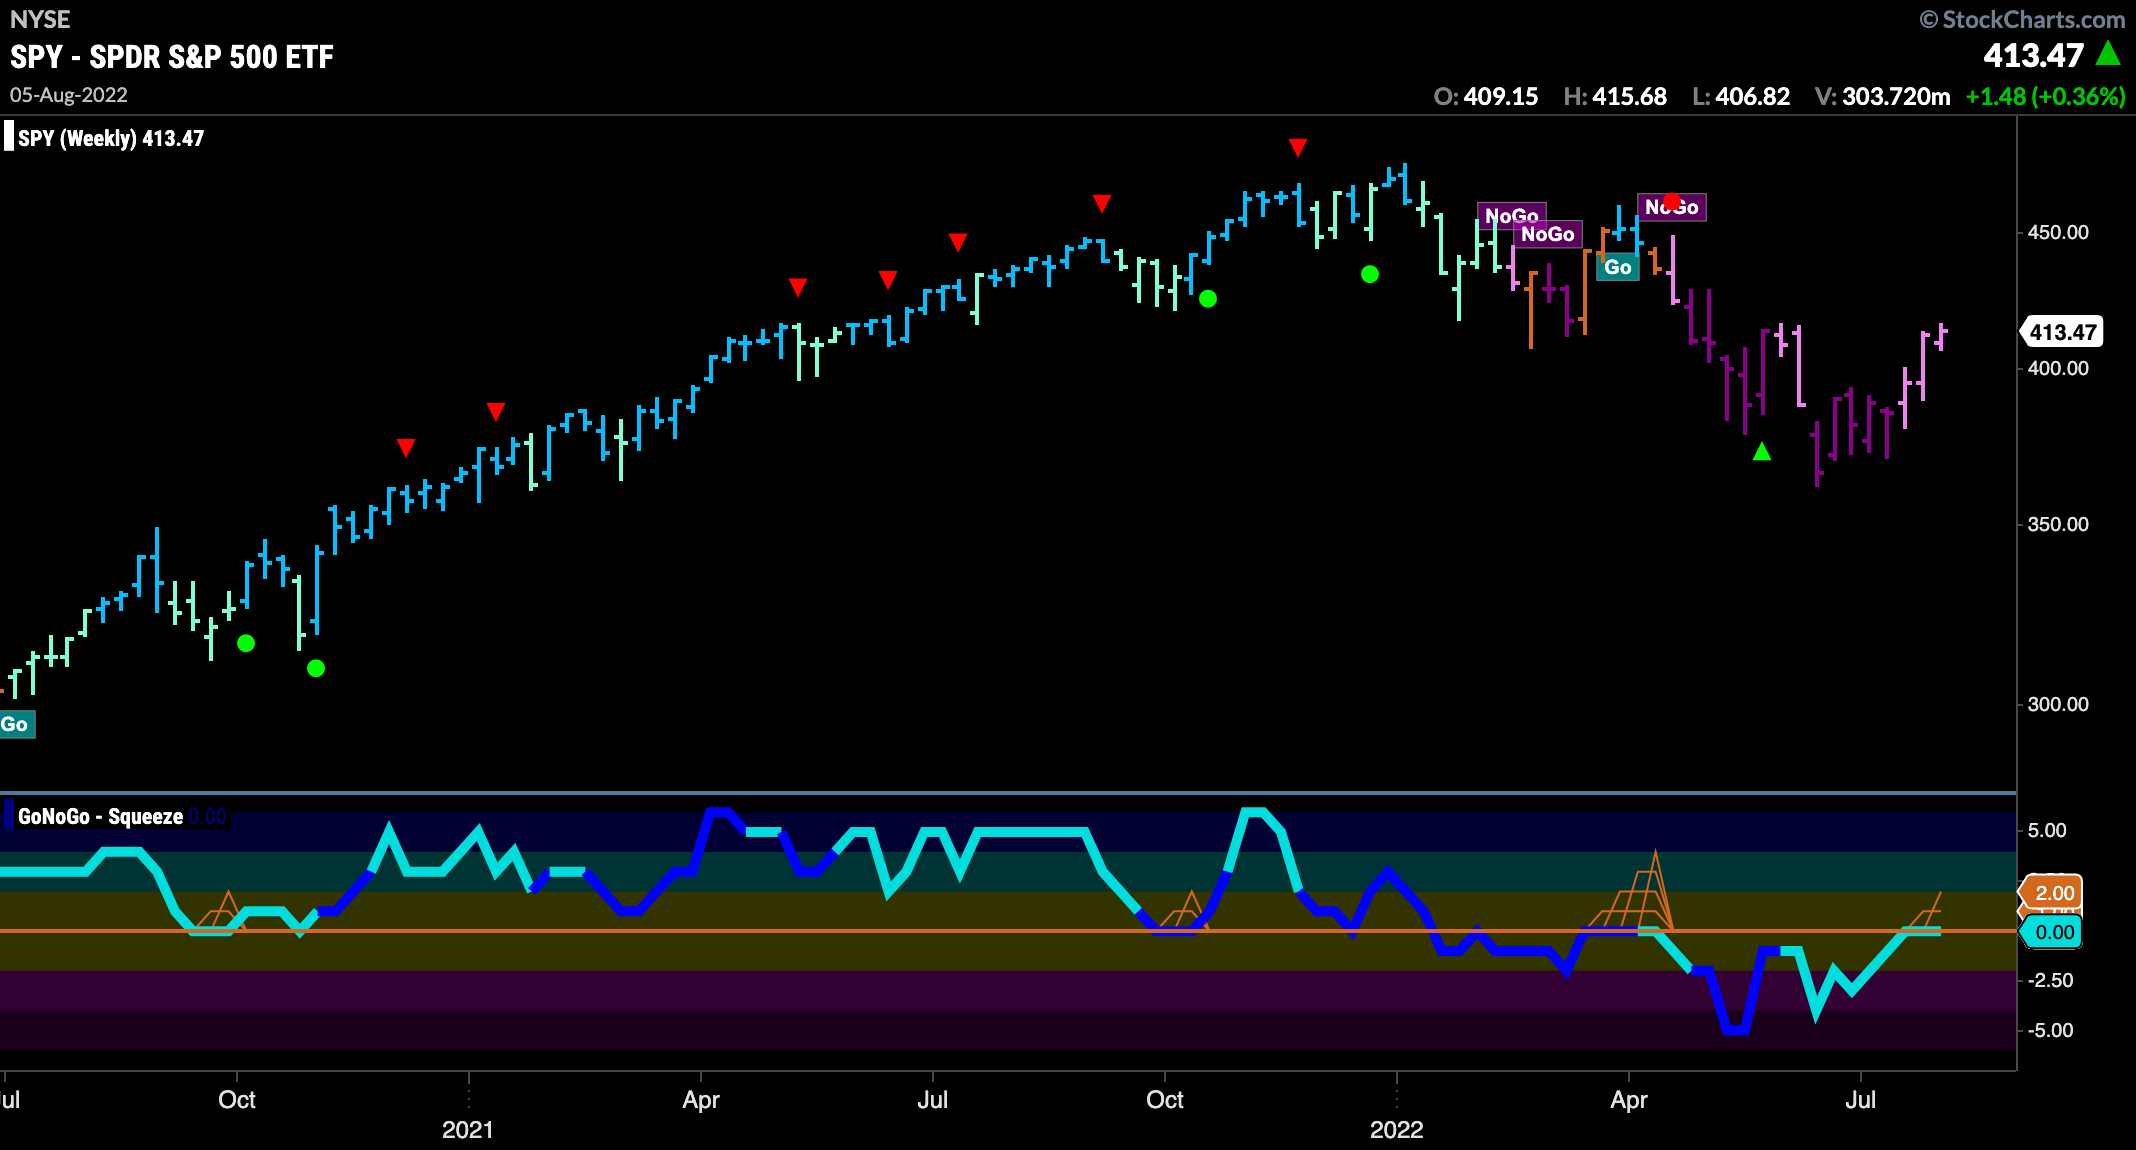
$PTON sees Fresh “Go” Identified
A technology focused stock in the other outperforming discretionary sector, Peloton Interactive offers some hope at the end of what has been a long “NoGo” move. After we saw bullish divergence between price and the oscillator we saw GoNoGo Oscillator break above the zero line and GoNoGo Trend paint a few amber “Go Fish” bars. Finally, Friday’s bar saw an aqua “Go” bar. Is this the start of a reversal for $PTON?
