
Last week’s price action exhibited a tug of war between the hope for growth and the fear of inflation. Thursday’s correction was a sharp awakening for many investors that were accustomed to a purely upward trending index. The GoNoGo Trend® of the S&P painted an amber bar on the daily chart reflecting the questionable trend conditions. Friday brought heavy buying power and equities regained all they had lost the day before.
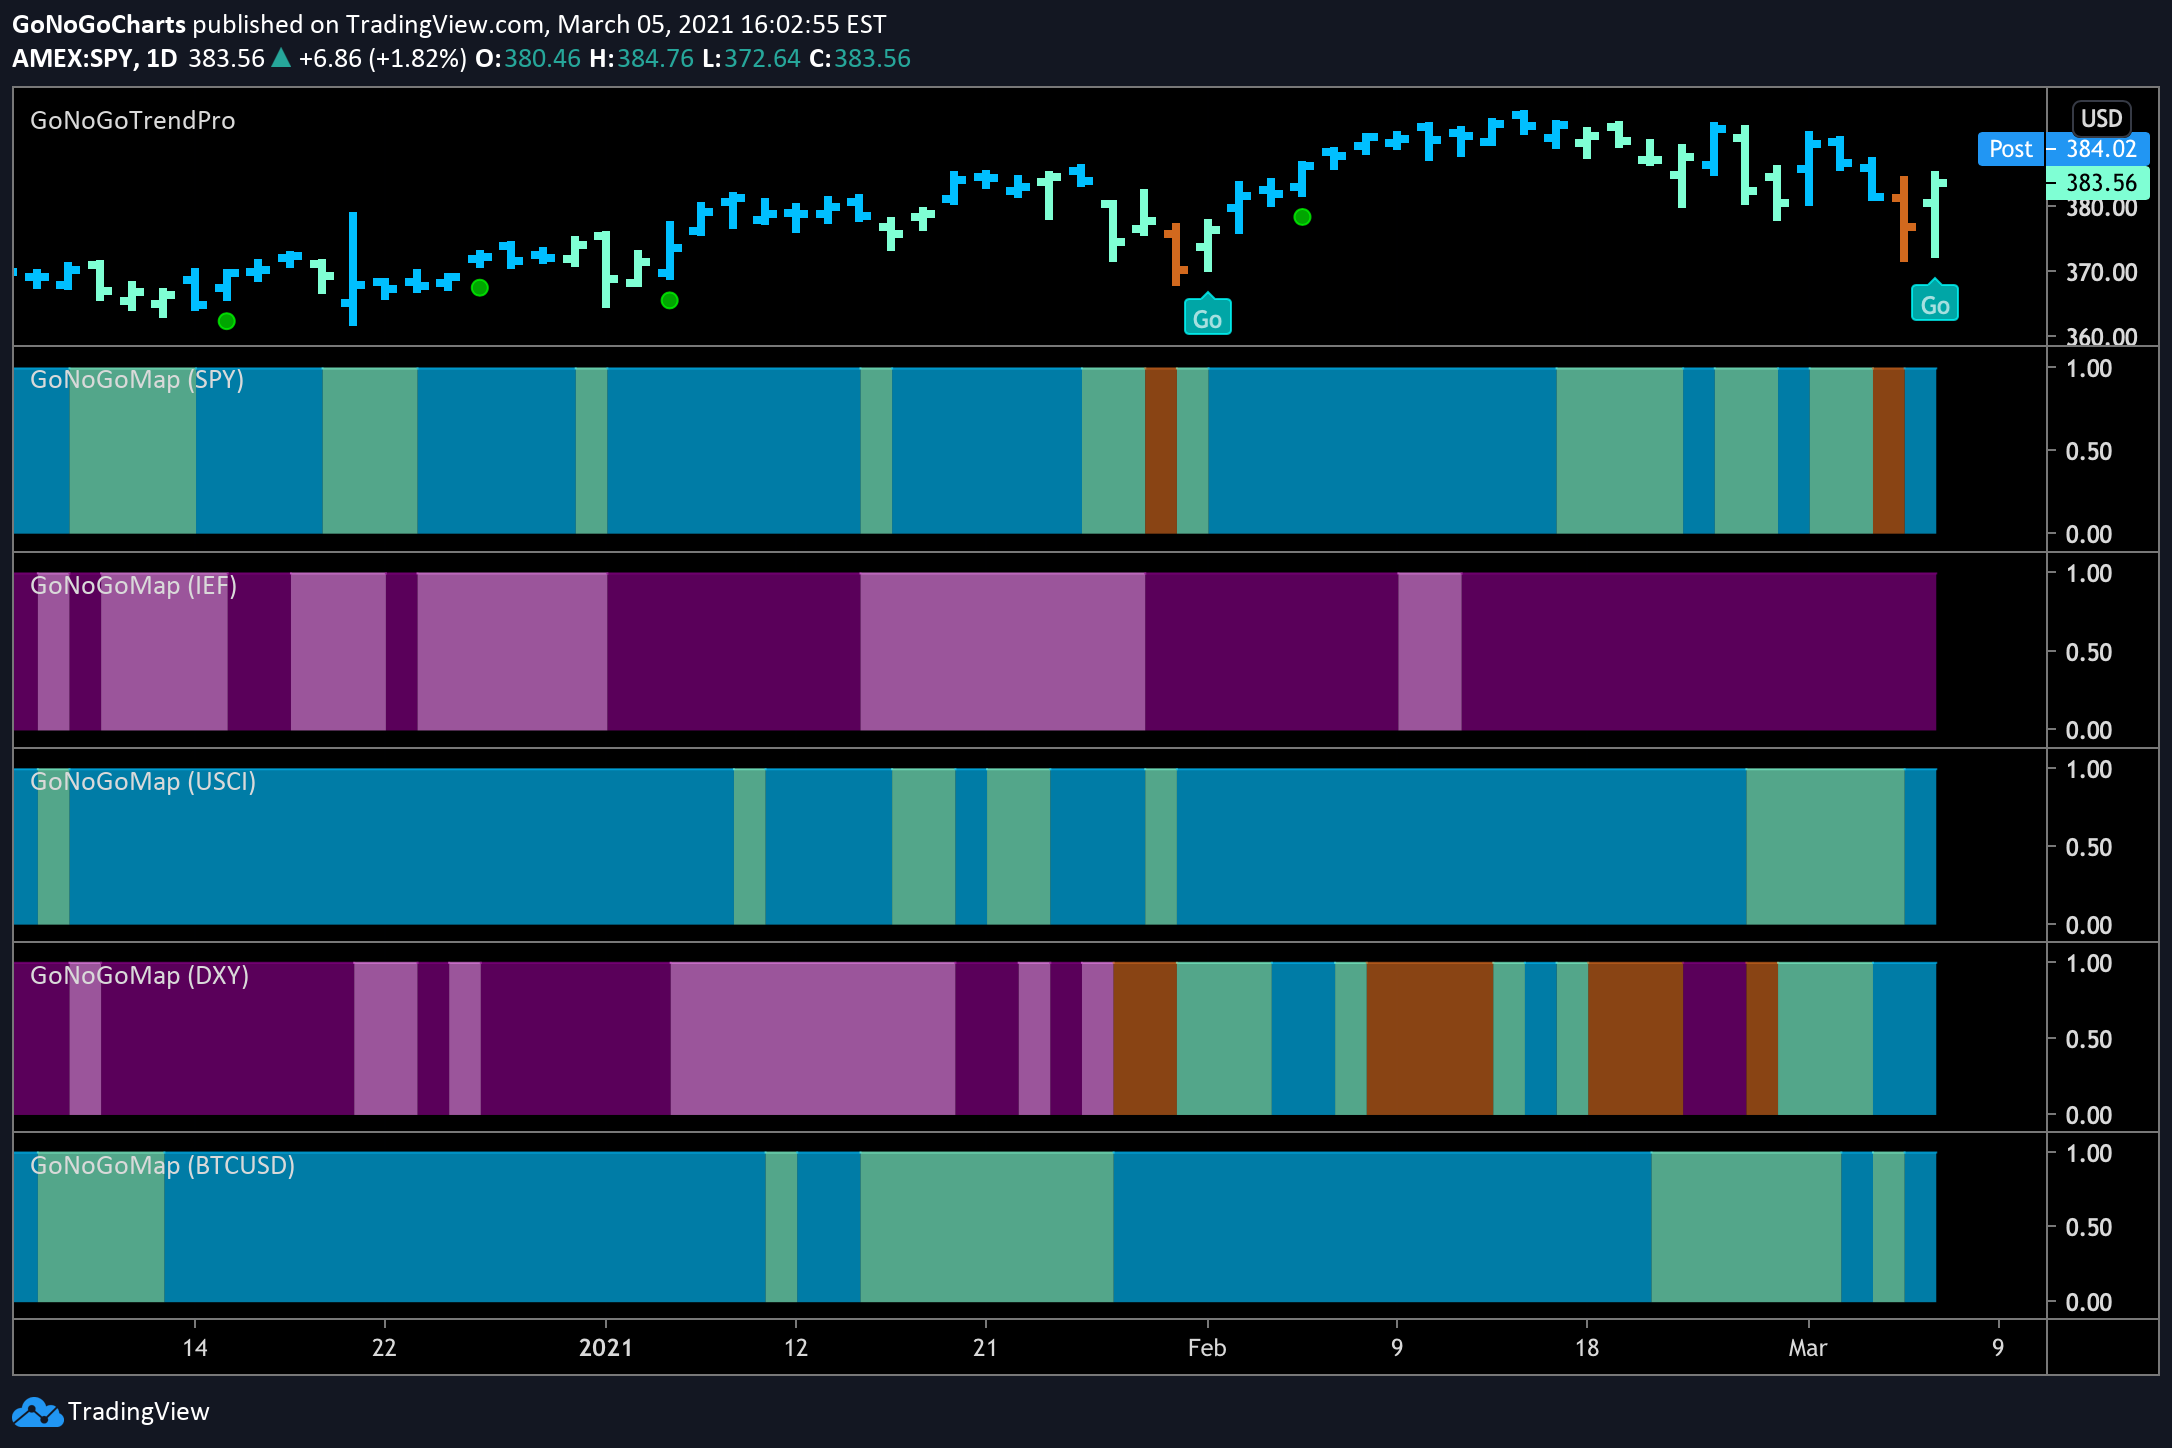
Choppy trading sessions did not reflect a shift in the underlying trends or macro conditions of this early-stage bull market. The GoNoGo Cross-Asset Heatmap® below reinforces the risk-on thesis with equities, commodities, and cryptocurrencies still in “Go” trends. The wildcard remains the dollar as it rallied sharply this week in response to equity volatility.

The GoNoGo Heat Map® above shows us the daily trend performance of five asset classes: Equities, Bonds, Commodities, Currencies, and Digital Assets from the US perspective.
Panel 1 – Stocks ended the week in a “Go” trend, having dipped into neutral territory on Thursday. S&P 500 SPDR ETF Trust seeks to provide investment results that, before expenses, correspond generally to the price and yield performance of the S&P.
Panel 2 – Government bonds, continue to paint “NoGo” bars, as the “NoGo” trend remains secure. $IEF tracks a market-value-weighted index of debt issued by the US Treasury with 7-10 years to maturity remaining.
Panel 3 – Commodities are a “Go” and ended the week painting strong “Go” bars. $USCI tracks an equal-weighted index of 14 commodity futures contracts and holds at least one precious metal, industrial metal, energy, livestock, soft, and grain commodity.
Panel 4 – The US Dollar rallied this week, bouncing back into the “Go” trend. The dollar has been vacillating on the daily chart over the last several weeks as it struggles to escape the long-term “NoGo” trend. $DXY is an index of the value of the United States Dollar relative to a basket of foreign currencies.
Panel 5 – Bitcoin’s “Go” trend continues as it consolidates after its recent all-time high.
THE GRAND REOPENING
If 2021 is to see the restart of the industrial economy, then we should see continued rotation away from the technology and discretionary sectors ($XLK & $XLY) toward those that drive and support industrial manufacturing. That was indeed the case with energy ($XLE), financials ($XLF), and communications ($XLC) remaining strong. The recent trend in industrials ($XLI) persisted and this week saw the materials sector ($XLB) follow suit by entering a “Go” trend.

MATERIALS MOVING
The newcomer to the sector leadership is $XLB, but if we look at a weekly GoNoGo Trend® chart we can see that the absolute “Go” trend has been in place since July 2020. During that time the oscillator has been nicely supported by the zero line, indicating that momentum has been completely on the side of the trend. Most recently, we have seen two low-risk trend re-entry icons under price, with the last one coming on the most recent bar. The trend re-entry icon was accompanied by heavy volume. These are the first trend continuation icons since the Go trend was established, suggesting that there is more room to run.

The daily chart shows that price action has been a lot choppier than what you see on the longer time frame chart. While the absolute trend has been choppy, we know from the sector map that $XLB has outperformed the index on a relative basis for the entirety of last week. As you can see, $XLB ended the week in a fresh “Go” trend. It makes sense, therefore, to look for securities with a strong technical environment in this sector.

The daily GoNoGo Trend chart of $MDU displays a very strong technical environment. MDU Resources Group Inc. provides natural resource products and services to energy and transportation infrastructure companies. This is a materials ($XLB) stock that was well-positioned to take advantage of the strong trend in energy ($XLE) as well.
As the materials sector ($XLB) went into a “Go” trend on March 3rd, the GoNoGo chart for $MDU gave a green, low-risk entry signal which then saw strong follow-through from price action into the end of the week.
INVESTORS VOTE VALUE OVER GROWTH
Another major theme of the markets in 2021 is the rotation away from growth into value. We can see clear evidence of this move in the weekly GoNoGo Chart below depicting the ratio of $SPYV to $SPYG. Dividing the value ETF by the growth fund is an easy way to see the relative performance of one against the other. Look at the rate of change and the changing trend direction of this ratio. Value stocks have clearly underperformed growth stocks for the entire 2020 pandemic period and into 2021. The structural change underway is a dramatic rotation. Given the cap weightings of many growth names in the S&P index, it is understandable that some investors are surprised to hear that the US Equity market is still very bullish. The opportunities for trend-following have simply changed.
The chart below is a great example of what we expect to see from GoNoGo Charts as trend conditions change. GoNoGo Oscillator® leads the trend indicator by breaking above zero in late 2020 and then finding support at zero ahead of the change from NoGo purple bars, to amber, and finally a Go flag on aqua bars. We also see the GoNoGo Trend paint “Go” bars as price breaks out above key resistance.

Below we can look at the daily GoNoGo chart of the value stocks in the S&P 500 ($SPYV) in isolation. Look at how the past week was less of a correction and more of a sideways consolidation and we can see that GoNoGo Oscillator found support at zero on heavy volume. Also, we saw a low-risk re-entry icon under price on Friday, the second signal of the week.

Compare this to the GoNoGo daily chart of the S&P 500 growth stocks ($SPYG), presenting a stark contrast. GoNoGo Oscillator crashed below the zero line on heavy volume and has already retested zero, finding resistance. GoNoGo Trend fell out of the “Go” trend a week ago. The growth index has dropped sharply since and the chart is now painting strong NoGo bars.

BET ON BUFFETT
With all of the excitement and volatility we’ve experienced in this market amongst high-flying tech stocks and massive moves in the meme stocks, it feels more like Jimmy Buffett is the master of these markets than Warren Buffett?! Perhaps investing in Berkshire Hathaway could sound boring to some investors. But the chart is favorable right now, and we have outlined thoroughly the rotation away from growth and into value. See the daily GoNoGo chart of Berkshire Hathaway Inc ($BRK.B) below. You will notice a low-risk re-entry icon appearing again at the end of the week on heavy volume while in a “Go” trend. Why wouldn’t you bet on the greatest investor of our time?

TURNING TURQUOISE WITH ENVY
Turquoise Hill Resources LTD is a value stock in the materials sector. The chart below represents a strong argument to take advantage of both trends in a single name.

More importantly, this chart is set up to make a move. The “Go” trend was identified in February. After setting a new high, price corrected. The selling pressure of this correction caused GoNoGo Oscillator to drop to the zero line where we will look to see if it finds support. A rally back into positive territory on the oscillator would likely lead to a leg higher in price.


