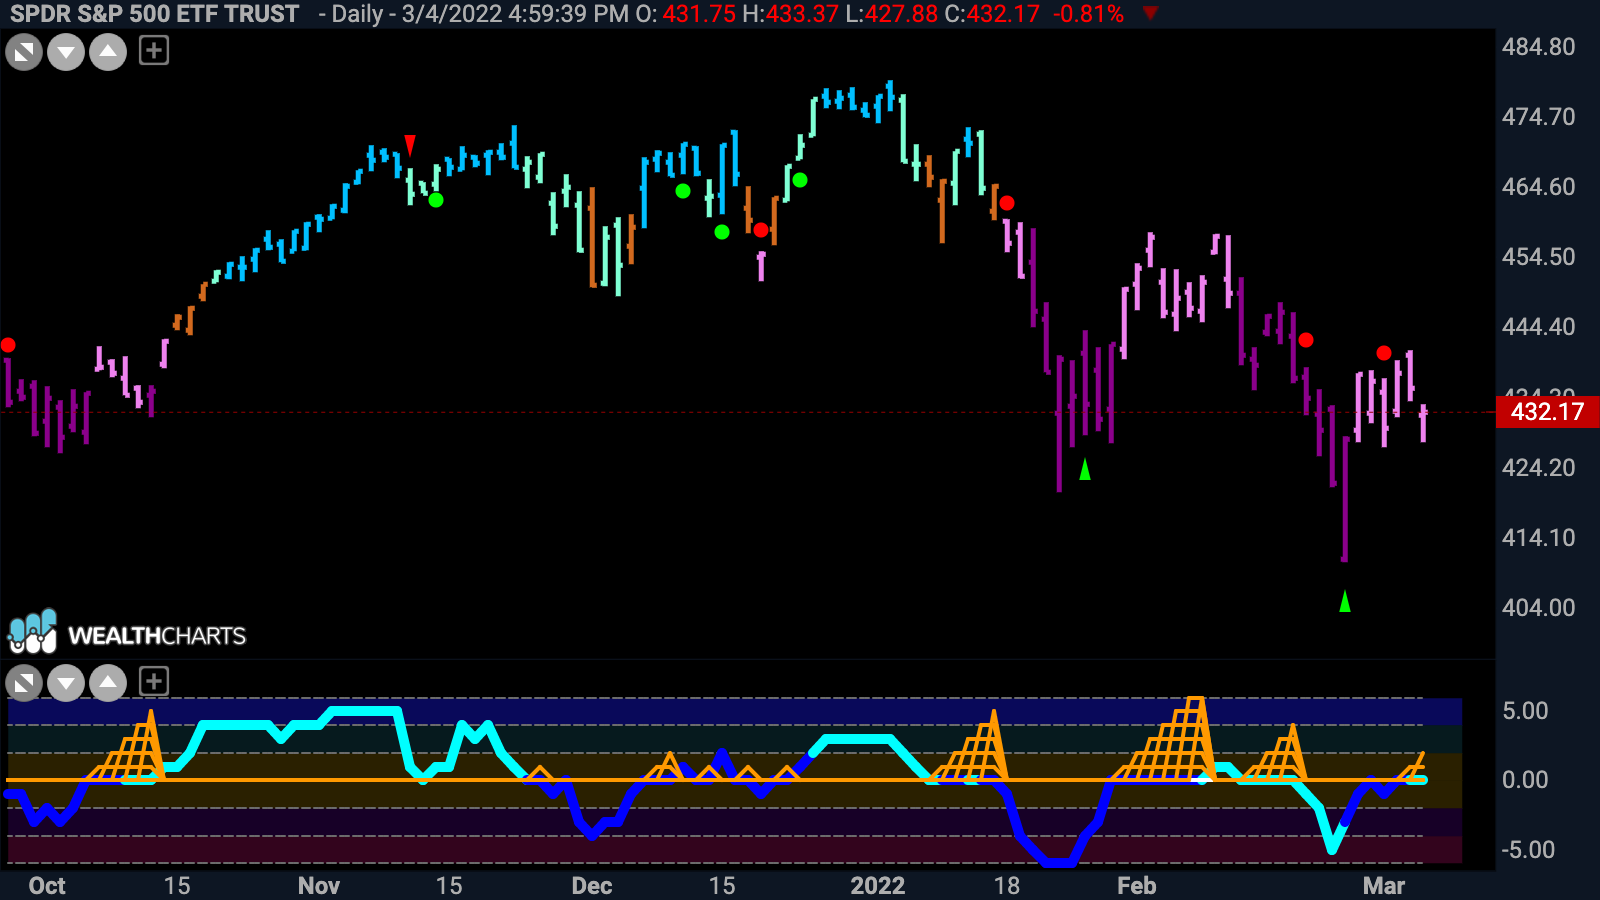

Welcome to your weekly GoNoGo Launch Conditions Chart Pack. We take a look at the major market trends across all asset classes to give an overall, technical view of market conditions. Even after a strong rally from the panic low last week, the weight of the evidence suggests that U.S. domestic markets are still in a “NoGo”. The chart below shows the GoNoGo Chart of $SPY. We are at another inflection point, as price seems to have set a new lower swing high and the GoNoGo Oscillator is testing the zero line once again from below. We will watch here to see what happens next. If the oscillator gets turned away again we can expect price to make another leg down and challenge last week’s low. If GoNoGo Oscillator can break out into positive territory, that would be a positive sign for those hoping that the worst is over.
To access this week’s Launch Conditions click here
It’s important to take a step back and assess whether the stories match the price trends. The GoNoGo Trend and Oscillator are applied across the major asset classes to give a complete technical picture of trend and momentum. Click here
Flip through your weekly Launch Conditions chart pack below


