
“Inflation is when you pay fifteen dollars for the ten-dollar haircut you used to get for five dollars when you had hair.” – Sam Ewing
For the holiday-shortened week ending Feb 19th, the large-cap benchmarks and technology-heavy Nasdaq Composite index hit record intraday highs before consolidating. The major indexes ended mostly lower for the week. The Nasdaq Composite fell 1.6%, the Russell 2000 fell 1.0%, and the S&P 500 fell 0.7%. The Dow Jones Industrial Average (+0.1%) ended the week slightly higher. Trading volumes continued to wane from January’s record levels but were expected to pick up again on Friday, following one of the largest option expiration dates on record.
View your weekly GoNoGo Launch Conditions 2-19.
An increase in longer-term interest rates weighed on fast-growing technology stocks by raising the discount rate on future earnings. The top-weighted information technology sector ($XLK) dropped 1.9%, which weighed heavily on index performance given the sector comprises about 28% of the S&P 500’s market capitalization. The health care (-2.5%), utilities (-2.0%), and consumer staples (-1.1%) sectors also posted noticeable declines.
However, the curve-steepening activity within Treasury rates was helpful to energy and financial stocks as growth/inflation expectations increased. The financial sector $XLF (+2.8%), while the energy sector $XLE (+3.1%) continued to rally from a low base. Oil prices were volatile after a winter storm forced many refineries in Texas to temporarily shut down.
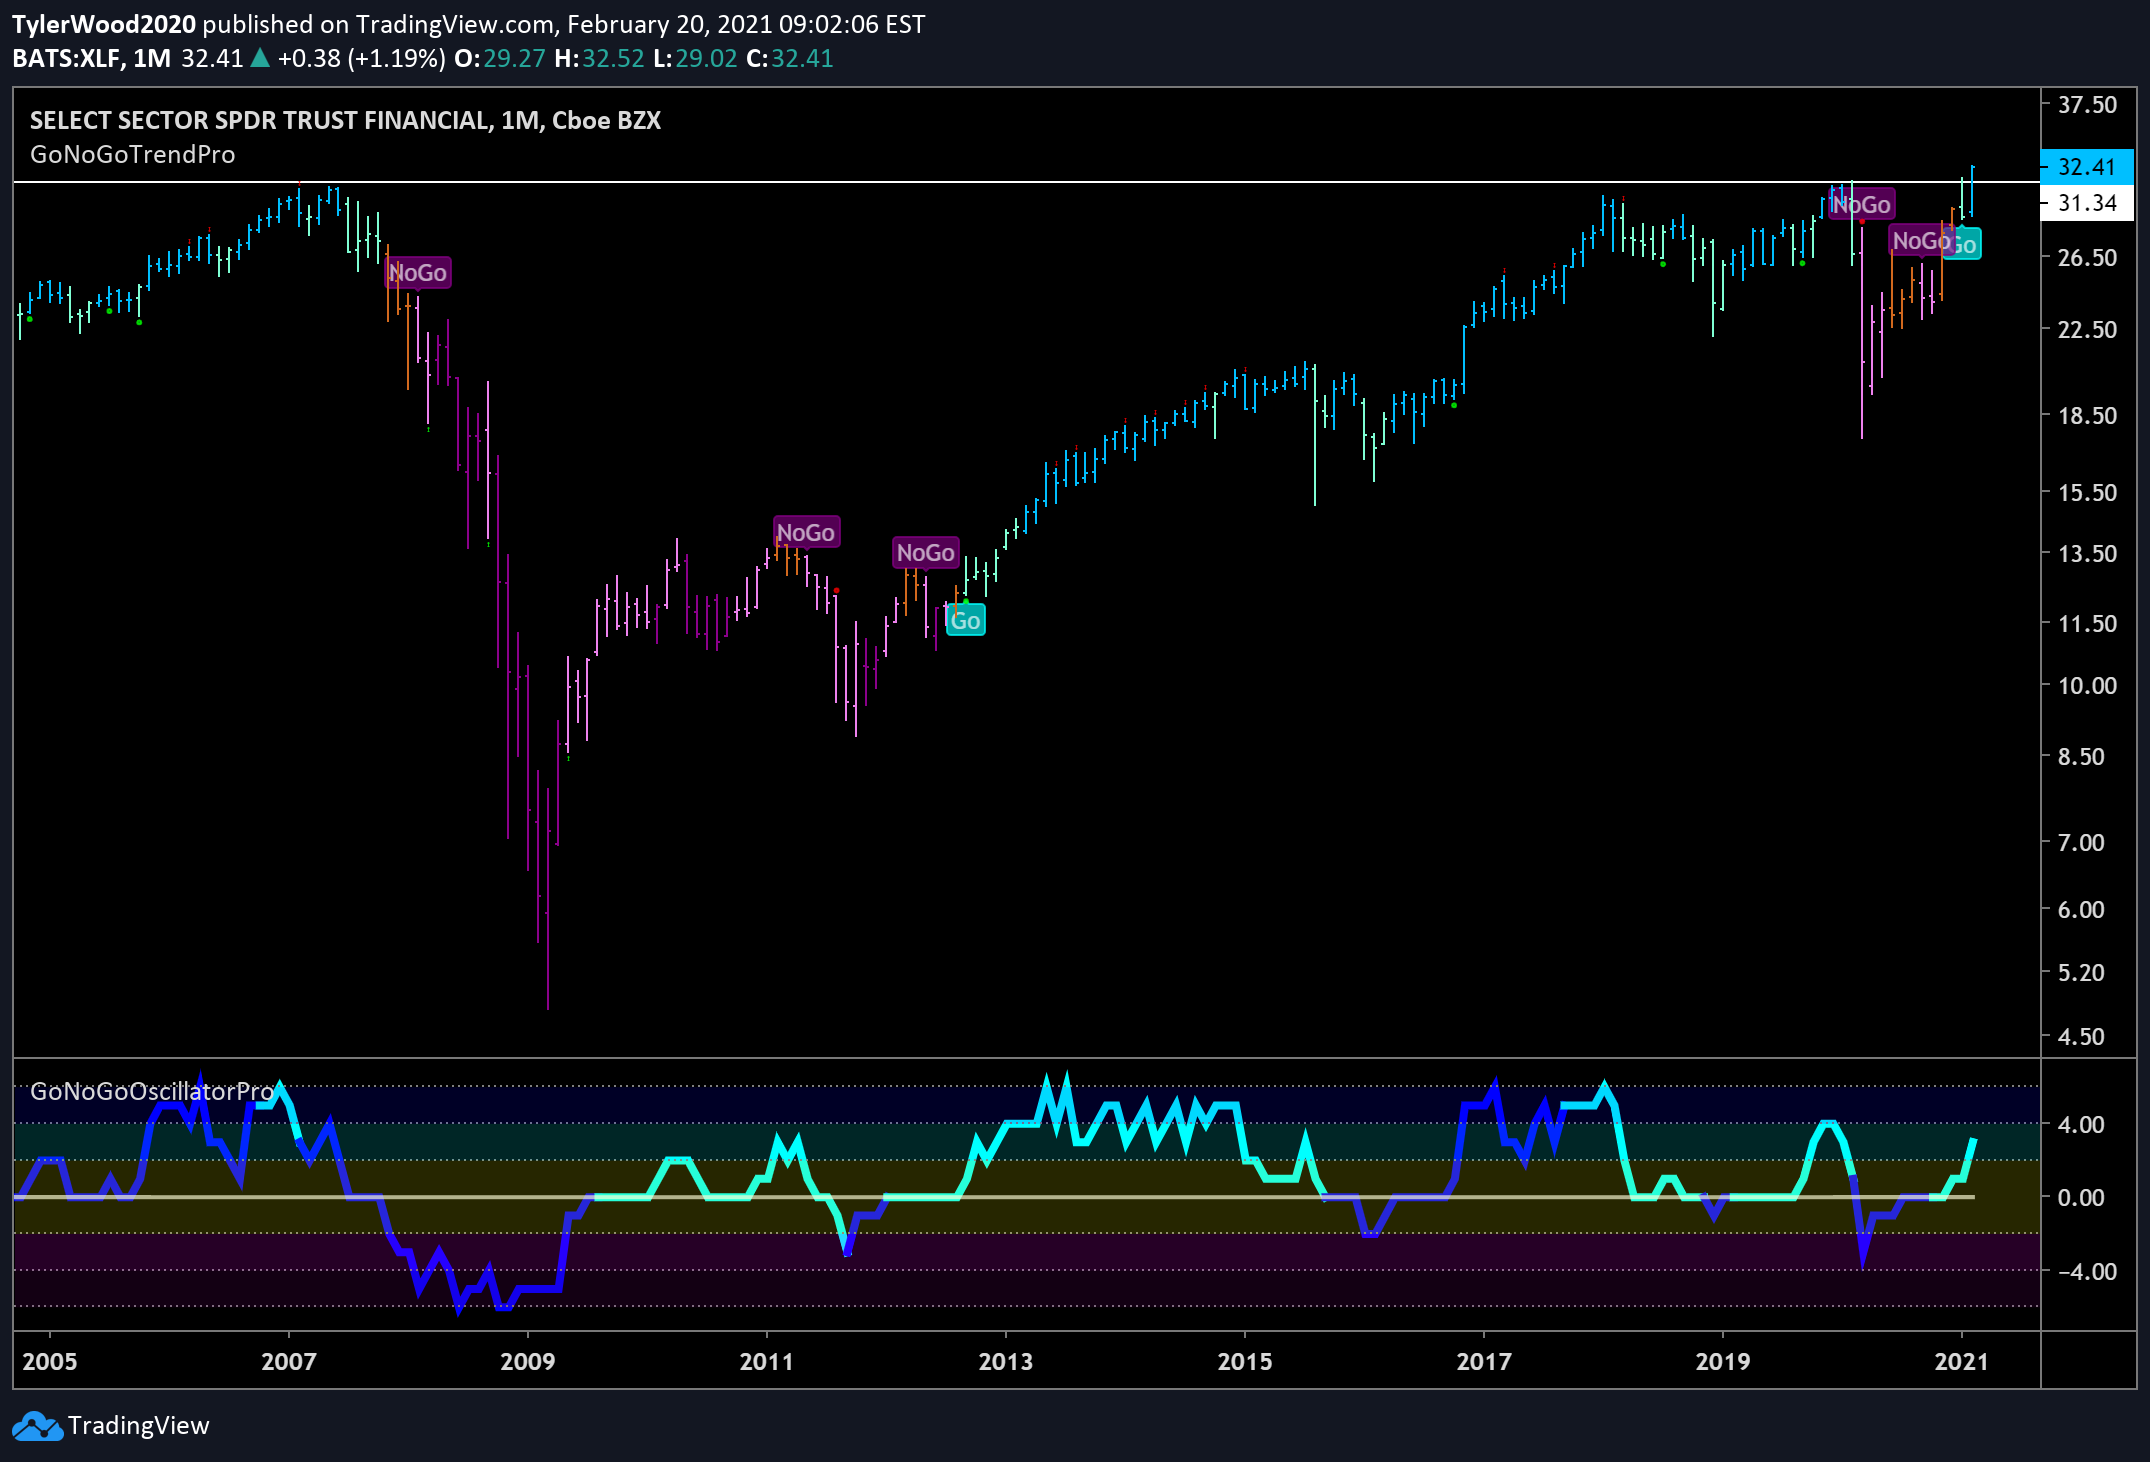
Higher rates increase lending margins for banks, and this catalyst sent the financial sector ETF, $XLF, breaking out to all-time highs. The largest stocks in this ETF include Berkshire Hathaway, JP Morgan, Bank of America, Wells Fargo, and Citigroup. The $XLF just recovered to highs not seen since the Great Financial Crisis. Look at the long-term monthly GoNoGo Chart below:

Interest rates are still low from a historical perspective, but the quick ascent in long-term rates raised valuation concerns this week. The 10-yr yield rose 15 basis points to 1.35% – meaning they have doubled from just last September. The 2-yr yield increased one basis point to 0.11%. While that trajectory may feel abrupt, it is crucial to remember that this brings 10-year interest rates back to where they were last February. Excluding the past year, the yield in 10-year Treasuries is still at the lowest level in history. “Higher” rates are not the same as “high” rates. See the long-term chart of $TLT in this week’s Launch Conditions Chart pack here:

Retail sales and producer inflation data for January exceeded expectations. The Labor Department’s report on Wednesday revealed that producer prices increased by 1.3% in January, the biggest increase since December 2009. Retail sales also jumped 5.3% in the month—well above consensus expectations for a 1.1% gain—which many attributed to USD 600 direct payments to lower- and middle-income Americans approved as part of the December stimulus package. However, this may be an indication of the pent-up consumer demand and savings that will power household consumption later this year, supporting above-average GDP growth ahead.
Meanwhile, the latest unemployment data painted the case for additional fiscal stimulus. Weekly jobless claims, reported Thursday, jumped to 861,000, the most since mid-January. Treasury Secretary Yellen reiterated the “think big” approach to stimulus, reports suggested that the U.S. will double its vaccine supply in the coming weeks, and earnings reports continued to beat expectations.
From a market behavior perspective, the S&P 500 did not post any significant moves this week, even though it closed lower in every session. This consolidation phase is characteristic of the market absorbing the higher rates and cyclical rotation without hurting overall risk sentiment.


