
“Parabolic advances usually carry further than you think, but they do not correct by going sideways.” ― Robert J. Farrell
Heading 2
Heading 3
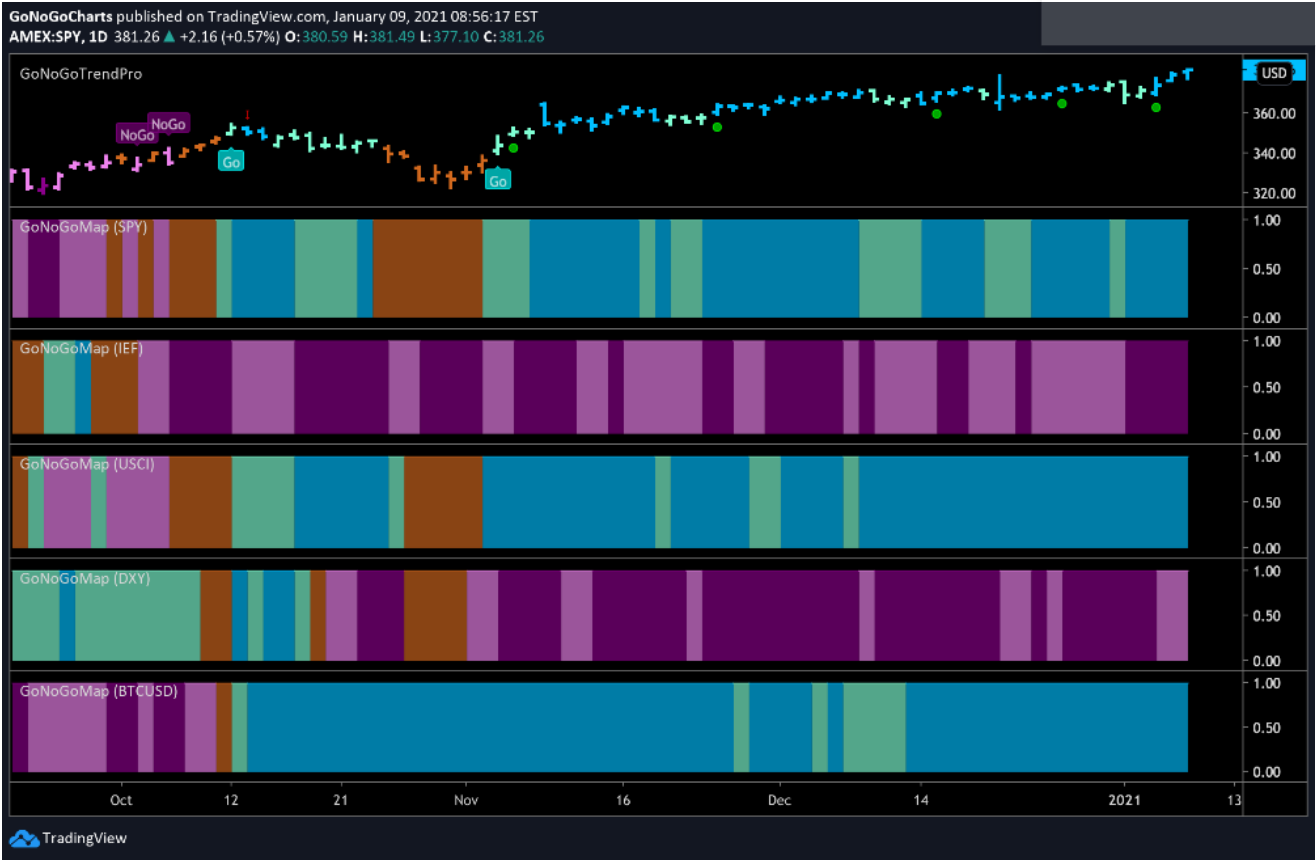
Welcome to your weekly edition of Launch Conditions, a global chart pack covering all asset classes. You will notice the addition of two new charts. The chartpack will now include a GoNoGo Heat Map to compare the trends across asset classes, as well as a GoNoGo RelMap. The RelMap highlights the trend of the relative strength ratio of each sector of the S&P against the index benchmark.
Before another hectic week kicks off, we hope you take a moment to flip through the sixteen GoNoGo Charts included in Launch Conditions weekly chart packs for a broad look at trends across major indices and asset classes to understand the broader context of the market environment.
View Your Weekly Chart Pack Here
Equity markets saw a strong start to the year globally, with major indexes hitting fresh record highs last week despite one of the most tumultuous weeks in the nation’s political history. Small-caps outperformed large-caps by a wide margin, and value stocks outpaced growth shares, signaling optimism around the outlook for the post-vaccine phase. Adding to the positive sentiment, WTI oil prices rose above $50, a level last seen in February. Energy stocks led the gains within the S&P 500 Index.
Ten-year yields moved above 1% for the first time in nine months. A surge in longer-term Treasury bond yields (rising yield = falling price) boosted financial shares by holding out the promise of improved lending margins, but rising rates weighed on the small real estate sector. It is noteworthy that $TLT is off to its worst start to the year since 2009, falling 4.3% in the first 5 trading days of 2021.
Heightened prospects for significant fiscal stimulus under the incoming Biden administration appeared to be a major factor driving investor sentiment this week. The astonishing assault on the U.S. Capitol on Wednesday afternoon seemed to unsettle markets, but only moderately—the Cboe Volatility Index (VIX) briefly spiked from around 22 to nearly 27 but remained below its levels from earlier in the week. On Thursday, the focus seemed to return to the anticipated fiscal impetus, helping lift the S&P 500 to its best daily gain since late November, while the tech-heavy Nasdaq Composite Index surged 2.6%.
We hope you enjoy scanning through this week’s Launch Conditions Chart Pack for the week ending January 8, 2021.

Utilizing only the GoNoGo Trend® and GoNoGo Oscillator® custom indicators, the chart pack reveals a clean clear picture of the strength and direction of the trend without obscuring the most important indicator of all…PRICE! This macro perspective is designed to provide a high-level view of cross-asset trends of strength and weakness.
If you find value in these charts, please share them with colleagues, clients, and friends.
We have created multiple resources documenting the creation and function of each indicator in the suite of tools. Click here if you would like to learn more about the GoNoGo Trend®. Click here if you would like to learn more about the GoNoGo Oscillator®. The interaction of the GoNoGo Oscillator with the zero line is vitally important to the GoNoGo Charts suite of tools and indicators. Click here if you would like to read more about this concept.
Stay tuned Monday morning for Flight Path, a weekly newsletter that drills into the strongest opportunities for trend-following investors with deeper analysis using GoNoGo Rel Maps, GoNoGo Squeeze, and low-risk entry signals on sectors and individual securities with strong trend, momentum, price action, and relative strength.
Thank you for your continued interest in GoNoGo Charts. We hope this information is helpful as you develop your own investment process. Please note this publication is for information, education, and entertainment purposes only. None of the content within is to be construed as investment advice or recommendations. If you are not yet using GoNoGo Charts in your own analysis, please visit our site and provide your Trading View ID for us to enable your free trial.
Better Charts. Better Decisions.
Alex & Tyler


