The major indexes continued to move to record highs early in the week before retreating as stocks lost their positive momentum from the previous week. The three major U.S. indexes – S&P, Dow, and Nasdaq – recorded modest declines of less than 1% for the week ending March 19, 2021. The S&P 500 has not sustained moves in either direction since mid-February, while the Russell 2000 diverged. After surging more than 7% the previous week, the U.S. small-cap benchmark index declined nearly 3%, underperforming large-cap indexes. It is important to note that, taking into account this week’s profit-taking, the Russell 2000 is still up more than 50% over the prior six months.
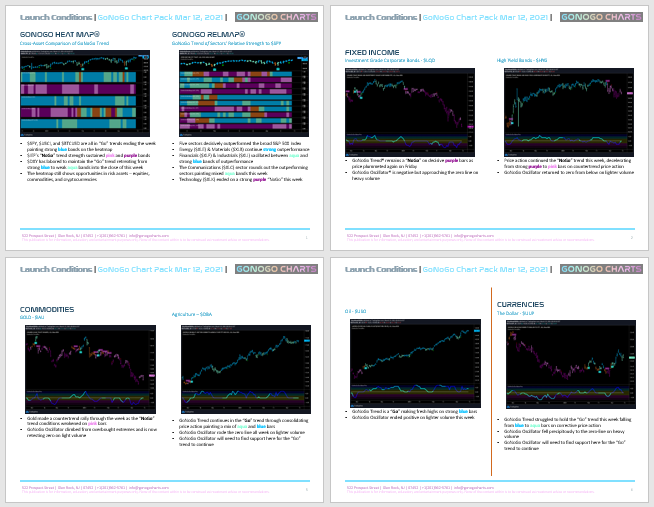
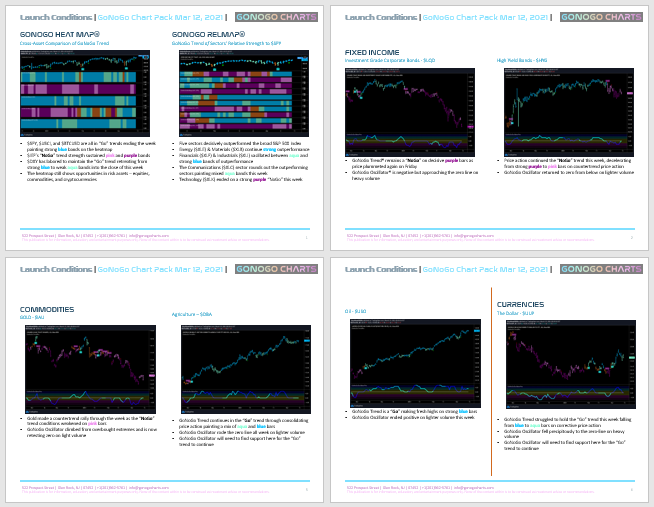
Welcome to your weekly review and long-term perspective on the markets. Click below to open your GoNoGo Launch Conditions 3-19

After a strong first quarter, the energy sector, which dropped 7.7% this week, was also a target of profit-taking activity. Energy stocks fell sharply as oil prices saw their biggest daily drop since the summer, seemingly driven by rising U.S. inventories and concerns about demand drop in Europe. WTI crude futures fell 6.3% to $61.45/bbl amid some lingering concerns about the recovery in global oil demand due to rising coronavirus cases, renewed lockdowns, and slow vaccine rollout across the Eurozone.
While equity markets stalled in the face of accelerating Treasury Yields, Jerome Powell forcefully communicated the central bank’s dovish monetary stance. Policymakers affirmed that they anticipated no rate hikes until 2023, along with their confidence that any increase in inflation will prove short-lived. Maintaining the current pace of asset purchases and meaningfully upgrading projections for economic growth in 2021 supported the Fed’s position that there was still room to run in the economic recovery.
On Thursday, President Joe Biden announced that the U.S. would reach 100 million coronavirus vaccinations by the next day, well ahead of earlier targets. The US is even preparing to lend doses to Canada and Mexico.
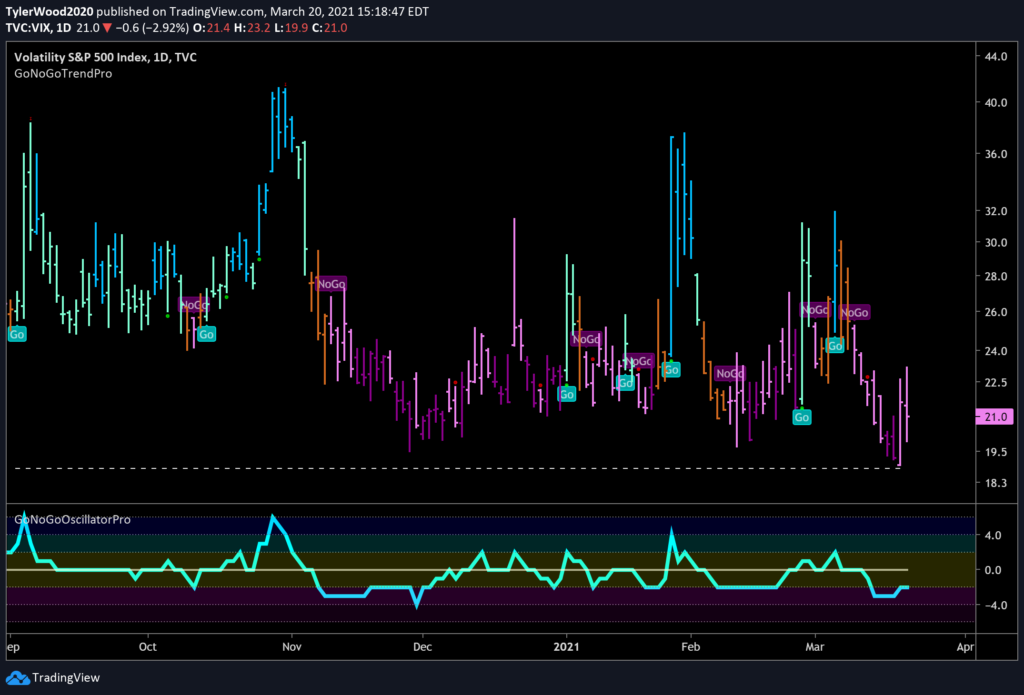
Although the U.S. stock market has recently seen some significant daily moves, a measure of investors’ expectations of short-term volatility has slipped to the lowest level in over a year. On Wednesday, the Cboe Volatility Index closed at 19.2—the lowest since the pandemic triggered a spike in volatility. See the chart below of $VIX:

Volatility continued to wane this week in the “NoGo” trend on strong purple bars, before Thursday’s countertrend rally painted in pink. GoNoGo Oscillator remained negative on lighter volume.
March 23 marks the one-year anniversary of the stock market bottom and the end of the shortest bear market on record. We appreciate you taking the time to step back and review the longer-term trends with GoNoGo Launch Conditions weekly chart pack research.


