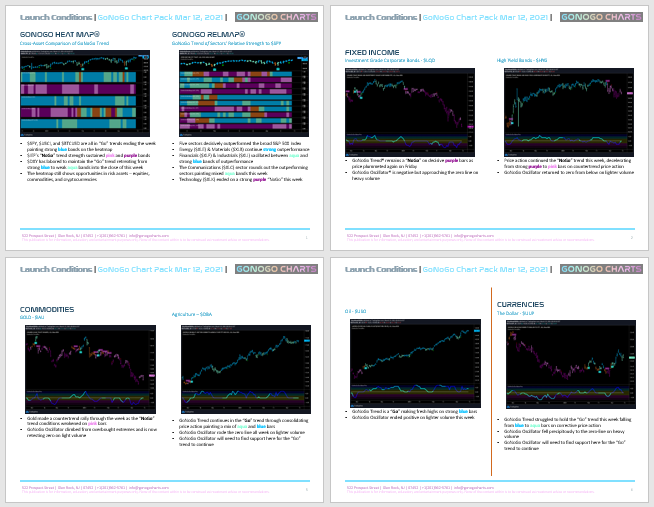
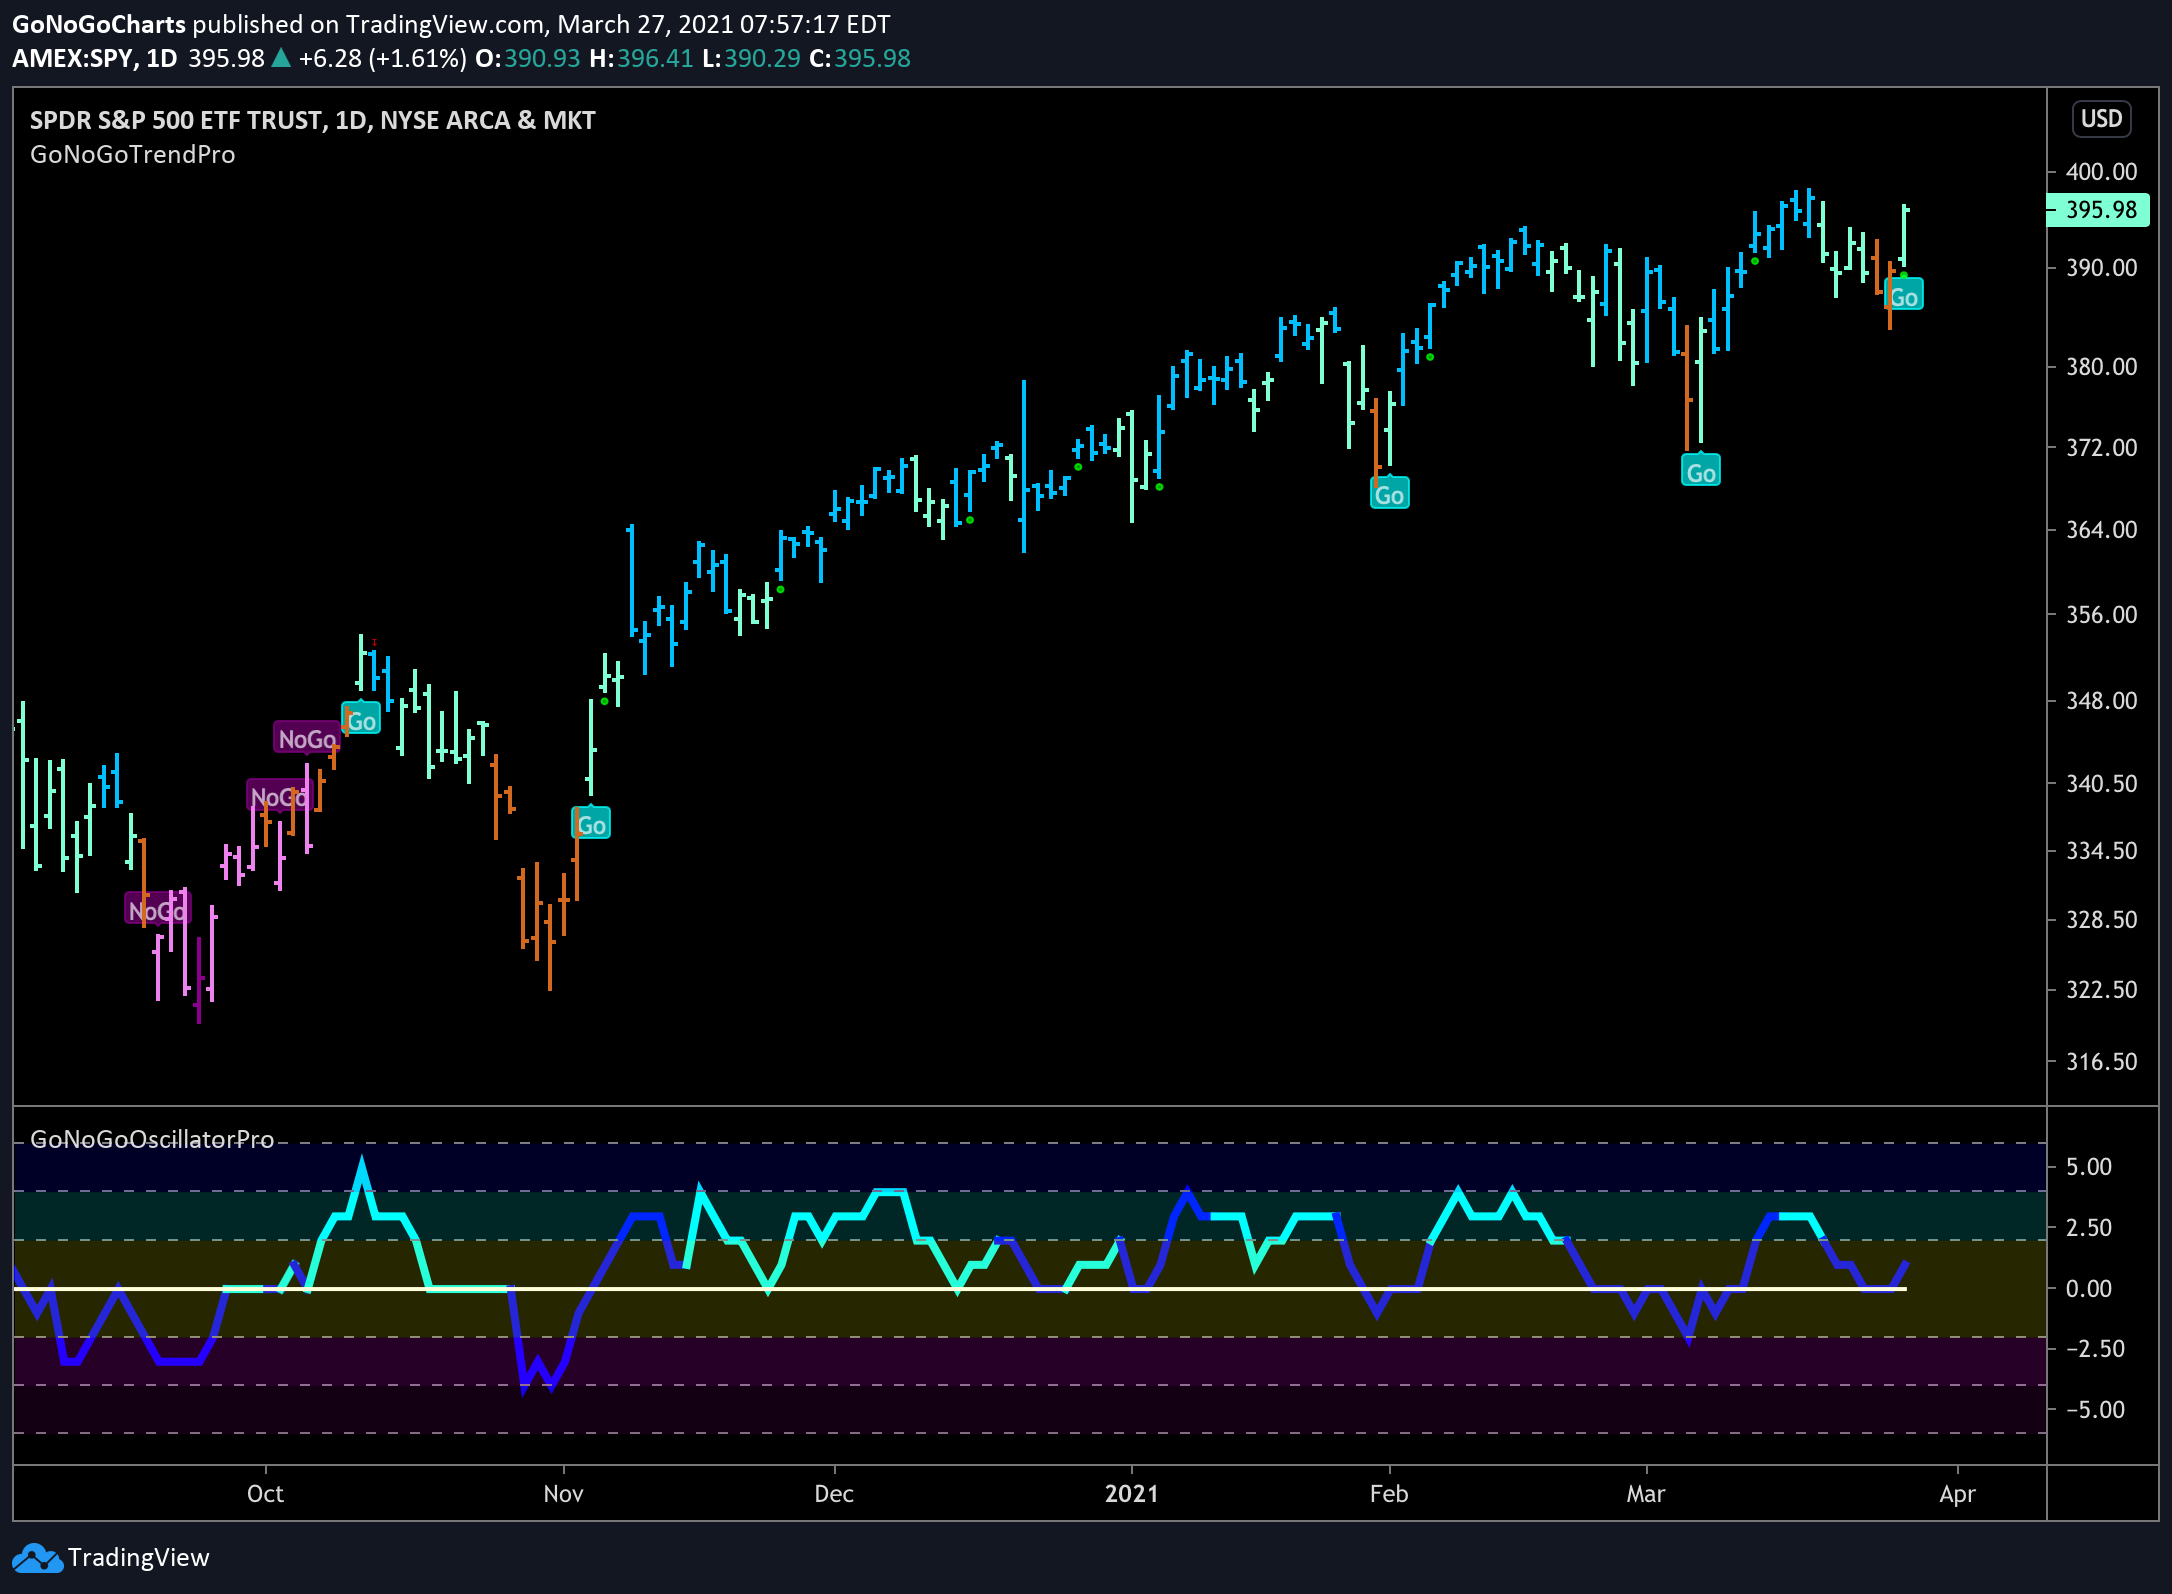
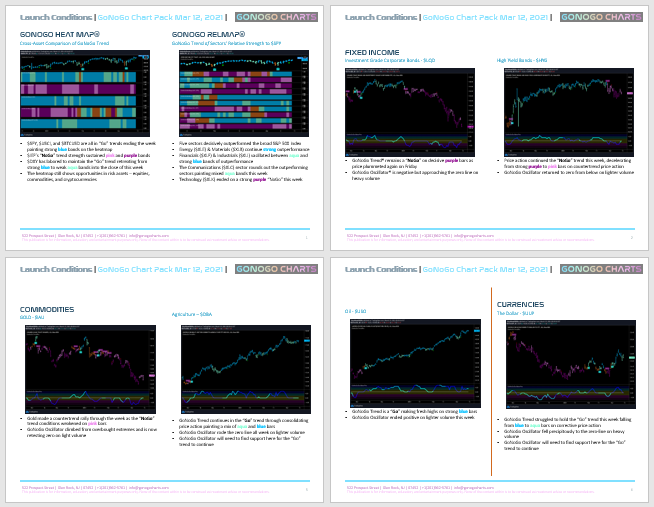
The $S&P 500 managed to maintain its “Go” trend this week after spooking investors with an amber bar of uncertainty on Thursday. Although we have noted bearish divergence between the GoNoGo Oscillator and price over recent weeks, the equity index finished the week strongly with a new “Go” bar and with the GoNoGo Oscillator bouncing off the zero line back into positive territory. Elsewhere, we saw a different picture. The NoGo trends in small cap and emerging markets continue. Outside of equities we see the dollar performing strongly racing to new highs as the “Go” trend strengthened this week. Perhaps this is why we also see the first signs of weakness in commodities as $USCI paints an amber “GoFish” bar on the GoNoGo Asset Class heat map.
Welcome to your weekly review and long-term perspective on the markets. Click below to open your GoNoGo Research Weekly Chart Pack

Having seen equity markets start to struggle over the past few weeks, with the S&P 500 moving barely higher while small cap and emerging market stocks have seen “Go” trends deteriorate into “NoGo” environments, we ask where the opportunities lie. There is outperformance to be found, as seen in the GoNoGo Sector RelMap in this issue of Launch Conditions. Sectors that are positioned to thrive in a reopening economy are the leaders. With President Biden upping his goal to 200 vaccinations this week in his first 100 days in office that theme looks set to continue. In addition, this week saw the utilities sector try to start a “Go” trend, joining materials, industrials, energy, financials and consumer staples .
In the face of a rising dollar, rising treasury yields, stalling stocks, we see volatility continuing to plummet, this week with $VXX making a new low. This will be an interesting dynamic to watch in the upcoming weeks.
See the below chart of the $SPY pulled from this week’s chart pack, showing how the week was looking ominous for U.S. large cap equities before a strong end to the week propelled the index back into a “Go” trend.

We appreciate you taking the time to step back and review the longer-term trends with GoNoGo Research Weekly Chart Pack.


