
“Volatility is the intersection of insolvency and illiquidity.” – Chris Cole, CIO Artemis Capital
Welcome to your weekly edition of Launch Conditions, a global chart pack covering all asset classes.
Before another hectic week kicks off, we hope you take a moment to flip through the sixteen GoNoGo Charts included in your Launch Conditions weekly chart pack for a broad look at trends across major indices and asset classes to understand the broader context of the market environment.
This week, we are also including the chart pack of monthly GoNoGo Charts as this week’s trading session also brought the month of March to a close. It is very easy to become emotional about our fear or greed in reaction to choppy price action. Be careful not to assign too much meaning to a strong/weak day or the headlines about any given security or sector. GoNoGo Research is designed to help you understand current market activity within the context of the long-term and relative trends.
There are only 12 of these special Monthly Launch Conditions each year. Below you will find 16 monthly charts that represent everything that’s trending around the world including Equities, Interest Rates, Commodities, Currencies, and Digital Assets. This weekend, take a step back from the news, zoom out to a larger timeframe, and put things into context.
View Your Weekly Chart Pack Here – GoNoGo Launch Conditions 4-02
View Your Monthly Chart Pack for March 2021 Here – GoNoGo Launch Conditions March 2021
WHAT DO WE DO NEXT?
Market price action has been anything but tame in recent weeks, however, there is a tremendous weight to the evidence that markets around the world are in healthy “Go” trends, breaking out to new highs after years of attempts to break above resistance. The brief leadership of defensive sectors such as Utilities ($XLU) and Consumer Staples ($XLP) was a potential warning sign for risk-off investor behavior.
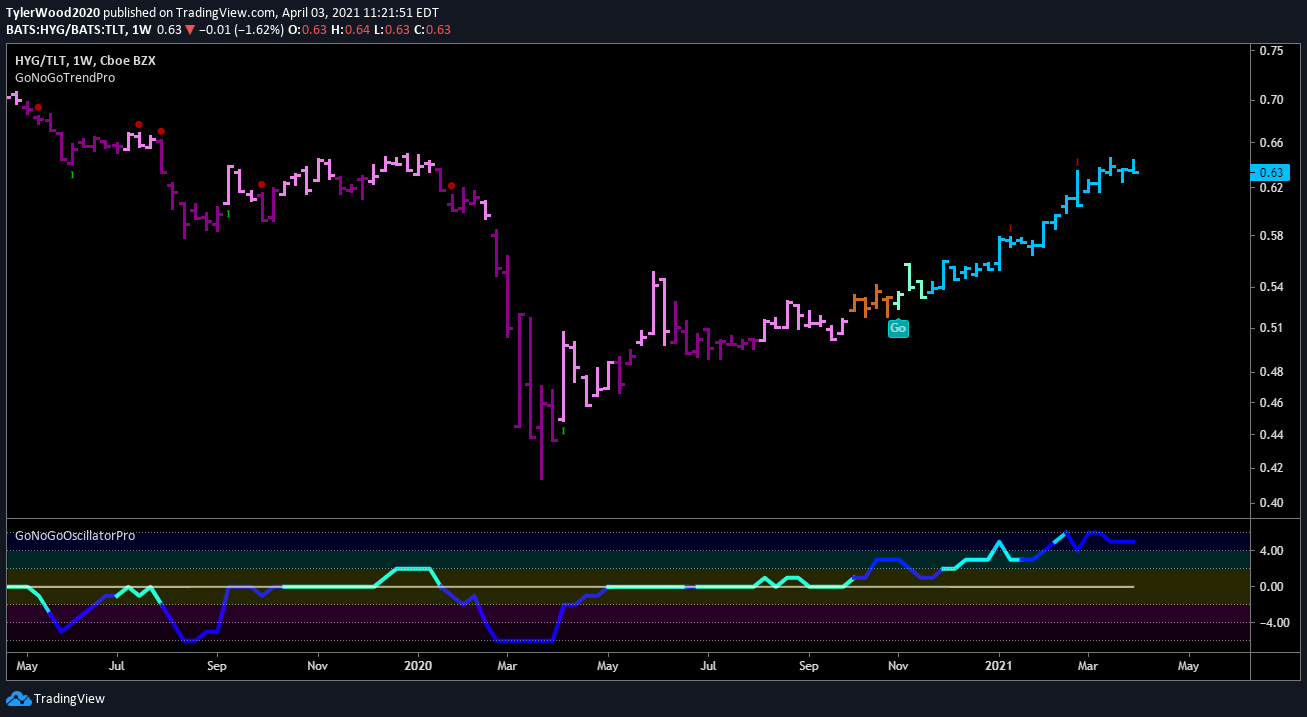
Most importantly, technical analysis is a discipline designed to force investors to listen to the market and act accordingly. Some analysts say the bond market is where the smart money is. One important relationship we’re listening to is the relative ratio of junk bonds to US treasury bonds. From a long-term weekly perspective, this has provided a good sense of risk-on appetite in the bond market. See the weekly GoNoGo Trend Chart below:

For executing trades, it is important to get into shorter time periods and more granular detail on single securities. However, GoNoGo Research includes weekly and monthly chart packs to help investors and traders keep their eye on what Charles Dow believed was the most important information of the market – the primary trend.
BETTER CHARTS. BETTER DECISIONS.


