
“The main purpose of the stock market is to make fools of as many men as possible.”
-Bernard Baruch
Welcome to your weekly edition of Launch Conditions, a global chart pack covering all asset classes.
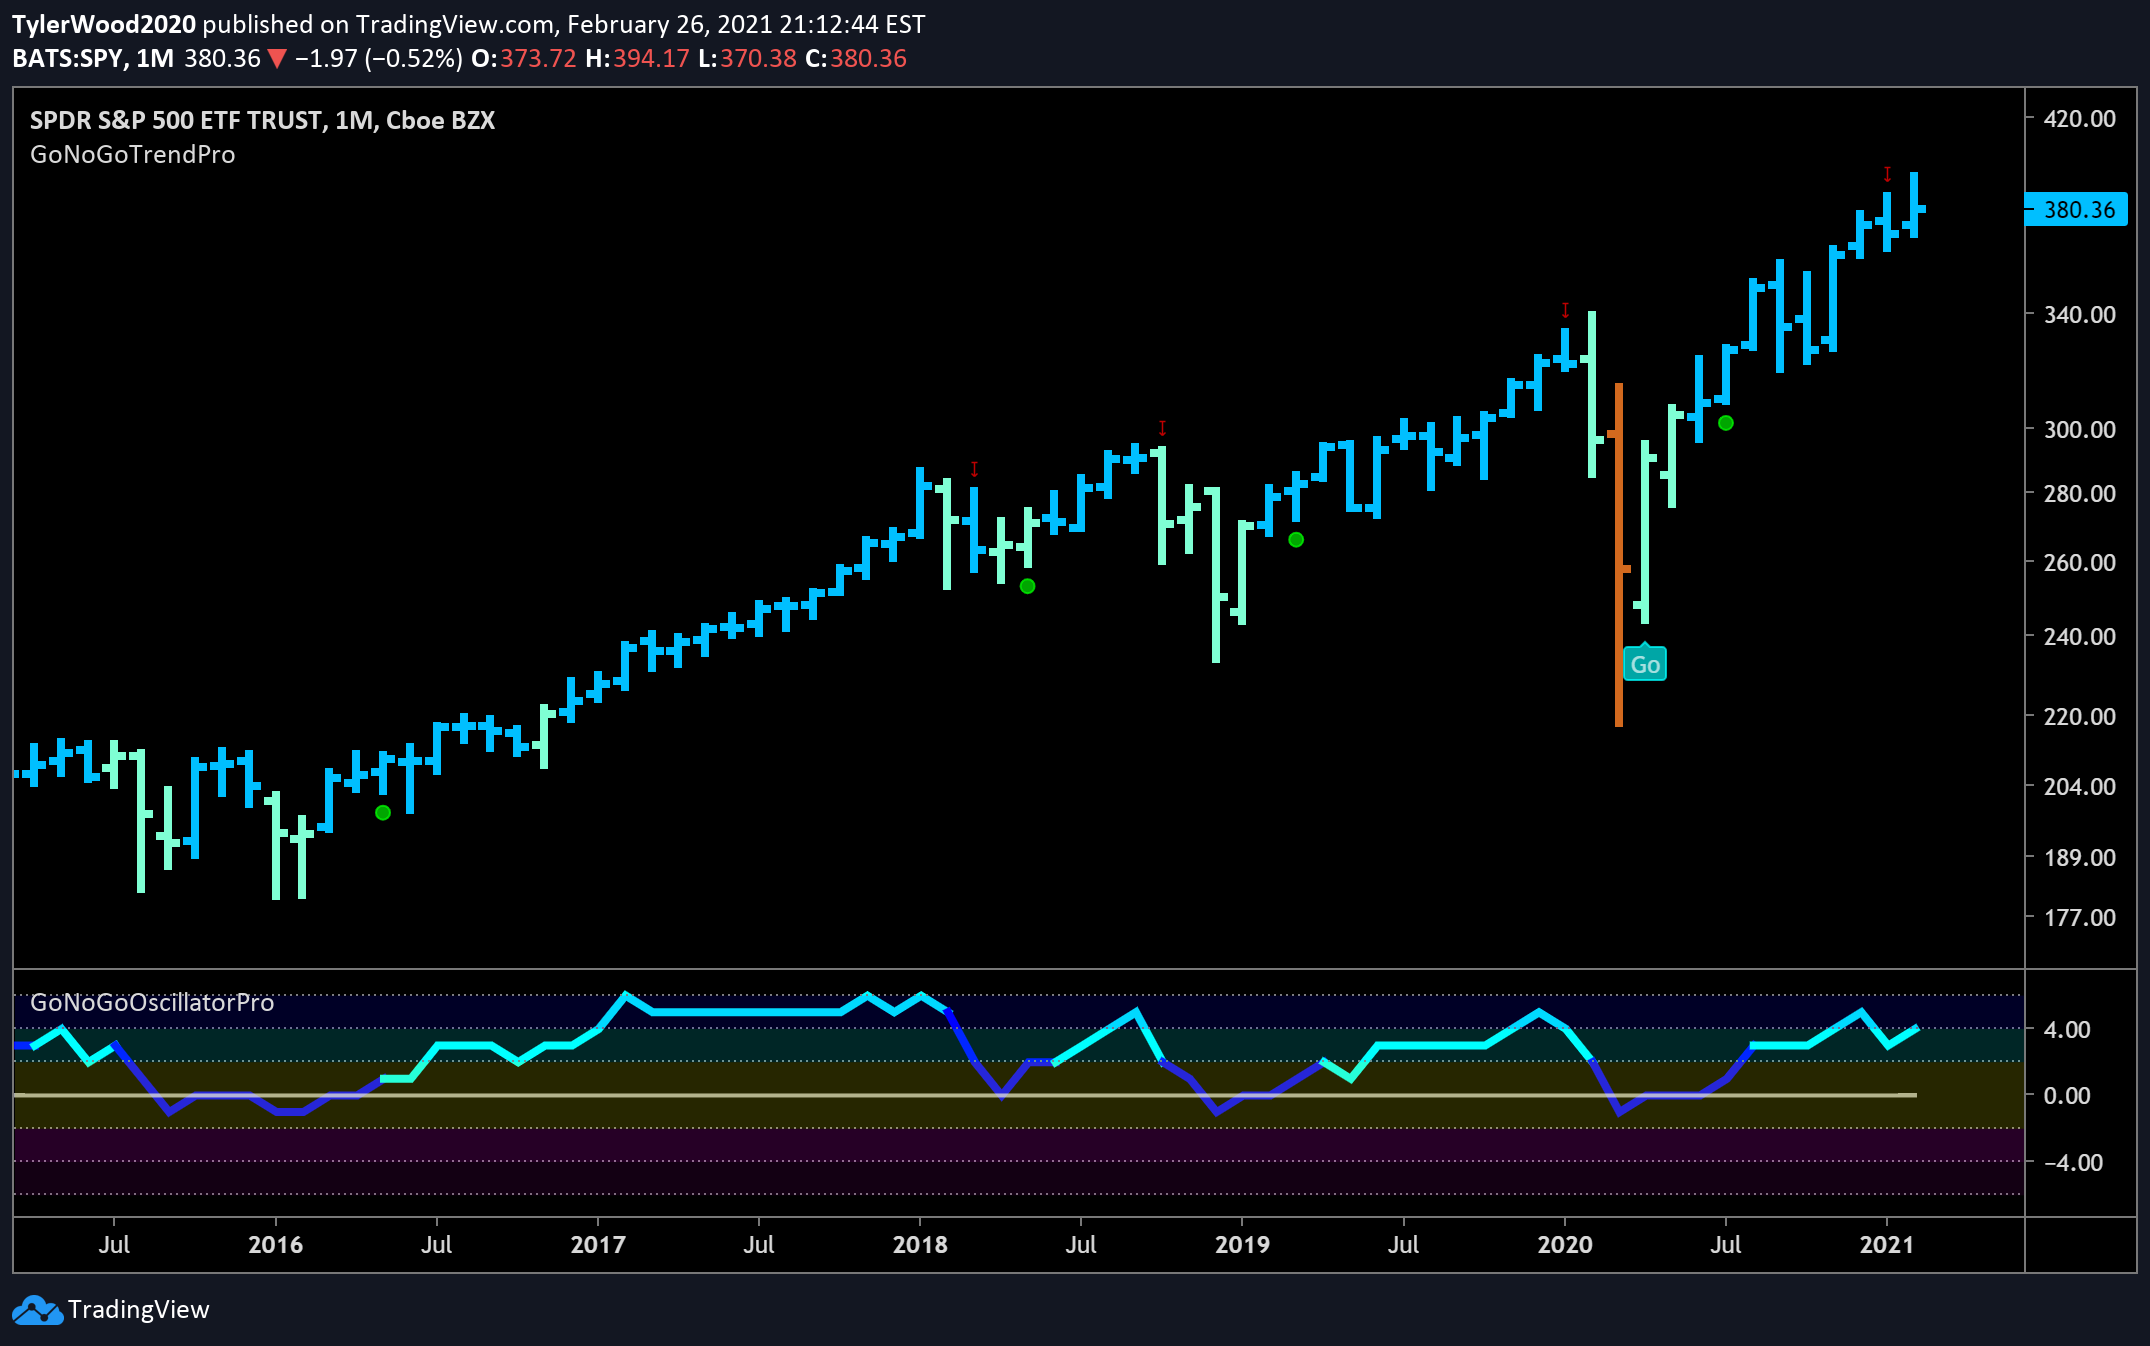
Before another hectic week kicks off, we hope you take a moment to flip through the sixteen GoNoGo Charts included in your Launch Conditions weekly chart pack for a broad look at trends across major indices and asset classes to understand the broader context of the market environment.
This week, we are also including the chart pack of monthly GoNoGo Charts as this week’s trading session also brought the month of February to a close. It is very easy to become emotional about our fear or greed in reaction to choppy price action. Be careful not to assign too much meaning to a strong/weak day or the headlines about any given security or sector. GoNoGo Research is designed to help you understand current market activity within the context of the long-term and relative trends.
There are only 12 of these special Monthly Launch Conditions each year. Below you will find 16 monthly charts that represent everything that’s trending around the world including Equities, Interest Rates, Commodities, Currencies, and Digital Assets. This weekend, take a step back from the news, zoom out to a larger timeframe, and put things into context.
View Your Weekly Chart Pack Here – GoNoGo Launch Conditions 2-27
View Your Monthly Chart Pack for February 2021 Here – GoNoGo Launch Conditions Monthly Feb 2021
The major benchmarks pulled back sharply in response to a steep rise in longer-term Treasury interest rates. It was an ugly week for the Nasdaq Composite, which dropped 4.9%, its deepest decline since October. The S&P 500 fell 2.5%, the Russell 2000 fell 2.9%, and the Dow Jones Industrial Average fell 1.8%.
Consumer discretionary shares were particularly weak. The $XLY sector ETF was dragged lower in part by a sharp selloff of Tesla shares. Steep corrective selling in Apple shares weighed on the technology sector, $XLK. The continued rotation into cyclical shares only accelerated as vaccine progress fueled optimism about the reopening of the global economy. Value stocks outpaced growth stocks again this week, placing their relative returns far ahead of growth for the year so far. Energy stocks outperformed as the sector ETF ($XLE) gained 4.3%. Oil prices rose nearly 4% again this week to $61.45 per barrel.
GoNoGo Research shared our perspective that the steepening yield curve is a sign of economic resurgence and will generally be a tailwind to equity trends. This week’s choppy price action is tied to those treasury yields to the extent that investors are sensitive to the pace of steepening yield curves. The yield on the 10-yr Treasury note briefly spiked to 1.61% this week, which was above the S&P 500’s dividend yield of 1.51% and 52 basis points higher than where it started the month. This sharp move higher in government-bond yields unsettled equities, as it narrowed the excess return investors expect to receive from investing in equities over risk-free government bonds, also known as equity risk premium. This spread remains positive in favor of equities. The 10-yr Treasury yields settled the week at 1.46%, but currently sits near the lowest levels over the last 10 years.
Take a look at the GoNoGo Asset Class Heat Map below. $SPY, $USCI, and $BTCUSD are in “Go” trends painting aqua and blue bands on the heatmap. $IEF’s “NoGo” trend strength accelerated this week on purple bands.
Interestingly, $DXY is painting amber “Go Fish” bars as the “NoGo” trend has faltered at the close of last week’s choppy session. A weak US Dollar has been a tailwind to many of the “Go” trends for risk-on equity opportunities around the globe and we offer that the path of least resistance for the US Dollar is lower. The heatmap shows that risk assets remain the strongest “Go” trends.


