
“5/1 risk/reward ratio allows you to have a hit rate of 20%. I can actually be a complete imbecile. I can be wrong 80% of the time and still not lose.” – Paul Tudor Jones
The major indexes notched a second week of gains and reached record highs. Communication services ($XLC) stocks outperformed in the S&P 500 Index. Rising oil prices helped the energy sector ($XLE) continue strong relative strength leadership. Weakness in Amazon.com and Tesla weighed on the consumer discretionary sector ($XLY) dropping its relative trend against the S&P to amber. Mid- and small-caps added to their substantial year-to-date lead over large-cap stocks, and value shares also outperformed. The major indexes moved within a narrow range for much of the week. See the GoNoGo RelMap below of the sectors relative performance against the S&P benchmark index:

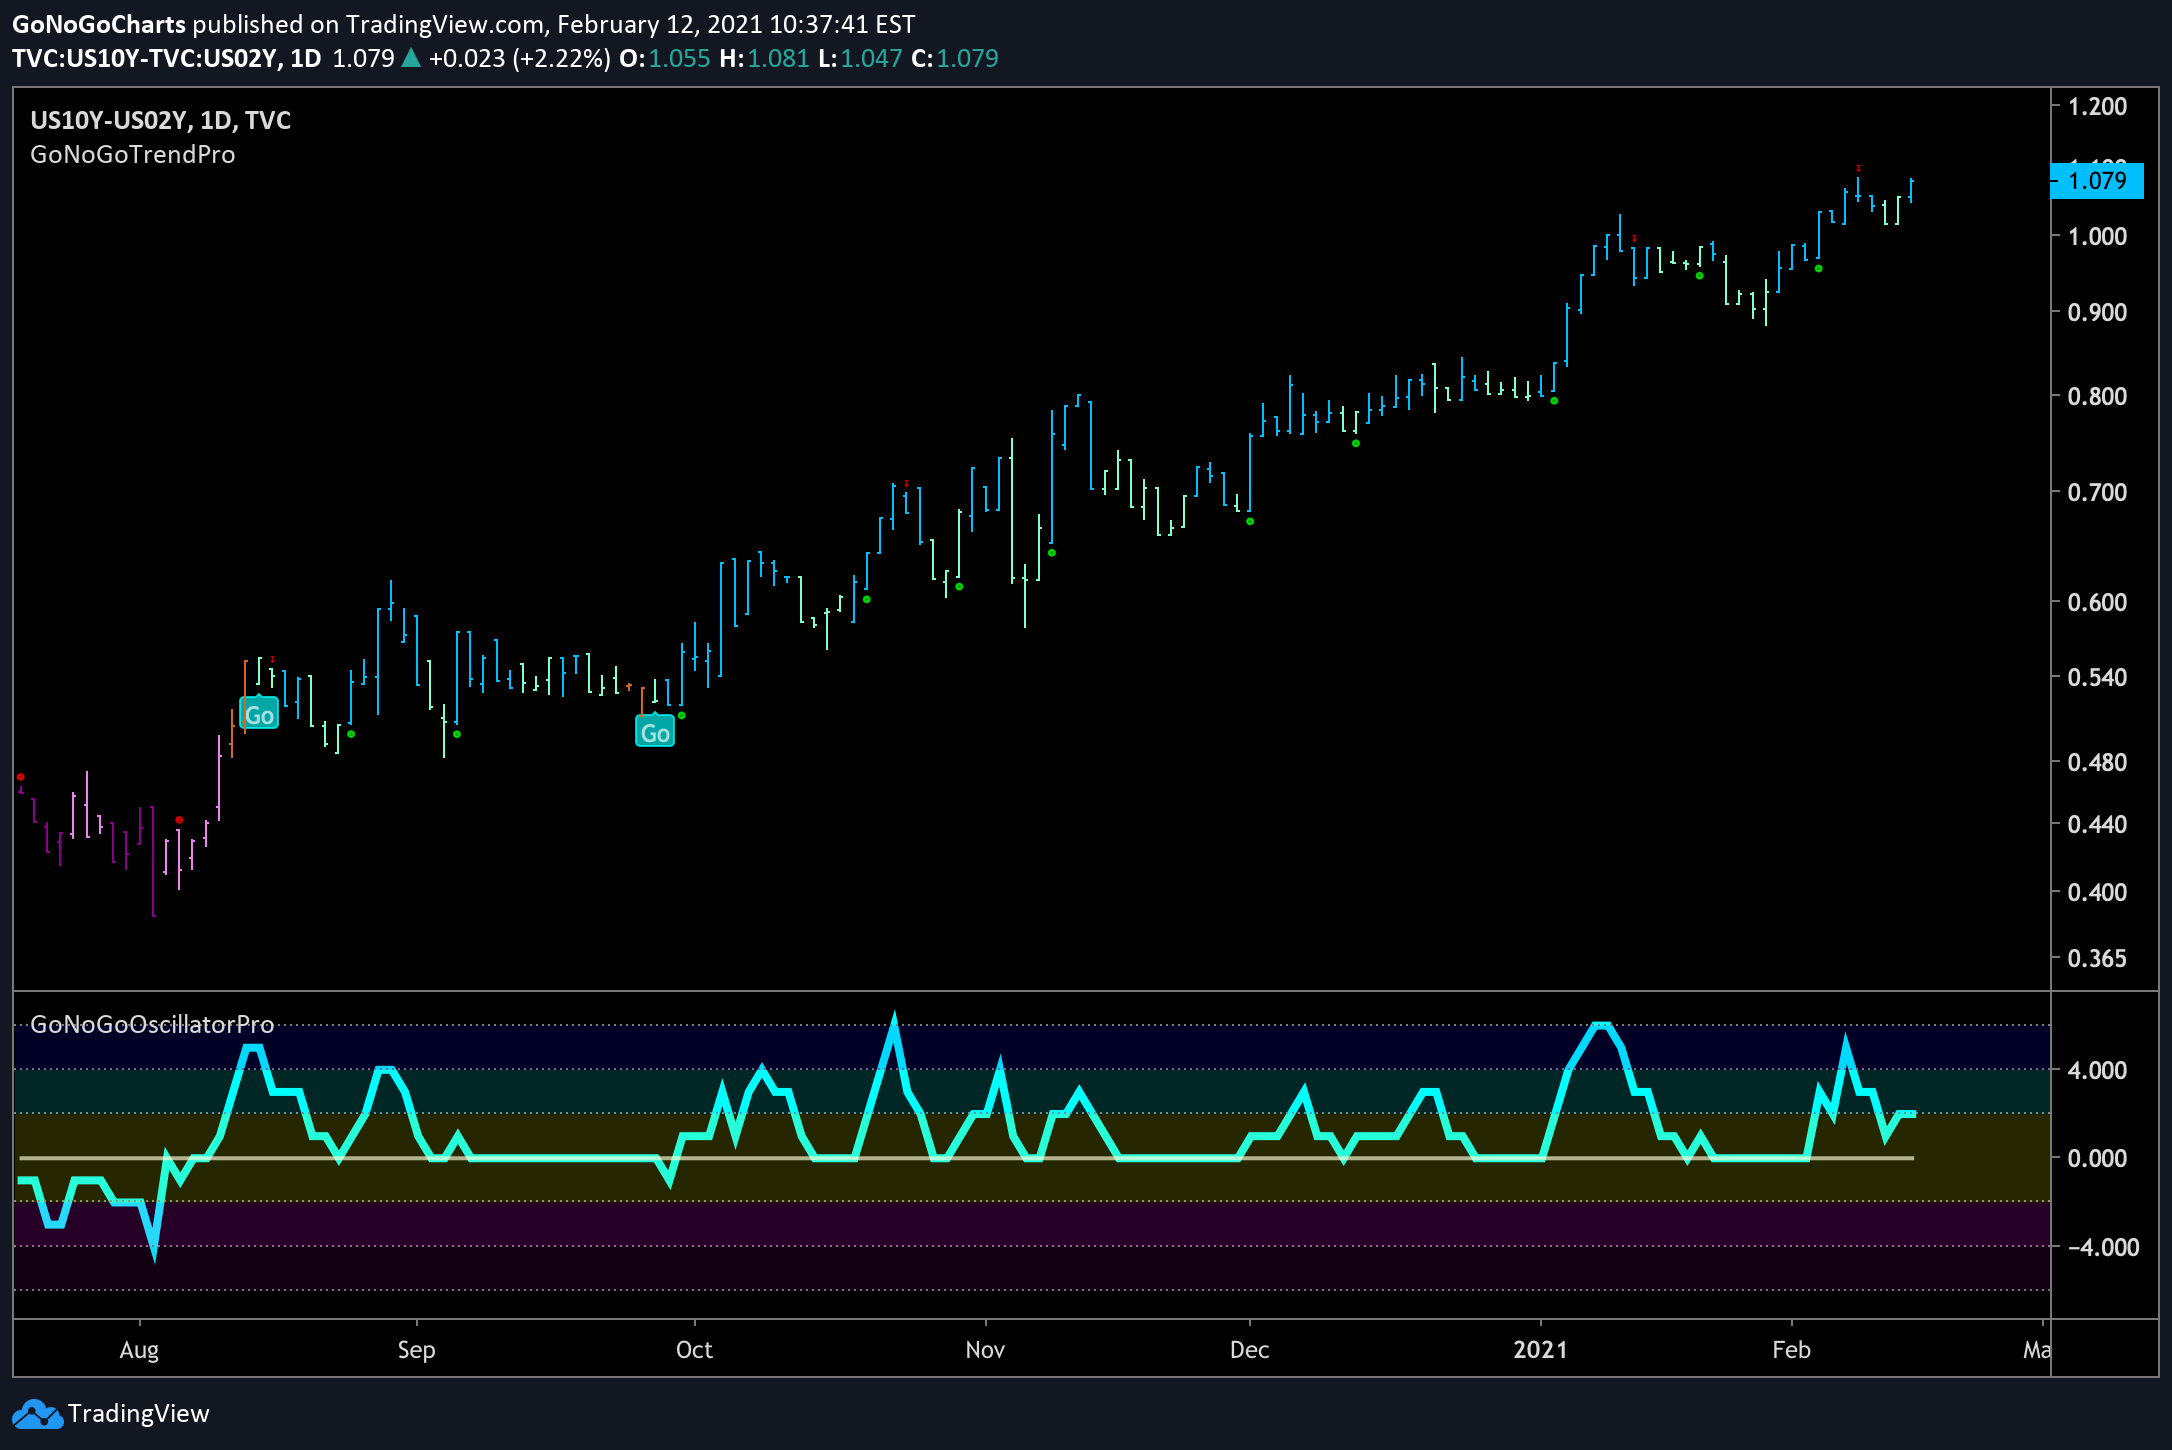
Strong earnings growth and the increasing likelihood of additional fiscal stimulus paint a very positive backdrop for equity investing broadly. Along with equities, bonds also marched to multi-month highs but paused midweek as investors weighed the implications of the latest inflation data. While measurable inflation currently remains low, market expectations for future inflation rose to the highest level since 2014, and the 30-year Treasury bond yield reached 2% for the first time in a year. The push higher in rates has been focused mostly on the longer end of the Treasury yield curve. Yields have marched higher for the 10-year Treasury notes over the past six months and investors are watching the 2-year / 10-year spread which has also made a significant move. Below you can see a GoNoGo Trend chart of the US 10-year Treasury yields to the 2-year notes. This depicts a steepening yield curve which simply means that the spread between long- and short-term interest rates is widening. This is typically taken as a sign of economic growth, rising inflation expectations, and should be a positive for stocks going forward.

Many economists and Wall St. analysts argue that very low interest rates justify higher equity valuations because of the lower discount they place on future earnings. Low bond yields also support the relative appeal of equities. The trends of these intermarket relationships are why GoNoGo Charts subscribers receive Launch Conditions every weekend. Open your chart pack for the week ending February 12th to compare the performance of asset classes and major indices from around the globe.


